
Effects of Starvation on the Physiology and Liver Transcriptome of Yellowcheek (Elopichthys bambusa)
 , , and
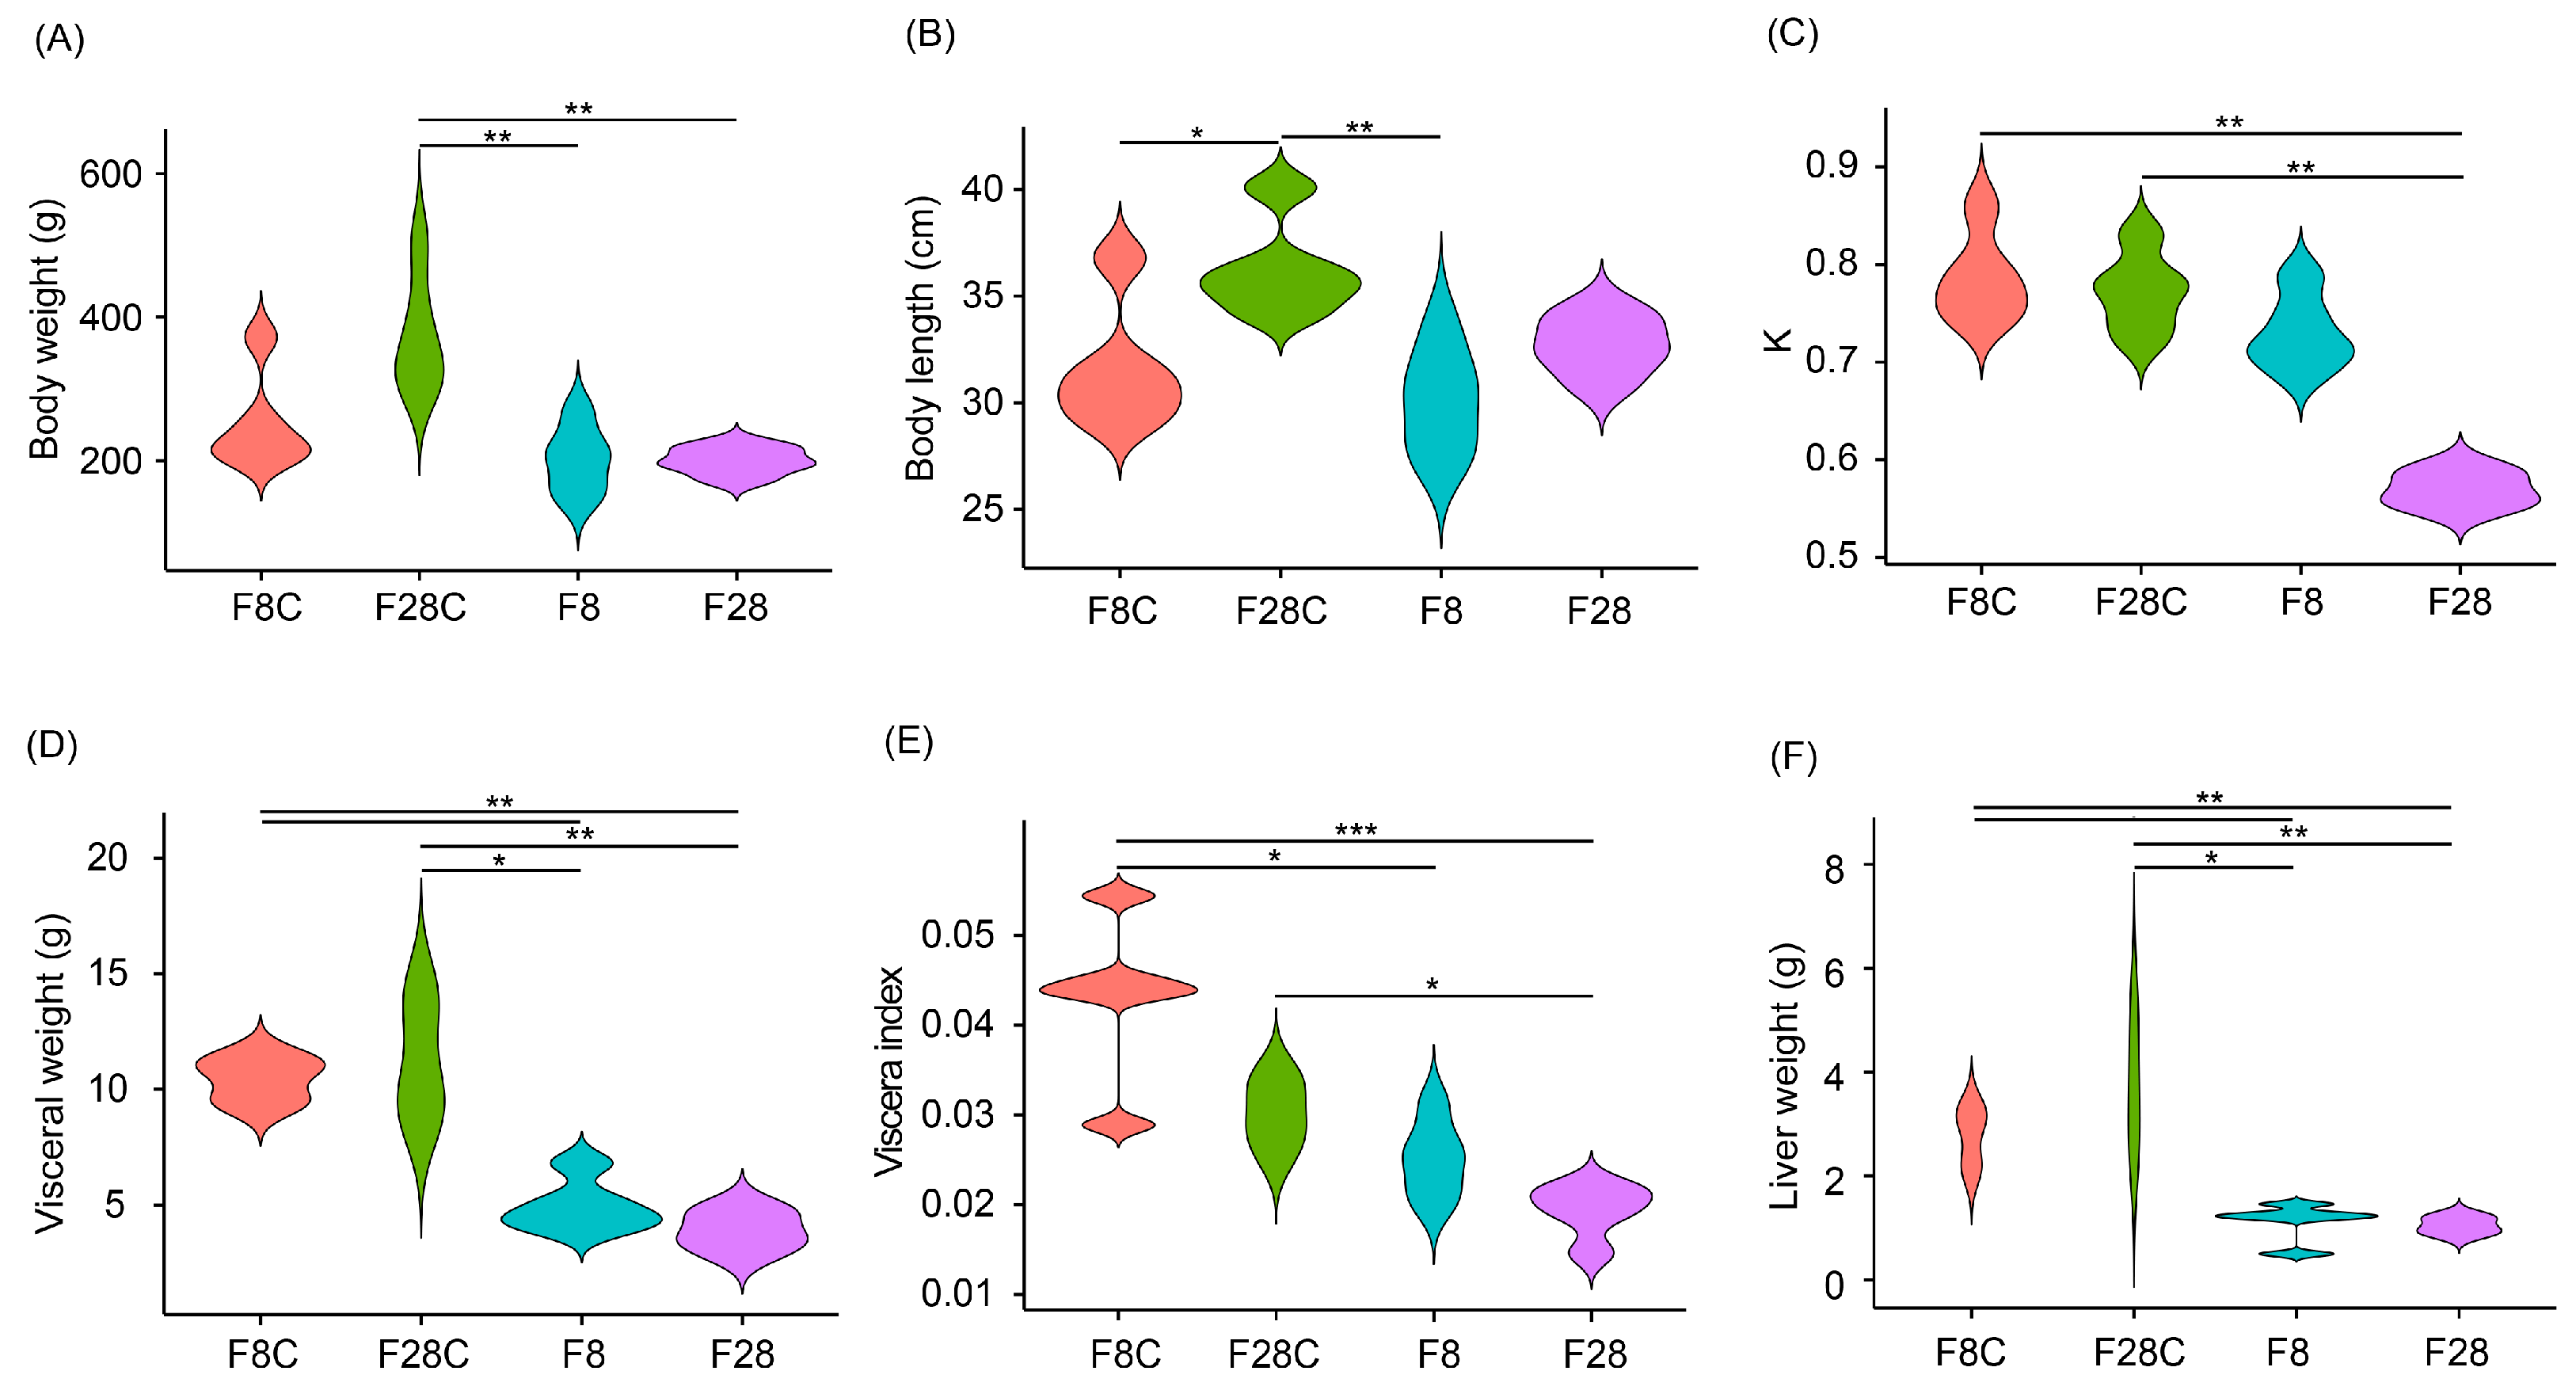
Abstract
:1. Introduction
2. Materials and Methods
2.1. Fish and Experimental Design
2.2. Sample Collection and Preservation
2.3. Determination of Serum Indicators
2.4. RNA Extraction and Transcriptome Sequencing
2.5. Data Analysis
3. Results
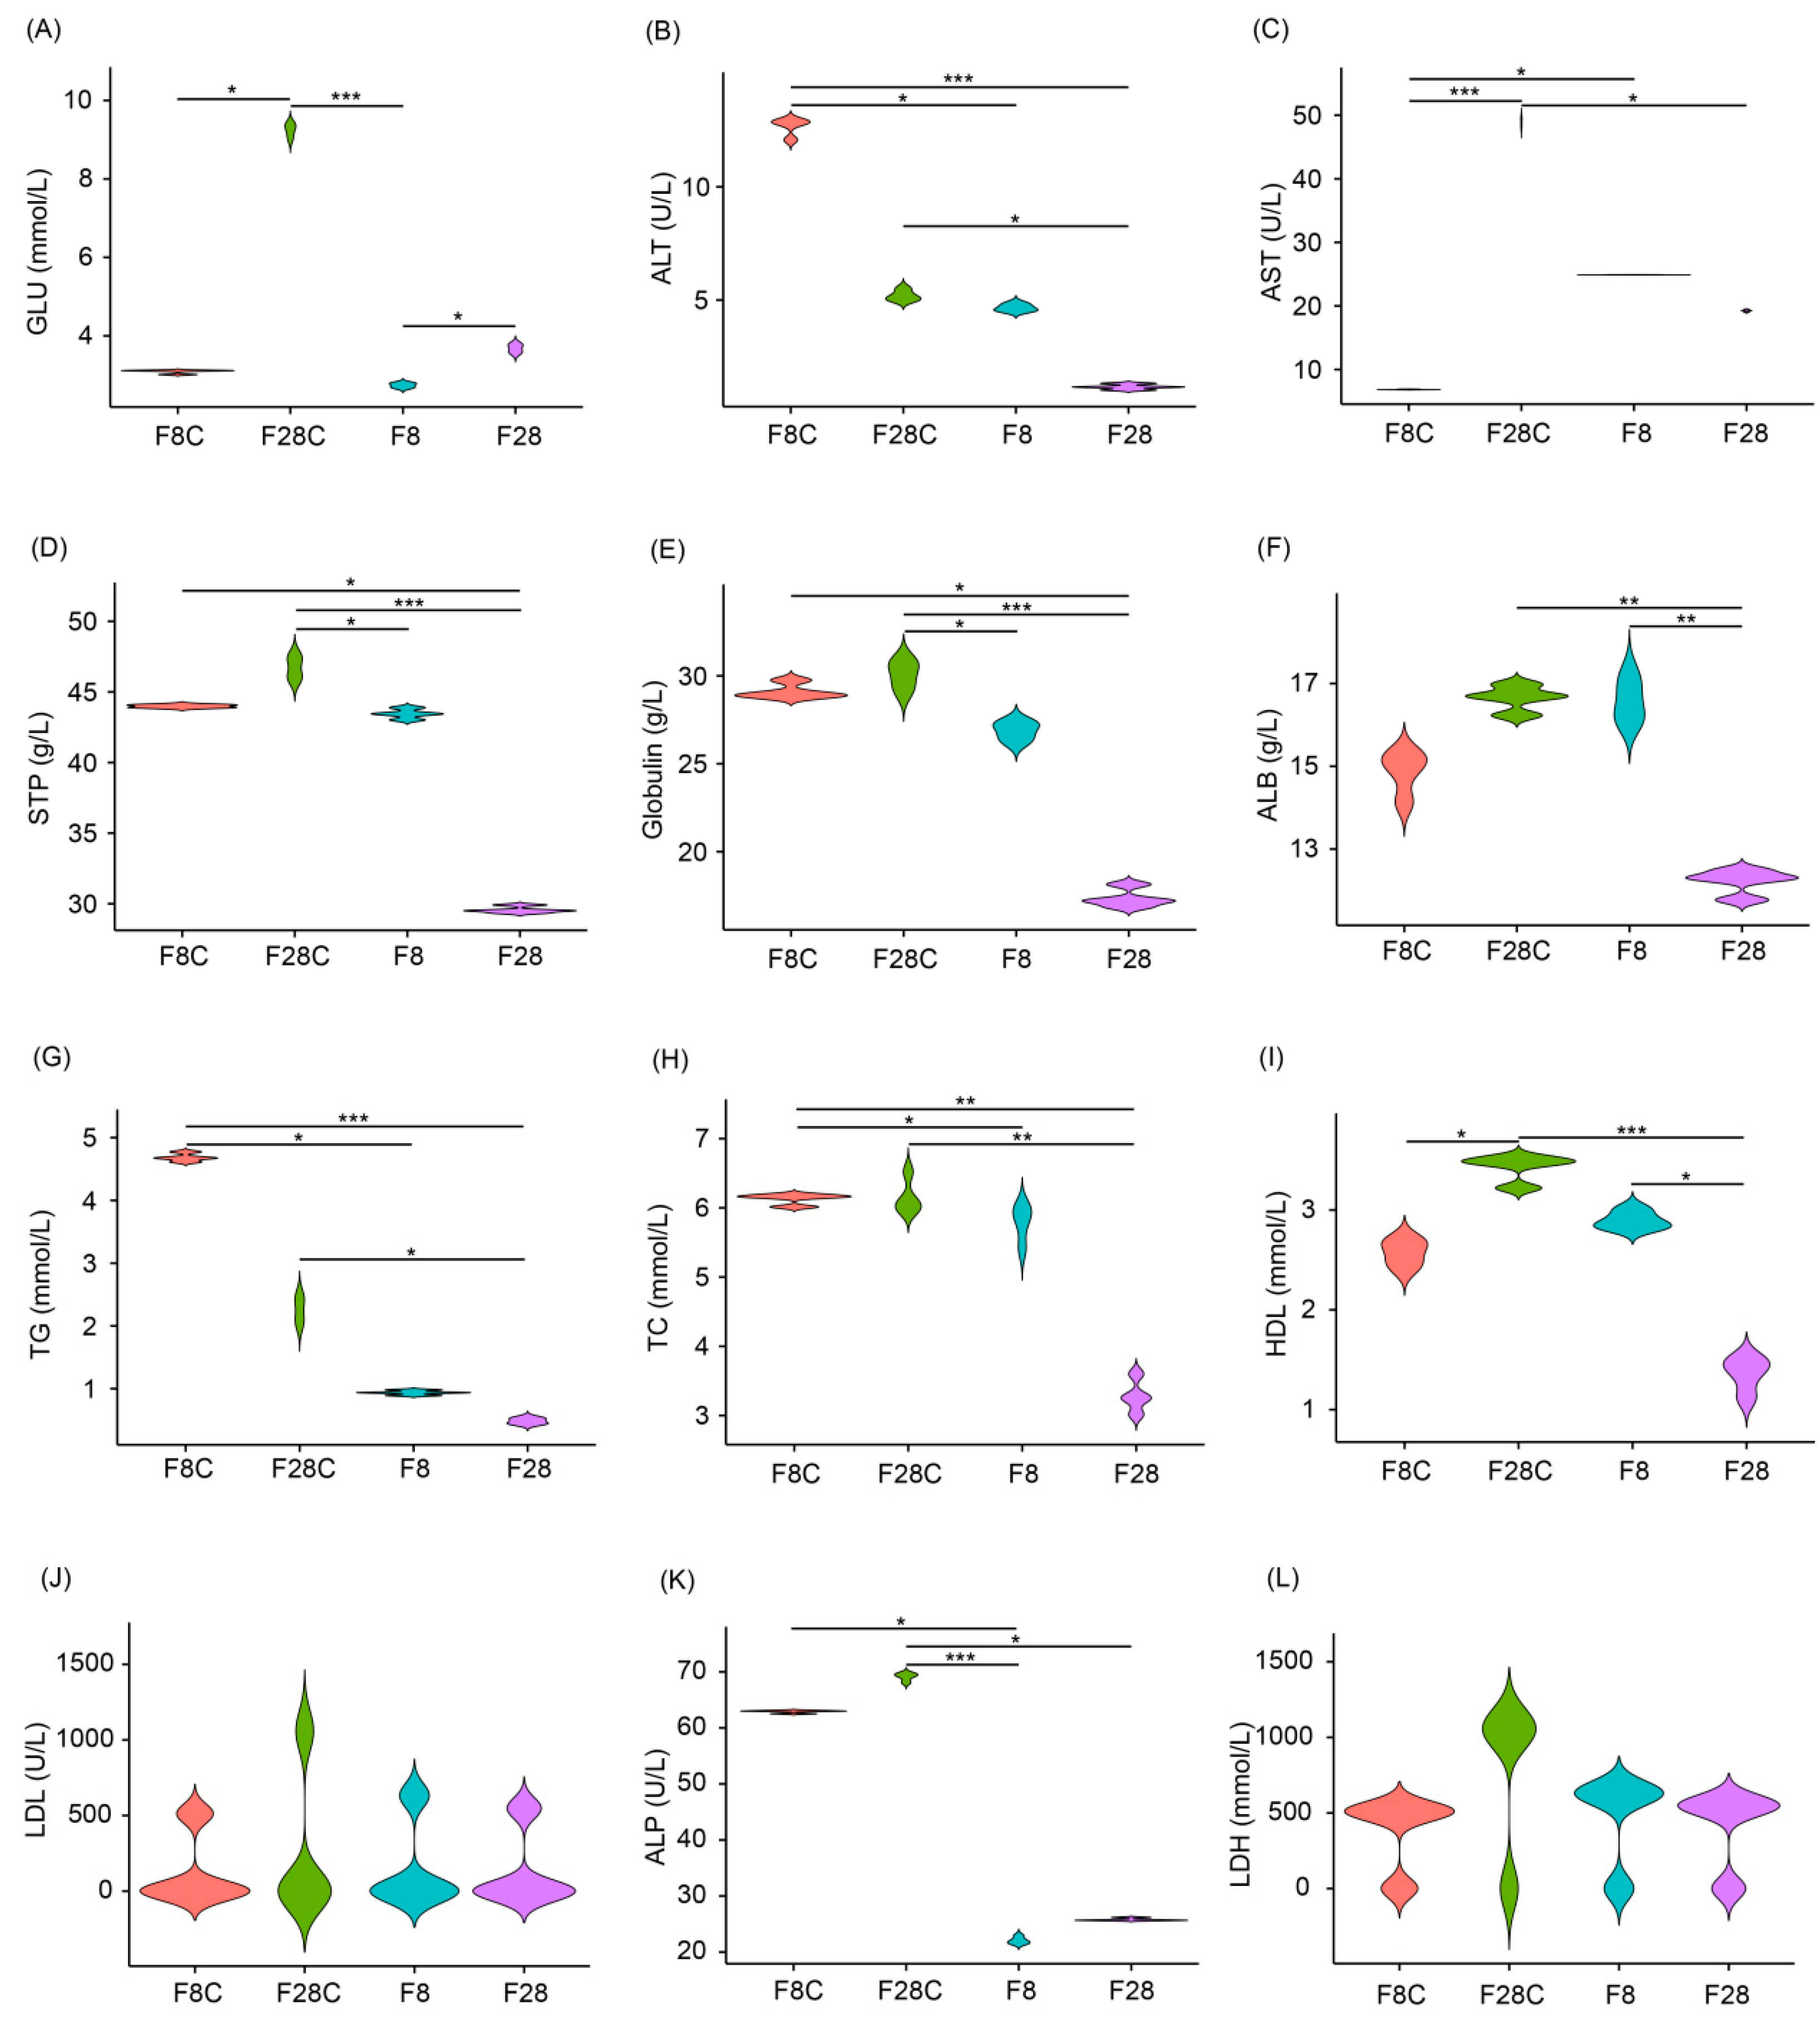
3.1. Effects of Starvation on Growth and Serum Indices of Yellowcheek
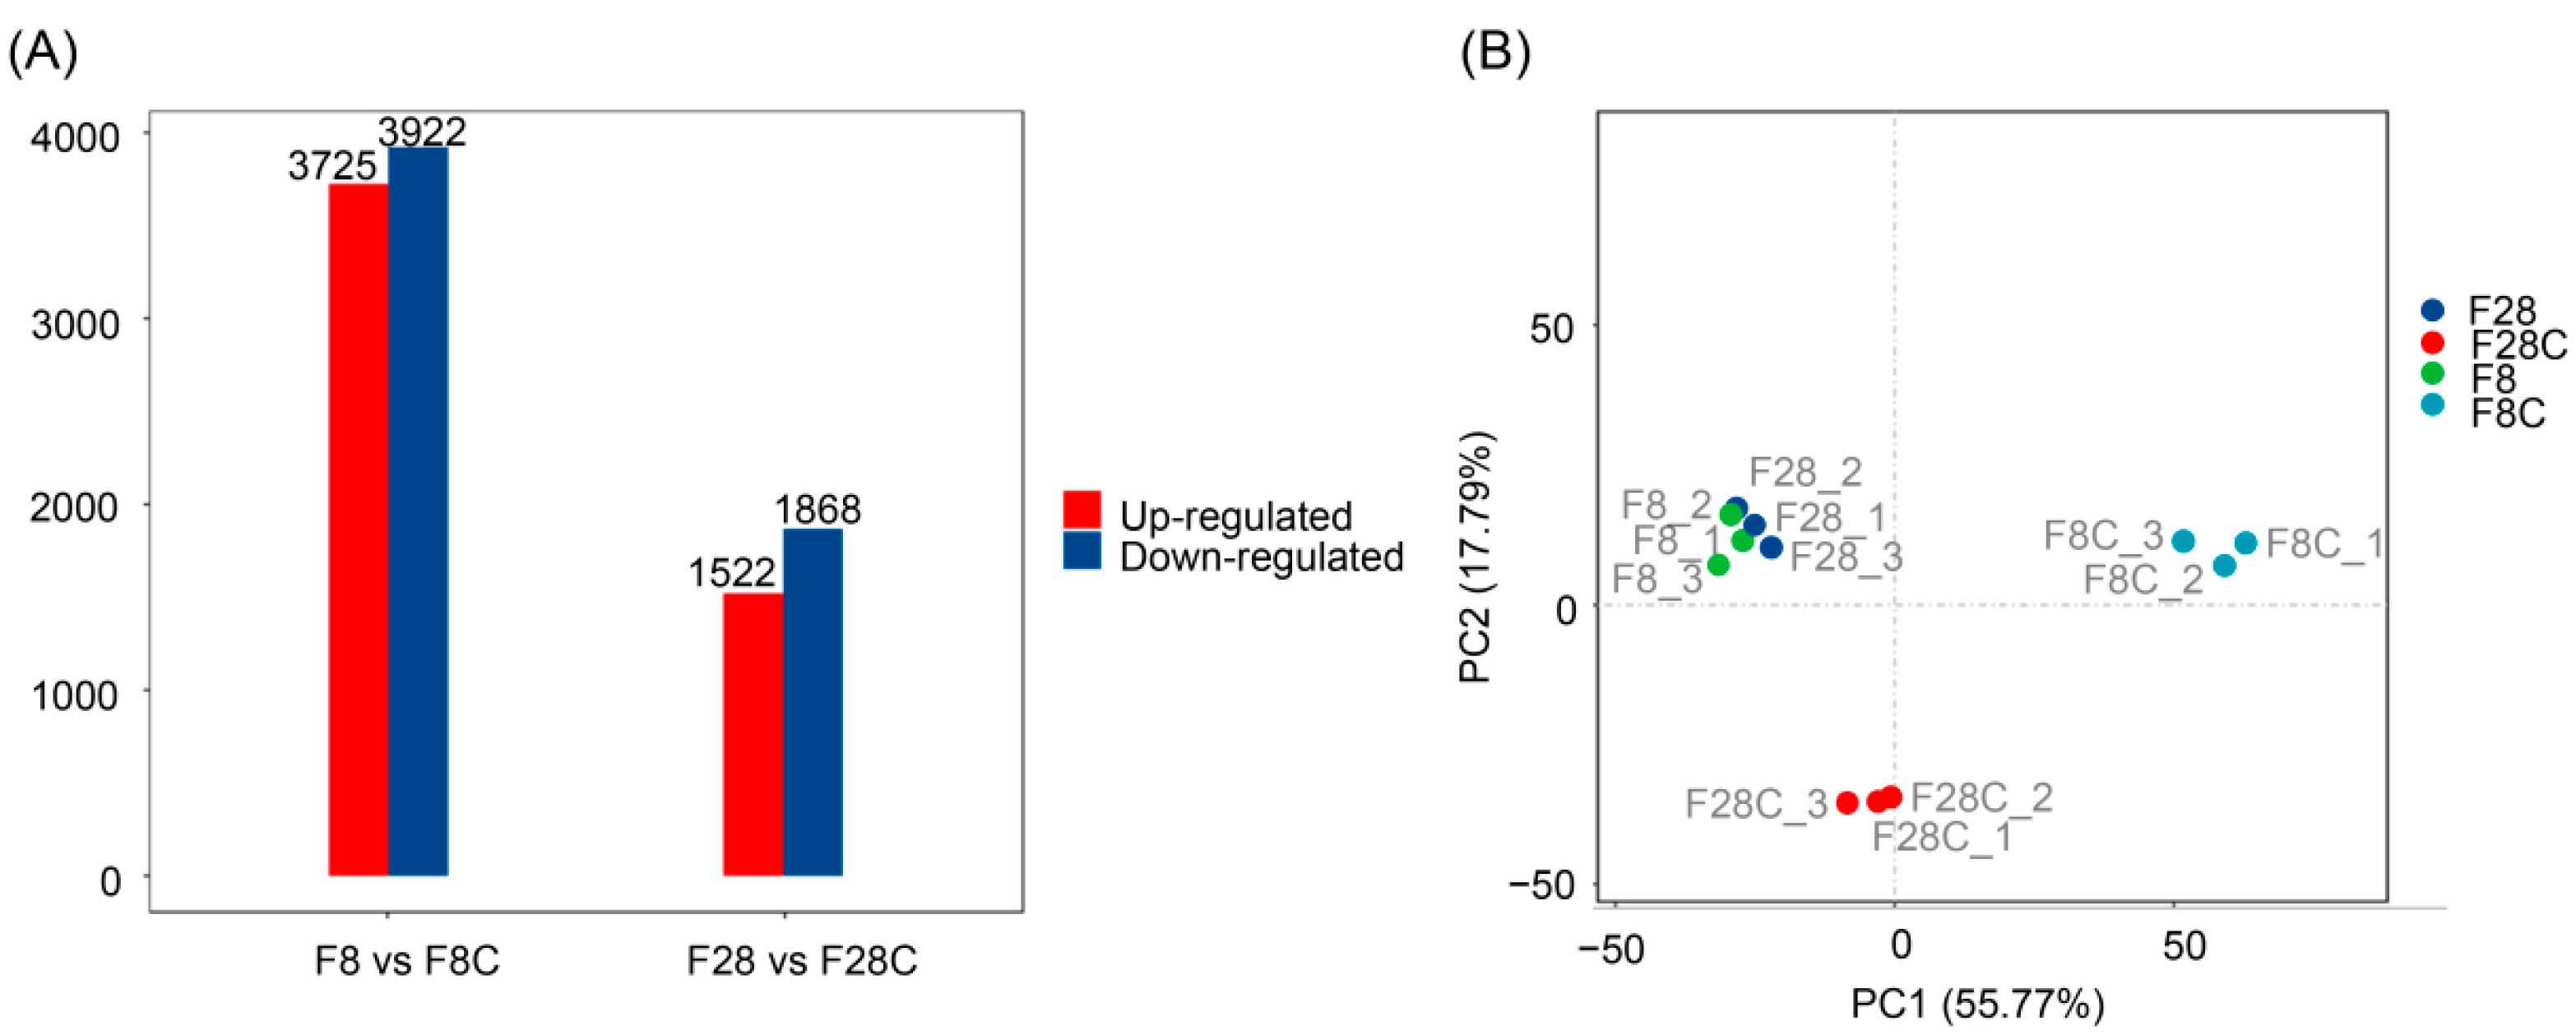
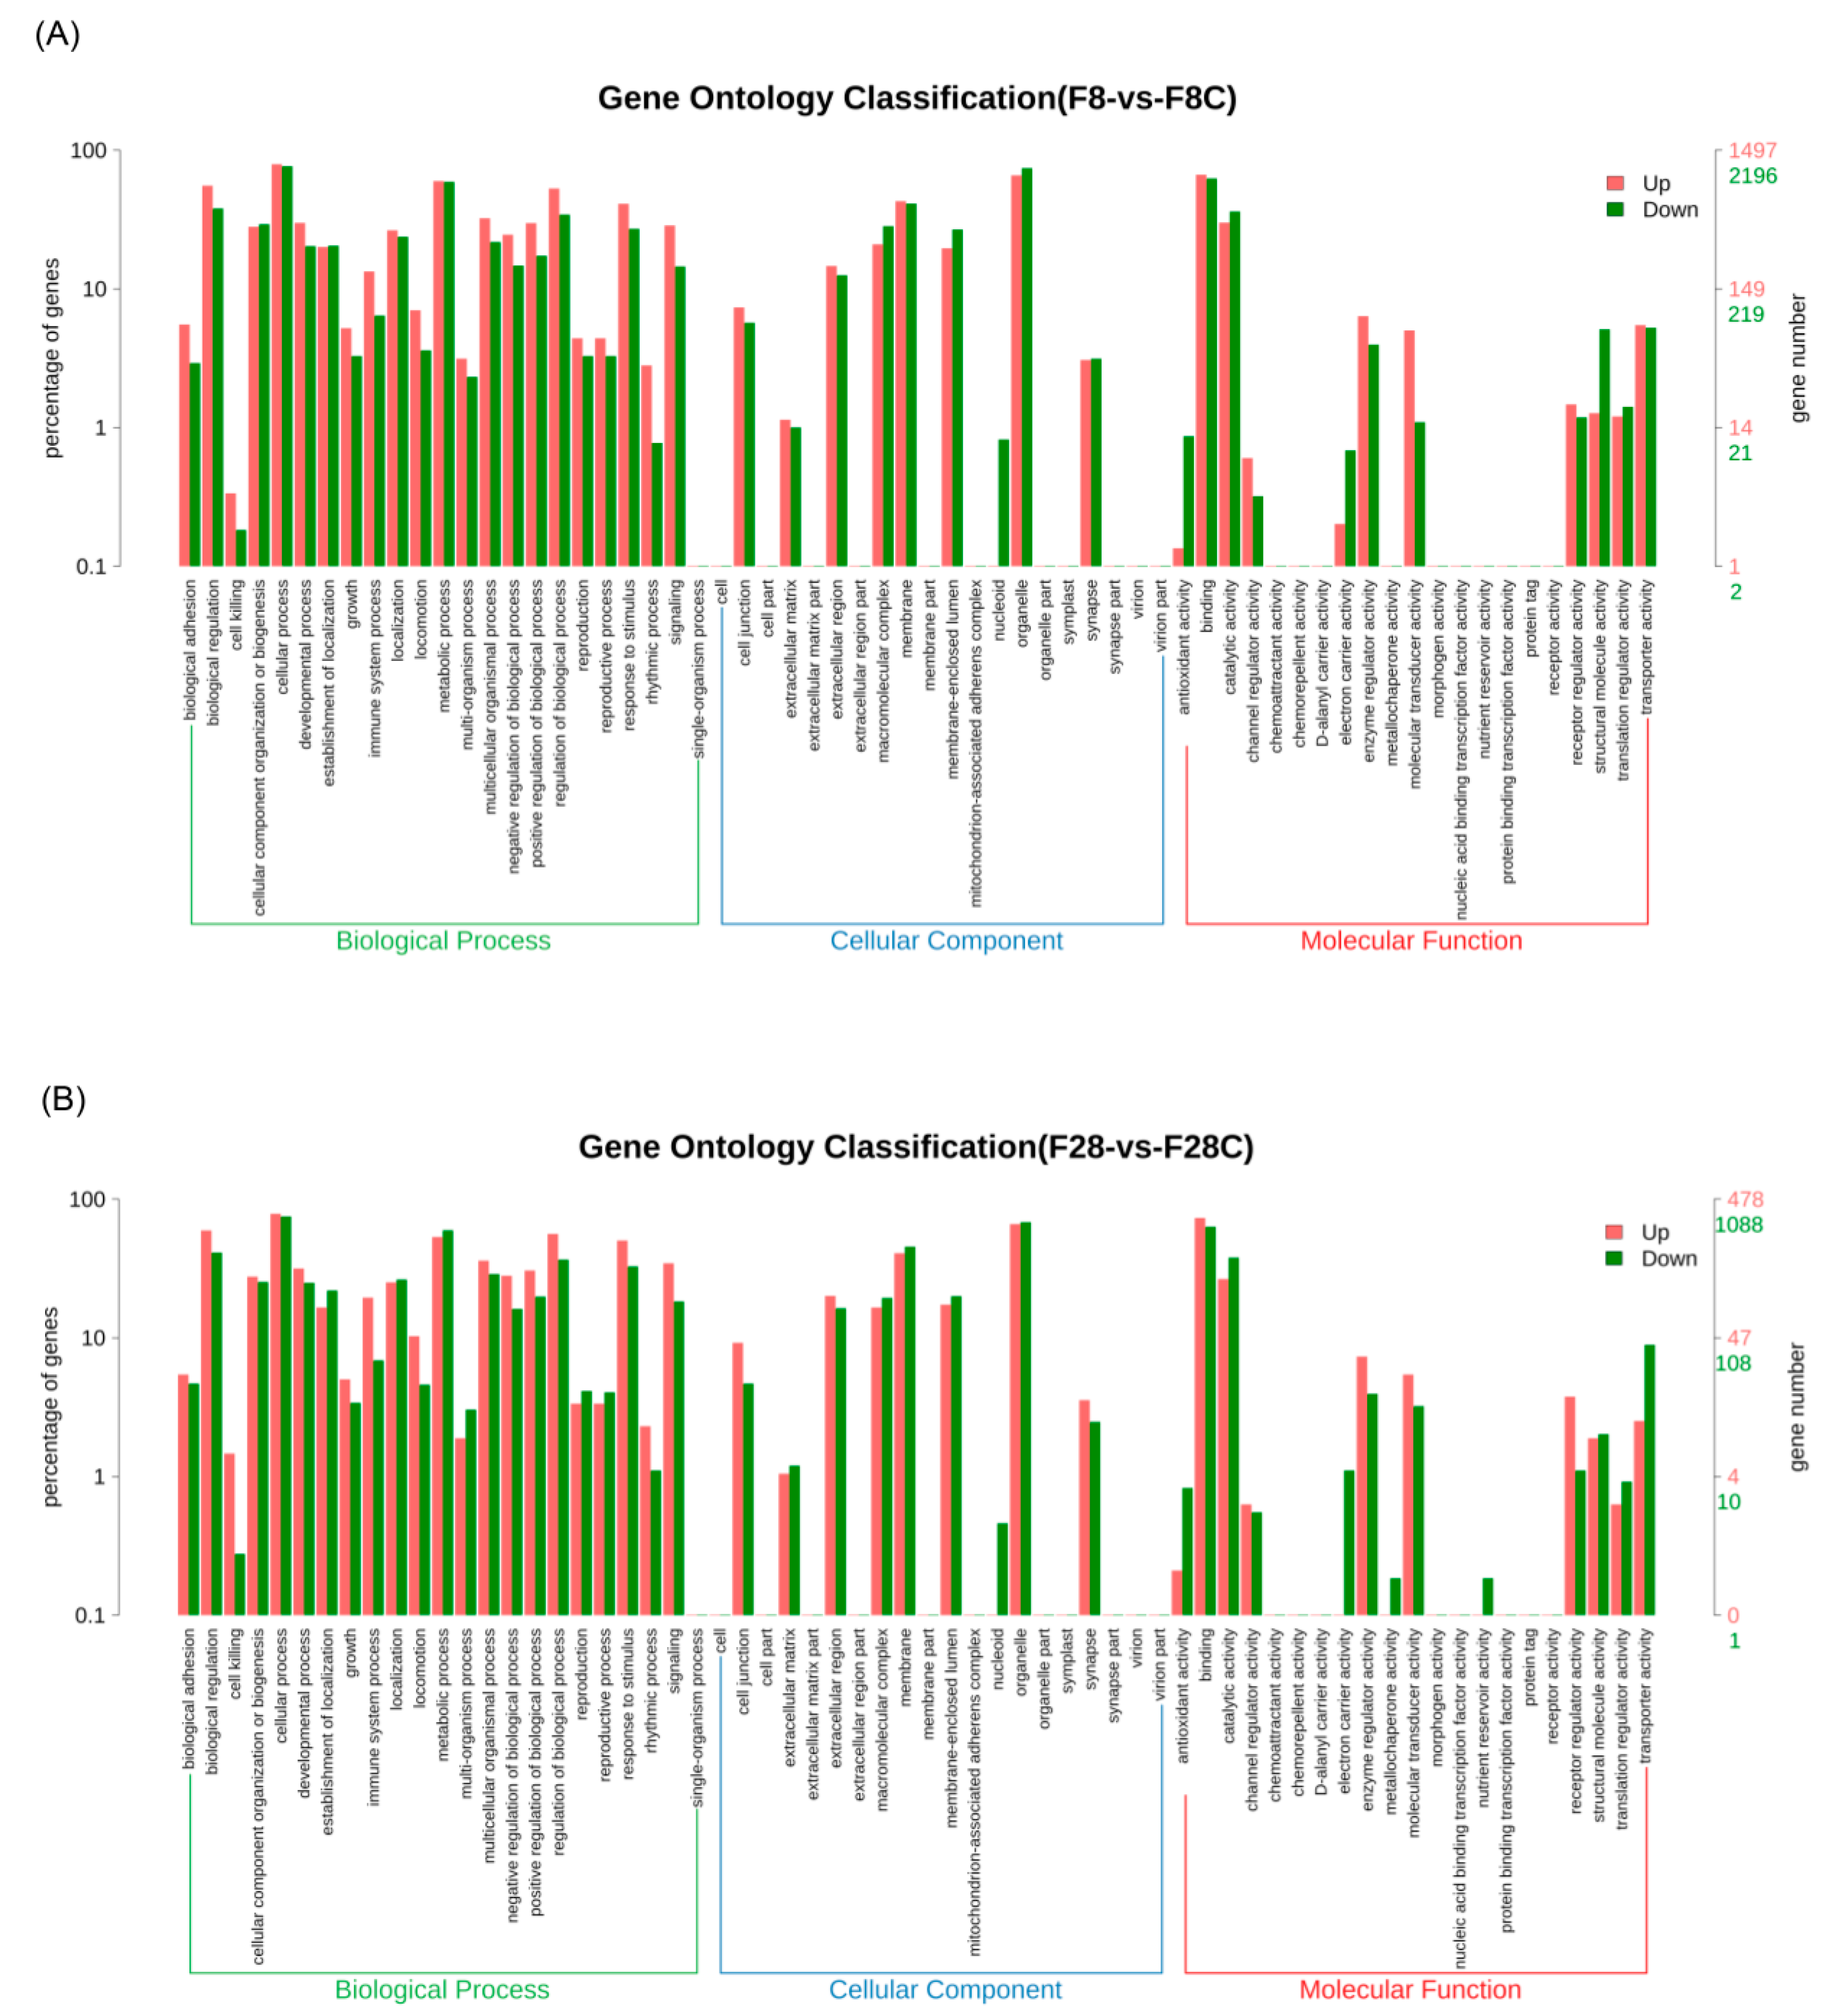
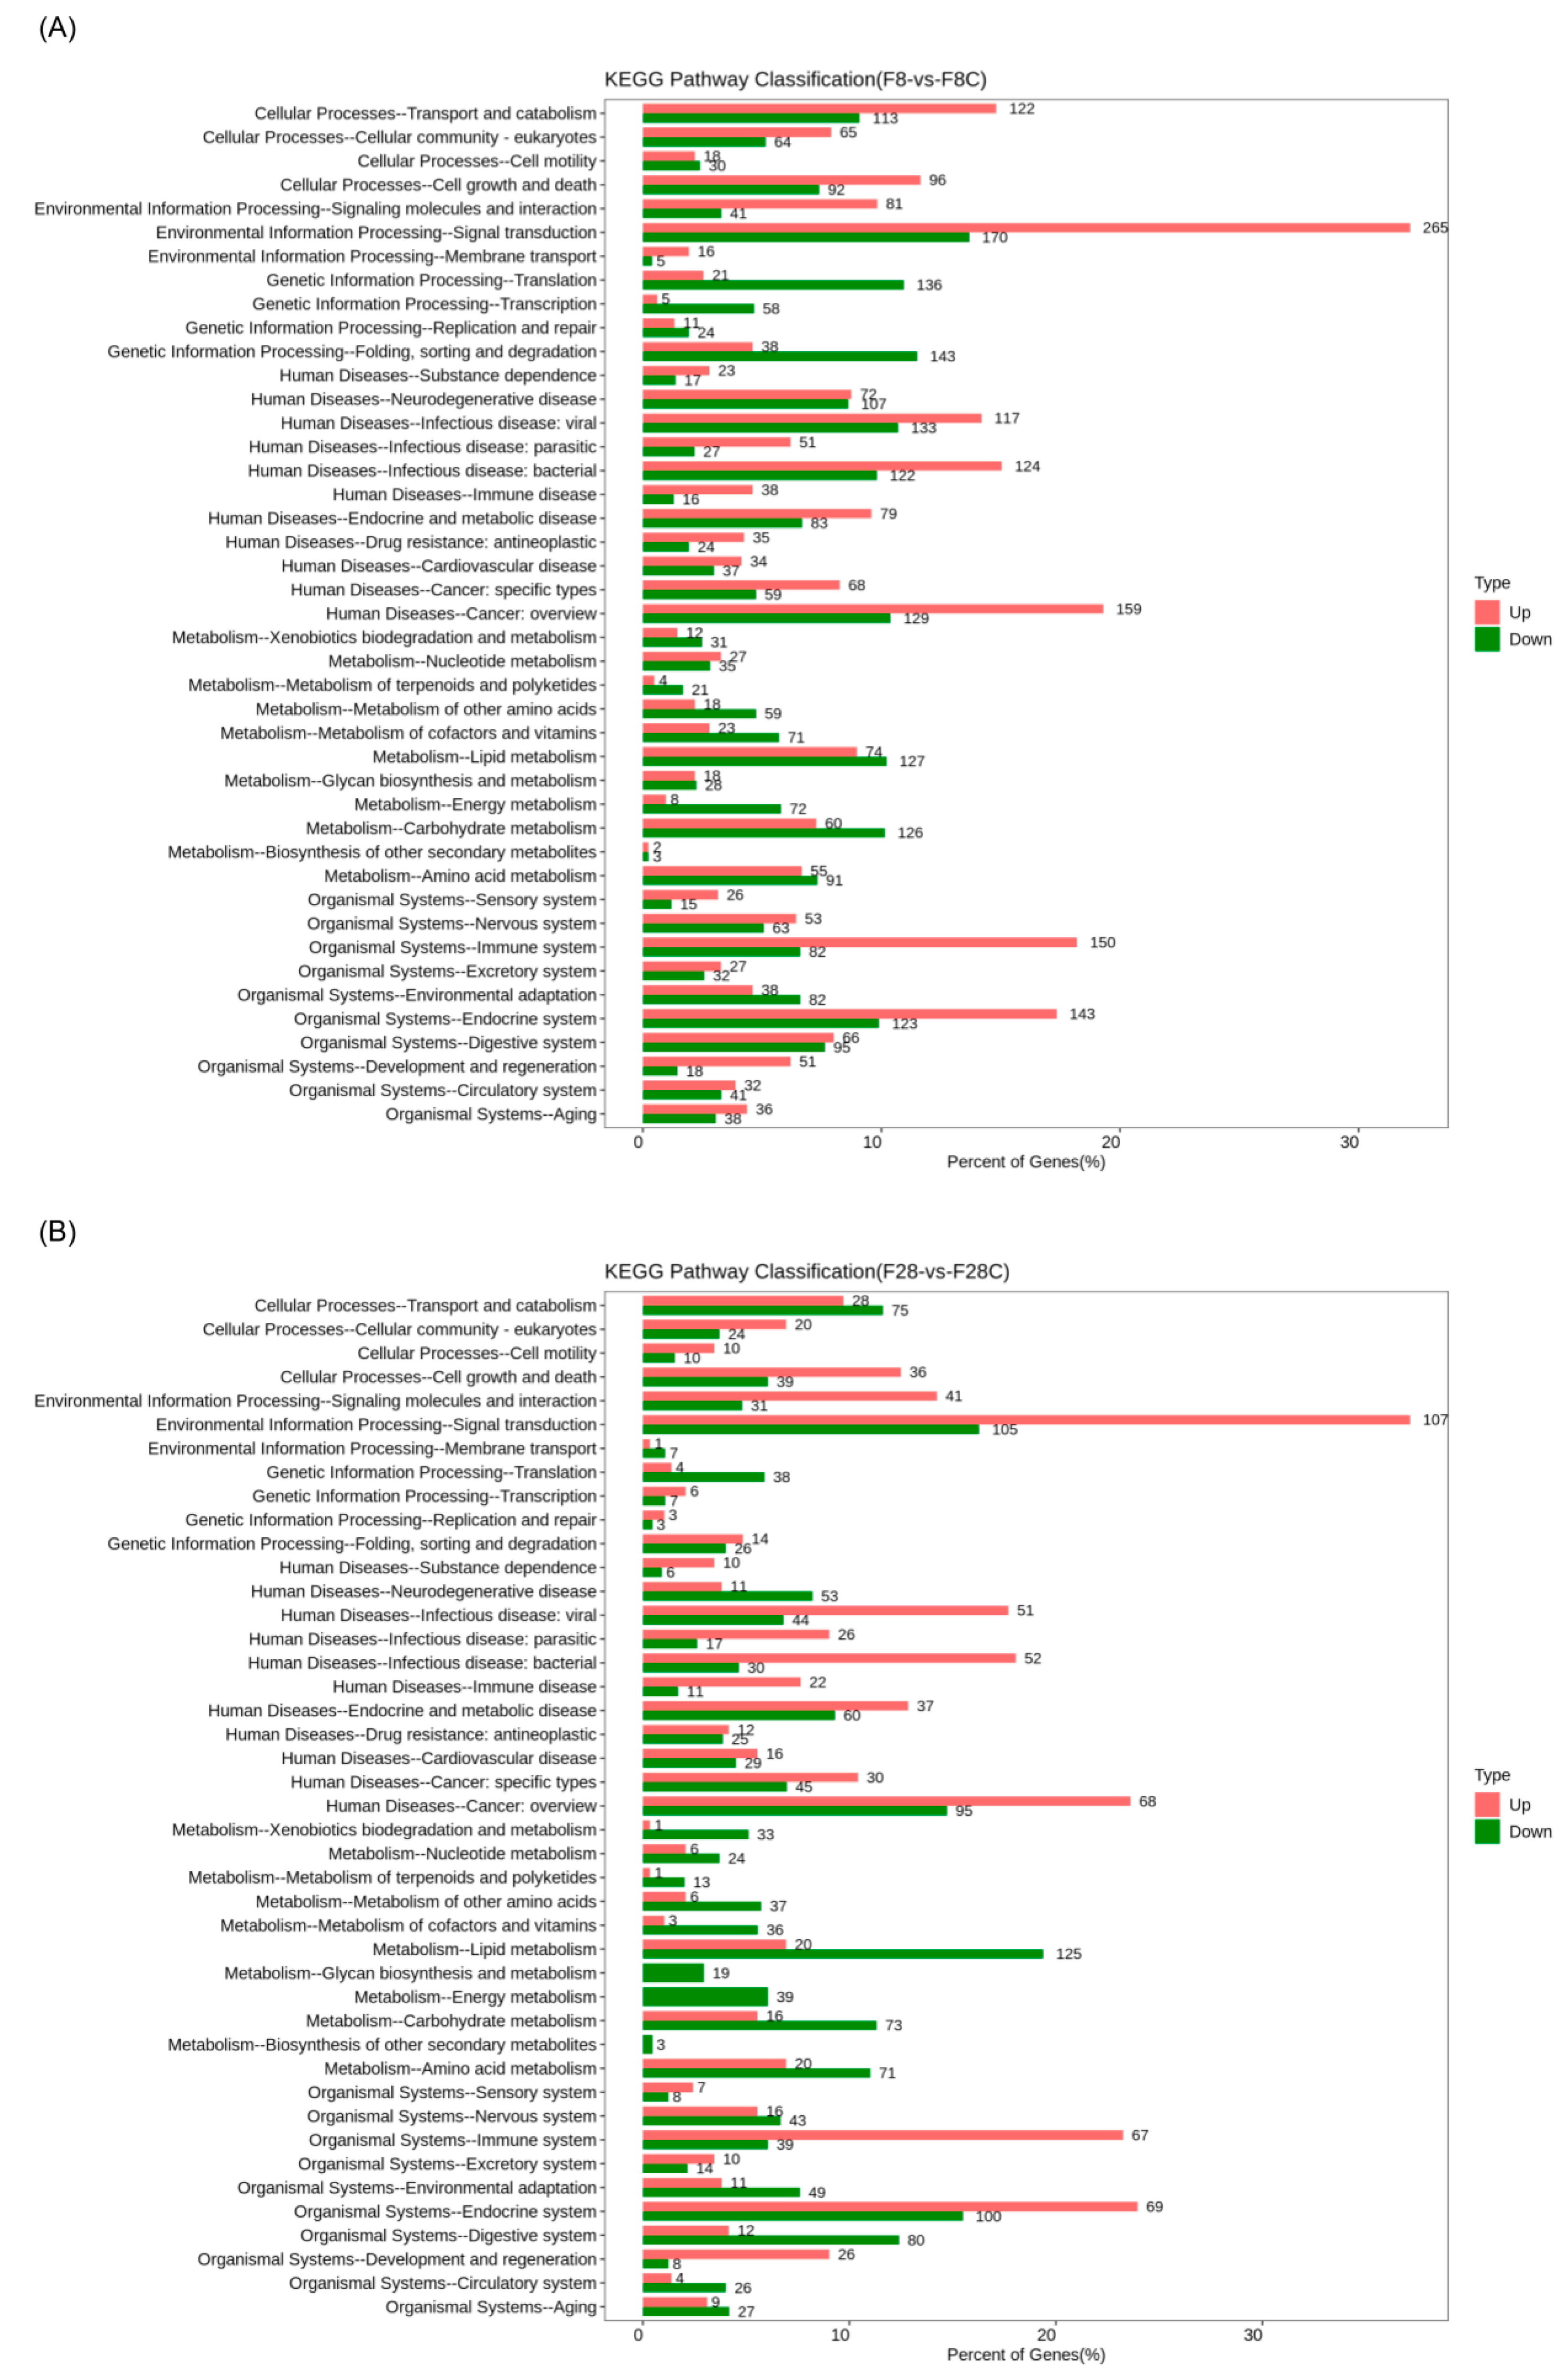
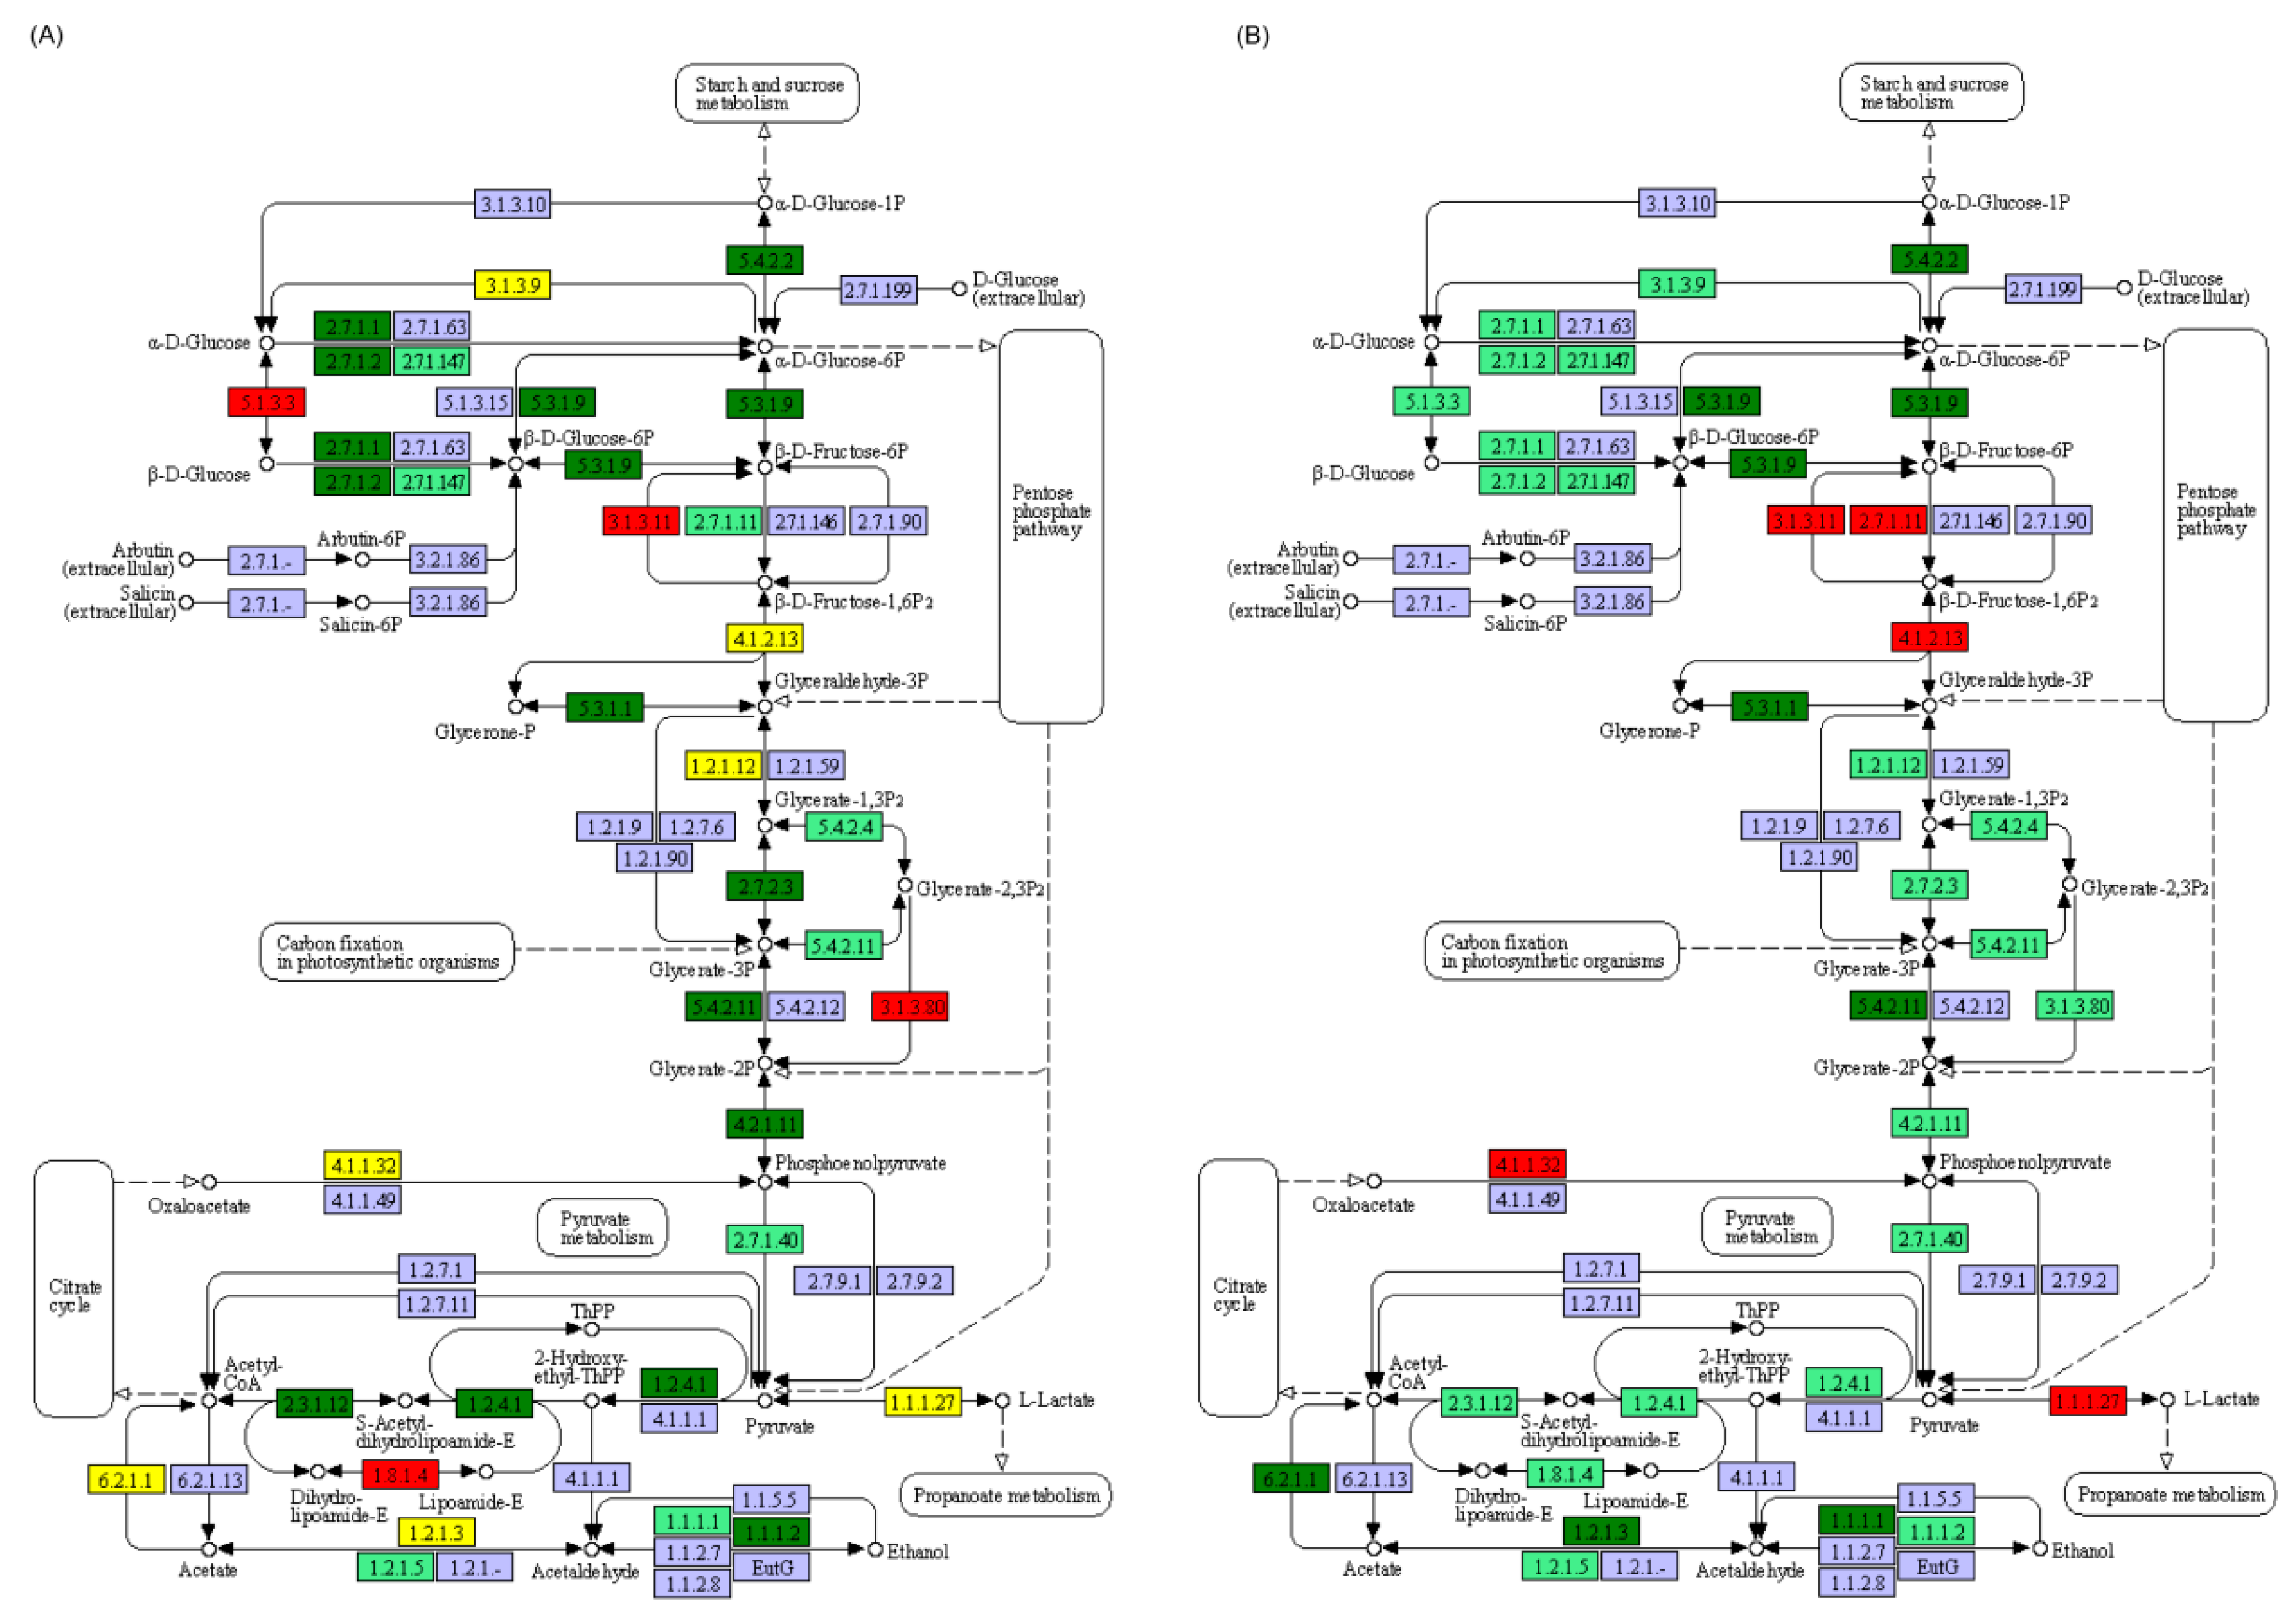
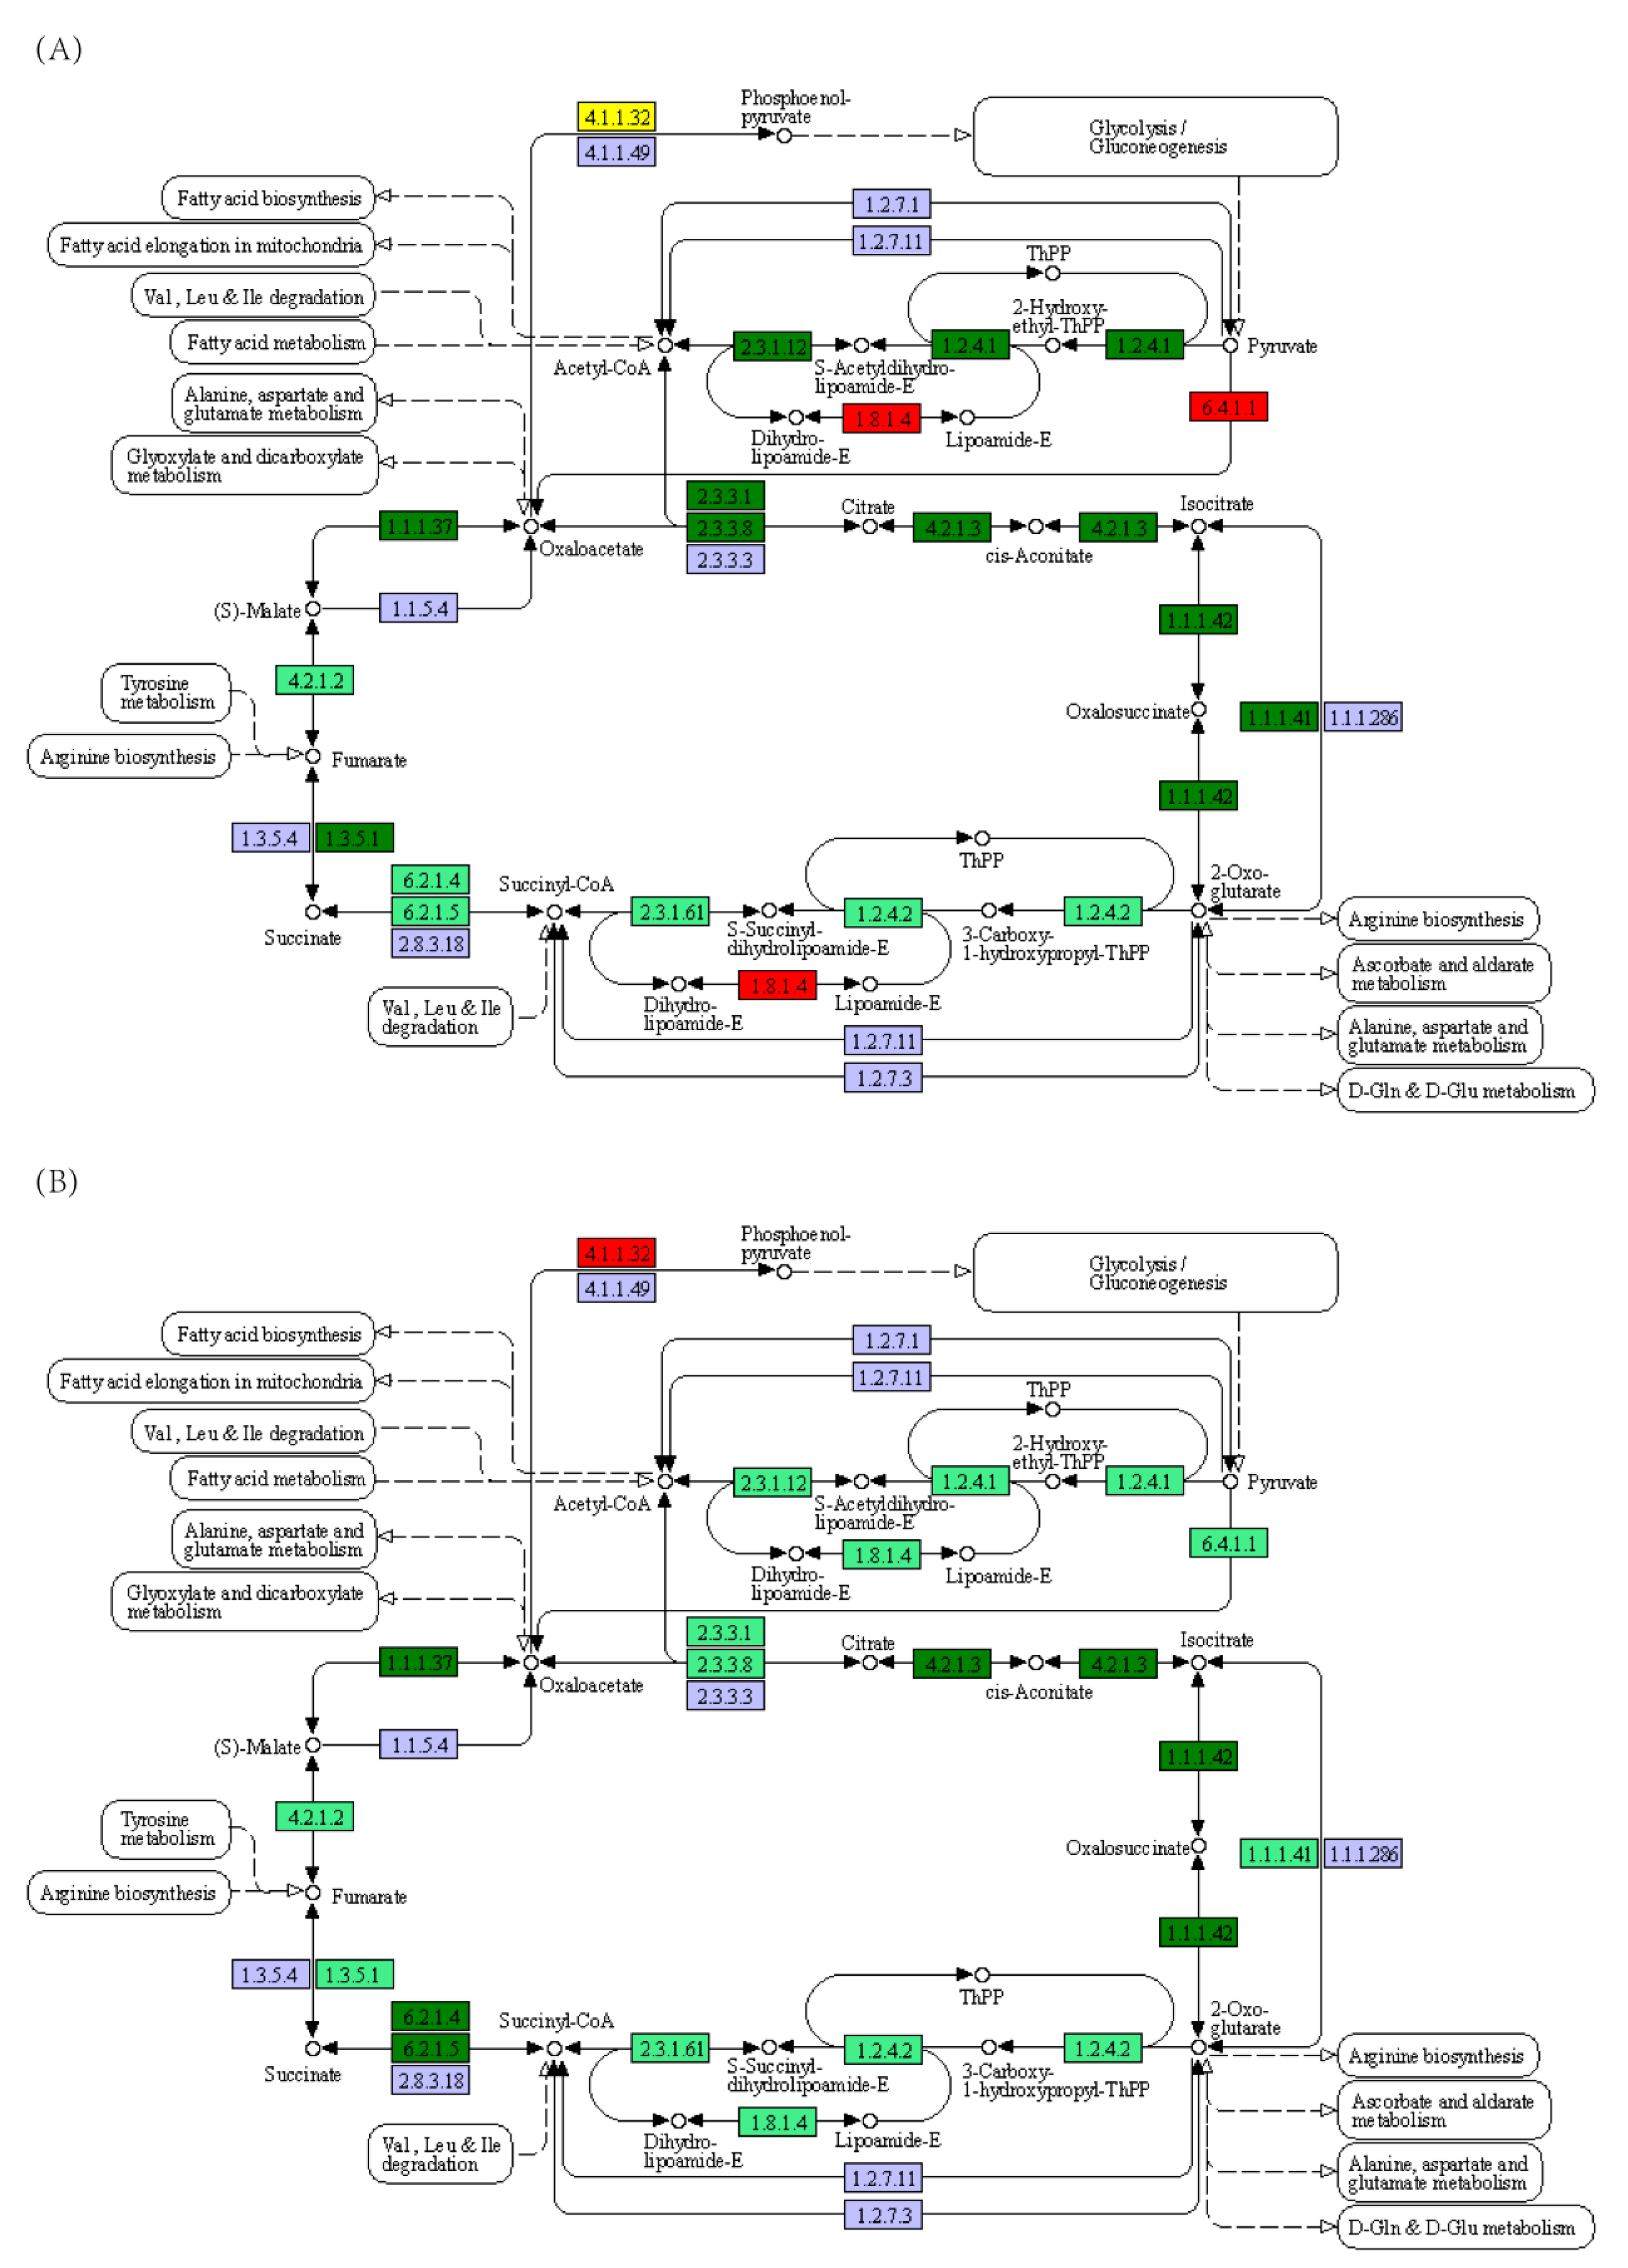
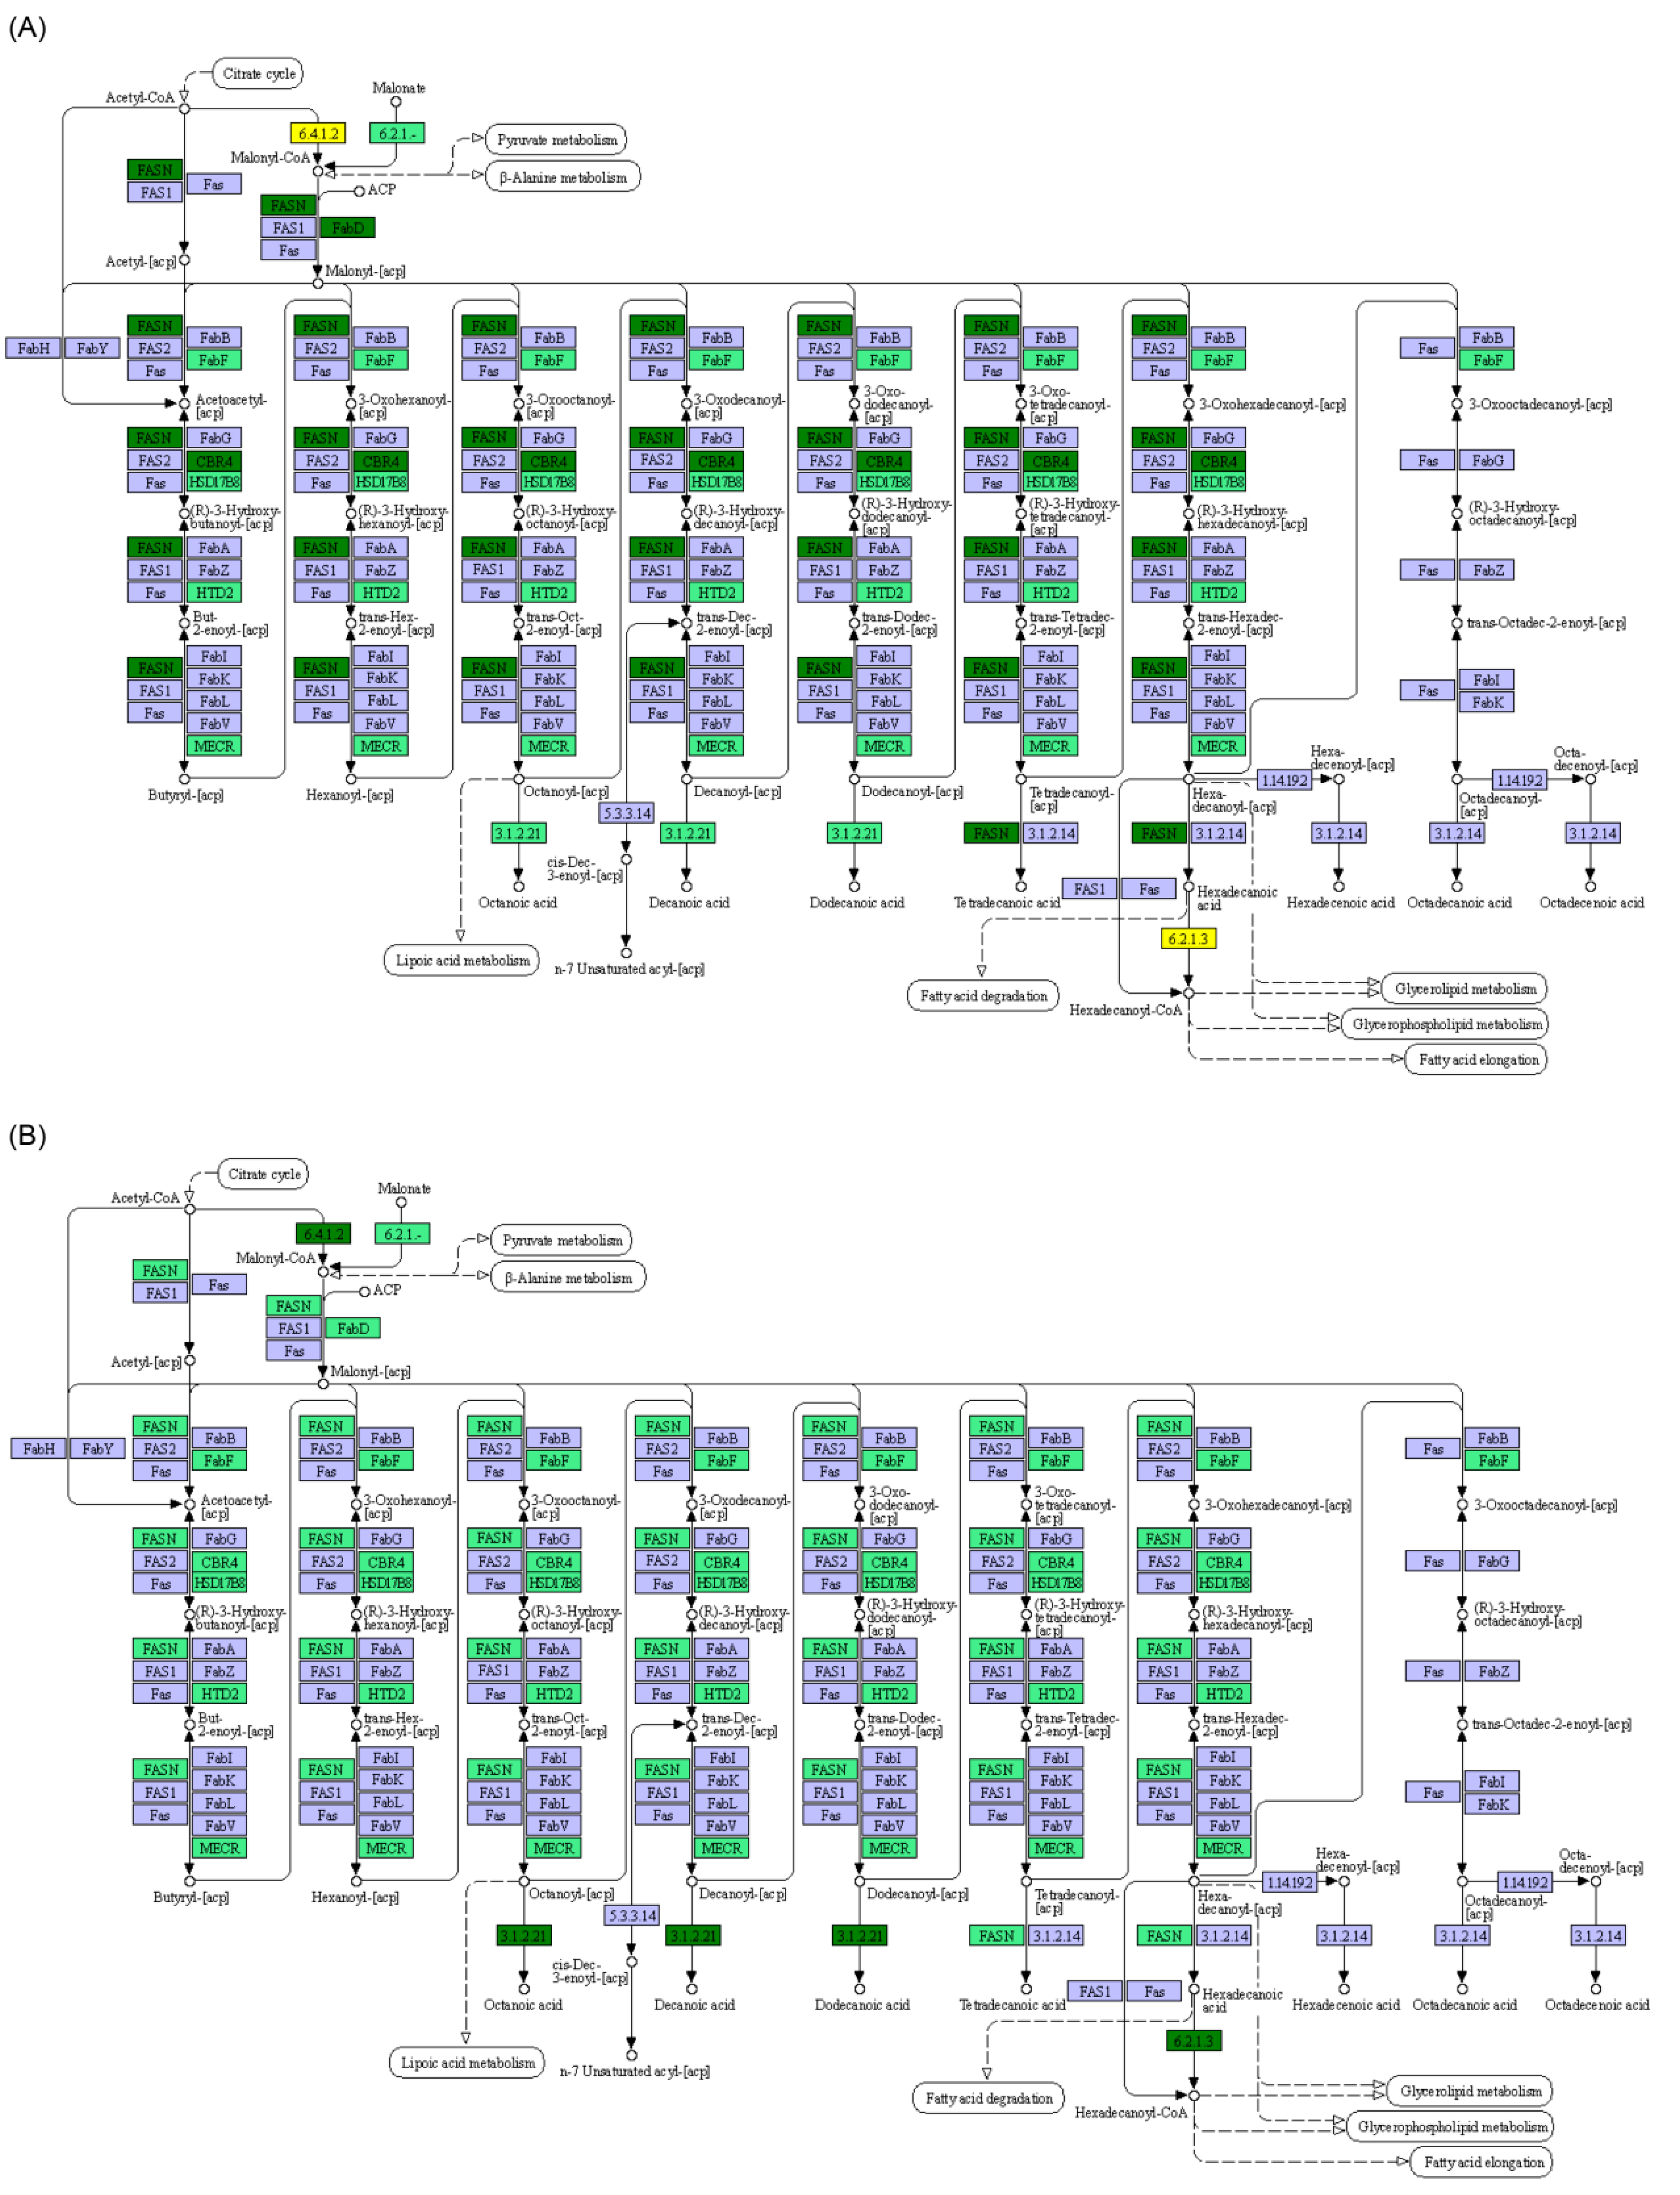
3.2. Effect of Starvation on Liver Transcriptome of Yellowcheek
4. Discussion
5. Conclusions
Supplementary Materials
Author Contributions
Funding
Institutional Review Board Statement
Informed Consent Statement
Data Availability Statement
Acknowledgments
Conflicts of Interest
References
- Furné, M.; Morales, A.E.; Trenzado, C.E.; García-Gallego, M.; Hidalgo, M.C.; Domezain, A.; Rus, A.S. The metabolic effects of prolonged starvation and refeeding in sturgeon and rainbow trout. J. Comp. Physiol. B 2012, 182, 63–76. [Google Scholar] [CrossRef] [PubMed]
- Wang, L.; Tang, J.Y.; Qin, Y.L.; Zeng, L.Q.; Peneg, J.L.; Fu, S.J. Effect of starvation on energy metabolism, fish behavior, and schooling behavior of Spinibarbus sinensis. Acta Ecol. Sin. 2019, 39, 1095–1104. [Google Scholar] [CrossRef]
- Antonopoulou, E.; Kentepozidou, E.; Feidantsis, K.; Roufidou, C.; Despoti, S.; Chatzifotis, S. Starvation and re-feeding affect Hsp expression, MAPK activation and antioxidant enzymes activity of European sea bass (Dicentrarchus labrax). Comp. Biochem. Physiol. A 2013, 165, 779–788. [Google Scholar] [CrossRef] [PubMed]
- Machado, C.R.; Garofalo, M.A.R.; Roselino, J.E.S.; Kettelhut, I.C.; Migliorini, R.H. Effects of starvation, refeeding, and insulin on energy-linked metabolic processes in catfish (Rhamdia hilarii) adapted to a carbohydrate-rich diet. Gen. Comp. Endocr. 1988, 71, 429–437. [Google Scholar] [CrossRef]
- Raina, S.; Sachar, A. Effect of starvation on immune organs of fish Labeo boga. Glob. J. Biol. Agric. Health Sci. 2014, 3, 11–15. [Google Scholar]
- Salem, M.; Silverstein, J.; Rexroad, C.E.; Yao, J. Effect of starvation on global gene expression and proteolysis in rainbow trout (Oncorhynchus mykiss). BMC Genom. 2007, 8, 328–343. [Google Scholar] [CrossRef] [Green Version]
- Navarro, I.; Gutiérrez, J. Fasting and Starvation. In Biochemistry and Molecular Biology of Fishes, Metabolic Biochemistry; Hochachka, P.W., Mommsen, T.P., Eds.; Elsevier: Amsterdam, The Netherlands, 1995; Volume 4, pp. 393–434. [Google Scholar] [CrossRef]
- Metón, I.; Fernández, F.; Baanante, I.V. Short- and long-term effects of refeeding on key enzyme activities in glicólisis-gluconeogenesis in the liver of gilthead seabream (Sparus aurata). Aquaculture 2003, 225, 99–107. [Google Scholar] [CrossRef]
- Gillis, T.E.; Ballantyne, J.S. The effects of starvation on plasma free amino acid and glucose concentrations in lake sturgeon (Acipenser fulvescens). J. Fish Biol. 1996, 49, 1306–1316. [Google Scholar] [CrossRef]
- Pietsch, T.W.; Amaoka, K.; Stevenson, D.E.; MacDonald, E.L.; Urbain, B.K.; López, J.A. Freshwater Fishes of the Kuril Islands and Adjacent Regions; International Kuril Island Project (IKIP); University of Washington Fish Collection: Seattle, WA, USA, 2000; p. 18. [Google Scholar]
- Xiao, W.H.; Zhang, Y.P.; Liu, H.Z. Molecular systematics of Xenocyprinate (Teleostei: Cyprinidate): Taxonomy, biogeography, and conevolution of a special group restricted in East Asia. Mol. Phylogenet. Evol. 2001, 18, 163–173. [Google Scholar] [CrossRef] [Green Version]
- Li, Y.; Abbas, K.; Ma, X.; Wang, W. Isolation and characterization of polymorphic microsatellite loci from Yellowcheek (Elopichthys bambusa). Conserv. Genet. 2009, 10, 1811–1813. [Google Scholar] [CrossRef]
- Wang, D.; Tian, J. Studies on the growth of Elopichthys bambusa and its utilization in fisheries in Weishui Reservoir. Acta Ecol. Sin. 1990, 10, 349–354, (In Chinese with English Abstract). [Google Scholar]
- Li, Y.; Li, X.; Yang, J.; Li, J.; Shuai, F. Status of Elopichthys bambusa recruitment stock after the impoundment of Changzhou Hydro-junction in Pearl River. J. Lake Sci. 2015, 27, 917–924. [Google Scholar] [CrossRef]
- Liao, F.; Zeng, G.; Yuan, X.; Li, S.; Wang, C.; Liang, Z. Complete mitochondrial genome of Elopichthys bambusa (Cypriniformes, Cyprinidae). Mitochondrial DNA 2016, 27, 1387–1388. [Google Scholar] [CrossRef] [PubMed]
- Abbas, K.; Zhou, X.; Wang, W. Mitochondrial diversity and phylogenetic structure of Yellowcheek (Elopichthys bambusa) in the Yangtze River. J. Appl. Ichthyol. 2022, 38, 596–603. [Google Scholar] [CrossRef]
- Chen, X.; Zhu, Q.; Yang, Z.; Sun, H.; Zhao, N.; Ni, J. Filtering effect of Rhinogobio cylindricus gut microbiota relieved influence of the Three Gorges Dam on the gut microbiota composition. Water 2021, 13, 2697. [Google Scholar] [CrossRef]
- Bolger, A.M.; Lohse, M.; Usadel, B. Trimmomatic: A flexible trimmer for Illumina sequence data. Bioinformatics 2014, 30, 2114–2120. [Google Scholar] [CrossRef] [Green Version]
- Grabherr, M.G.; Haas, B.J.; Yassour, M.; Levin, J.Z.; Thompson, D.A.; Amit, I.; Adiconis, X.; Fan, L.; Raychowdhury, R.; Zeng, Q.D.; et al. Trinity: Reconstructing a full-length transcriptome without a genome from RNA-Seq data. Nat. Biotechnol. 2011, 29, 544–652. [Google Scholar] [CrossRef] [Green Version]
- Altschul, S.F.; Gish, W.; Miller, W.; Myers, E.W.; Lipman, D.J. Basic local alignment search tool. J. Mol. Biol. 1990, 215, 403–410. [Google Scholar] [CrossRef]
- Kanehisa, M.; Araki, M.; Goto, S.; Hattori, M.; Hirakawa, M.; Itoh, M.; Katayama, T.; Kawahama, S.; Okuda, S.; Tokimatsu, T.; et al. KEGG for linking genomes to life and the environment. Nucleic Acids Res. 2008, 36, D480–D484. [Google Scholar] [CrossRef]
- Trapnell, C.; Williams, B.A.; Pertea, G.; Mortazavi, A.; Kwan, G.; Baren, M.J.V.; Salzbery, S.L.; Wold, B.J.; Pachter, L. Transcript assembly and quantification by RNA-Seq reveals unannotated transcripts and isoform switching during cell differentiation. Nat. Biotechnol. 2010, 28, 511–515. [Google Scholar] [CrossRef] [Green Version]
- Langmead, B.; Salzberg, S.L. Fast gapped-read alignment with Bowtie 2. Nat. Methods 2012, 9, 357–359. [Google Scholar] [CrossRef] [PubMed] [Green Version]
- Roberts, A.; Pachter, L. Streaming fragment assignment for real-time analysis of sequencing experiment. Nat. Methods 2013, 10, 71–73. [Google Scholar] [CrossRef] [PubMed] [Green Version]
- Anders, S.; Huber, W. Differential Expression of RNA-Seq Data at the Gene Level—The DESeq Package; European Molecular Biology Laboratory (EMBL): Heidelberg, Germany, 2013. [Google Scholar]
- Dai, Q.; Dai, J.; Li, C.; Liu, Z.; Wang, Y. Discussion on relative fatness. Chin. J. Appl. Environ. Biol. 2006, 12, 715–718. [Google Scholar]
- Xia, J.H.; Lin, G.; Fu, G.H.; Wan, Z.Y.; Lee, M.; Wang, L.; Liu, X.J.; Yue, G.H. The intestinal microbiome of fish under starvation. BMC Genom. 2014, 15, 266. [Google Scholar] [CrossRef] [PubMed] [Green Version]
- Enders, E.C.; Boisclair, D. Effects of environmental fluctuations on fish metabolism: Atlantic salmon Salmo salar as a case study. J. Fish Biol. 2016, 88, 344–358. [Google Scholar] [CrossRef] [Green Version]
- Li, H.; Xu, W.; Jin, J.; Yang, Y.; Zhu, X.; Han, D.; Liu, H.; Xie, S. Effects of starvation on glucose and lipid metabolism in gibel carp (Carassius auratus gibelio var. CAS III). Aquaculture 2018, 496, 166–175. [Google Scholar] [CrossRef]
- Tripathi, G.; Verma, P. Starvation-induced impairment of metabolism in a freshwater catfish. Z. Naturforsch C J Biosci. 2003, 58, 446–451. [Google Scholar] [CrossRef]
- Shan, X.; Huang, W.; Cao, L.; Wu, Y. Advances in studies of the effects of starvation on growth and development of fish larvae. J. Ocean Univ. China 2008, 7, 319–326. [Google Scholar] [CrossRef]
- Tian, X.; Fang, J.; Dong, S. Effects of starvation and recovery on the growth, metabolism and energy budget of juvenile tongue sole (Cynoglossus semilaevis). Aquaculture 2010, 310, 122–129. [Google Scholar] [CrossRef]
- Caruso, G.; Denaro, M.G.; Caruso, R.; Mancari, F.; Genovese, L.; Maricchiolo, G. Response to short term starvation of growth, haematological, biochemical and non-specific immune parameters in European sea bass (Dicentrarchus labrax) and blackspot sea bream (Pagellus bogaraveo). Mar. Environ. Res. 2011, 72, 46–52. [Google Scholar] [CrossRef]
- Akbary, P.; Jahanbakhshi, A. Effect of starvation on growth, biochemical, hematological and non-specific immune parameters in two different size groups of grey mullet, Mugil cephalus (Linnaeus, 1758). Acta Ecol. Sin. 2016, 36, 205–211. [Google Scholar] [CrossRef]
- Ölmez, A.; Bayir, M.; Wang, C.; Bayir, A. Effects of long-term starvation and refeeding on fatty acid metabolism-related gene expressions in the liver of zebrafish, Danio rerio. Turk. J. Vet. Anim. Sci. 2015, 39, 654–660. [Google Scholar] [CrossRef]
- Kulkarni, R.S.; Barad, V.S. Effect of starvation on haematological and serum biochemical changes in the fresh water fish, Notopterus notopterus (Pallas). Int. J. Innov. Stud. Aquat. Biol. Fish 2015, 1, 24–29. [Google Scholar]
- Eslamloo, K.; Morshedi, V.; Azodi, M.; Akhavan, S.R. Effect of starvation on some immunological and biochemical parameters in tinfoil barb (Barbonymus schwanenfeldii). J. Appl. Anim. Res. 2016, 45, 173–178. [Google Scholar] [CrossRef] [Green Version]
- De Frutos, P.G.; Bonamusa, L.; Baanante, I.V. Metabolic changes in fish liver during the starved-to-fed transition. Comp. Biochem. Physiol. Part A Physiol. 1991, 98, 329–331. [Google Scholar] [CrossRef]
- Bermejo-Nogales, A.; Calduch-Giner, J.A.; Pérez-Sánchez, J. Unraveling the molecular signatures of oxidative phosphorylation to cope with the nutritionally changing metabolic capabilities of liver and muscle tissues in farmed fish. PLoS ONE 2015, 10, e0122889. [Google Scholar] [CrossRef] [PubMed]
- Paredes, J.F.; López-Olmeda, J.F.; Martínez, F.J.; Sánchez-Vázquez, F.J. Daily rhythms of lipid metabolic gene expression in zebra fish liver: Response to light/dark and feeding cycles. Chronobiol. Int. 2015, 32, 1438–1448. [Google Scholar] [CrossRef]


Disclaimer/Publisher’s Note: The statements, opinions and data contained in all publications are solely those of the individual author(s) and contributor(s) and not of MDPI and/or the editor(s). MDPI and/or the editor(s) disclaim responsibility for any injury to people or property resulting from any ideas, methods, instructions or products referred to in the content. |
© 2023 by the authors. Licensee MDPI, Basel, Switzerland. This article is an open access article distributed under the terms and conditions of the Creative Commons Attribution (CC BY) license (https://creativecommons.org/licenses/by/4.0/).
Share and Cite
Xie, M.; Li, S.; Feng, Z.; Xiang, J.; Deng, Q.; Wang, P.; Wu, H.; Gao, J.; Zeng, G.; Xiang, G. Effects of Starvation on the Physiology and Liver Transcriptome of Yellowcheek (Elopichthys bambusa). Fishes 2023, 8, 175. https://doi.org/10.3390/fishes8040175
Xie M, Li S, Feng Z, Xiang J, Deng Q, Wang P, Wu H, Gao J, Zeng G, Xiang G. Effects of Starvation on the Physiology and Liver Transcriptome of Yellowcheek (Elopichthys bambusa). Fishes. 2023; 8(4):175. https://doi.org/10.3390/fishes8040175
Chicago/Turabian StyleXie, Min, Shaoming Li, Zhifeng Feng, Jin Xiang, Qi Deng, Pengpeng Wang, Hao Wu, Jingwei Gao, Guoqing Zeng, and Guangqing Xiang. 2023. "Effects of Starvation on the Physiology and Liver Transcriptome of Yellowcheek (Elopichthys bambusa)" Fishes 8, no. 4: 175. https://doi.org/10.3390/fishes8040175