Article

Impacts of Land Cover Changes on Catches of Nile Perch and Nile Tilapia on Lake Kyoga, Uganda

by
Rebecca Walugembe Nambi
1,2,*,
Abebe Getahun
3,
Fredrick Jones Muyodi
4 and
Edward Rukuunya
5
1
Africa Center of Excellence for Water Management, College of Natural and Computational Sciences, Addis Ababa University, Addis Ababa P.O. Box 1176, Ethiopia
2
Directorate of Fisheries Resources, Ministry of Agriculture, Animal Industry and Fisheries, Entebbe P.O. Box 102, Uganda
3
Department of Zoological Sciences, College of Natural and Computational Sciences, Addis Ababa University, Addis Ababa P.O. Box 1176, Ethiopia
4
Department of Zoology, Entomology and Fisheries Sciences, College of Natural Sciences, Makerere University, Kampala P.O. Box 7062, Uganda
5
Directorate of Fisheries Management and Development, Lake Victoria Fisheries Organization, Jinja P.O. Box 1625, Uganda
*
Author to whom correspondence should be addressed.
Fishes 2023, 8(3), 158; https://doi.org/10.3390/fishes8030158
Submission received: 22 December 2022 / Revised: 27 February 2023 / Accepted: 3 March 2023 / Published: 10 March 2023
(This article belongs to the Special Issue New Trends in Freshwater Fishes)

Abstract

:
In East Africa, Nile perch and Nile tilapia are major commercial fish species, providing reliable protein and income sources. However, their stocks are dwindling on Lake Kyoga due to land use and land cover (LULC) changes within the surrounding catchment. Thus, this paper aims at assessing the land use land cover on Lake Kyoga and its immediate catchment and how those changes affect the water quality and the local fish catches. The Iso-Cluster tool in ArcGIS was used to analyze Landsat images from the years 1989 to 2021 to obtain LULC information. The LULC classes were classified into water, wetland, agricultural land, rangeland, and settlements. Correction using a 2-tailed test of the water quality parameters with the LULC classes indicated a strong positive correlation of TN with water (0.71), a strong negative correlation of TP with rangelands (−0.83), and a strong positive correlation of Chl-a with settlement (0.98) at a 0.05 confidence level. The correlation of the recorded fish catch data with fishing gear showed a strong negative correlation with cast and monofilament nets. Continued use of illegal fishing gear was ranked number 1 of the causes of LULC by the stakeholders. Thus, the fisheries managers should collaborate with local stakeholders to boost declining fish catches for improved livelihoods and sustainable management.

Graphical Abstract

1. Introduction

Worldwide, lakes, like other freshwater ecosystems, including rivers, reservoirs, and wetlands, act as habitats for a wide range of aquatic fauna and flora [1] and are sources of harvestable plants and animals. They provide transportation and travel routes, act as cultural and tourism sites, and provide a variety of ecological services. Such services include water purification, water storage, processing of carbon and other nutrients, stabilization of shorelines, and waste removal [2,3]. The lakes and rivers support agriculture, industrial development, and hydropower generation, while the vast wetlands provide raw materials for art, crafts, and herbal medicine [4]. Within the lake’s catchment, which includes the wetland, are human settlements (commercial and domestic), agriculture, and livestock rearing activities. Lake Kyoga is a habitat for Nile perch—Lates niloticus (Linneaus 1758) and Nile tilapia—Oreochromis niloticus (Linnaeus, 1758), which are the main commercial fish species in Uganda [5]. The fishery provides direct and indirect employment to the people, improves the livelihoods of the communities around the lakes, increases food security for millions of people, and enhances human health since it is a reliable source of protein [6].
Despite the fishery being very important, it is threatened by dwindling stocks due to direct and indirect natural and anthropogenic impacts that change the land cover [7]. Land covers are the natural and artificial physical features of the land, while land uses are the ways humans exploit the resources on the land [8]. The main driver of the changes is the increasing human population, which leads to uncontrolled agriculture, overfishing, urbanization, industrial development, and settlements [9,10]. This has resulted in anthropogenic activities such as deforestation, wetland degradation, illegal and unregulated fishing, beach and fish landing site creation, dam construction, and sand mining [11]. The end result is the modification of catch composition and abundance and, thus, a decline in fish catches [10].
Degradation of the catchment has been associated with flooding in the receiving environment and the aquatic ecosystems due to uncontrolled agricultural activities, over-grazing, and deforestation [8,12]. The increasing agricultural activities in the catchments around lakes involve the high use of agrochemicals; hence, high volumes of contaminated water are discharged into the lakes, polluting the water quality. Activities in the environment that result in increased nutrient loads in the water enhance the abundance of the water weeds, including the water hyacinth—Eichhornia crassipes, and the Kariba weed—Salvinia molesta [13]. The water hyacinth thrives in the shallow, sheltered bays, which are also the most suitable breeding and nursery grounds for many fish species [14].
Lake Kyoga is not unique; despite its high biodiversity, the lake and its catchment are subjected to a variety of anthropogenic activities [15]. Activities like the use of illegal fishing gear and vessels and the increased destruction of vegetation cover through agricultural activities and settlements have resulted in the harvesting of immature and brook stock fish, the invasion of aquatic weeds, and the degradation of land, water quality, and breeding habitats [12]. It is in these habitats that fish carry out biological recruitment by spawning and taking care of their young. This interferes with the natural process of stock rejuvenation, thus threatening the livelihoods of fisheries-dependent communities and also the economic growth of the country [
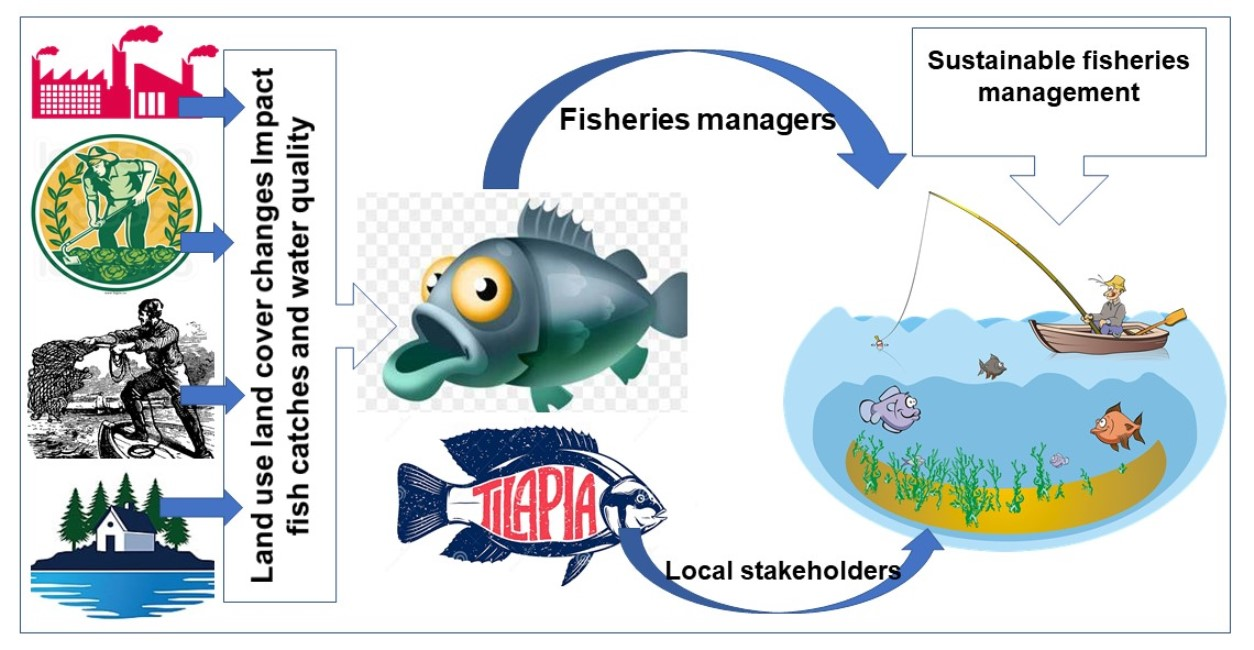
16]. Therefore, the objective of this study was to assess the linkage of land use land cover changes on Lake Kyoga and within its immediate catchment with fish catches and water quality over the years and the likely causes of the changes.

2. Materials and Methods

2.1. Study Area

Lake Kyoga is found in central Uganda, located between longitudes 32°05′ and 33°35′ E and latitudes 1°05′ and 1°55′ N (Figure 1). Its location is part of the central African plateau at an altitude of 1100 m above mean sea level. It is composed of two arms, Kwania and Kyoga main, and over 30 minor lakes known as satellite lakes connected to the main lake by the wetlands [17]. The southern catchment spreads over 60,000 km2, covering almost 25% of the 240,000 km2 surface area of Uganda. The open water area of the lake is about 2600 km2 with a mean depth of 2–4 m [4]. The lake is shallow, with its waters being supplied by direct rainfall, streams, and rivers within the catchment. The streams and rivers stretch from the Mount Elgon region, located in eastern Uganda. The Victoria Nile River contributes about 82% of Lake Kyoga’s water, other rivers provide 9%, and direct rainfall also provides 9% [18].
Lake Kyoga is connected to Lake Victoria in the south and Lake Albert in the northwest via the River Nile (the Victoria and Albert Niles, respectively). The Victoria Nile River flows out of Lake Victoria, joining Lake Albert through the Albert Nile via Lake Kyoga, then continuing as the White Nile up to the Mediterranean Sea. It is also surrounded by dense swamps covered with papyrus—Cyperus papyrus, water lilies—Nymphaeaceae spp., and water weeds, mainly Water hyacinth and the Kariba weed [18]. The wetlands that surround the lake form bays at the shorelines, which act as breeding habitats for various aquatic organisms, including Nile perch and Nile tilapia.

2.2. Data Collection Methods and Analysis

2.2.1. Land Use Land Cover

Data Acquisition

Ground truthing surveys were conducted to generate graphical impressions of the land use and land cover changes. Satellite data for the period of 30 years, that is, 1989, 2000, 2010, and 2021, were obtained from the USGS website (https://earthexplorer.usgs.gov/) accessed on 14 May 2021. These were LandSat satellite images with a spatial resolution of 30 m (Table 1). The choice of images was determined by cloud cover and the season. The images with the least amount of cloud cover from a year before or after the planned year for the data required were chosen. This was done during the longer dry season of the area, which comprises the months of December, January and February.

Data Preparation

Satellite imagery was downloaded as single-band images. A combination of these individual bands into a single image was carried out to provide better grounds for extracting information using color composites in the combination of red, green, and blue. Satellite imagery contains data that is contaminated by a number of impurities, such as aerosol particles, water vapor, and others. The effect of these impurities was minimized by a process of radiometric calibration and conversion from pixel radiance values to surface reflectance values. A malfunction in the sensors for the LandSat 7 ETM+ satellite in 2003 led to the creation of strips of no data values in the imagery captured thereafter. Thus, the image with data gaps had to be rectified using focal statistics, that is, by obtaining the mean value of a grid of 3 by 3 to estimate the value of an unknown value. The clipping of a subset of the acquired data, guided by a shapefile of the study area, was done by focusing on the area of interest while optimizing the processing time. The study area was defined as the area within a 10-km radius of Lake Kyoga’s shores.

Data Processing

Obtaining the land cover information was done through an unsupervised classification process using the Iso-Cluster tool in ArcGIS. This tool uses the “migrating means” technique, where, for a set number of clusters, the class assigned to each point is a result of its value being closest to a particular cluster value. In order to improve the classification, the process is iterative in nature. After each iteration, the mean value of points in each class (cluster) is computed and used as the cluster value for the next iteration. A higher number of iterations reduces the migration of points from one class to another. The classes can be adjusted or combined depending on the information they convey about the land cover in the specified area. The classes (Table 2) that were adopted for this study were: water, wetland, rangeland, agricultural land, and settlement. Figure 2 indicates typical pictures of the LULC classes detailing the physical features of each of the classes.

Accuracy Assessment

The accuracy of the classification exercise was examined based on the results obtained from the latest image of 2021 in comparison to the latest high-resolution images as observed on Google Earth. The assessment was carried out using tools in ArcGIS software. A stratified random sample of 206 points was generated, and the underlying classified values were obtained. The points were imported into Google Earth software, where classification values that would be considered to be the true values were assigned to each point. In some instances, a recollection of what was observed during the field visits in the various areas assisted in the assignment of these classes. A confusion matrix was computed, which indicated an overall classification accuracy of 83.3% and a Kappa coefficient (K) value of 0.715, which was substantially sufficient for the results to be adopted.

2.2.2. Fish Catch Assessment

The available recorded fish catch data for Nile perch (NP) and Nile tilapia (NT) for Lake Kyoga ranged from 2010 to 2018. Generally, fewer management efforts were put on Lake Kyoga in the past years by the Government of Uganda, as compared to Lake Victoria and Albert. Fisheries data before 2010 was not available due to a lack of reliable fisheries management systems on Lake Kyoga during that time. In addition, from 2019 to 2022, no fisheries surveys were carried out, causing data gaps. Towards the end of 2018, fishing activities were banned until the end of 2019 due to the overuse of illegal fishing gear on the lake. Unfortunately, in 2020, COVID-19 set in, and no frame surveys or catchment assessment surveys could be carried out due to the lockdowns and observation of the standard operating procedures for the virus set by the Ministry of Health in the country.
Recorded fish catch data for the frame surveys and catch assessment surveys carried out on the lake from 2010 to 2018 were sourced from the National Fisheries Resources Research Institute (NaFIRRI), Jinja, and the Directorate of Fisheries Resources (DiFR), Entebbe. The recorded data were the harvested weights in tons for Nile perch and Nile tilapia and the fishing gear used on the lake. The gear included handlines (HL), cast nets (CN), small seines (SS), beach seines (BS), monofilament nets (MF), gillnets (GN), traps (TR) and longlines (LL). During the surveys, fishermen are sensitized about the purposes of the surveys by the enumerators, who included their local leaders. Fishermen willingly declared the fishing gear they are using to carry out fishing, knowing that the surveys are done for planning and research purposes by the fisheries resource authorities. The surveys were carried out using questionnaires and the collected gear data are categorized into fishing gear types and the numbers were recorded.
The changes in the weights of the recorded harvested fish were correlated with the number of gears used on the lake over the years, LULC classes, and water quality parameters, using a 2-tailed test.

2.2.3. Water Quality Assessment (Primary and Secondary)

Using a handheld GPS (Garmin), geo-referenced coordinates indicating the sampling sites were recorded (Figure 1). Water samples were collected on the lake from the Kiwantama, Bumogoli, Kaita, Pingire, and Asinge sites. Sampling was done during the dry season of June, July, and August (JJA) of 2021 to match it with the available secondary data, which were also collected during the same season in the past years. The samples were analyzed for total nitrogen (TN), total phosphorus (TP), and chlorophyll-a (Chl-a) because these parameters indicate the productivity of the lake and the land use land cover activities on the lake and in the catchment. Secondary data for the years 1991, 2001, and 2011 were sourced from the water quality management department under the Directorate of water resources management in the Ministry of Water and Environment (MWE).
Water samples for chlorophyll-a (µg/L) analysis were collected from the lake and filtered using a hand pump in the field. The algae (Chl-a) were concentrated onto a 47-mm-diameter glass microfiber Whatman filter paper. Filtration was completed until a green color was observed on the filter paper, at which point the paper was folded with a pair of forceps and wrapped in aluminum foil to prevent light degradation of the samples. The foil was labeled, put in a glass bottle, and stored in an ice-cold box. The algal pigments were extracted from the filter residue using absolute ethanol in the laboratory. A spectrophotometer was used to measure the absorbances at 665 nm and 750 nm, which were converted into concentrations, and the generated data were recorded.
The nutrient samples (TN and TP) were collected and stored in 1000-mL polyethylene bottles, preserved in ice-cold boxes, and taken to the National Water Quality Reference Laboratory (NWQRL) in Entebbe, Uganda, for analysis. All procedures for sampling and analyses were done following the standard methods [19], where TP (mg/L) and TN (mg/L) were digested in acidic conditions before analyses. The data were recorded and correlated with the changing values for the land use and land cover classes and fish catch data. The trend of TN, TP, and Chl-a was also analyzed in excel.

2.2.4. Assessment of the Views of the Local Stakeholders

Focus group discussions (FGDs) and observations were used to validate the scientific data on the impacts of LULC on water quality and fish catches and to understand the perceptions of the stakeholders on the causes of LULC change. At selected fish landing sites, 10 FGDs were carried out, each consisting of 8–10 people. The FGDs involved 10 local council leaders, 10 fish traders, 12 farmers, 15 artisanal fish processors, 8 environmental officers, 8 fisheries officers, and 30 fishermen making a total of 95 participants. They included men, women, and the youth but the majority were men since they are more engaged in fishing activities (Figure 3). Maxwell [20] recommends a time frame of one and a half hours, and that’s what the researcher and her assistant followed while conducting this exercise. A checklist of questions relating to LULC change and the drivers was used as a guide by the researchers during the discussions. The generated data were coded, analyzed, and summarized using descriptive statistics.

2.2.5. General Methodology

The activities carried out during this research and the methods used to assess how LULC changes impact fish catches and water quality on Lake Kyoga are summarized in Figure 4. Landsat images of Lake Kyoga and its immediate catchment were processed into LULC maps showing five classes from 1989 to 2021. Primary and secondary (1991 to 2011) water quality data from the lake were analyzed for TN, TP, and Chl-a parameters. Recorded fish catch data for Nile perch and Nile tilapia from 2010 to 2018 were also analyzed. The collected data were further validated by FGDs carried out with the local stakeholders to establish the impacts and come up with mitigation measures.

3. Results

3.1. Land Use Land Cover Changes

The LULC classes identified from the satellite images were classified into five categories. These were: water, wetland, agricultural land, rangeland, and settlement area (Figure 5). The land cover dynamics from 1989 to 2021 indicated that the water class occupies the biggest area of 101 Km2. The land covered by agriculture decreased from 102 Km2 to 65 Km2. The LULC changes for the five classes are further expressed in a bar graph (Figure 6). From 2011 to 2021, there was an increase in the area of coverage for the water, wetland, rangeland, and settlement classes while the agricultural land class indicated a decrease.
Within the period of 30 years, there was either a decrease or an increase in each of the LULC classes in area of coverage and percentage (Table 3). Agricultural land showed the highest negative change of −36.6% while settlement had the highest positive percentage change of 37.2%.

3.2. Fish Catches

The trend of Nile perch and Nile tilapia recorded catch data from 2010 to 2018 (Figure 7) shows a slight increase from 2010 to 2012, which declined from 2013 to 2015. The catches for Nile perch started increasing in 2016 while for Nile tilapia, the increase was from 2015 up to 2018.
Assessment of the recorded fishing gear used indicated an increasing trend in the use of the fishing gear types from 2010 to 2018, except for BS (Figure 8). The GN, LL, and TR fishing gear used increased from 2014 to 2018 from 60,473 to 110,872, 10,423 to 159,304, and 324 to 4851 respectively (Table 4).

3.3. Water Quality

The water quality parameters of Lake Kyoga indicated variations within the study period (Figure 9). The results indicated a higher increase of TN (0.53–1.99 mg/L) and Chl-a (11.37–17.13 µg/L) from 2011 to 2021 compared to the period of 1991 to 2011. The mean concentrations of TP also followed the same trend, though with a slightly lower increase, with variations of 0.11, 0.12, 0.19 and 0.20 mg/L for 1991, 2001, 2011 and 2021 respectively.

3.4. Impacts of LULC on Fish Catches

There is a positive significant correlation (Table 5) between range land and Nile tilapia catch (r = 0.318, p < 0.05) and a negative correlation with Nile perch catch (r = −0.086, p > 0.05). Agricultural land cover had the lowest relationship with Nile tilapia catches (r = 0.23, p > 0.05), tilapia catch (r = −0.29, p > 0.05).

3.5. Impacts of LULC on Water Quality

The impacts of the land use land cover on the lake water quality (TN, TP and Chl-a) were assessed by correlation analysis (Table 6). Results indicated a positive significant correlation of TN with water (0.71) and settlement (0.98) and Chl-a with settlement (0.98), while TP showed a negative significant correlation with the rangelands (−0.83).

3.6. Causes of LULC Changes in Lake Kyoga Catchment

The correlation analysis of the fish catches and the fishing gear (Table 7) indicated a strong negative significance with the cast nets and monofilaments for both fish species. Gillnets and longline fishing gear showed a negative correlation with Nile perch catches of −0.87 and −0.93 respectively.
The FGD participants in the study area expressed seven major causes resulting in the LULC changes (Table 8). They are ranked from 1 to 7, with 1 as the biggest cause. These are: 1—use of illegal fishing gear, 2—rainfall seasons, 3—number of boats on the lake, 4—settlement expansions, 5—infrastructure, 6—agriculture expansion and 7—weak policies.

4. Discussion

Analysis of the LULC changes indicated that water class occupied the biggest area (Figure 6) and settlement the least area. The variations in area of coverage and the percentages (Table 3) indicated that LULC changes are taking place in the study area. The people surrounding the lake keep on shifting (settlements in Figure 5) and this could be due to the closing of the lake by the enforcement activities by the Fisheries Protection Unit from 2018 to 2019. In addition, many homes were displaced due to the 2020 floods that registered the highest water level in the Lake Kyoga basin [21]. According to the FGD participants, the increment in the water level was due to the high amount of rainfall received in addition to the outflow from Lake Victoria. The impacts were flooding of the agricultural gardens, homesteads, infrastructure, and fish landing sites.
Fishing was identified as the major activity in the area. Fishers targeting Nile perch and Nile tilapia fishery mostly use GN, LL, CN, BS, and MF. The correlations between the catches of Nile perch and Nile tilapia and the fishing gears (Table 7) showed a strong negative correlation between the fish catches with CN and MF. These are illegal fishing gear and are prohibited in Ugandan waters [22]. Monofilaments are invisible while underwater and fishermen set them along the shoreline, where fish usually breed.
Previous studies indicate that anthropogenic activities, including fishing [11], are among the factors leading to a widespread decline in capture fisheries production [7]. The activities affect the lake water, altering the quality of fish breeding habitats, which results in the modification of the fish composition and abundance [10].
There was a noticeable decrease in the use of beach seines, while an increase was seen with gill nets, long lines, and monofilaments, from 2014 to 2018 (Table 4). Fish catches of Nile perch and Nile tilapia have continued to decline as a result of the continued use of illegal fishing gear such as small mesh size gillnets and LL with small sized hooks. Nile perch catches showed a strong negative correlation with gill nets and longline gear (Table 7). When undersized gillnets and small hooks are used, immature fish is harvested. On Lake Victoria, the continued use of undersized gillnets and hooks has resulted in a decrease in Nile perch catches [23]. According to Perissi et al. [24], the fishing industry is consistently depleting the fish stock at a rate higher than the capability of the system to replenish it. This is a result of harvesting the spawning and immature fish, hence destabilizing the fish recruitment cycles.
Chl-a showed a strong positive correlation with the settlement (Table 6), implying that settlements are a source of nutrients for algae or Chl-a. Figure 2e shows the setup of settlements, which are mainly fish landing sites. The shoreline vegetation is degraded, letting in domestic waste in the lake. Wetlands have been studied to provide ecosystem services, which include shoreline water purification and stabilization [2,3,25]. According to El-Sheekh [26], increasing settlements in the catchments have contributed different pollutants to the aquatic ecosystem, affecting the life and habitats of the aquatic organisms. The observed water weeds, especially Eichhornia crassipes and Salvinia molesta, around the fish landing sites and a strong positive correlation of Chl-a with settlement indicate a significant nutrient load in the lake. The water weeds have been studied to invade lakes whose hydrological conditions have been changed due to human activities [27], which result in increased nutrient loads, enhancing their abundance in the water [13,28].
The non-significant correlation shown between the water quality parameters and the two LULC classes (wetland and agricultural land) could be due to the subsistence farming practices carried out in the study area, limiting them to the extensive use of agrochemicals while the majority of the people are more interested in fishing activities. Additionally, the vast wetland has not yet been extensively degraded, especially surrounding the lake shore, except in a few insignificant areas. This state of the wetland could soon change due to the observed industries under construction close to the lake shores around the Ninga landing site in Nakasongola District and the increasing settlements, which may result in enhanced industrial waste and agricultural activities in the wetland, respectively. Industries are known for discharging their untreated waste directly into the lakes, resulting in poor water quality, a bad smell, and an increase in nutrient load, leading to the invasion of aquatic weeds [29]. Many wetlands have been turned into dumping grounds for domestic and industrial solid waste. Studies on Lake Victoria by Wesige et al. [25] showed degradation of the lake catchment dominated by farmlands, industrial parks, urban centers, and settlements that resulted in poor water quality.
According to the stakeholders (Table 8), they identified seven causes of LULC changes that are taking place in the study area. The use of illegal gear and the increasing number of boats on the lake greatly impact the fish catches. The changing rain seasons are forcing the farmers to dig through the wetlands to access the water during the unexpected longer dry seasons. Increasing settlements result in the expansion of agriculture, overfishing, and enhanced nutrient loads into the lake. A bivariate correlation between the water quality and fish catches indicated a strong negative significance of Chl-a and the fish catches. Water quality has an impact on the breeding and survival of fish in water [30].

5. Conclusions

Land use land cover changes are taking place on Lake Kyoga and its immediate catchment. The changes are impacting the water quality and the Nile perch and Nile tilapia catches from the lake although there could be other factors that were not considered in this study. Nile perch and Nile tilapia are important commercial fish species providing food and employment to people. Settlements are contributing to the increase of Chl-a in the lake. Fishing is a major cause of fish catch decline because it involves the use of illegal fishing gear, especially monofilaments and undersized gillnets.
Generally, quick and achievable approaches need to be put in place in order to protect the fishery and other land covers. Sensitization programs for the local stakeholders on the handling of domestic wastewater and natural resources through the locally available communication channels, construction of pit latrines, regulating the distance from settlements to the lake, and empowering the local leaders through co-management. The local stakeholders need to embrace and understand the benefits of managing natural resources like the fishery in a sustainable way. Seasonal fishing, licensing, and continuous lake patrols are recommendable management approaches for the fishery. The weak implementation of the policies requires the governing authorities to synergize with the local stakeholders for improved governance of Lake Kyoga and its immediate catchment.

Author Contributions

1/2*. R.W.N.: The corresponding author came up with the topic, collected and analyzed the data, drafted the manuscript and incorporated comments from the supervisors. 3. A.G.: He provided guidance and supervised the process of developing the manuscript. He also gave emotional support and comments about the write up. 4. F.J.M.: He supervised, revised and edited the manuscript. 5. E.R.: He provided technical support during sample collection and data analysis. All authors have read and agreed to the published version of the manuscript.

Funding

This work was supported by the World Bank Group (grant number ACEWM GSR/1541/12) through the Ph. D scholarship offered to the corresponding author at the Africa Centre of Excellence for Water Management (ACEWM), Addis Ababa University, Ethiopia. The APC was funded by the corresponding author.

Institutional Review Board Statement

Not applicable.

Data Availability Statement

The data presented in this study are available on request from the corresponding author. The data are not publicly available due to the restrictions from the responsible ministries.

Conflicts of Interest

The authors declare no conflict of interest.

References

  1. Davidson, N.C. How much wetland has the world lost? Long-term and recent trends in global wetland area. Mar. Freshw. Res. 2014, 65, 934–941. [Google Scholar] [CrossRef] [Green Version]
  2. Desta, H.; Lemma, B.; Fetene, A. Aspects of climate change and its associated impacts on wetland ecosystem functions: A review. J. Am. Sci. 2012, 8, 582–596. [Google Scholar]
  3. Were, D.; Kansiime, F.; Fetahi, T.; Cooper, A.; Jjuuko, C. Carbon sequestration by wetlands: A critical review of enhancement measures for climate change mitigation. Earth Syst. Environ. 2019, 3, 327–340. [Google Scholar] [CrossRef]
  4. Andama, M.; Ongom, R.; Lukubye, B. Proliferation of Salvinia molesta at Lake Kyoga landing sites as a result of anthropogenic influences. J. Geosci. Environ. Prot. 2017, 5, 160–173. [Google Scholar] [CrossRef] [Green Version]
  5. Cowx, I.G.; Ogutu-Ohwayo, R. Towards sustainable fisheries and aquaculture management in the African Great Lakes. Fish. Manag. Ecol. 2019, 26, 397–405. [Google Scholar] [CrossRef]
  6. Tesfaye, G. Impacts of Anthropogenic Activities on Fish Diversity of the Ethiopian Rift Valley Lakes: A Review. 2010. Available online: http://www.repository.smuc.edu.et/handle/123456789/2865 (accessed on 2 January 2021).
  7. Ogutu-Ohwayo, R.; Hecky, R.E.; Cohen, A.S.; Kaufman, L. Human impacts on the African Great Lakes. Environ. Biol. Fishes 1997, 50, 117–131. [Google Scholar] [CrossRef]
  8. Alemayehu, F.; Taha, N.; Nyssen, J.; Girma, A.; Zenebe, A.; Behailu, M.; Deckers, S.; Poesen, J. The impacts of watershed management on land use and land cover dynamics in Eastern Tigray (Ethiopia). Resour. Conserv. Recycl. 2009, 53, 192–198. [Google Scholar] [CrossRef]
  9. Mahmoud, S.H.; Gan, T.Y. Impact of anthropogenic climate change and human activities on environment and ecosystem services in arid regions. Sci. Total Environ. 2018, 633, 1329–1344. [Google Scholar] [CrossRef]
  10. Mugagga, F.; Kakembo, V.; Buyinza, M. Land use changes on the slopes of Mount Elgon and the implications for the occurrence of landslides. Catena 2012, 90, 39–46. [Google Scholar] [CrossRef]
  11. Njiru, M.; Sitoki, L.; Nyamweya, C.S.; Jembe, T.; Aura, C.; Waithaka, E.; Masese, F. Habitat degradation and changes in Lake Victoria fisheries. In Environmental Degradation: Causes, Issues and Management; Adoyo, W.A., Wangai, C.I., Eds.; NOVA Science Publishers, Inc.: New York, NY, USA, 2012; pp. 1–34. [Google Scholar]
  12. Anaba-Onana, A.B.; Ndam-Ngoupayou, J.R.; Mvondo-Ondoa, J. Analysis of crystalline bedrock aquifer productivity: Case of central region in Cameroon. Groundw. Sustain. Dev. 2017, 5, 66–74. [Google Scholar] [CrossRef]
  13. Bootsma, H.A.; Hecky, R.E. Conservation of the African Great Lakes: A limnological perspective. Conserv. Biol. 1993, 7, 644–656. [Google Scholar] [CrossRef]
  14. Asmare, E. Current Trend of Water Hyacinth Expansion and Its Consequence on the Fisheries around North Eastern part of Lake Tana, Ethiopia. J. Biodivers. Endanger. Species 2017, 5, 1–4. [Google Scholar] [CrossRef]
  15. Dudgeon, D.; Arthington, A.H.; Gessner, M.O.; Kawabata, Z.I.; Knowler, D.J.; Lévêque, C.; Naiman, R.J. Freshwater biodiversity: Importance, threats, status and conservation challenges. Biol. Rev. 2006, 81, 163–182. [Google Scholar] [CrossRef]
  16. MAAIF. Joint sector review. In Uganda National Seed Strategy 2014/15–2019/20.1-118; Ministry of Agriculture Animal Industry and Fisheries: Entebbe, Uganda, 2015. [Google Scholar]
  17. Green, J. The Kyoga catchment. In The Nile: Origin, Environments, Limnology and Human Use; University of Ghent: Ghent, Belgium, 2009; pp. 205–214. [Google Scholar]
  18. Ogutu-Ohwayo, R.; Odongkara, K.; Okello, W.; Mbabazi, D.; Wandera, S.B.; Ndawula, L.M.; Natugonza, V. Variations and changes in habitat, productivity, composition of aquatic biota and fisheries of the Kyoga lake system: Lessons for management. Afr. J. Aquat. Sci. 2013, 38, 1–14. [Google Scholar] [CrossRef]
  19. APHA. Standard Methods for the Examination of Water and Waste Water, 21st ed.; American Public Health Association: Washington, DC, USA, 2012. [Google Scholar]
  20. Maxwell, J.A. Qualitative Research Design: An Interactive Approach; Sage Publications: Thousand Oaks, CA, USA, 2012. [Google Scholar]
  21. Obubu, J.P.; Mengistou, S.; Fetahi, T.; Alamirew, T.; Odong, R.; Ekwacu, S. Recent climate change in the Lake Kyoga basin, Uganda: An analysis using short-term and long-term data with standardized precipitation and anomaly indexes. Climate 2021, 9, 179. [Google Scholar] [CrossRef]
  22. MAAIF. Statutory Instrument of Fish (Fishing Rules) 2010 No. 33; Ministry of Agriculture, Animal Industry and Fisheries: Entebbe, Uganda, 2010. [Google Scholar]
  23. Hecky, R.E.; Mugidde, R.; Ramlal, P.S.; Talbot, M.R.; Kling, G.W. Multiple stressors cause rapid ecosystem change in Lake Victoria. Freshw. Biol. 2010, 55, 19–42. [Google Scholar] [CrossRef] [Green Version]
  24. Perissi, I.; Bardi, U.; El-Asmar, T.; Lavacchi, A. Dynamic patterns of overexploitation in fisheries. Ecol. Model. 2017, 359, 285–292. [Google Scholar] [CrossRef] [PubMed]
  25. Wesige, J.E.; Groen, T.A.; Smaling, E.; Jetten, V. Monitoring basin-scale land cover changes in Kagera Basin of Lake Victoria using ancillary data and remote sensing. Int. J. Appl. Earth Obs. Geoinf. 2013, 21, 32–42. [Google Scholar] [CrossRef]
  26. El-Sheekh, M.M. Impact of water quality on ecosystems of the Nile River. In The Nile River; Springer: Cham, Switzerland, 2016; pp. 357–385. [Google Scholar] [CrossRef]
  27. Harley, K.L.S. The role of biological control in the management of water hyacinth, Eichhornia crassipes. Biocontrol News Inf. 1990, 11, 11–22. [Google Scholar] [CrossRef]
  28. Obubu, J.P.; Mengistou, S.; Odong, R.; Fetahi, T.; Alamirew, T. Determination of the connectedness of land use, land cover change to water quality status of a shallow lake: A case of Lake Kyoga basin, Uganda. Sustainability 2021, 14, 372. [Google Scholar] [CrossRef]
  29. Buys, L.; Mengersen, K.; Johnson, S.; van Buuren, N.; Chauvin, A. Creating a sustainability scorecard as a predictive tool for measuring the complex social, economic and environmental impacts of industries, a case study: Assessing the viability and sustainability of the dairy industry. J. Environ. Manag. 2014, 133, 184–192. [Google Scholar] [CrossRef] [PubMed] [Green Version]
  30. Aura, C.M.; Nyamweya, C.S.; Njiru, J.M.; Musa, S.; Ogari, Z.; May, L.; Wakwabi, E. Exploring the demarcation requirements of fish breeding and nursery sites to balance the exploitation, management and conservation needs of Lake Victoria ecosystem. Fish. Manag. Ecol. 2018, 26, 451–459. [Google Scholar] [CrossRef]
Figure 1. Sampling sites within the study area.
Fishes 08 00158 g001
Figure 2. Typical setting of the LULC classes within L. Kyoga catchment ((a)-water, (b)-wetland, (c)-agricultural land, (d)-rangeland, (e)-settlement).
Fishes 08 00158 g002
Figure 3. Focus group discussion at Iyingo fish landing site.
Fishes 08 00158 g003
Figure 4. A flow chart showing the relationship of LULC with water quality and fish catches within the immediate catchment of Lake Kyoga.
Fishes 08 00158 g004
Figure 5. Land use land cover changes in the immediate catchment of Lake Kyoga from 1989 to 2021.
Fishes 08 00158 g005
Figure 6. Trends of LULC changes from 1989 to 2021 within the Lake Kyoga catchment.
Fishes 08 00158 g006
Figure 7. Lake Kyoga Nile perch and Nile tilapia recorded catches in tonnes from 2010 to 2018 (source: NaFIRRI).
Fishes 08 00158 g007
Figure 8. Fishing gear used on Lake Kyoga for the years 2010, 2014 and 2018 and their percentage change (source: NaFIRRI/DiFR).
Fishes 08 00158 g008
Figure 9. Trend of TN, TP and Chl-a from 1991 to 2021 in Lake Kyoga.
Fishes 08 00158 g009
Table 1. Details of acquired images.
DateSatelliteSpatial Resolution
27 February 1989LandSat 4–5 TM30 m
27 January 2001LandSat 7 ETM+30 m
20 January 2010LandSat 7 ETM+30 m
27 February 2021LandSat 8 OLI/TIRS30 m
Table 2. Description of the land use land cover classes within the immediate catchment of Lake Kyoga.
ClassesDescription
Agricultural land Land surface that is cultivable for annual or perennial crops, and agroforestry. The land can be covered by crops or bare (before planting).
RangelandLand covered by shrubs, pastures, some trees and savannas
SettlementIncludes areas built up by people for permanent or temporary structures, fish landing sites, infrastructure and trading centres.
WaterArea occupied by volumes of water including lakes, rivers, streams and reservoirs
WetlandThis is an area covered by vegetation filled with permanent or seasonal water and the soils are near to the surface.
Table 3. LULC changes from 1989–2021 in area and percentage.
Year1989–20012001–20102010–2021
LULC ClassesArea (Km2)%Area (Km2)%Area (Km2)%
Water91.099.599.72−4.395.396.1
Wetland104.04−41.960.436.164.1333.6
Agriculture41.68116.490.2113.2102.15−36.6
Rangeland82.81−15.669.91−16.858.179.9
Settlement11.82−5.511.173.9111.6137.2
Table 4. Number of fishing gear used on Lake Kyoga in 2010, 2014 and 2018 (source: NaFIRRI/DiFR).
Fishing Gear201020142018
HL109130525
CN198210383
TR2463244851
SS354486774
LL62810,423159,304
BS594561425
MF100310535856
GN369860,473110,872
Table 5. Correlation between LULC classes and fish catches in Lake Kyoga catchment.
WaterWetlandsSettlementAgric–LandRangelands
Nile perch0.1030.0940.0430.023−0.086
Sig.0.5280.5640.7920.8880.599
Nile tilapia0.186−0.287−0.089−0.2900.318 *
Sig.0.2510.0730.5870.0690.046
* correlation significant at 0.05.
Table 6. Correlation between LULC classes and water quality within Lake Kyoga’s immediate catchment.
WaterWetlandAgric LandRangelandSettlement
TN0.71 *0.13−0.15−0.370.98 *
TP0.51−0.220.35−0.83 *0.69
Chl-a0.640.15−0.13−0.430.98 *
* correlation significant at 0.05.
Table 7. Correlation between fish catches and fishing gear used on Lake Kyoga from 2010 to 2018.
Fishing Gear
Fish speciesHLCNSSBSMFGNLL
Nile perch−0.67−0.99 *−0.680.8 *−0.95 *−0.87 *−0.93 *
Nile tilapia−0.26−0.84 *−0.280.44−0.71 *−0.55−0.67
* correlation significant at 0.05.
Table 8. Causes of LULC changes on Lake Kyoga and its immediate catchment.
CausesFrequency%Rank
Agriculture expansion510.216
Infrastructure612.245
Use of illegal fishing gear 1122.451
Number of boats on the lake816.323
Weak policies36.127
Settlement expansion714.294
Rainfall seasons918.372
Totals 100
Disclaimer/Publisher’s Note: The statements, opinions and data contained in all publications are solely those of the individual author(s) and contributor(s) and not of MDPI and/or the editor(s). MDPI and/or the editor(s) disclaim responsibility for any injury to people or property resulting from any ideas, methods, instructions or products referred to in the content.

