
Phenotypic Stock Evaluation of Plagioscion magdalenae (Steindachner, 1878): A Species in the Dique Channel in Colombia
 , , and
Abstract
:1. Introduction
2. Materials and Methods
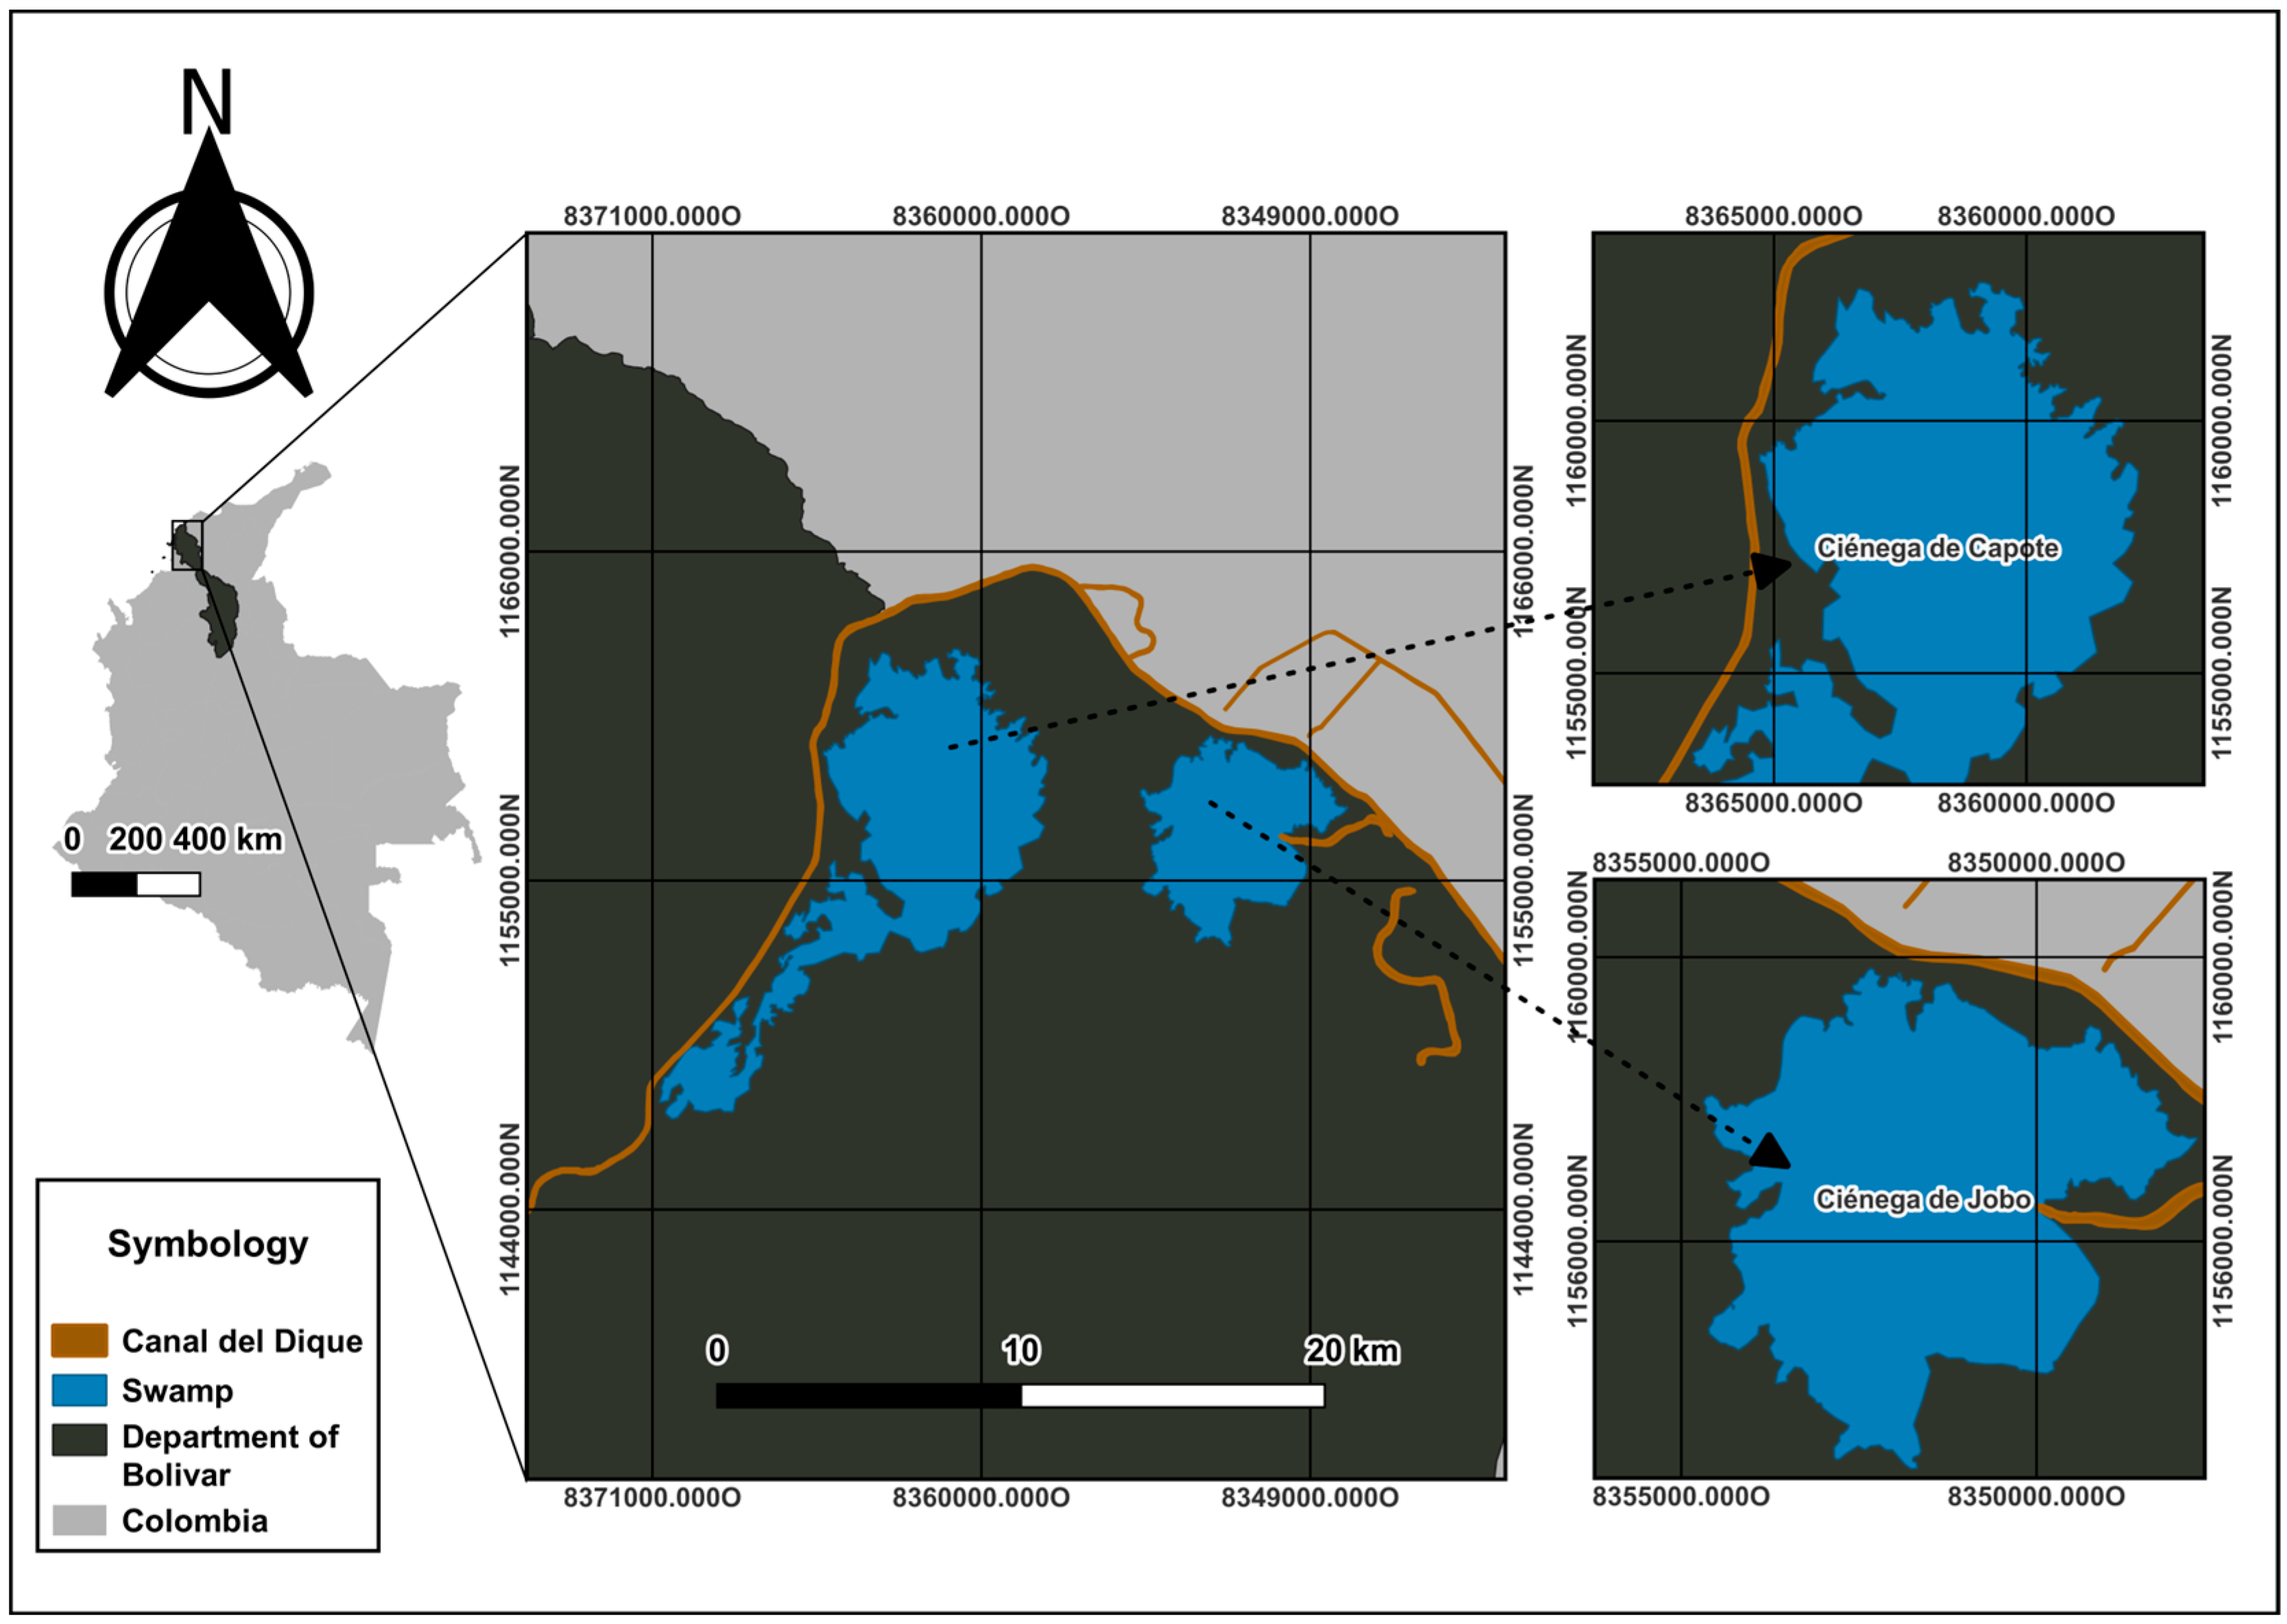
2.1. Study Area
2.2. Field Work and Sample Identification
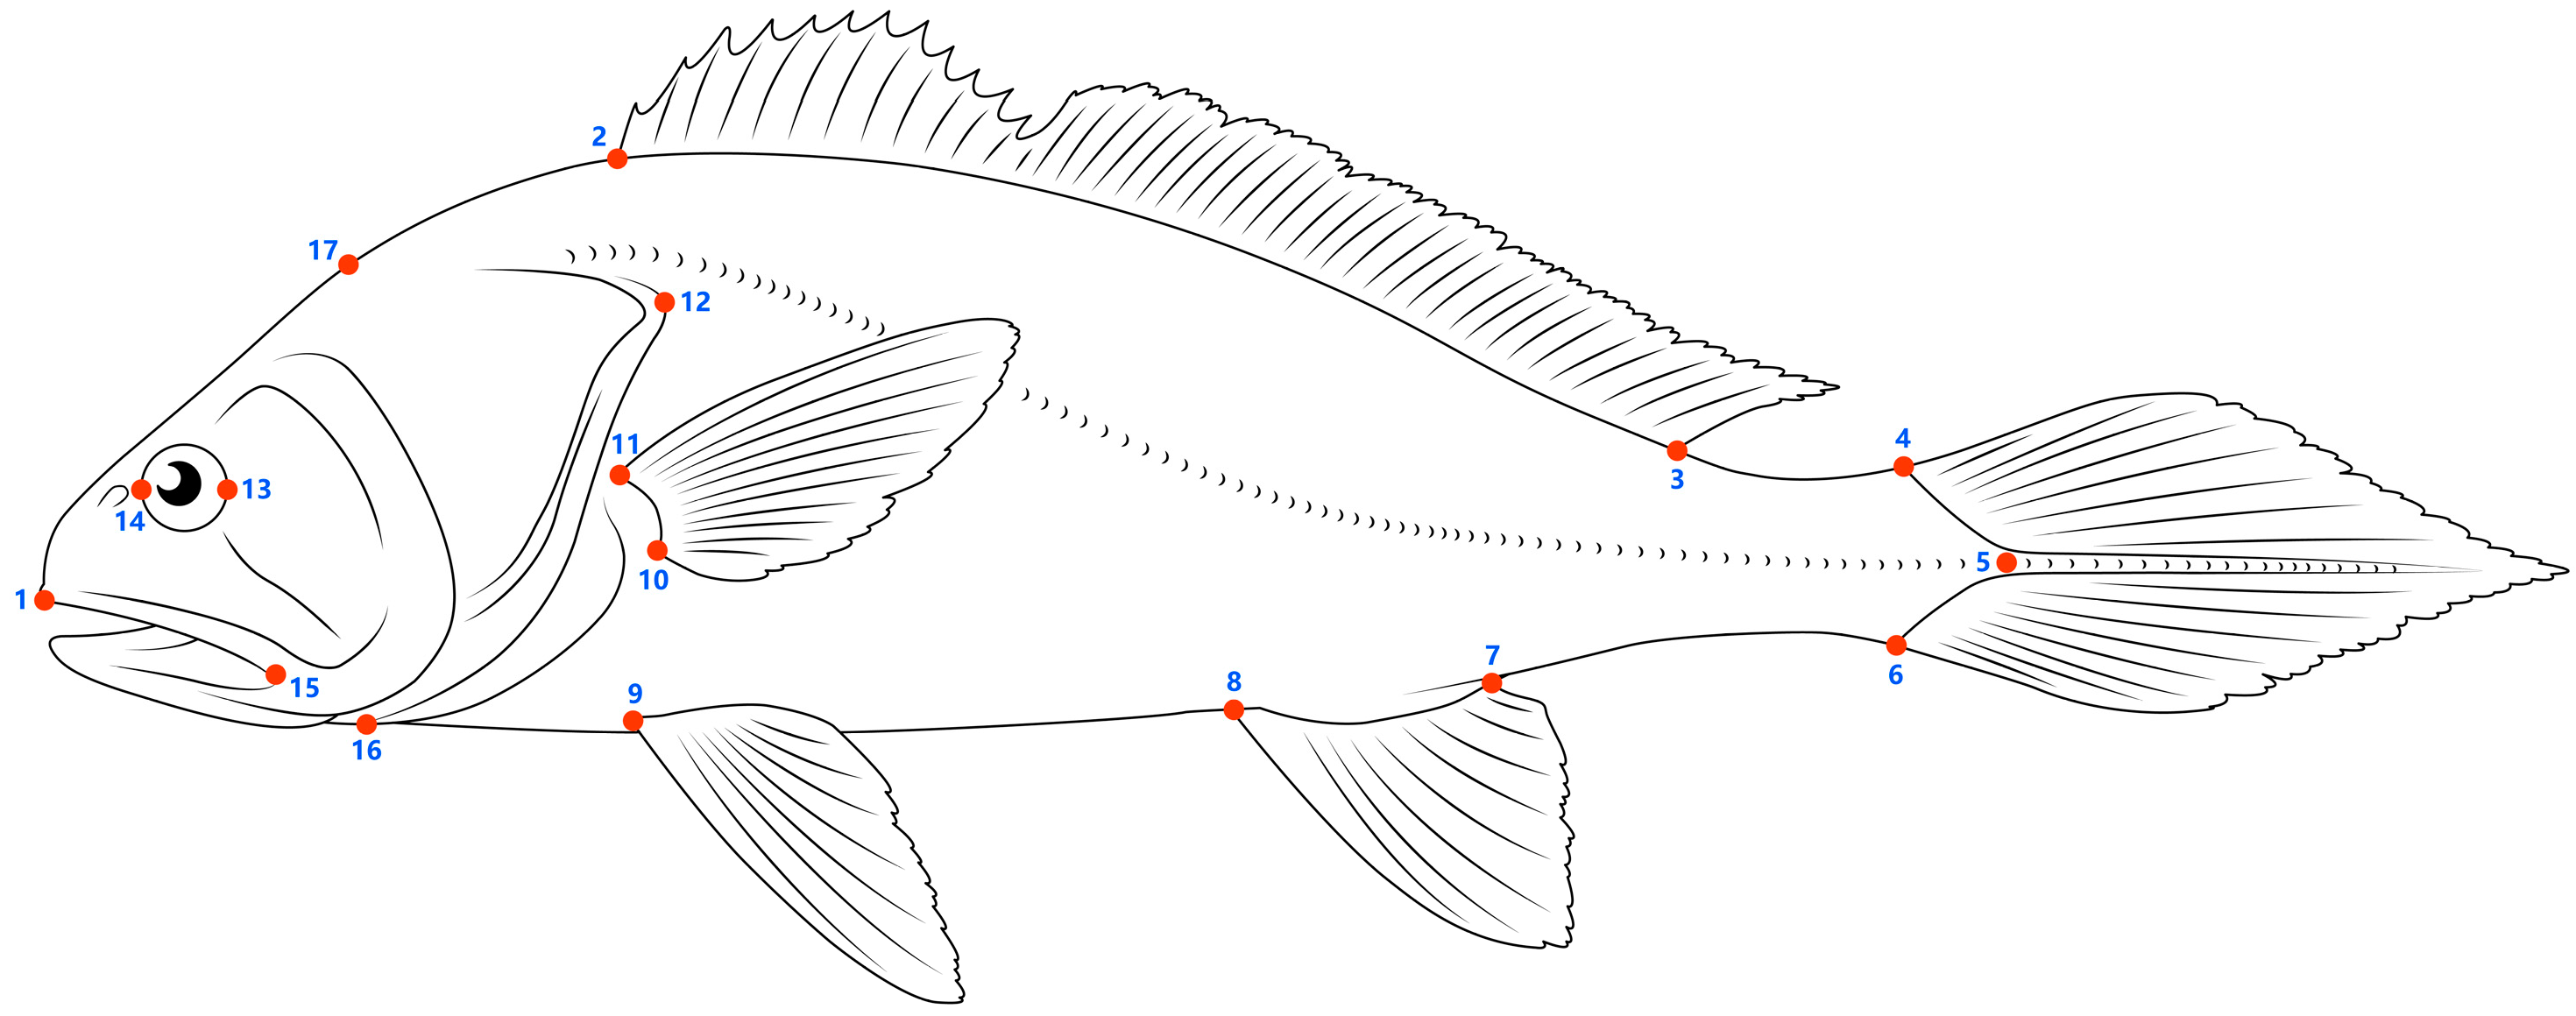
2.3. Geometric Morphometric Analyses
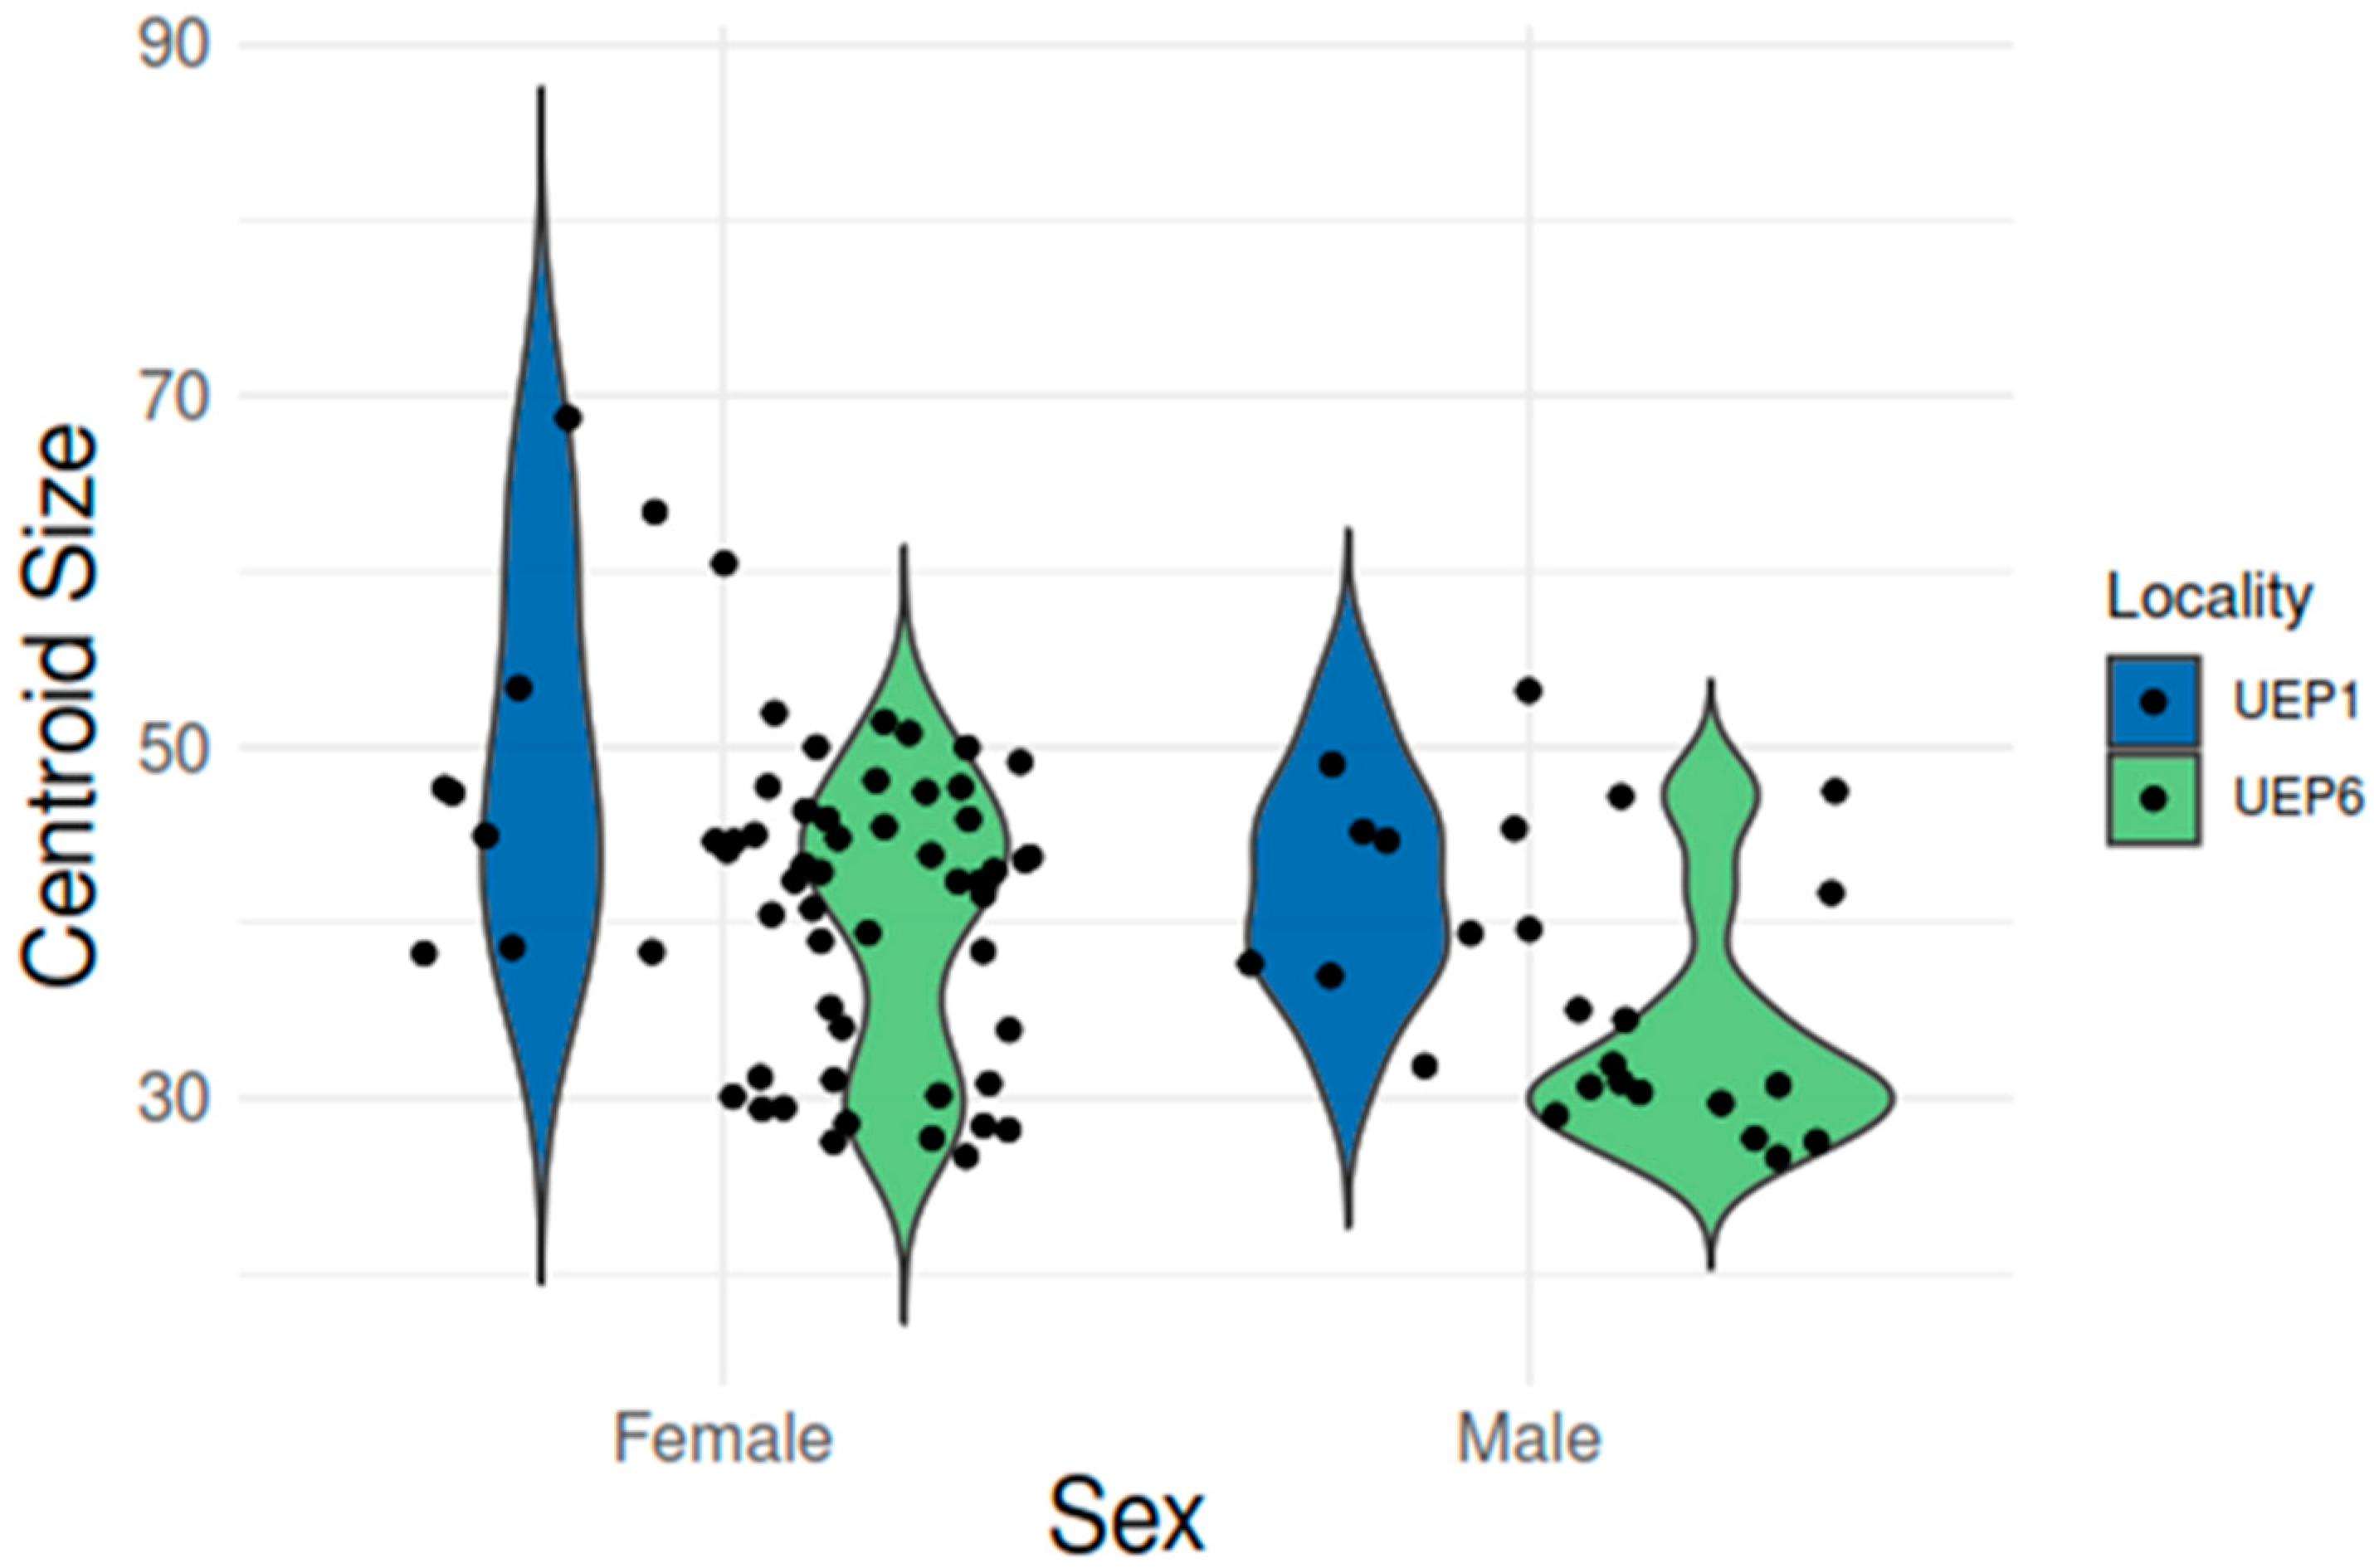
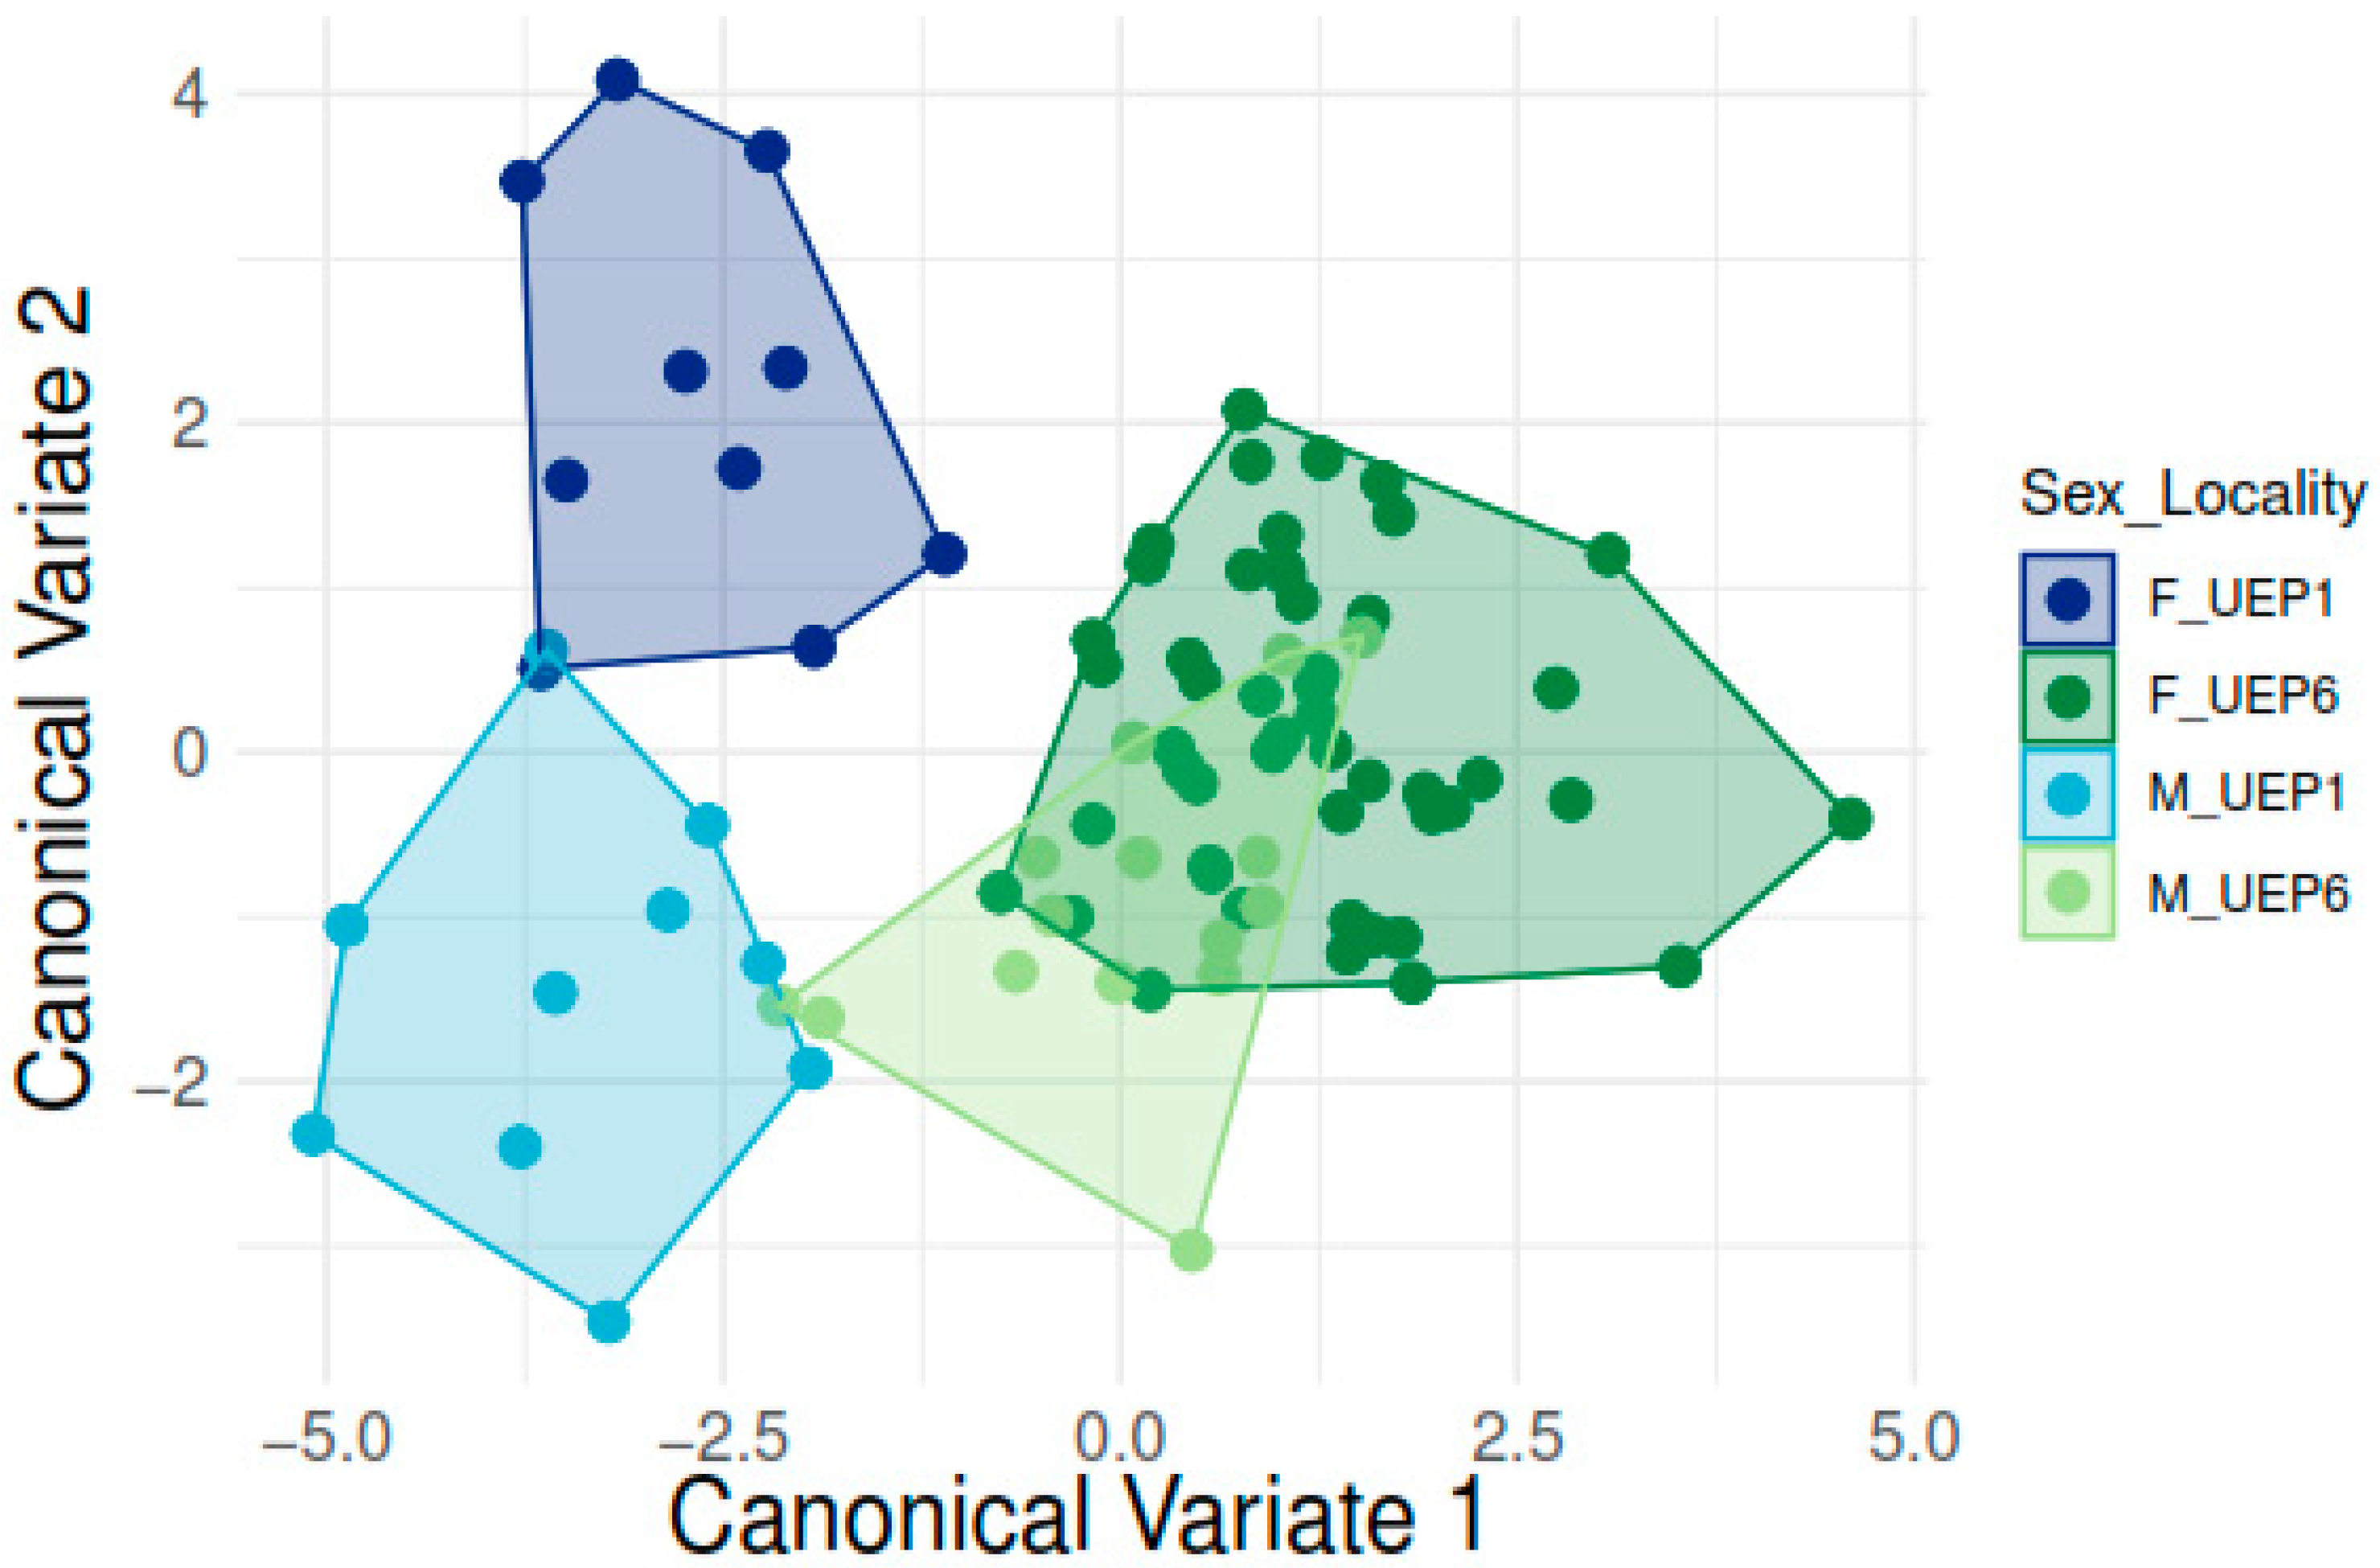
3. Results
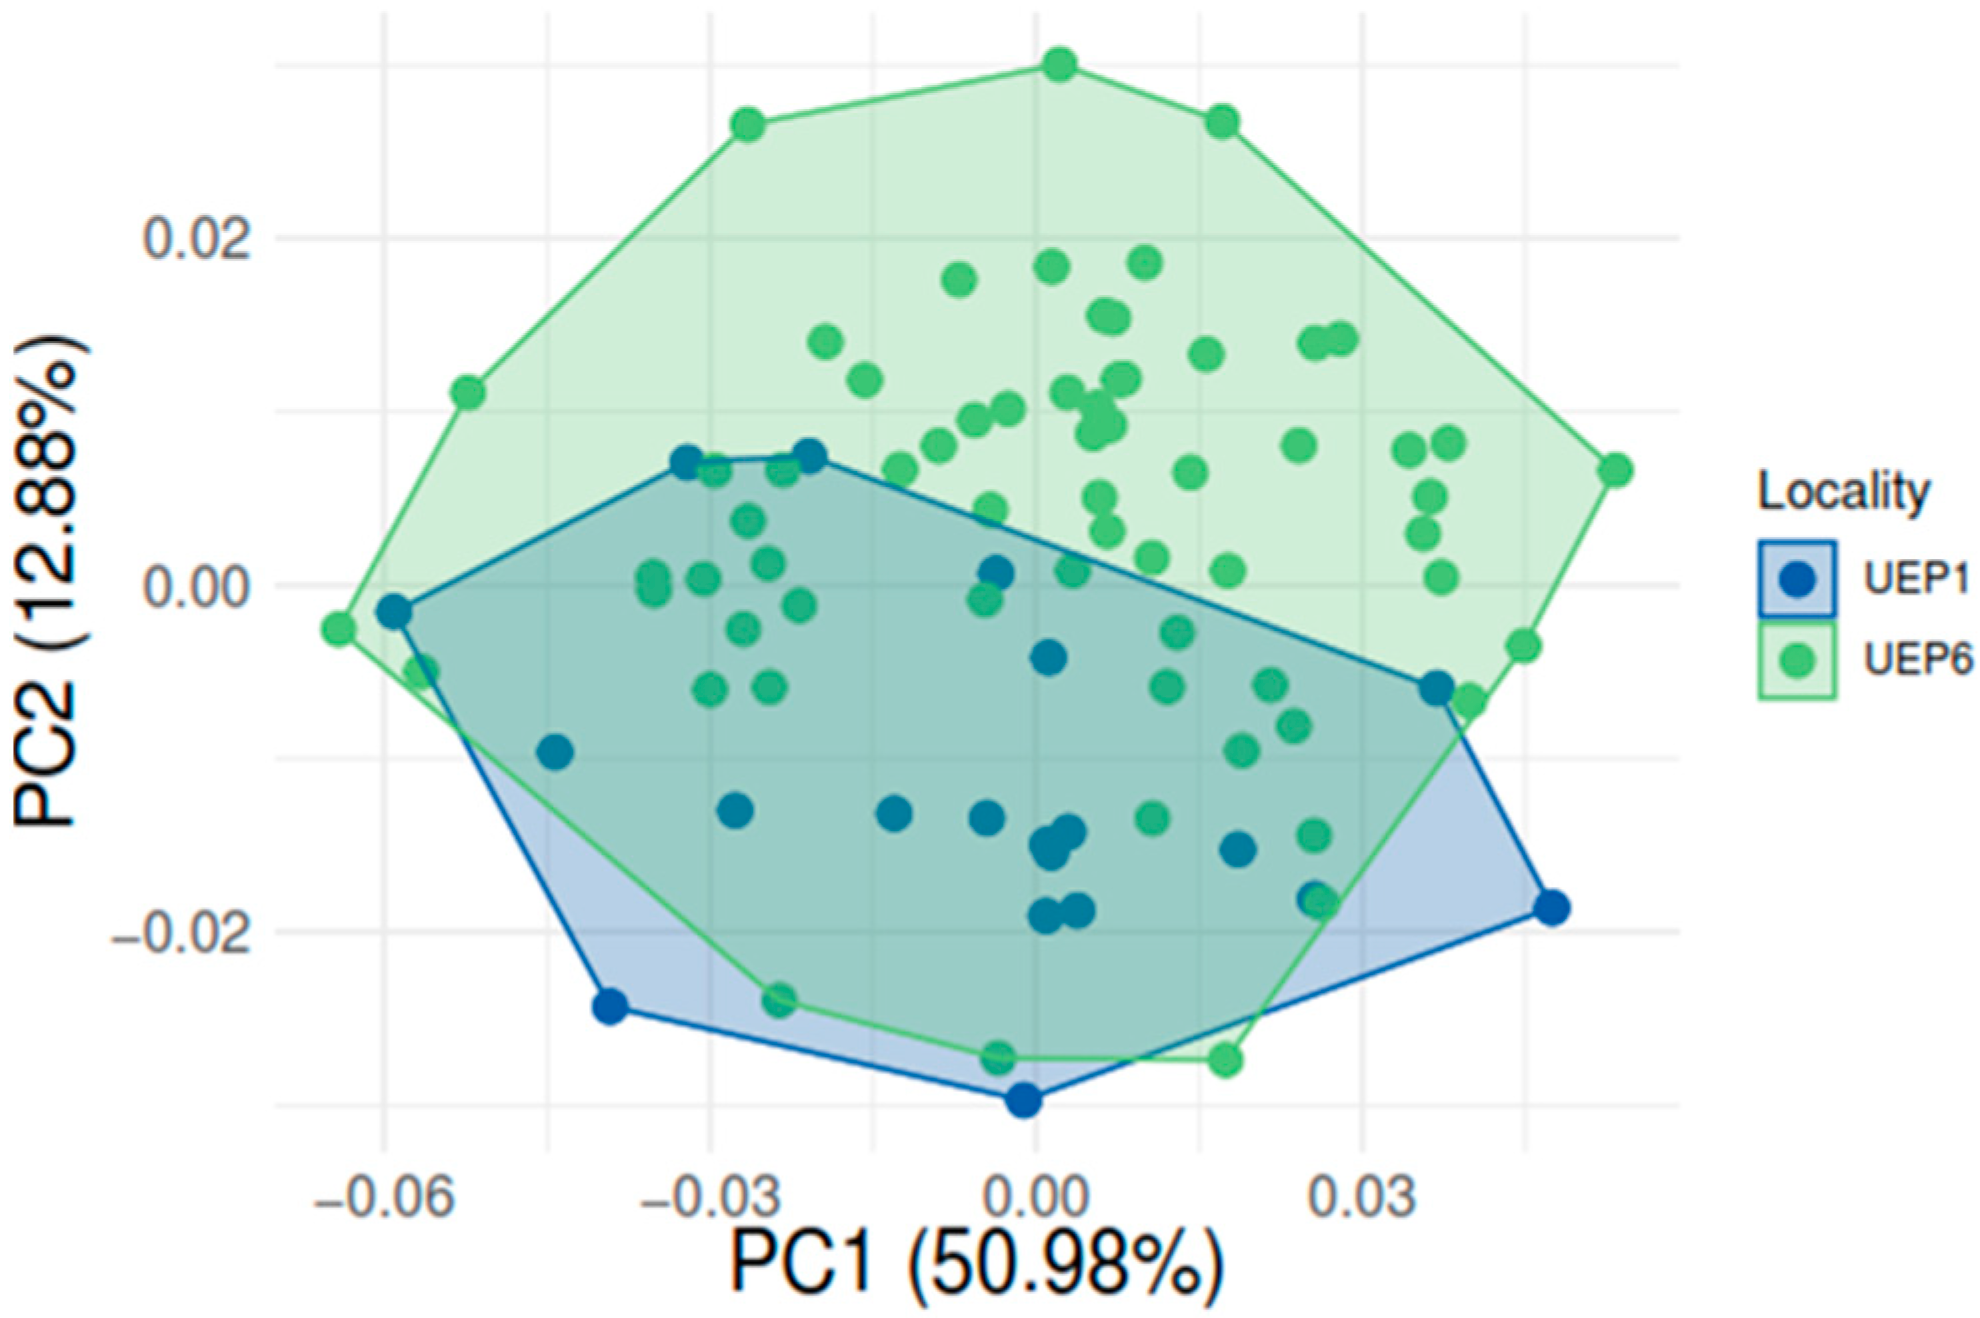
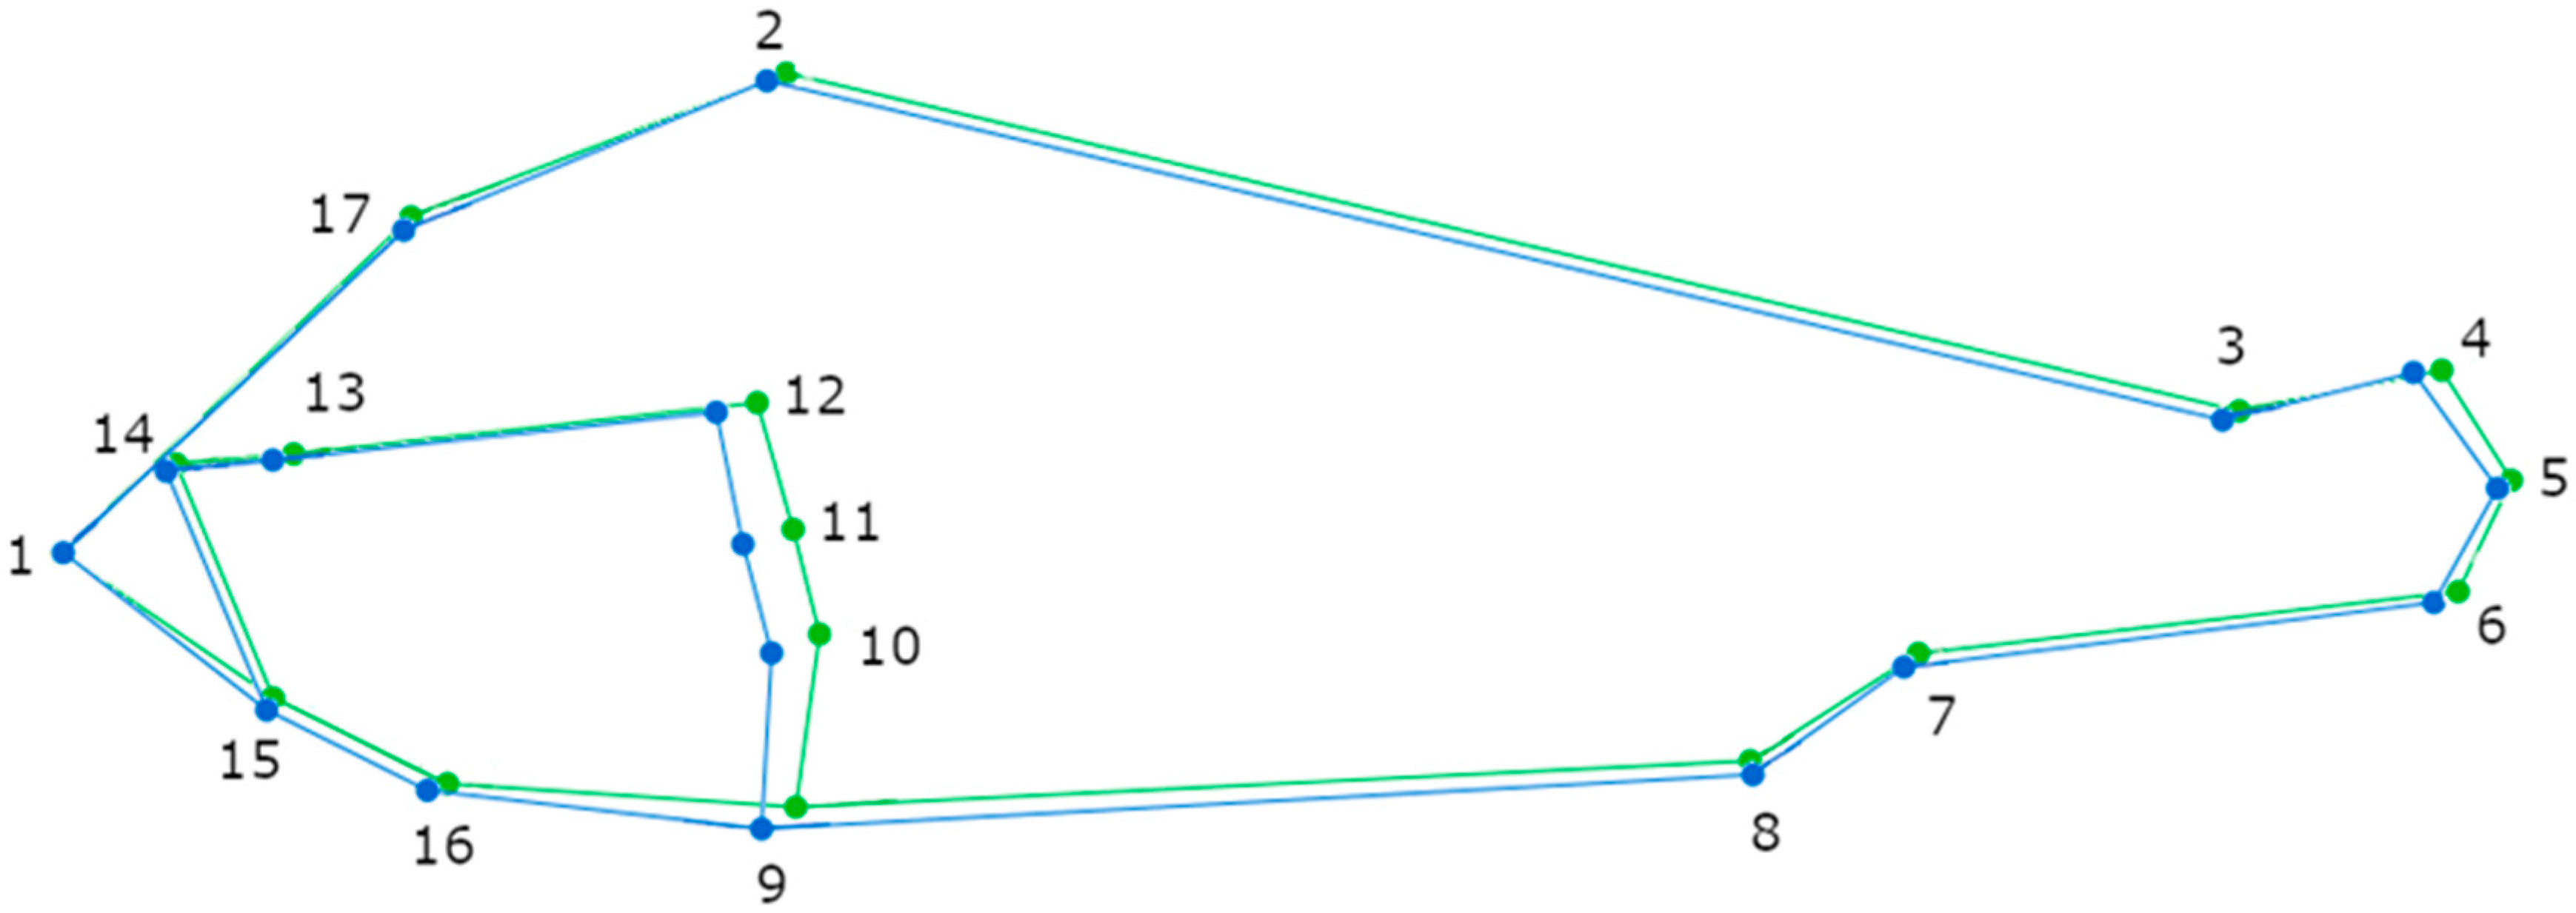
Geometric Morphometric Analyses
4. Discussion
5. Conclusions
Supplementary Materials
Author Contributions
Funding
Institutional Review Board Statement
Data Availability Statement
Acknowledgments
Conflicts of Interest
References
- DoNascimiento, C.; Herrera-Collazos, E.E.; Ortega-Lara, A.; Villa-Navarro, F.A.; Usma Oviedo, J.S.; Maldonado-Ocampo, J.A. Checklist of the freshwater fishes of Colombia: A Darwin Core alternative to the updating problem. Zookeys 2017, 708, 25–138. [Google Scholar] [CrossRef] [PubMed] [Green Version]
- Lasso, C.A.; Agudelo Córdoba, E.; Jiménez-Segura, L.F.; Ramírez-Gil, H.; Morales-Betancourt, M.; Ajiaco-Martínez, R.E.; de Paula Gutiérrez, F.; Usma, J.S.; Oviedo, S.E.; Muñoz Torres, A.; et al. Catálogo de los Recursos Pesqueros Continentales de Colombia. Serie Editorial Recursos Hidrobiológicos y Pesqueros Continentales de Colombia. 2011. Available online: https://pidamazonia.com/content/cat%C3%A1logo-de-los-recursos-pesqueros-continentales-de-colombia (accessed on 18 March 2023).
- Aguilera-Díaz, M.M. El Canal del Dique y su Subregión: Una Economía Basada en la Riqueza Hídrica; Banco de la Republica de Colombia: Bogotá, Colombia, 2006. [Google Scholar]
- OCDE. Pesca y Acuicultura en Colombia; Ministerio de Agricultura y Desarrollo Rural: Bogotá, Colombia, 2016. [Google Scholar]
- FAO. El Estado Mundial de la Pesca y la Acuicultura. Cumplir los Objetivos de Desarrollo Sostenible; Food and Agriculture Organization, Organización de las Naciones Unidas para: Rome, Italy, 2018. [Google Scholar]
- FAO. El Estado Mundial de la Pesca y la Acuicultura 2022; Hacia la Transformación Azul: Rome, Italy, 2022. [Google Scholar] [CrossRef]
- Acuicultores, F. Un futuro más prometedor que nunca. Acuicultores 2022, 6, 44. [Google Scholar]
- Long, R.D.; Charles, A.; Stephenson, R.L. Key principles of marine ecosystem-based management. Mar. Policy 2015, 57, 53–60. [Google Scholar] [CrossRef]
- Fromentin, J.-M.; Bonhommeau, S.; Arrizabalaga, H.; Kell, L.T. The spectre of uncertainty in management of exploited fish stocks: The illustrative case of Atlantic bluefin tuna. Mar. Policy 2014, 47, 8–14. [Google Scholar] [CrossRef] [Green Version]
- Peixoto, U.I.; Casal-Ribeiro, M.; Medeiros-Leal, W.M.; Novoa-Pabon, A.; Pinho, M.; Santos, R. Scientific and Fisher’s Knowledge-Based Ecological Risk Assessment: Combining Approaches to Determine the Vulnerability of Fisheries Stocks. Sustainability 2022, 14, 14870. [Google Scholar] [CrossRef]
- Pauly, D.; Zeller, D. Catch reconstructions reveal that global marine fisheries catches are higher than reported and declining. Nat. Commun. 2016, 7, 10244. [Google Scholar] [CrossRef] [Green Version]
- Dwivedi, A.; Dubey, V. RETRACTION: Advancements in morphometric differentiation: A review on stock identification among fish populations. In Reviews in Fish Biology and Fisheries 2013; USDA: Washington, DC, USA, 2013. [Google Scholar]
- Rawat, S.; Benakappa, S.; Kumar, J.; Naik, K.; Pandey, G.; Pema, C.; Sciences, L. Identification of fish stocks based on Truss Morphometric: A review. J. Fish. Life Sci. 2017, 2, 9–14. [Google Scholar]
- Salgado-Cruz, L.; Quiñonez-Velázquez, C.; García-Domínguez, F.A.; Pérez-Quiñonez, C.I. Detecting Mugil curema (Perciformes: Mugilidae) phenotypic stocks in La Paz Bay, Baja California Sur, Mexico, using geometric morphometrics of otolith shape, growth, and reproductive parameters. Rev. Mex. De Biodivers. 2020, 91, 913273. [Google Scholar] [CrossRef]
- Moreira, C.; Froufe, E.; Vaz-Pires, P.; Triay-Portella, R.; Correia, A.T. Landmark-based geometric morphometrics analysis of body shape variation among populations of the blue jack mackerel, Trachurus picturatus, from the North-East Atlantic. J. Sea Res. 2020, 163, 101926. [Google Scholar] [CrossRef]
- Zheng, J.; Gao, T.; Yan, Y.; Song, N. Genetic variation of the small yellow croaker (Larimichthys polyactis) inferred from mitochondrial DNA provides novel insight into the fluctuation of resources. Acta Oceanol. Sin. 2022, 41, 88–95. [Google Scholar] [CrossRef]
- Tesfaye, G.; Curto, M.; Meulenbroek, P.; Englmaier, G.K.; Tibihika, P.D.; Alemayehu, E.; Getahun, A.; Meimberg, H.J.B.E. Genetic diversity of Nile tilapia (Oreochromis niloticus) populations in Ethiopia: Insights from nuclear DNA microsatellites and implications for conservation. BMC Ecol. Evol. 2021, 21, 1–14. [Google Scholar] [CrossRef]
- Cadrin, S.X. Advances in morphometric identification of fishery stocks. Rev. Fish Biol. Fish. 2000, 10, 91–112. [Google Scholar] [CrossRef]
- Cadrin, S.X.; Friedland, K.D. The utility of image processing techniques for morphometric analysis and stock identification. Fish. Res. 1999, 43, 129–139. [Google Scholar] [CrossRef]
- Faccenda, F.; Bozzi, R.; Parisi, G.; Lunelli, F. Geometric morphometrics: A method for rainbow trout stocks identification in aquaculture. In Proceedings of the Aquaculture America 2012, Las Vegas, NV, USA, 19 February–2 March 2012; p. 149. [Google Scholar]
- Geladakis, G.; Nikolioudakis, N.; Koumoundouros, G.; Somarakis, S. Morphometric discrimination of pelagic fish stocks challenged by variation in body condition. ICES J. Mar. Sci. 2017, 75, 711–718. [Google Scholar] [CrossRef]
- Bookstein, F.L. Morphometric Tools for Landmark Data; Cambridge University Press: New York, NY, USA, 1997. [Google Scholar]
- Benítez, H.A.; Püschel, T.A. Modelando la Varianza de la Forma: Morfometría Geométrica Aplicaciones en Biología Evolutiva. Int. J. Morphol. 2014, 32, 998–1008. [Google Scholar] [CrossRef] [Green Version]
- Bookstein, F.L. Foundations of Morphometrics. Annu. Rev. Ecol. Syst. 1982, 13, 451–470. [Google Scholar] [CrossRef]
- Rohlf, F.J.; Slice, D. Extensions of the Procrustes method for the optimal superimposition of landmarks. Syst. Biol. 1990, 39, 40–59. [Google Scholar] [CrossRef] [Green Version]
- Adams, D.C.; Otárola-Castillo, E. Geomorph: An R package for the collection and analysis of geometric morphometric shape data. Methods Ecol. Evol. 2013, 4, 393–399. [Google Scholar] [CrossRef]
- Klingenberg, C.P. MorphoJ: An integrated software package for geometric morphometrics. Mol. Ecol. Resour. 2011, 11, 353–357. [Google Scholar] [CrossRef]
- Villalobos-Leiva, A.; Benítez, H.A. Morfometría geométrica y sus nuevas aplicaciones en ecología y biología evolutiva. Parte 2. Int. J. Morphol. 2020, 38, 1818–1836. [Google Scholar] [CrossRef]
- Ibáñez, A.L.; Hernández-Fraga, K.; Alvarez-Hernández, S. Discrimination analysis of phenotypic stocks comparing fish otolith and scale shapes. Fish. Res. 2017, 185, 6–13. [Google Scholar] [CrossRef]
- Quinonez, C.P.; Velazquez, C.Q.; García-Rodríguez, F.J. Detecting Opisthonema libertate (Gunther, 1867) phenotypic stocks in northwestern coast of Mexico using geometric morphometrics based on body and otolith shape. Lat. Am. J. Aquat. Res. 2018, 46, 779–790. [Google Scholar] [CrossRef]
- Bayona-Vásquez, N.J.; Montenegro, M. Obtención de secuencias microsatelitales especie especificas para Plagioscion magdalenae (Pisces: Sciaenidae). Acta Biológica Colomb. 2007, 12, 122–123. [Google Scholar]
- Acero, A.; Acosta-Santos, A.A.; Agudelo-Córdoba, E.; Agudelo-Zamora, H.D.; Ajiaco-Martínez, R.E.; Alonso González, J.C.; Árvarez-León, R.; Ardila-Rodríguez, C.; Atencio García, V.J.; Barreto Reyes, C.J.; et al. Libro Rojo de Peces Dulceacuícolas de Colombia; Mojica, J.I., Usma, J.S., Álvarez-León y, C.R., Lasso, A., Eds.; Instituto Alexander von Humboldt: Bogota, Colombia, 2012. [Google Scholar]
- Chao, L.; Reis, R.; Lima, F. Plagioscion magdalenae. La Lista Roja de Especies Amenazadas de la UICN 2020. 2020. Available online: https://www.iucnredlist.org/species/64791111/64890455 (accessed on 18 March 2023).
- Costa, F.J.S.; Coutinho, D.P.; Wosiacki, W.B. Phylogenetic relationships of the species of Plagioscion Gill, 1861 (Eupercaria, Sciaenidae). Zoology 2019, 132, 41–56. [Google Scholar] [CrossRef]
- Rojas-Luna, R.A.; García Alzate, C.A. Aspectos de la reproducción de Plagioscion magdalenae (Pisces: Sciaenidae) en el embalse El Guájaro, bajo Magdalena, Colombia. Biota Colomb. 2022, 23, e206. [Google Scholar] [CrossRef]
- Santos, N.B.; Rocha, R.M.d.; Fredóu, F.L. Reproductive biology of Plagioscion magdalenae (Teleostei: Sciaenidae)(Steindachner, 1878) in the bay of Marajo, Amazon Estuary, Brazil. Neotrop. Ichthyol. 2010, 8, 333–340. [Google Scholar] [CrossRef] [Green Version]
- Solano-Peña, D.; Segura-Guevara, F.; Olaya-Nieto, C. Crecimiento y reproducción de la mojarra amarilla (Caquetaia kraussii Steindachner, 1878) en el embalse de Urrá, Colombia. Rev. MVZ Córdoba 2013, 18, 3525–3533. [Google Scholar] [CrossRef] [Green Version]
- Ahumada Lagares, G.A.; Penso Martínez, L.D. Caracterización socioeconómica de la subregión del Canal del Dique. Rev. Aguaita 2014, 26, 37–61. [Google Scholar]
- Maldonado-Ocampo, J.A.; Ortega-Lara, A.; Usma, J.; Galvis, G.; Villa-Navarro, F.A.; Vásquez, L.; Prada-Pedreros, S.; Ardila, C. Peces de los Andes de Colombia; Instituto de Investigación de Recursos Biológicos Alexander von Humboldt: Bogotá, Colombia, 2005. [Google Scholar]
- Agudelo, E.; Ajiaco, R.E.; Alvarez, L.E.; Barreto, C.G.; Borda, C.A.; Bustamante, C.C.; Caldas, J.P.; De la Hoz, J.; Nados, M.C.M.; Perucho, E.; et al. Protocolo de Captura de Información Pesquera, Biológica y Socio-Económica en Colombia. Ministerio de Agricultura y Desarrollo Rural—Dirección de Pesca y Acuicultura; MADR: Bucharest, Romanian, 2011; p. 80. [Google Scholar]
- Corti, M.; Crosetti, D. Geographic variation in the grey mullet: A geometric morphometric analysis using partial warp scores. J. Fish Biol. 1996, 48, 255–269. [Google Scholar] [CrossRef]
- Toro-Ibacache, M.V.; Soto, G.M.; Galdames, I.S. Geometric Morphometry and the Biologic Shapes Study: From the Descriptive Morphology to the Quantitative Morphology. Int. J. Morphol. 2010, 28, 977–990. [Google Scholar]
- D’Anatro, A.; Lessa, E.P. Phenotypic and genetic variation in the white croaker Micropogonias furnieri Desmarest 1823 (Perciformes: Sciaenidae): Testing the relative roles of genetic drift and natural selection on population divergence. J. Zoo 2011, 285, 139–149. [Google Scholar] [CrossRef]
- Farré, M.; Tuset, V.M.; Maynou, F.; Recasens, L.; Lombarte, A. Selection of landmarks and semilandmarks in fishes for geometric morphometric analyses: A comparative study based on analytical methods. Sci. Mar. 2016, 80, 175–186. [Google Scholar] [CrossRef] [Green Version]
- Rohlf, F.J.; Evolution, S.U. tpsDig 2.17, Digitize Landmarks and Outlines; Department of Ecology and Evolution, State University of New York at Stony Brook: New York, NY, USA, 2013. [Google Scholar]
- Klingenberg, C.P.; Barluenga, M.; Meyer, A.J.E. Shape analysis of symmetric structures: Quantifying variation among individuals and asymmetry. Evolution 2002, 56, 1909–1920. [Google Scholar]
- González, R.; Bermúdez Tobón, A. Determinación de dimorfismo sexual usando técnicas morfométricas en Rachycentron canadum (Perciformes: Rachycentridae) cultivados en cautiverio. Boletín Investig. Mar. Y Costeras 2021, 50, 79–90. [Google Scholar] [CrossRef]
- Fruciano, C. Measurement error in geometric morphometrics. Dev. Genes Evol. 2016, 226, 139–158. [Google Scholar] [CrossRef]
- Arnqvist, G.; Martensson, T. Measurement error in geometric morphometrics: Empirical strategies to assess and reduce its impact on measures of shape. Acta Zool. Acad. Sci. Hung. 1998, 44, 73–96. [Google Scholar]
- Klingenberg, C.P.; Monteiro, L.R. Distances and Directions in Multidimensional Shape Spaces: Implications for Morphometric Applications. Syst. Biol. 2005, 54, 678–688. [Google Scholar] [CrossRef] [Green Version]
- Nuñez-Vallecillo, M.; Rivera, A.; Górski, K.; Brante, A.; Benítez, H.A. Ecomorphological analyses reveal impact of land-based stressors on stock structure of two commercially important fish species (Lutjanus synagris and Haemulon plumierii) in the Caribbean. Fish. Res. 2020, 234, 105812. [Google Scholar] [CrossRef]
- Baken, E.K.; Collyer, M.L.; Kaliontzopoulou, A.; Adams, D.C. geomorph v4. 0 and gmShiny: Enhanced analytics and a new graphical interface for a comprehensive morphometric experience. Methods Ecol. Evol. 2021, 12, 2355–2363. [Google Scholar] [CrossRef]
- Hernandez, J.; Villalobos-Leiva, A.; Bermúdez, A.; Ahumada-C, D.; Suazo, M.J.; Correa, M.; Díaz, A.; Benítez, H.A. Ecomorphology and Morphological Disparity of Caquetaia Kraussii (Perciformes: Cichlidae) in Colombia. Animals 2022, 12, 3438. [Google Scholar] [CrossRef]
- Gaston, K.; Lauer, T. Morphometric variation in bluegill Lepomis macrochirus and green sunfish Lepomis cyanellus in lentic and lotic systems. J. Fish Biol. 2015, 86, 317–332. [Google Scholar] [CrossRef] [PubMed]
- Gerry, S.P.; Wang, J.; Ellerby, D.J. A new approach to quantifying morphological variation in bluegill Lepomis macrochirus. J. Fish Biol. 2011, 78, 1023–1034. [Google Scholar] [CrossRef]
- Franssen, N.R.; Harris, J.; Clark, S.R.; Schaefer, J.F.; Stewart, L.K. Shared and unique morphological responses of stream fishes to anthropogenic habitat alteration. Proc. R. Soc. B Boil. Sci. 2013, 280, 20122715. [Google Scholar] [CrossRef] [PubMed] [Green Version]
- Lokrantz, J.; Nyström, M.; Norström, A.V.; Folke, C.; Cinner, J.E. Impacts of artisanal fishing on key functional groups and the potential vulnerability of coral reefs. Environ. Conserv. 2009, 36, 327–337. [Google Scholar] [CrossRef]
- Barandica, J.C.N.; Pertuz, F.A.H.; Racedo, J.B. Efecto de los Artes de Pesca Sobre el tamaño de los peces en una pesquería artesanal del caribe colombiano. Bull. Mar. Coast. Res. 2016, 37, 163–187. [Google Scholar]
- Liang, Z.; Sun, P.; Yan, W.; Huang, L.; Tang, Y. Significant effects of fishing gear selectivity on fish life history. J. Ocean Univ. China 2013, 13, 467–471. [Google Scholar] [CrossRef]
- Cubillos, L.; Canales, M.; Bucarey, D.; Rojas, A.; Alarcón, R. Época reproductiva y talla media de primera madurez sexual de Strangomera bentincki y Engraulis ringens en el período 1993–1997, en la zona centro-sur de Chile. Investig. Mar. 1999, 27, 73–85. [Google Scholar] [CrossRef] [Green Version]
- Paramo, J.; Núñez Ricardo, S. Estructura de tallas, talla media de madurez sexual y razón sexual de camarones de aguas profundas de importancia comercial en el Caribe colombiano. Rev. Acad. Colomb. Cienc. Exactas Físicas Nat. 2015, 39, 408–415. [Google Scholar] [CrossRef] [Green Version]
- Mangi, S.; Roberts, C. Quantifying the environmental impacts of artisanal fishing gear on Kenya’s coral reef ecosystems. Mar. Pollut. Bull. 2006, 52, 1646–1660. [Google Scholar] [CrossRef]
- Lloret, J.; Muñoz, M.; Casadevall, M. Threats posed by artisanal fisheries to the reproduction of coastal fish species in a Mediterranean marine protected area. Estuar. Coast. Shelf. Sci. 2012, 113, 133–140. [Google Scholar] [CrossRef]
- Monteiro, V.; Benedito, E.; Marques Domingues, W. Effect of life strategy on the variations of energy content of two fish species (Brycon hilarii e Hypophthalmus edentatus) during their reproductive cycle. Acta Sci. Biol. Sci. 2007, 29, 151–159. [Google Scholar]
- López-Cepeda, J.; Pacheco-Cartagena, P.; Vilaxa-Olcay, A. Diferencias morfométricas de Gambusia holbrooki (Pisce: Poeciliidae) que habitan en los estanques de regadío de los valles de Lluta y Azapa, Chile. Idesia 2014, 32, 59–64. [Google Scholar] [CrossRef] [Green Version]
- Hernandez, J.; Villalobos-Leiva, A.; Bermúdez, A.; Ahumada-Cabarcas, D.; Suazo, M.J.; Benítez, H.A. An Overview of Interlocation Sexual Shape Dimorphism in Caquetaia kraussi (Perciformes: Cichlidae): A Geometric Morphometric Approach. Fishes 2022, 7, 146. [Google Scholar] [CrossRef]
- Hilborn, R.; Amoroso, R.O.; Anderson, C.M.; Baum, J.K.; Branch, T.A.; Costello, C.; de Moor, C.L.; Faraj, A.; Hively, D.; Jensen, O.P.; et al. Effective fisheries management instrumental in improving fish stock status. Proc. Natl. Acad. Sci. USA 2020, 117, 2218–2224. [Google Scholar] [CrossRef] [Green Version]
- A Begg, G.; Friedland, K.D.; Pearce, J.B. Stock identification and its role in stock assessment and fisheries management: An overview. Fish. Res. 1999, 43, 1–8. [Google Scholar] [CrossRef]
- Reis-Filho, J.A.; Harvey, E.S.; Giarrizzo, T. Impacts of small-scale fisheries on mangrove fish assemblages. ICES J. Mar. Sci. 2018, 76, 153–164. [Google Scholar] [CrossRef]
- Li, Y.; Sun, M.; Zhang, C.; Zhang, Y.; Xu, B.; Ren, Y.; Chen, Y. Evaluating fisheries conservation strategies in the socio-ecological system: A grid-based dynamic model to link spatial conservation prioritization tools with tactical fisheries management. PLoS ONE 2020, 15, e0230946. [Google Scholar] [CrossRef] [Green Version]


| Centroid Size: | |||||||
|---|---|---|---|---|---|---|---|
| Effect | SS | MS | df | F | p (Param.) | ||
| Individual | 12938.3258 | 154.027688 | 84 | 25.3 | <0.0001 | ||
| Error 1 | 517.566663 | 6.08902 | |||||
| Shape, Procrustes ANOVA: | |||||||
| Effect | SS | MS | df | F | p (Param.) | Pillai Tr. | p (Param.) |
| Individual | 0.21125168 | 0.00008383 | 2520 | 31.62 | <0.0001 | 25.17 | <0.0001 |
| Error 1 | 0.0067608 | 0.0000026513 | |||||
| H/UEP1 | H/UEP6 | M/UEP1 | |
|---|---|---|---|
| H/UEP6 | 4.4373 | ||
| p-value | <0.0001 | ||
| M/UEP1 | 3.997 | 4.8907 | |
| p-value | <0.0001 | <0.0001 | |
| M/UEP6 | 4.2608 | 2.5741 | 4.3786 |
| p-value | <0.0001 | <0.0001 | <0.0001 |
Disclaimer/Publisher’s Note: The statements, opinions and data contained in all publications are solely those of the individual author(s) and contributor(s) and not of MDPI and/or the editor(s). MDPI and/or the editor(s) disclaim responsibility for any injury to people or property resulting from any ideas, methods, instructions or products referred to in the content. |
© 2023 by the authors. Licensee MDPI, Basel, Switzerland. This article is an open access article distributed under the terms and conditions of the Creative Commons Attribution (CC BY) license (https://creativecommons.org/licenses/by/4.0/).
Share and Cite
Hernandez, J.; Correa, M.; Hernández-P, R.; Bermúdez, A.; Quintana-Canabal, A.; Laroze, D.; Benítez, H.A. Phenotypic Stock Evaluation of Plagioscion magdalenae (Steindachner, 1878): A Species in the Dique Channel in Colombia. Fishes 2023, 8, 173. https://doi.org/10.3390/fishes8040173
Hernandez J, Correa M, Hernández-P R, Bermúdez A, Quintana-Canabal A, Laroze D, Benítez HA. Phenotypic Stock Evaluation of Plagioscion magdalenae (Steindachner, 1878): A Species in the Dique Channel in Colombia. Fishes. 2023; 8(4):173. https://doi.org/10.3390/fishes8040173
Chicago/Turabian StyleHernandez, Jordan, Margarita Correa, Raquel Hernández-P, Adriana Bermúdez, Adriana Quintana-Canabal, David Laroze, and Hugo A. Benítez. 2023. "Phenotypic Stock Evaluation of Plagioscion magdalenae (Steindachner, 1878): A Species in the Dique Channel in Colombia" Fishes 8, no. 4: 173. https://doi.org/10.3390/fishes8040173