
Fish Size Correlates to Size and Morphology of Intermuscular Bones in Tambaqui Colossoma macropomum as Shown by Dissection and X-ray Imaging Methods
 , ,
, ,
Abstract
:
1. Introduction
2. Materials and Methods
2.1. Sampling
2.2. X-ray Procedures
2.3. Dissection
2.4. Data Analysis
3. Results
3.1. Variations of Intermuscular Bones in Colossoma macropomum from Radiograph and Dissection Approach
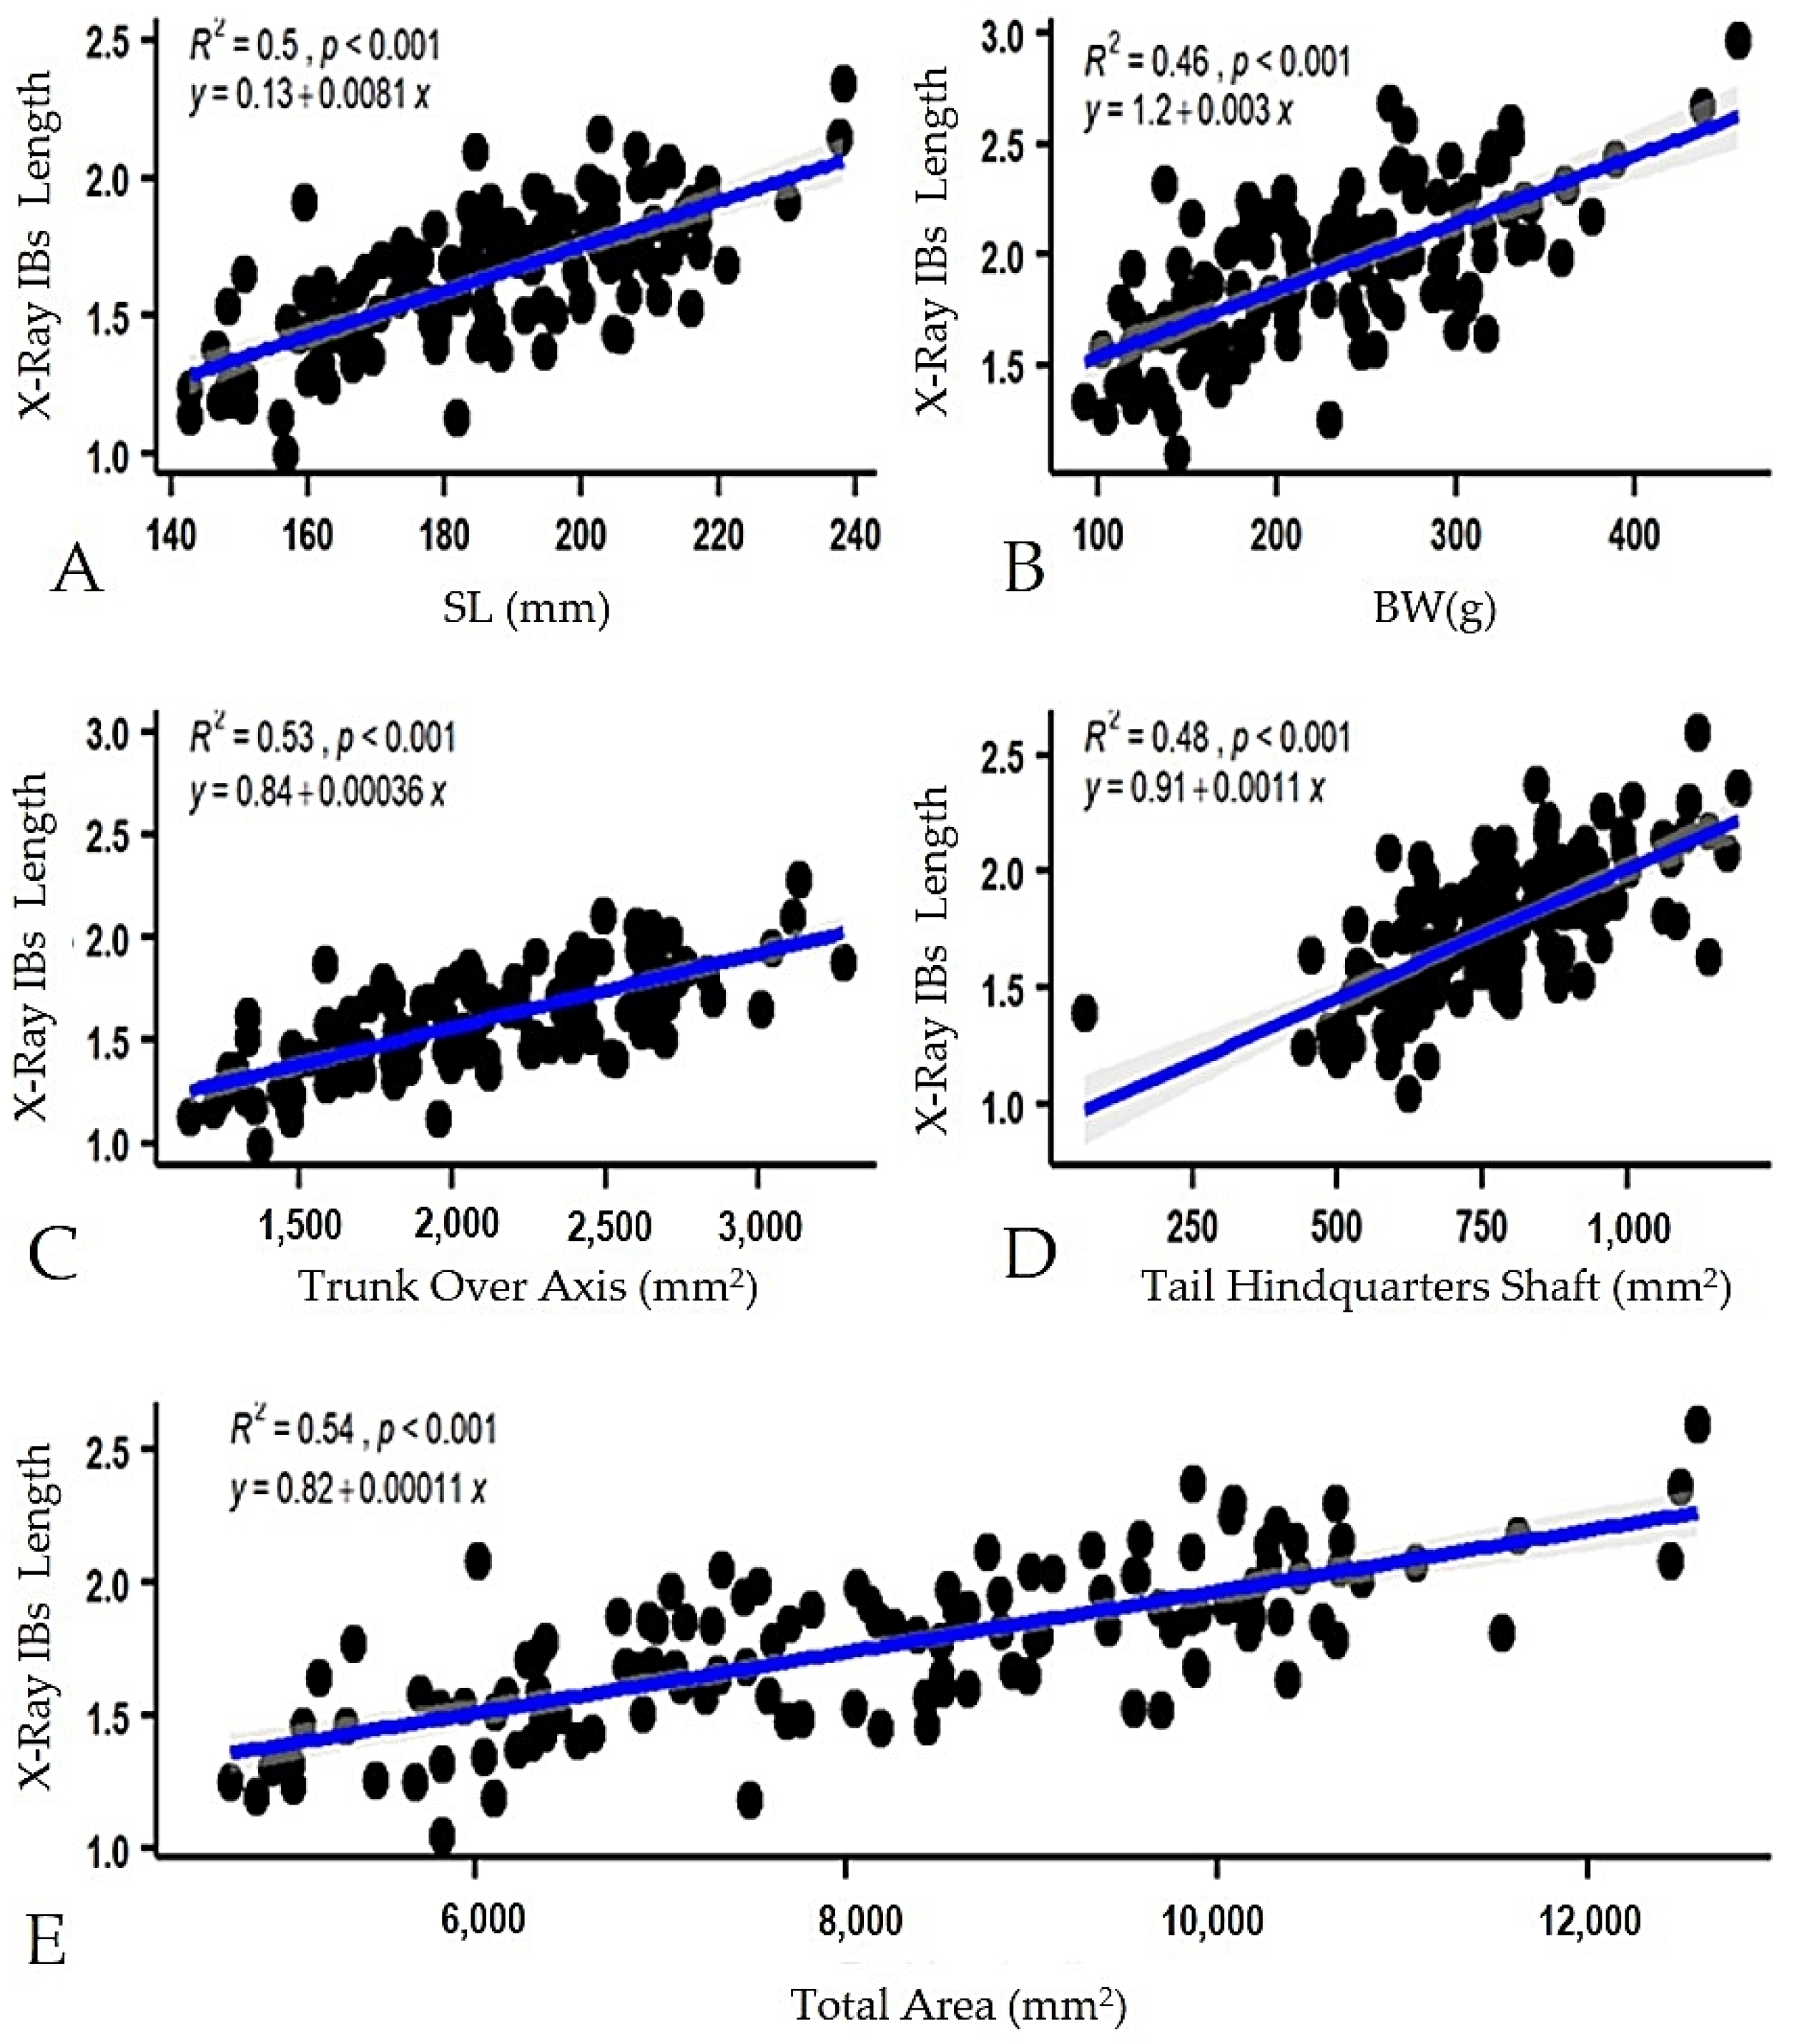
3.2. Predictive Models of IBs Based on X-ray Imaging in Tambaqui
4. Discussion
5. Conclusions
Supplementary Materials
Author Contributions
Funding
Institutional Review Board Statement
Data Availability Statement
Acknowledgments
Conflicts of Interest
References
- Oken, E.; Choi, A.L.; Karagas, M.R.; Mariën, K.; Rheinberger, C.M.; Schoeny, R.; Sunderland, E.; Korrick, S. Which fish should I eat? Perspectives influencing fish consumption choices. Environ. Health Perspect. 2012, 120, 790–798. [Google Scholar] [CrossRef] [PubMed]
- Zeng, L.; Ruan, M.; Liu, J.; Wilde, P.; Naumova, E.N.; Mozaffarian, D.; Zhang, F.F. Trends in processed meat, unprocessed red meat, poultry, and fish consumption in the United States, 1999–2016. J. Acad. Nutr. Diet. 2019, 119, 1085–1098. [Google Scholar] [CrossRef] [PubMed]
- Guillen, J.; Natale, F.; Carvalho, N.; Casey, J.; Hofherr, J.; Druon, J.N.; Fiore, G.; Gibin, M.; Zanzi, A.; Martinsohn, J.T. Global seafood consumption footprint. Ambio 2019, 48, 111–122. [Google Scholar] [CrossRef] [PubMed]
- St Louis, T.J.; Pedroza-Filho, M.X.; Flores, R.M.V. Consumption frequencies, determinants, and habits of aquaculture species in Brazil. Aquac. Int. 2022, 30, 919–936. [Google Scholar] [CrossRef]
- Nobile, A.B.; Cunico, A.M.; Vitule, J.R.; Queiroz, J.; Vidotto-Magnoni, A.P.; Garcia, D.A.; Orsi, M.L.; Lima, F.P.; Acosta, A.A.; Silva, R.J.; et al. Status and recommendations for sustainable freshwater aquaculture in Brazil. Rev. Aquac. 2020, 12, 1495–1517. [Google Scholar] [CrossRef]
- Cai, J.; Zhou, X.; Yan, X.; Lucente, D.; Lagana, C. Top 10 Species Groups in Global Aquaculture 2017; Fisheries and Aquaculture Department, Food and Agriculture Organization of the United Nations: Rome, Italy, 2019; 12p. [Google Scholar]
- Valladão, G.M.R.; Gallani, S.U.; Pilarski, F. South American fish for continental aquaculture. Rev. Aquac. 2016, 10, 351–369. [Google Scholar] [CrossRef]
- Goulding, M.; Carvalho, M.L. Life history and management of the tambaqui (Colossoma macropomum, Characidae): An important Amazonian food fish. Rev. Bras. Zool. 1982, 1, 107–133. [Google Scholar] [CrossRef]
- IBGE. Produção da Pecuária Municipal 2020; Instituto Brasileiro de Geografia e Estatística-IBGE: Rio de Janeiro, Brazil, 2020; pp. 1–12. [Google Scholar]
- Isaac, V.J.; Ruffino, M.L. Population dynamics of tambaqui, Colossoma macropomum Cuvier, in the Lower Amazon, Brazil. Fish. Manag. Ecol. 1996, 3, 315–333. [Google Scholar] [CrossRef]
- Prestes, L.; Barthem, R.B.; Mello-Filho, A.; Anderson, E.; Correa, S.B.; Couto, T.B.D.; Venticinque, E.; Forsberg, B.; Cañas, C.; Bentes, B.; et al. Proactively averting the collapse of Amazon fisheries based on three migratory flagship species. PLoS ONE 2022, 17, e0264490. [Google Scholar] [CrossRef]
- Val, A.L.; Oliveira, A.M. Colossoma macropomum—A tropical fish model for biology and aquaculture. J. Exp. Zool. Part A Ecol. Integr. Physiol. 2021, 335, 761–770. [Google Scholar] [CrossRef]
- Pinho, S.M.; David, L.H.; Garcia, F.; Keesman, K.J.; Portella, M.C.; Goddek, S. South American fish species suitable for aquaponics: A review. Aquac. Int. 2021, 29, 1427–1449. [Google Scholar] [CrossRef]
- Pedroza-Filho, M.X.; Rodrigues, A.P.O.; Rezende, F.P. Dinâmica da produção de tambaqui e demais peixes redondos no Brasil. Bol. Ativos Aquicultura 2016, 2, 1–5. [Google Scholar]
- Hilsdorf, A.R.S.; Hallerman, E.; Valladão, G.M.R.; Zaminhan-Hassemer, M.; Hashimoto, D.T.; Dairiki, J.K.; Takahashi, L.S.; Albergaria, F.C.; Gomes, M.E.S.; Venturieri, R.L.L.; et al. The farming and husbandry of Colossoma macropomum: From Amazonian waters to sustainable production. Rev. Aquac. 2022, 14, 993–1027. [Google Scholar] [CrossRef]
- Bottino, F.O.; Rodrigues, B.L.; Ribeiro, J.D.N.; Lázaro, C.A.L.T.; Conte-Junior, C.A. Influence of uv-c radiation on shelf life of vacuum package tambacu (Colossoma macropomum X Piaractus mesopotamicus) fillets. J. Food Process. Preserv. 2017, 41, e13003. [Google Scholar] [CrossRef]
- Patterson, C.; Johnson, G.D. The intermuscular bones and ligaments of teleostean fishes. Smithson. Contrib. Zool. 1995, 559, 1–84. [Google Scholar] [CrossRef]
- Nie, C.H.; Hilsdorf, A.W.S.; Wan, S.M.; Gao, Z.X. Understanding the development of intermuscular bones in teleost: Status and future directions for aquaculture. Rev. Aquac. 2020, 12, 759–772. [Google Scholar] [CrossRef]
- Yao, W.; Lv, Y.; Gong, X.; Wu, J.; Bao, B. Different ossification patterns of intermuscular bones in fish with different swimming modes. Biol. Open 2015, 4, 1727–1732. [Google Scholar] [CrossRef]
- Li, B.; Zhang, Y.W.; Liu, X.; Ma, L.; Yang, J.X. Molecular mechanisms of intermuscular bone development in fish: A review. Zool. Res. 2021, 42, 362–376. [Google Scholar] [CrossRef]
- Mehar, M.; Mekkawy, W.; McDougall, C.; Benzie, J.A. Preferences for rohu fish (L. rohita) traits of women and men from farming households in Bangladesh and India. Aquaculture 2022, 547, 737480. [Google Scholar] [CrossRef]
- Mubango, E.; Tavakoli, S.; Liu, Y.; Zheng, Y.; Huang, X.; Benjakul, S.; Yuqing, T.; Luo, Y.; Hong, H. Intermuscular Bones in Asian Carps: Health Threats, Solutions, and Future Directions. Rev. Fish. Sci. Aquac. 2022, 31, 233–258. [Google Scholar] [CrossRef]
- Cao, D.C.; Kuang, Y.Y.; Zheng, X.H.; Tong, G.X.; Li, C.T.; Sun, X.W. Comparative analysis of intermuscular bones in three strains of common carp. J. Appl. Ichthyol. 2015, 31, 32–36. [Google Scholar] [CrossRef]
- Sahu, B.B.; Samal, R.P.; Raghunath, M.R.; Mohanty, S.; Adhikari, S.; Sahu, A.K.; Jayashankar, P. Record of skeletal system and pin bones in table size Indian major carps: Rohu (Labeo rohita, Hamilton 1822), catla (Catla catla, Hamilton 1822) and mrigal (Cirrhinus mrigala Hamilton 1822). World J. Fish Mar. Sci. 2012, 4, 382–385. [Google Scholar]
- Sahu, B.B.; Pati, M.K.; Barik, N.K.; Routray, P.; Ferosekhan, S.; Senapati, D.K.; Jayasankar, P. Record of skeletal system and pin bones in table size Hilsa Tenualosa ilisha (Hamilton, 1822). World J. Fish Mar. Sci. 2014, 6, 241–244. [Google Scholar]
- Li, L.; Zhong, Z.; Zeng, M.; Liu, S.; Zhou, Y.; Xiao, J.; Wang, J.; Liu, Y. Comparative analysis of intermuscular bones in fish of different ploidies. Sci. China Life Sci. 2013, 55, 341–350. [Google Scholar] [CrossRef]
- Perazza, C.A.; Menezes, J.T.B.; Ferraz, J.B.S.; Pinaffi, F.L.V.; Silva, L.A.; Hilsdorf, A.W.S. Lack of intermuscular bones in specimens of Colossoma macropomum: An unusual phenotype to be incorporated into genetic improvement programs. Aquaculture 2017, 472, 57–60. [Google Scholar] [CrossRef]
- Cabello, A.; Figuera, B.; Vallenilla, O.; Martínez, M.I. Optimizing commercial boning process for tambaqui. Glob. Aquac. Advocate 2003, 4, 66–68. [Google Scholar]
- Yap, W.G.; Villaluz, A.C.; Soriano, M.G.G.; Santos, M.N. Milkfish production and processing technologies in the Philippines. Milkfish Proj. Publ. Ser. 2007, 2, 96. [Google Scholar]
- Nunes, J.R.S.; Pértille, F.; Andrade, S.C.S.; Perazza, C.A.; Villela, P.M.S.; Almeida-Val, V.M.F.; Gao, Z.X.; Coutinho, L.L.; Hilsdorf, A.W.S. Genome-wide association study reveals genes associated with the absence of intermuscular bones in tambaqui (Colossoma macropomum). Anim. Genet. 2020, 51, 899–909. [Google Scholar] [CrossRef]
- Perazza, C.A.; Ferraz, J.B.S.; Almeida-Val, V.M.F.; Hilsdorf, A.W.S. Genetic parameters for loin eye area and other body traits of an important Neotropical aquaculture species, Colossoma macropomum (Cuvier, 1818). Aquac. Res. 2019, 50, 2907–2916. [Google Scholar] [CrossRef]
- Chen, J.; Guo, J.; Wang, Z.Q.; Wang, W.M. Morphological variation among the four Megalobrama species inferred by X-ray photography. Aquac. Res. 2020, 51, 3999–4010. [Google Scholar] [CrossRef]
- R Core Team. R: A Language and Environment for Statistical Computing; R Foundation for Statistical Computing: Vienna, Austria, 2022. [Google Scholar]
- Chen, Y.; Wan, S.M.; Li, Q.; Dong, X.; Diao, J.; Liao, Q.; Wang, G.Y.; Gao, Z.X. Genome-Wide Integrated Analysis Revealed Functions of lncRNA–miRNA–mRNA Interaction in Growth of Intermuscular Bones in Megalobrama amblycephala. Front. Cell Dev. Biol. 2021, 8, 1–15. [Google Scholar] [CrossRef] [PubMed]
- Nie, C.; Wan, S.; Chen, Y.; Zhu, D.; Wang, X.; Dong, X.; Gao, Z.X. Loss of scleraxis leads to distinct reduction of mineralized intermuscular bone in zebrafish. Aquac. Fish. 2021, 6, 169–177. [Google Scholar] [CrossRef]
- Zhou, J.J.; Chang, Y.J.; Chen, Y.L.; Wang, X.D.; Liao, Q.; Shi, R.H.; Gao, Z.X. Comparison of Myosepta Development and Transcriptome Profiling between Blunt Snout Bream with and Tilapia without Intermuscular Bones. Biology 2021, 10, 1311. [Google Scholar] [CrossRef] [PubMed]
- Xu, X.F.; Zheng, J.B.; Qian, Y.Q.; Luo, C. Normally grown and developed intermuscular bone-deficient mutant in grass carp, Ctenopharyngodon idellus. Chin. Sci. Bull. 2015, 60, 52–57. [Google Scholar]
- Bronze, E. Investigação de Mecanismos Genéticos Associados às vias de Formação de Ossos Intermusculares no Tambaqui (Colossoma macropomum); UNESP: Botucatu, Brazil, 2020. [Google Scholar]
- Moav, R.; Finkel, A.; Wohlfarth, G. Variability of intermuscular bones, vertebrae, ribs, dorsal fin rays and skeletal disorders in the common carp. Theor. Appl. Genet. 1975, 46, 33–43. [Google Scholar] [CrossRef] [PubMed]
- Yang, K.; Jiang, W.; Wang, X.; Zhang, Y.; Pan, X.; Yang, J. Evolution of the intermuscular bones in the Cyprinidae (Pisces) from a phylogenetic perspective. Ecol. Evol. 2019, 9, 8555–8566. [Google Scholar] [CrossRef]
- Guo, H.H.; Zheng, G.D.; Wu, C.B.; Jiang, X.Y.; Zou, S.M. Comparative analysis of the growth performance and intermuscular bone traits in F1 hybrids of black bream (Megalobrama terminalis)(♀) × topmouth culter (Culter alburnus)(♂). Aquaculture 2018, 492, 15–23. [Google Scholar] [CrossRef]
- Kuang, Y.; Zheng, X.; Cao, D.; Sun, Z.; Tong, G.; Xu, H.; Yan, T.; Tang, S.; Chen, Z.; Zhang, T.; et al. Generate a new crucian carp (Carassius auratus) strain without intermuscular bones by knocking out bmp6. Aquaculture 2023, 569, 739407. [Google Scholar] [CrossRef]
- Xiong, X.M.; Robinson, N.A.; Zhou, J.J.; Chen, Y.L.; Wang, W.; Wang, X.B.; Gao, Z.X. Genetic parameter estimates for intermuscular bone in blunt snout bream (Megalobrama amblycephala) based on a microsatellite-based pedigree. Aquaculture 2019, 502, 371–377. [Google Scholar] [CrossRef]
- Yang, J.; Tong, G.; Zheng, X.; Sun, Z.; Lyu, W.; Sun, X.; Kuang, Y.Y. Comparative analysis of embryonic muscle development in wildtype zebrafish and its intermuscular bone deficiency mutant. J. Fish. Sci. China 2019, 26, 296–303. [Google Scholar] [CrossRef]
- Danos, N.; Ward, A.B. The homology and origins of intermuscular bones in fishes: Phylogenetic or biomechanical determinants? Biol. J. Linn. Soc. 2012, 106, 607–622. [Google Scholar] [CrossRef]
- Wan, S.M.; Xiong, X.M.; Tomljanović, T.; Chen, Y.L.; Liu, H.; Treer, T.; Gao, Z.X. Identification and mapping of SNPs associated with number of intermuscular bone in blunt snout bream. Aquaculture 2019, 507, 75–82. [Google Scholar] [CrossRef]
- Xiong, X.M.; Huang, W.J.; Dong, Q.; Zhang, D.Y.; Wan, S.M.; Gao, Z.X. Genetic parameter estimates for intermuscular bone trait in grass carp (Ctenopharyngodon idella). Aquaculture 2023, 563, 739011. [Google Scholar] [CrossRef]


| Variable | Mean | SD | Min | Max | SE |
|---|---|---|---|---|---|
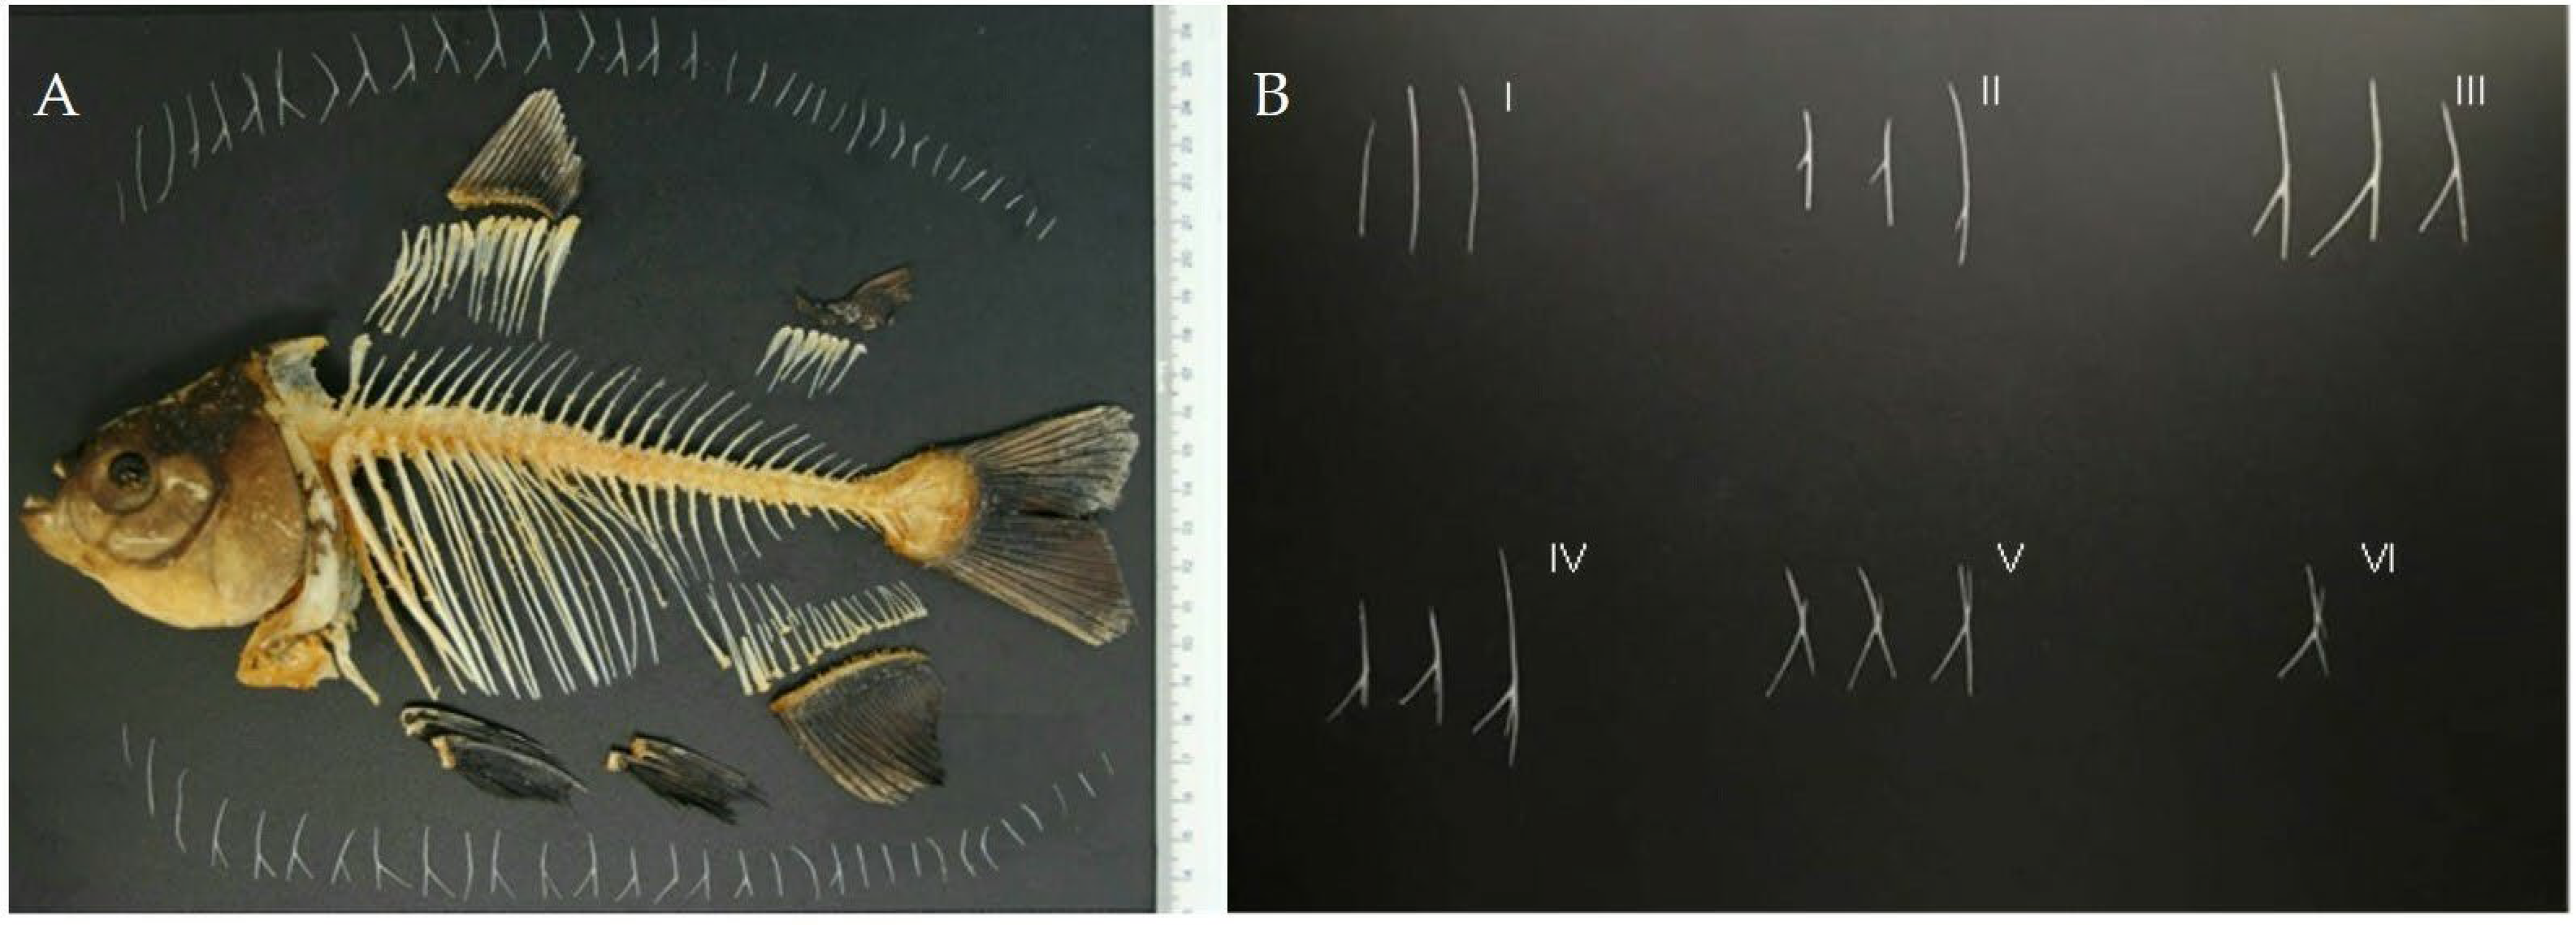
| Type I-I | 22.520 | 5.753 | 6 | 32 | 0.51 |
| Type II-卜 | 3.016 | 4.008 | 0 | 17 | 0.356 |
| Type III-Y | 1.449 | 1.602 | 0 | 9 | 0.142 |
| Variable | Mean | SD | Min | Max | SE |
|---|---|---|---|---|---|
| Body Weight (g) | 228.862 | 78.931 | 92.700 | 457.500 | 7.117 |
| IBs Length by Dissection (mm) | 9.396 | 1.636 | 5.218 | 15.422 | 0.145 |
| IBs Length by X-ray (mm) | 6.167 | 1.880 | 2.860 | 13.869 | 0.167 |
| Standard Length (mm) | 185.471 | 22.135 | 142.680 | 238.250 | 1.964 |
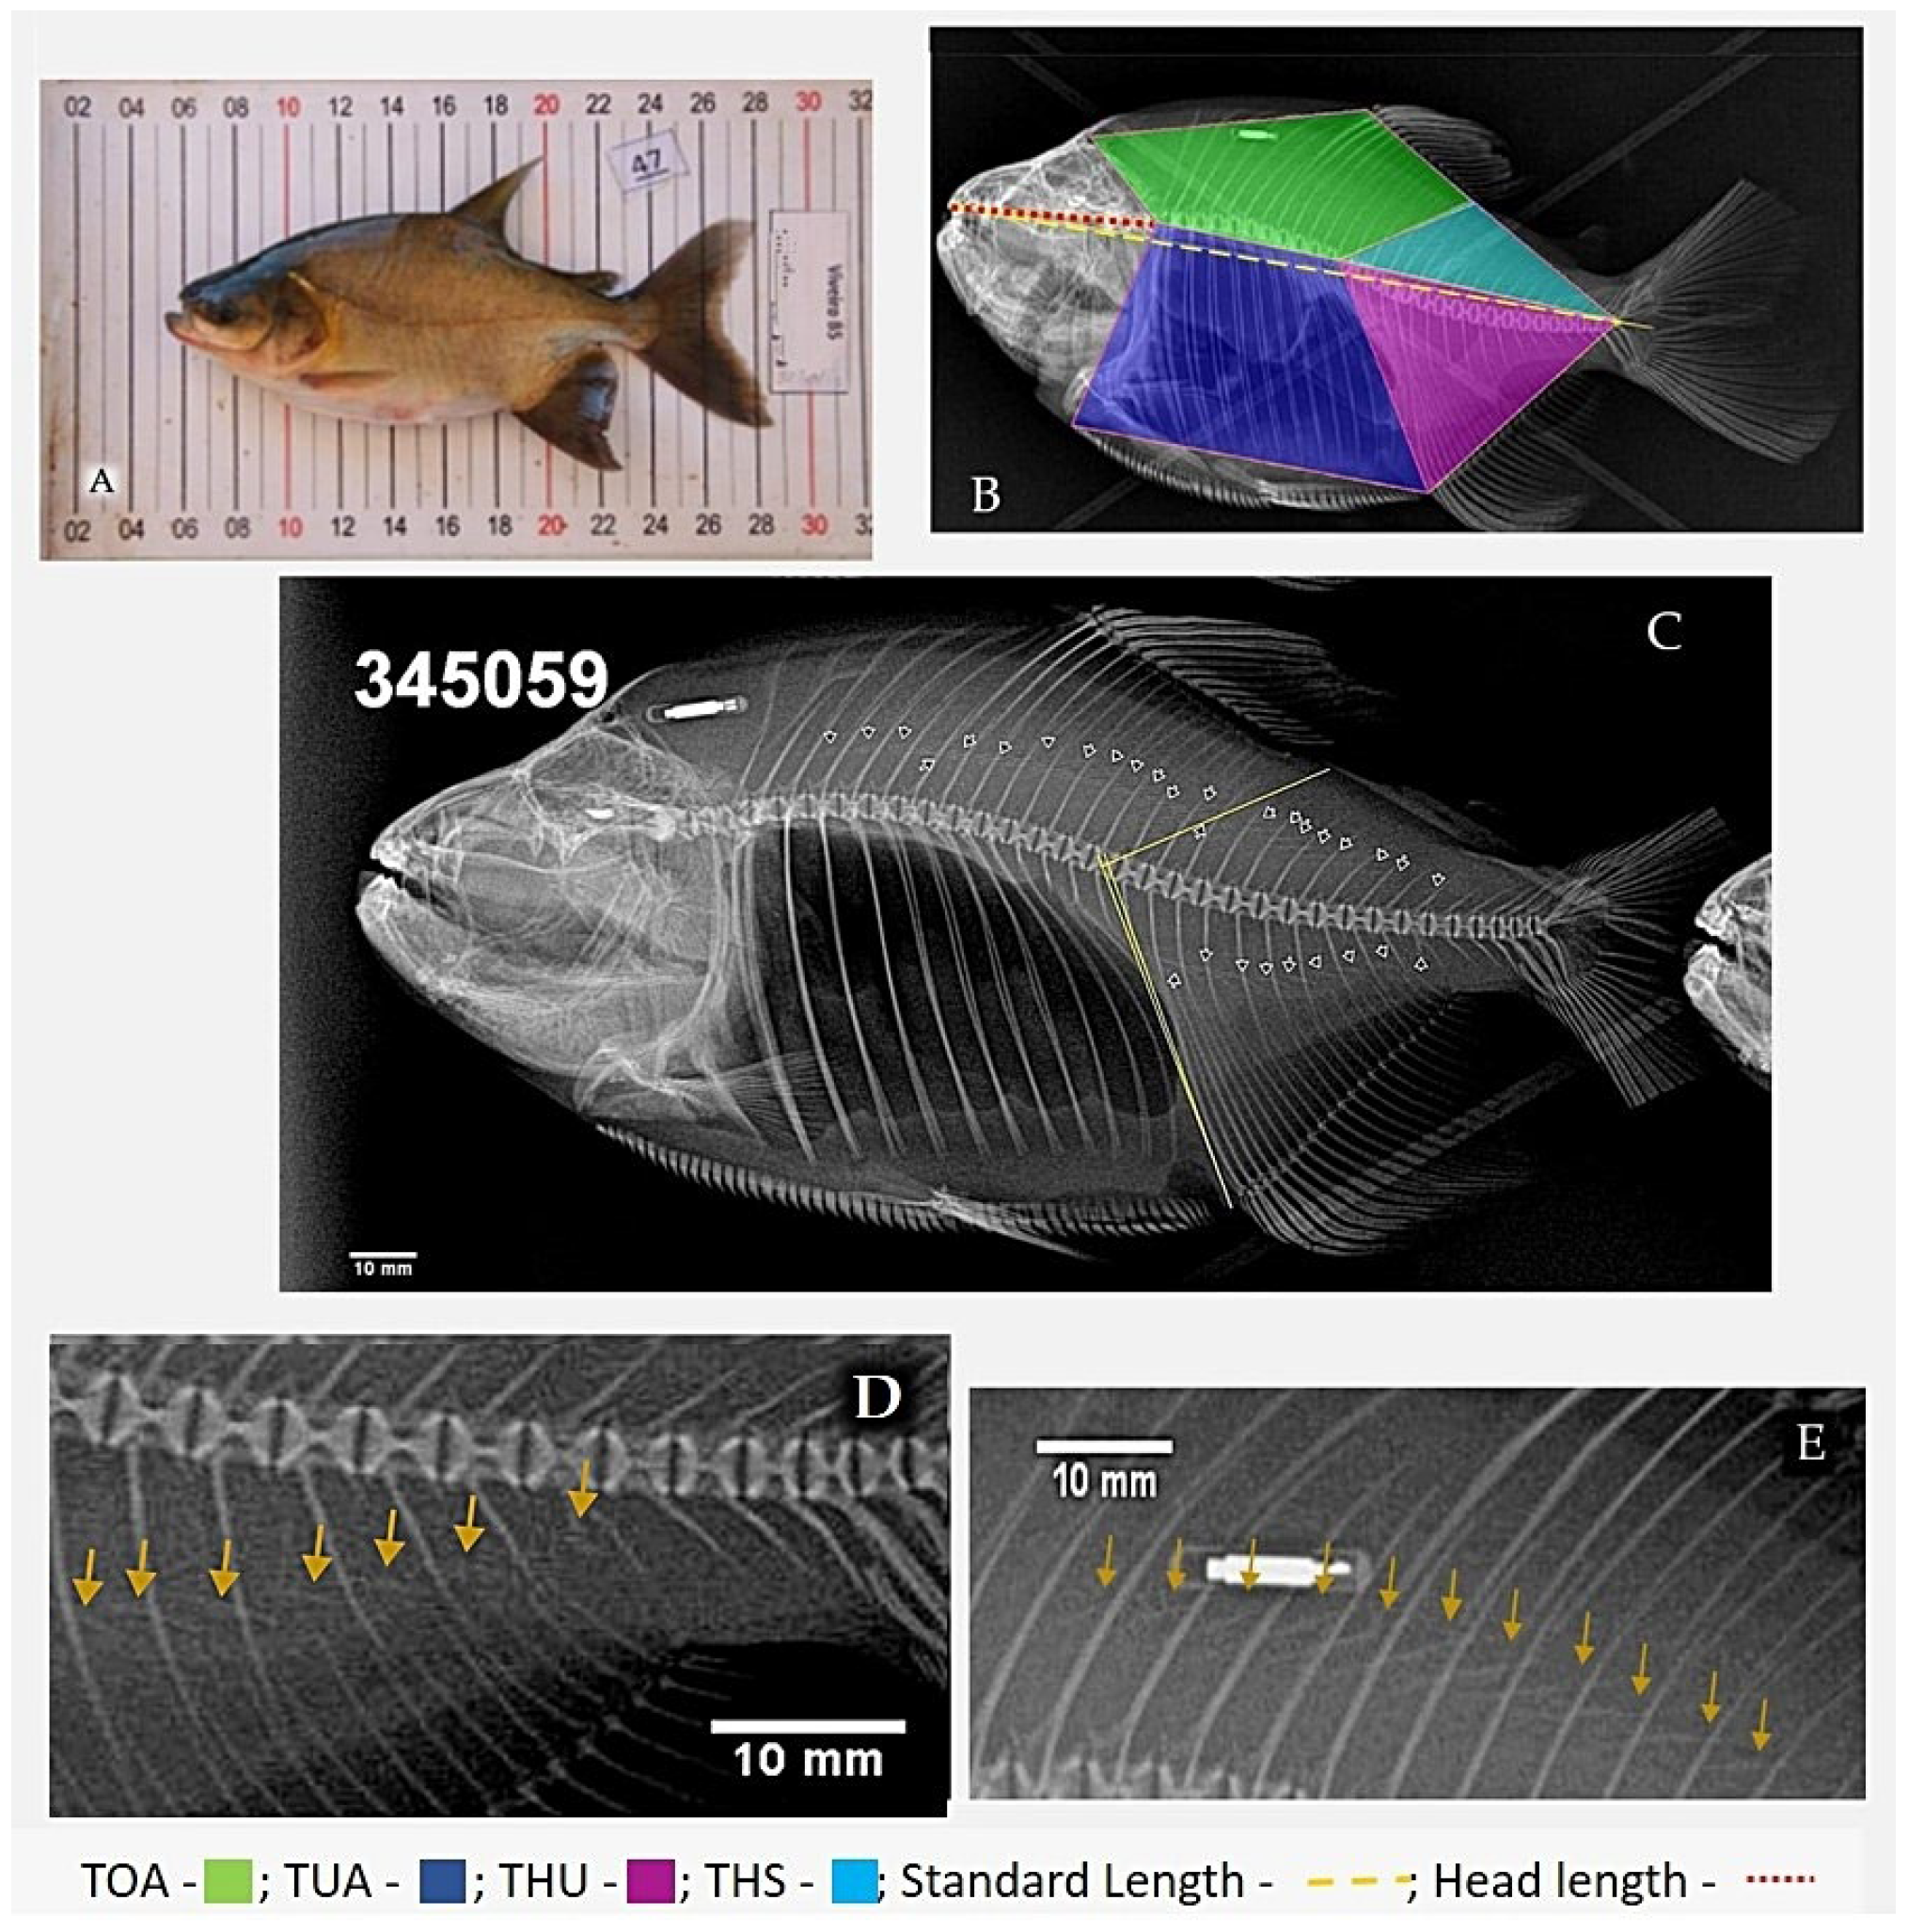
| Tail Hindquarters Shaft (mm2)—THS | 772.813 | 183.618 | 64.067 | 1191.050 | 16.294 |
| Tail Hindquarters Under Shaft (mm2)—THU | 1715.700 | 410.774 | 949.071 | 2718.651 | 36.450 |
| Total Area (mm2) | 8170.548 | 1891.288 | 4679.412 | 12,591.210 | 167.825 |
| Total Number of IBs by dissection | 27.362 | 5.700 | 4.000 | 36.000 | 0.506 |
| Total Number of IBs by X-ray | 26.976 | 6.031 | 7.000 | 37.000 | 0.535 |
| Trunk Over Axis (mm2)—TOA | 2119.292 | 496.044 | 1142.359 | 3275.996 | 44.017 |
| Trunk Under Axis (mm2)—TUA | 3562.743 | 835.990 | 2063.433 | 5618.769 | 74.182 |
Disclaimer/Publisher’s Note: The statements, opinions and data contained in all publications are solely those of the individual author(s) and contributor(s) and not of MDPI and/or the editor(s). MDPI and/or the editor(s) disclaim responsibility for any injury to people or property resulting from any ideas, methods, instructions or products referred to in the content. |
© 2023 by the authors. Licensee MDPI, Basel, Switzerland. This article is an open access article distributed under the terms and conditions of the Creative Commons Attribution (CC BY) license (https://creativecommons.org/licenses/by/4.0/).
Share and Cite
Oliveira, N.F.A.; Torati, L.S.; Borin-Carvalho, L.A.; de Lima, L.K.F.; Puvanendran, V.; Demiciano, T.H.; da Silva, J.J.T.; Barroso, A.d.S.; Varela, E.S. Fish Size Correlates to Size and Morphology of Intermuscular Bones in Tambaqui Colossoma macropomum as Shown by Dissection and X-ray Imaging Methods. Fishes 2023, 8, 180. https://doi.org/10.3390/fishes8040180
Oliveira NFA, Torati LS, Borin-Carvalho LA, de Lima LKF, Puvanendran V, Demiciano TH, da Silva JJT, Barroso AdS, Varela ES. Fish Size Correlates to Size and Morphology of Intermuscular Bones in Tambaqui Colossoma macropomum as Shown by Dissection and X-ray Imaging Methods. Fishes. 2023; 8(4):180. https://doi.org/10.3390/fishes8040180
Chicago/Turabian StyleOliveira, Naislan F. A., Lucas S. Torati, Luciana A. Borin-Carvalho, Leandro K. F. de Lima, Velmurugu Puvanendran, Thaís H. Demiciano, José J. T. da Silva, Aurisan da S. Barroso, and Eduardo S. Varela. 2023. "Fish Size Correlates to Size and Morphology of Intermuscular Bones in Tambaqui Colossoma macropomum as Shown by Dissection and X-ray Imaging Methods" Fishes 8, no. 4: 180. https://doi.org/10.3390/fishes8040180