
Selection and Verification of Reference Genes for Gene Expression Studies in Different Cell Lines of Golden Pompano (Trachinotus ovatus)


Abstract
:
1. Introduction
2. Materials and Methods
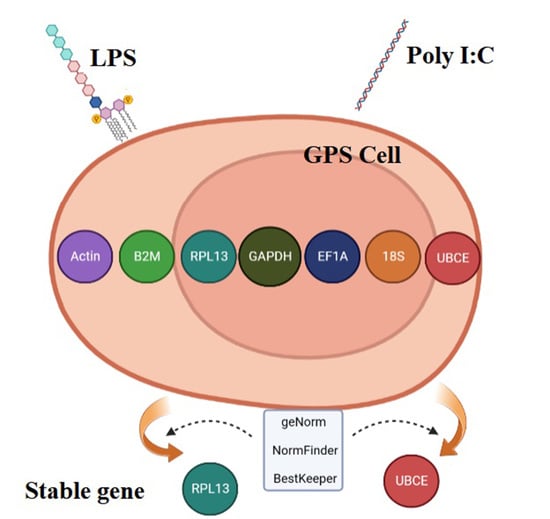
2.1. Cell Culture and Stimulation
2.2. Total RNA Extraction and cDNA Synthesis
2.3. Reference Gene Primers Design and Amplification Efficiency
2.4. qRT-PCR and Data Processing
2.5. Stability Verification of Internal Reference Genes
3. Results
3.1. qRT-PCR Efficiency and Quality
3.2. Threshold Cycle (Ct) Value Analysis
3.2.1. Expression Abundance of Reference Gene Expression among GPS and GPHK Cells under Normal Physiological Conditions
3.2.2. Expression Abundance of Reference Gene Expression among GPS and GPHK Cells under LPS Stimulating Condition
3.2.3. Expression Abundance of Reference Gene Expression among GPS and GPHK Cells under Poly I:C Stimulating Condition
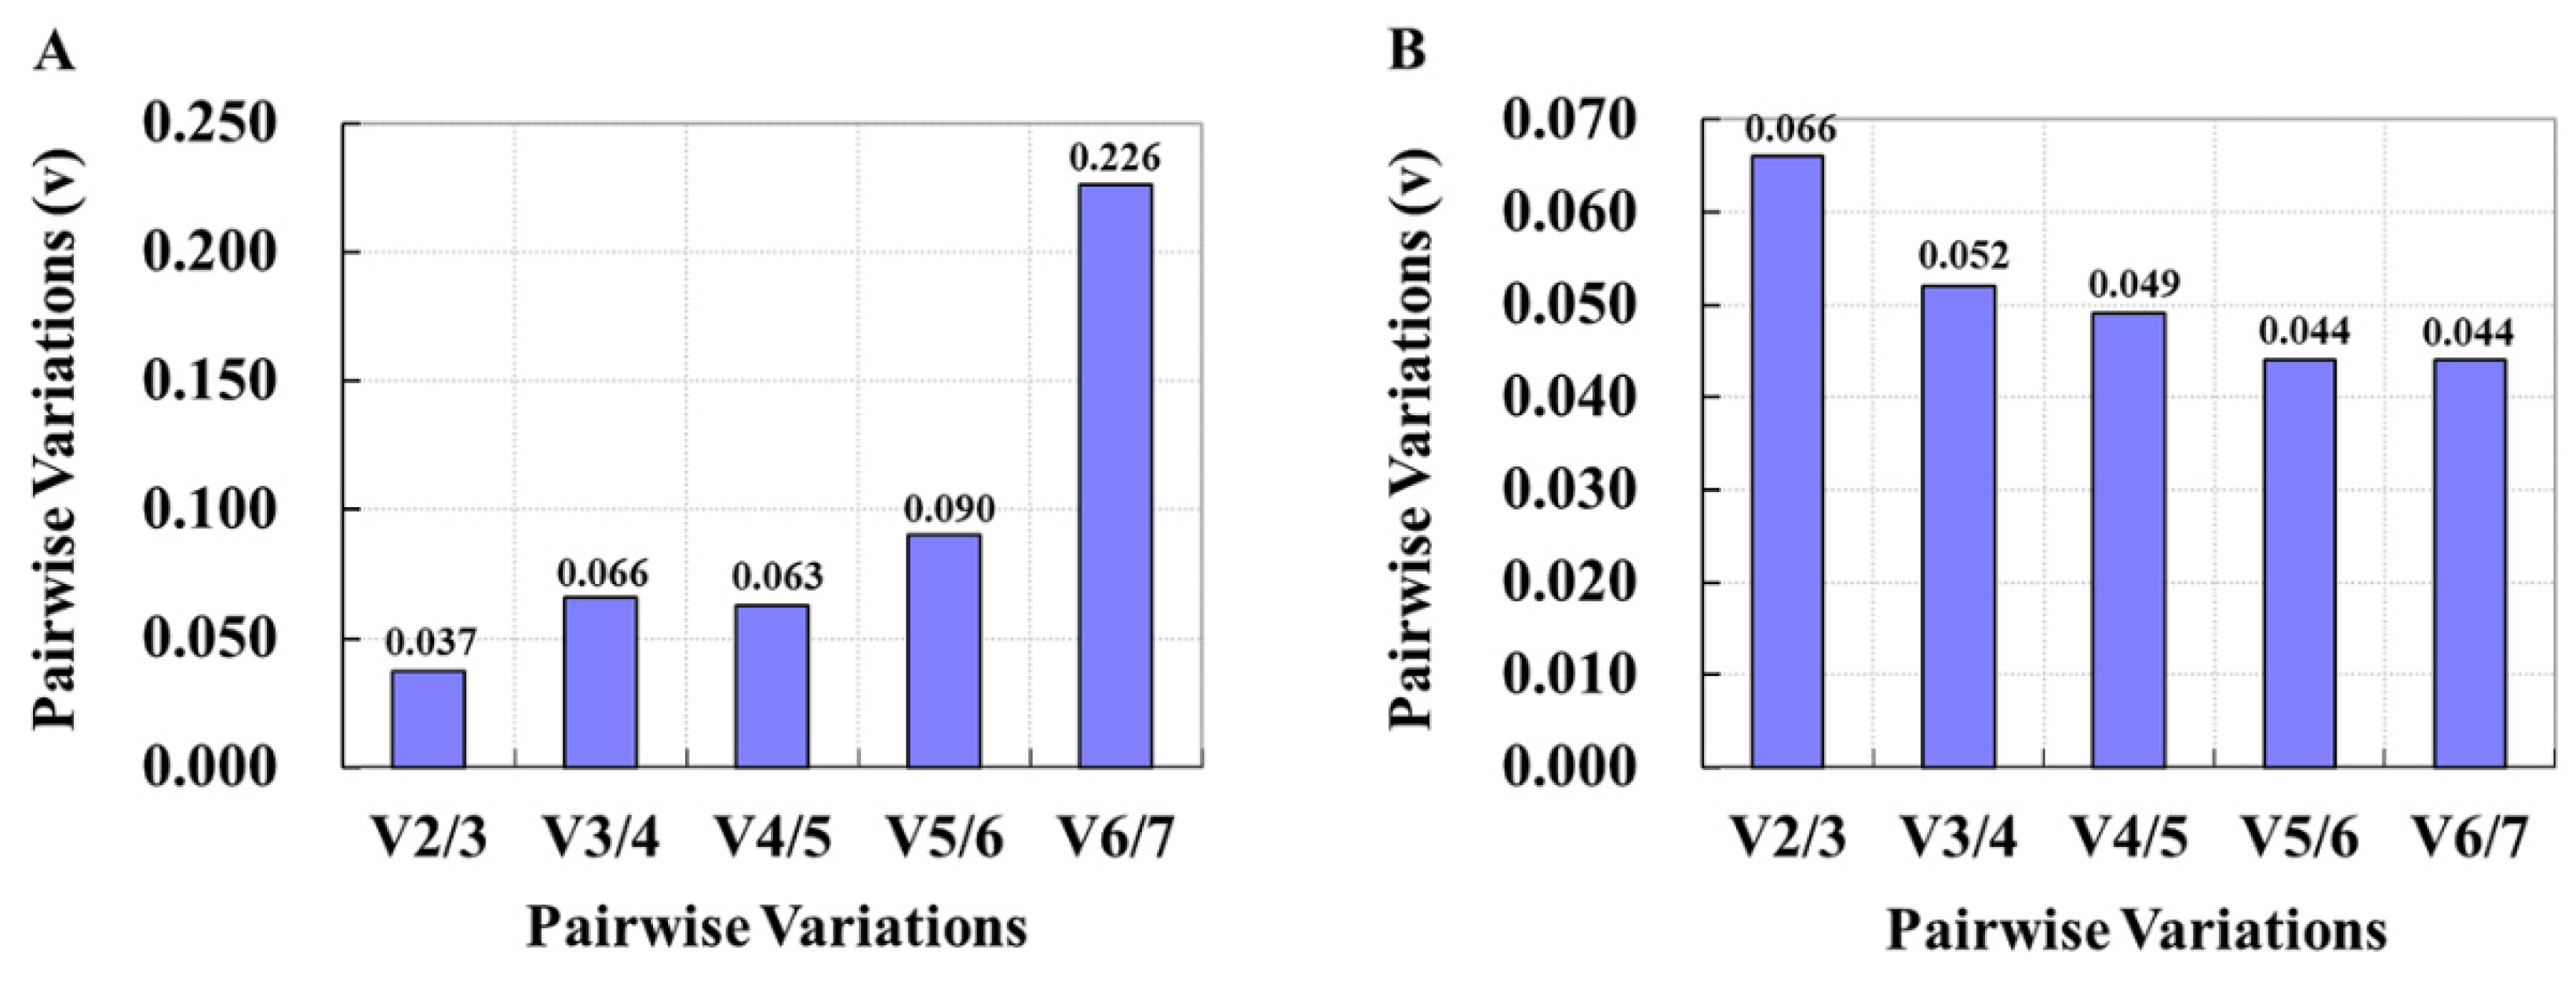
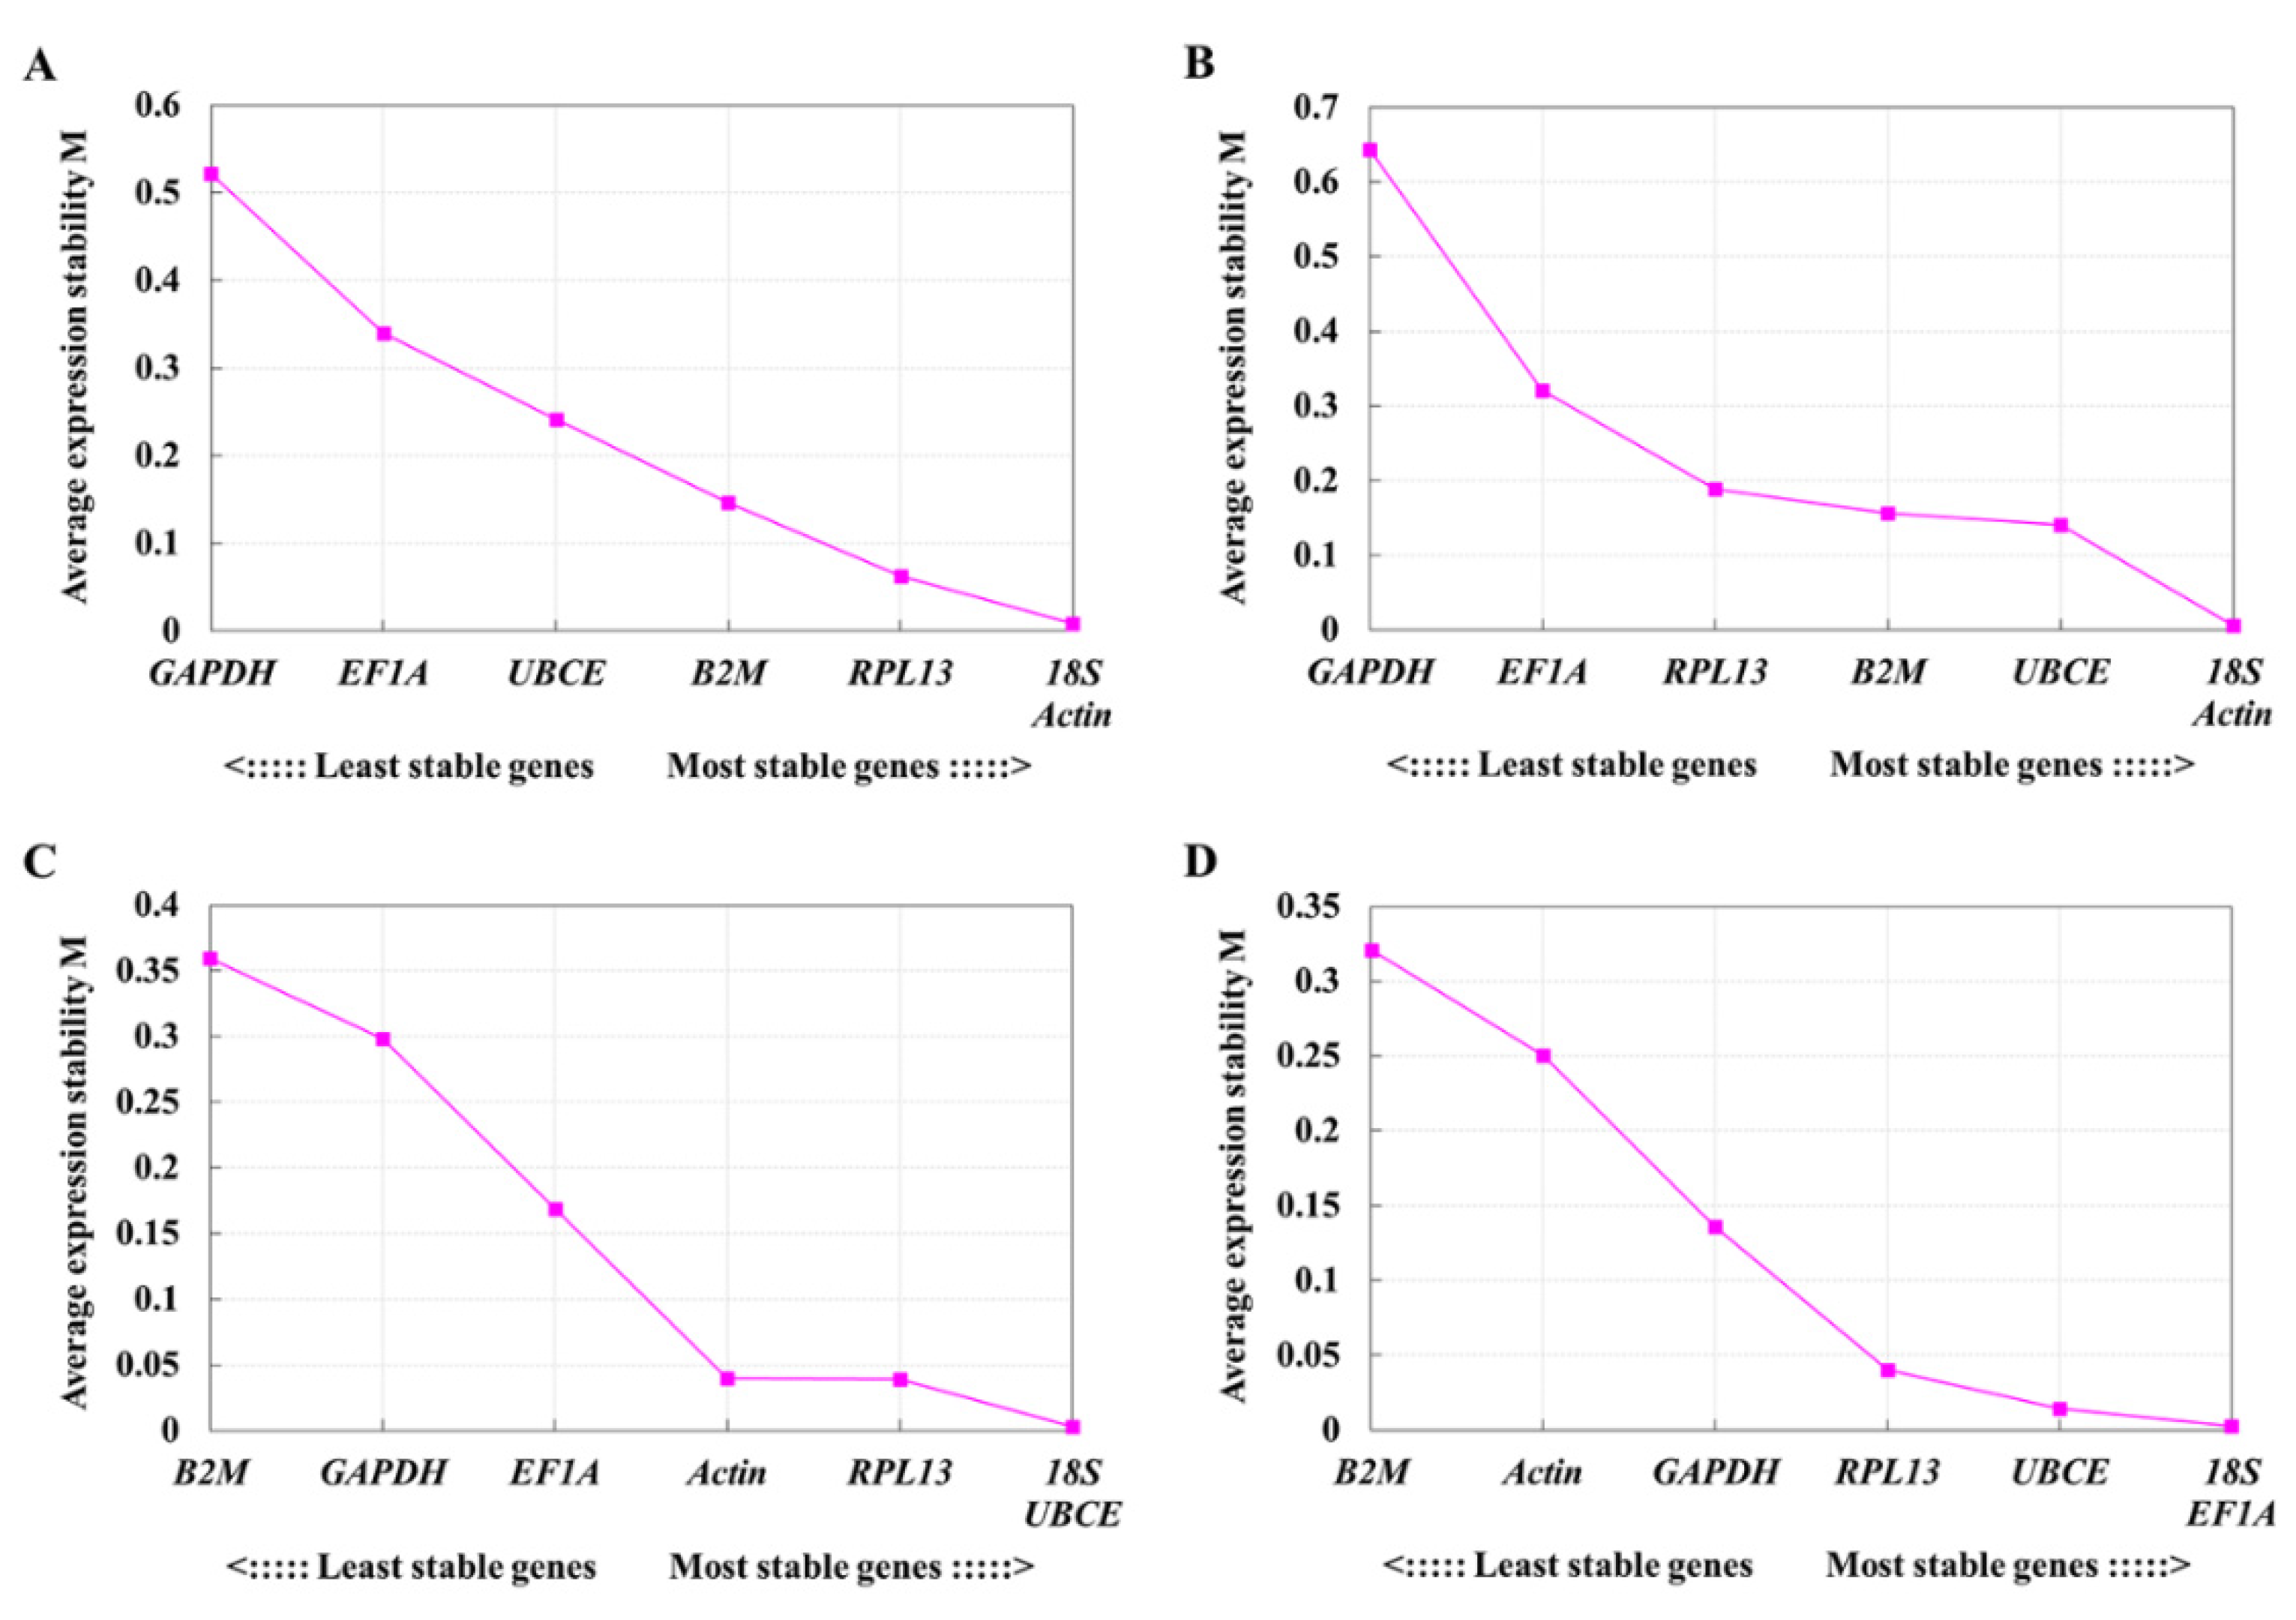
3.3. geNorm, NormFinder and BestKeeper Analysis
3.3.1. Stability of Reference Gene Expression in GPS and GPHK Cells under Normal Physiological Conditions
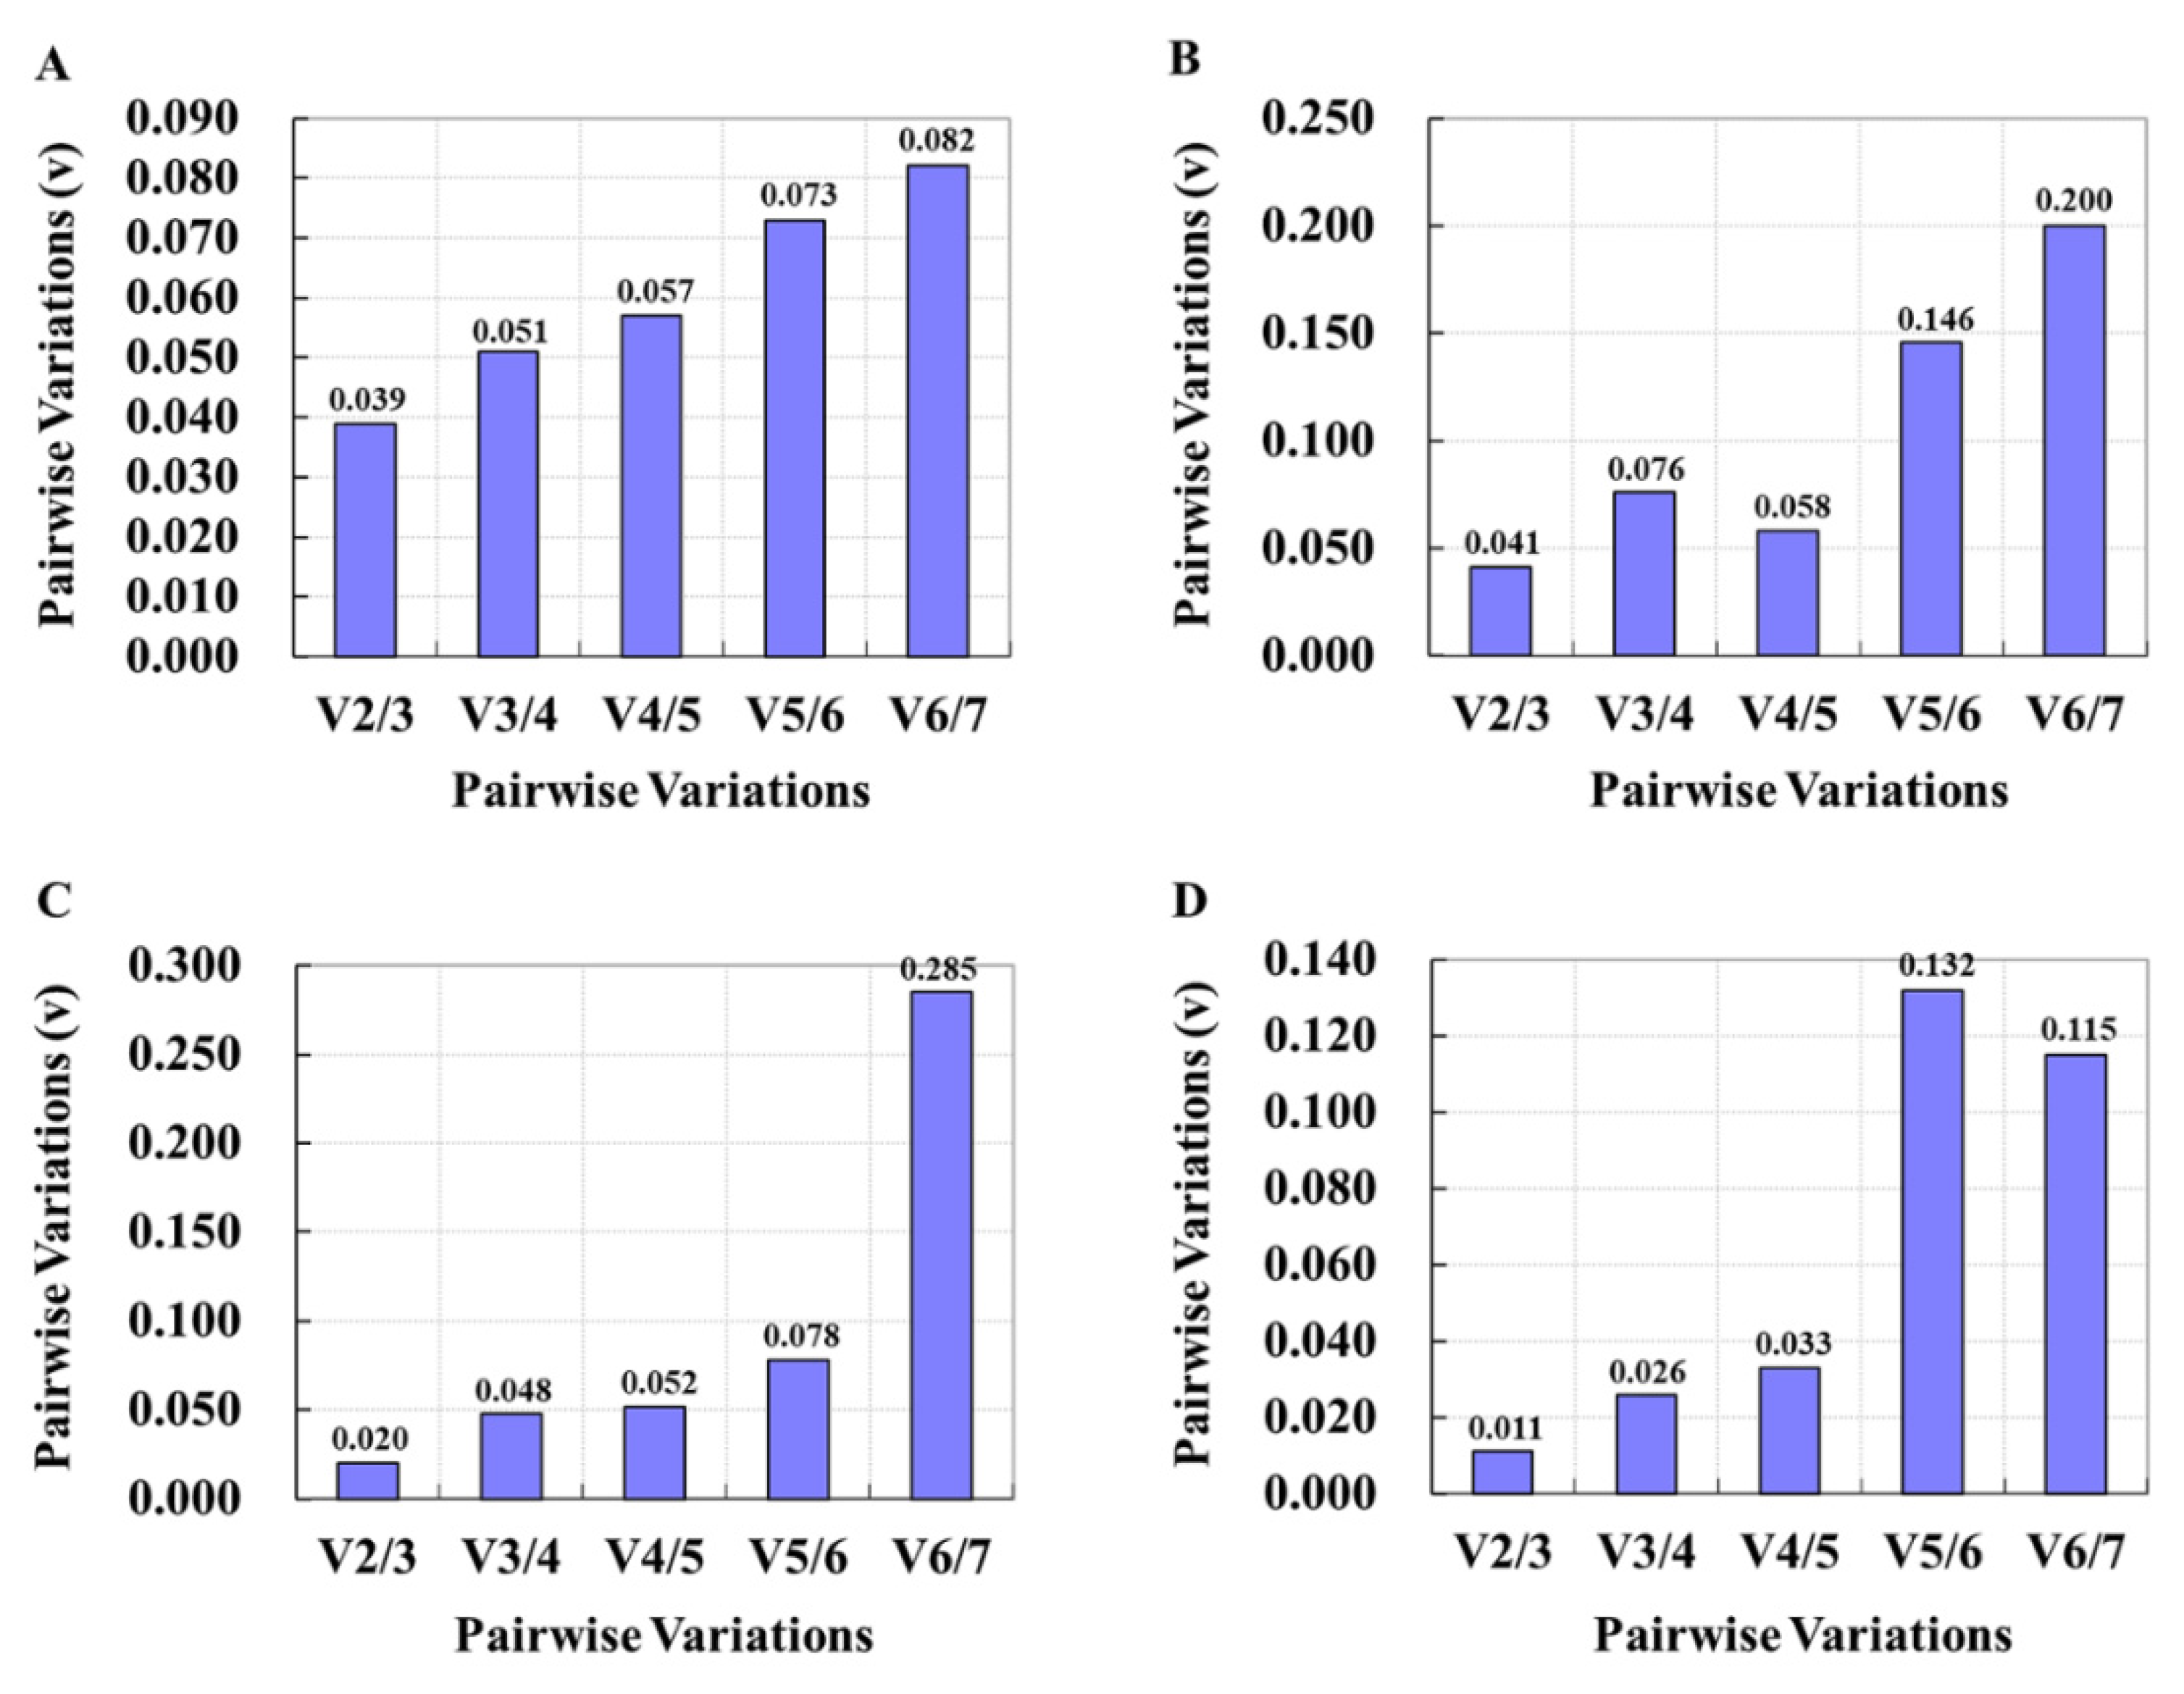
3.3.2. Stability of Reference Gene Expression in GPS and GPHK Cells under LPS Stimulating Condition
3.3.3. Stability of Reference Gene Expression in GPS and GPHK Cells under Poly I:C Stimulating Condition
3.4. Verification of Screened Reference Genes
4. Discussion
5. Conclusions
Supplementary Materials
Author Contributions
Funding
Institutional Review Board Statement
Data Availability Statement
Conflicts of Interest
References
- Walker, N.J. A Technique Whose Time Has Come. Science 2002, 296, 557–559. [Google Scholar] [CrossRef] [PubMed]
- Gachon, C.; Mingam, A.; Charrier, B. Real-time PCR: What Relevance to Plant Studies? J. Exp. Bot. 2004, 55, 1445–1454. [Google Scholar] [CrossRef] [Green Version]
- Bustin, S.A.; Benes, V.; Nolan, T.; Pfaffl, M.W. Quantitative Real-Time RT-PCR—A Perspective. J. Mol. Endocrinol. 2005, 34, 597–601. [Google Scholar] [CrossRef] [PubMed] [Green Version]
- Chi, C.; Shen, Y.; Yin, L.; Ke, X.; Han, D.; Zuo, Y. Selection and Validation of Reference Genes for Gene Expression Analysis in Vigna angularis Using Quantitative Real-Time RT-PCR. PLoS ONE 2016, 11, e0168479. [Google Scholar] [CrossRef] [Green Version]
- Heid, C.A.; Stevens, J.; Livak, K.J.; Williams, P.M. Real Time Quantitative PCR. Genome Res. 1996, 6, 986–994. [Google Scholar] [CrossRef] [Green Version]
- Yoo, W.G.; Kim, T.I.; Li, S.; Kwon, O.S.; Cho, P.Y.; Kim, T.S.; Kim, K.; Hong, S.J. Reference Genes for Quantitative Analysis on Clonorchis Sinensis Gene Expression by Real-Time PCR. Parasitol. Res. 2009, 104, 321–328. [Google Scholar] [CrossRef] [PubMed]
- Vandesompele, J.; De Preter, K.; Pattyn, F.; Poppe, B.; Van Roy, N.; De Paepe, A.; Speleman, F. Accurate Normalization of Real-Time Quantitative RT-PCR Data by Geometric Averaging of Multiple Internal Control Genes. Genome Biol. 2002, 3, research0034. [Google Scholar] [CrossRef] [PubMed] [Green Version]
- Park, S.J.; Huh, J.W.; Kim, Y.H.; Lee, S.R.; Kim, S.H.; Kim, S.U.; Kim, H.S.; Kim, M.K.; Chang, K.T. Selection of Internal Reference Genes for Normalization of Quantitative Reverse Transcription Polymerase Chain Reaction (qRT-PCR) Analysis in the Canine Brain and Other Organs. Mol. Biotechnol. 2013, 54, 47–57. [Google Scholar] [CrossRef] [PubMed]
- Bustin, S.A. Absolute Quantification of mRNA Using Real-Time Reverse Transcription Polymerase Chain Reaction Assays. J. Mol. Endocrinol. 2000, 25, 169–193. [Google Scholar] [CrossRef] [Green Version]
- Le Bail, A.; Dittami, S.M.; de Franco, P.O.; Rousvoal, S.; Cock, M.J.; Tonon, T.; Charrier, B. Normalisation Genes for Expression Analyses in the Brown Alga Model Ectocarpus siliculosus. BMC Mol. Biol. 2008, 9, 75. [Google Scholar] [CrossRef]
- Szczygieł, J.; Kamińska-Gibas, T.; Petit, J.; Jurecka, P.; Wiegertjes, G.; Irnazarow, I. Re-evaluation of Common Carp (Cyprinus carpio L.) Housekeeping Genes for Gene Expression Studies—Considering Duplicated Genes. Fish Shellfish Immunol. 2021, 115, 58–69. [Google Scholar] [CrossRef] [PubMed]
- Thellin, O.; Zorzi, W.; Lakaye, B.; De Borman, B.; Coumans, B.; Hennen, G.; Grisar, T.; Igout, A.; Heinen, E. Housekeeping Genes as Internal Standards: Use and Limits. J. Biotechnol. 1999, 75, 291–295. [Google Scholar] [CrossRef] [PubMed] [Green Version]
- Nolan, T.; Hands, R.E.; Bustin, S.A. Quantification of mRNA Using Real-Time RT-PCR. Nat. Protoc. 2006, 1, 1559–1582. [Google Scholar] [CrossRef]
- González-Verdejo, C.I.; Die, J.V.; Nadal, S.; Jiménez-Marín, A.; Moreno, M.T.; Román, B. Selection of Housekeeping Genes for Normalization by Real-Time RT–PCR: Analysis of Or-MYB1 Gene Expression in Orobanche Ramosa Development. Anal Biochem. 2008, 379, 176–181. [Google Scholar] [CrossRef] [PubMed]
- Bustin, S.A.; Benes, V.; Garson, J.A.; Hellemans, J.; Huggett, J.; Kubista, M.; Mueller, R.; Nolan, T.; Pfaffl, M.W.; Shipley, G.L.; et al. The MIQE Guidelines: Minimum Information for Publication of Quantitative Real-Time PCR Experiments. Clin. Chem. 2009, 55, 611–622. [Google Scholar] [CrossRef] [PubMed] [Green Version]
- De Spiegelaere, W.; Cornillie, P.; Van Poucke, M.; Peelman, L.; Burvenich, C.; Van den Broeck, W. Quantitative mRNA Expression Analysis in Kidney Glomeruli Using Microdissection Techniques. Histol Histopathol. 2011, 26, 267–275. [Google Scholar] [CrossRef] [PubMed]
- Peters, I.R.; Peeters, D.; Helps, C.R.; Day, M.J. Development and Application of Multiple Internal Reference (Housekeeper) Gene Assays for Accurate Normalisation of Canine Gene Expression Studies. Vet. Immunol. Immunopathol. 2007, 117, 55–66. [Google Scholar] [CrossRef]
- Thiel, C.S.; Hauschild, S.; Tauber, S.; Paulsen, K.; Raig, C.; Raem, A.; Biskup, J.; Gutewort, A.; Hürlimann, E.; Unverdorben, F.; et al. Identification of Reference Genes in Human Myelomonocytic Cells for Gene Expression Studies in Altered Gravity. BioMed Res. Int. 2015, 2015, 363575. [Google Scholar] [CrossRef] [Green Version]
- Goodson, H.V.; Hawse, W.F. Molecular Evolution of the Actin Family. J. Cell Sci. 2002, 115, 2619–2622. [Google Scholar] [CrossRef]
- Dominguez, R.; Holmes, K.C. Actin Structure and Function. Annu. Rev. Biophys. 2011, 40, 169–186. [Google Scholar] [CrossRef]
- Lin, J.; Redies, C. Histological Evidence: Housekeeping Genes Beta-actin and GAPDH are of Limited Value for Normalization of Gene Expression. Dev. Genes Evol. 2012, 222, 369–376. [Google Scholar] [CrossRef] [PubMed]
- Kashina, A.S. Regulation of Actin Isoforms in Cellular and Developmental Processes. Semin. Cell Dev. Biol. 2020, 102, 113–121. [Google Scholar] [CrossRef] [PubMed]
- Ploegh, H.L.; Orr, H.T.; Strominger, J.L. Major Histocompatibility Antigens: The Human (HLA-A, -B, -C) and Murine (H-2K, H-2D) Class I Molecules. Cell 1981, 24, 287–299. [Google Scholar] [CrossRef]
- Saper, M.A.; Bjorkman, P.J.; Wiley, D.C. Refined Structure of The Human Histocompatibility Antigen HLA-A2 at 2.6 A Resolution. J. Mol. Biol. 1991, 219, 277–319. [Google Scholar] [CrossRef] [PubMed]
- Wang, C.; Wang, Z.; Yao, T.; Zhou, J.; Wang, Z. The Immune-related Role of Beta-2-microglobulin in Melanoma. Front. Oncol. 2022, 12, 944722. [Google Scholar] [CrossRef] [PubMed]
- Chen, H.; Kshirsagar, S.; Jensen, I.; Lau, K.; Simonson, C.; Schluter, S.F. Characterization of Arrangement and Expression of the Beta-2 microglobulin Locus in the Sandbar and Nurse Shark. Dev. Comp. Immunol. 2010, 34, 189–195. [Google Scholar] [CrossRef]
- Zhang, X.H.; Rao, X.L.; Shi, H.T.; Li, R.J.; Lu, Y.T. Overexpression of a Cytosolic Glyceraldehyde-3-Phosphate Dehydrogenase Gene OsGAPC3 Confers Salt Tolerance in Rice. Plant Cell Tissue Organ Cult. 2011, 107, 1. [Google Scholar] [CrossRef]
- Kubo, H. Cloning and Expression Analysis of Putative Glyceraldehyde-3-Phosphate Dehydrogenase Genes in Pilobolus crystallinus. Mycoscience 2011, 52, 99–106. [Google Scholar] [CrossRef]
- Nicholls, C.; Li, H.; Liu, J.P. GAPDH: A Common Enzyme with Uncommon Functions. Clin. Exp. Pharmacol. Physiol. 2012, 39, 674–679. [Google Scholar] [CrossRef]
- Guan, J.; Han, S.; Wu, J.; Zhang, Y.; Bai, M.; Abdullah, S.W.; Sun, S.; Guo, H. Ribosomal Protein L13 Participates in Innate Immune Response Induced by Foot-and-Mouth Disease Virus. Front. Immunol. 2021, 12, 616402. [Google Scholar] [CrossRef]
- Mateyak, M.K.; Kinzy, T.G. eEF1A: Thinking Outside the Ribosome. J. Biol. Chem. 2010, 285, 21209–21213. [Google Scholar] [CrossRef] [PubMed] [Green Version]
- Abbas, W.; Kumar, A.; Herbein, G. The eEF1A Proteins: At the Crossroads of Oncogenesis, Apoptosis, and Viral Infections. Front. Oncol. 2015, 5, 75. [Google Scholar] [CrossRef] [Green Version]
- Martin, F.; Ménétret, J.F.; Simonetti, A.; Myasnikov, A.G.; Vicens, Q.; Prongidi-Fix, L.; Natchiar, S.K.; Klaholz, B.P.; Eriani, G. Ribosomal 18S rRNA Base Pairs with mRNA during Eukaryotic Translation Initiation. Nat. Commun. 2016, 7, 12622. [Google Scholar] [CrossRef] [PubMed] [Green Version]
- Zhang, Y.; Lin, X.; Li, T.; Li, H.; Lin, L.; Luo, H.; Li, L.; Ji, N.; Lin, S. High Throughput Sequencing of 18S rRNA and its Gene to Characterize a Prorocentrum Shikokuense (Dinophyceae) bloom. Harmful Algae 2020, 94, 101809. [Google Scholar] [CrossRef] [PubMed]
- Wang, Y.; Zhang, S. EF1α is a Useful Internal Reference for Studies of Gene Expression Regulation in Amphioxus Branchiostoma japonicum. Fish Shellfish Immunol. 2012, 32, 1068–1073. [Google Scholar] [CrossRef] [PubMed]
- Chen, Z.; Pickart, C.M. A 25-Kilodalton Ubiquitin Carrier Protein (E2) Catalyzes Multi-ubiquitin Chain Synthesis via Lysine 48 of Ubiquitin. J. Biol. Chem. 1990, 265, 21835–21842. [Google Scholar] [CrossRef] [PubMed]
- Djajawi, T.M.; Liu, L.; Gong, J.; Huang, A.S.; Luo, M.; Xu, Z.; Okamoto, T.; Call, M.J.; Huang, D.; van Delft, M.F. MARCH5 Requires MTCH2 to Coordinate Proteasomal Turnover of the MCL1: NOXA Complex. Cell Death Differ. 2020, 27, 2484–2499. [Google Scholar] [CrossRef] [Green Version]
- Li, Y.; Zhou, Z.; Shen, M.; Ge, L.; Liu, F. Ubiquitin-Conjugating Enzyme E2 E Inhibits the Accumulation of Rice Stripe Virus in Laodelphax striatellus (Fallén). Viruses 2020, 12, 908. [Google Scholar] [CrossRef]
- Wang, R.; Feng, J.; Su, Y.; Ye, L.; Wang, J. Studies on the Isolation of Photobacterium damselae Subsp. piscicida from Diseased Golden Pompano (Trachinotus ovatus Linnaeus) and Antibacterial Agents Sensitivity. Vet. Microbiol. 2013, 162, 957–963. [Google Scholar] [CrossRef]
- Li, P.; Zhou, L.; Wei, S.; Yang, M.; Ni, S.; Yu, Y.; Cai, J.; Qin, Q. Establishment and Characterization of a Cell Line from the Head Kidney of Golden Pompano Trachinotus ovatus and Its Application in Toxicology and Virus Susceptibility. J. Fish Biol. 2017, 90, 1944–1959. [Google Scholar] [CrossRef]
- Wu, M.; Guo, L.; Zhu, K.C.; Guo, H.Y.; Liu, B.; Jiang, S.G.; Zhang, D.C. Genomic Structure and Molecular Characterization of Toll-like Receptors 1 and 2 from Golden Pompano Trachinotus ovatus (Linnaeus, 1758) and their Expression Response to three Types of Pathogen-associated Molecular Patterns. Dev. Comp. Immunol. 2018, 86, 34–40. [Google Scholar] [CrossRef] [PubMed]
- Zhou, C.; Lin, H.; Huang, Z.; Wang, J.; Wang, Y.; Yu, W. Cloning and Expression Analysis of C-type Lysozyme Gene in Golden Pompano, Trachinotus ovatus. Fish Shellfish Immunol. 2016, 54, 580–585. [Google Scholar] [CrossRef] [PubMed]
- Wu, Y.; Zhou, Y.; Cao, Z.; Sun, Y.; Chen, Y.; Xiang, Y.; Wang, L.; Zhang, S.; Guo, W. Comparative Analysis of the Expression Patterns of IL-1β, IL-11, and IL-34 in Golden Pompano (Trachinotus ovatus) Following different Pathogens Challenge. Fish Shellfish Immunol. 2019, 93, 863–870. [Google Scholar] [CrossRef]
- Wang, X.; Quinn, P.J. Lipopolysaccharide: Biosynthetic pathway and structure modification. Prog. Lipid Res. 2010, 49, 97–107. [Google Scholar] [CrossRef] [PubMed]
- Whitfield, C.; Trent, M.S. Biosynthesis and export of bacterial lipopolysaccharides. Annu. Rev. Biochem. 2014, 83, 99–128. [Google Scholar] [CrossRef]
- Alexopoulou, L.; Holt, A.C. Recognition of double-stranded RNA and activation of NF-kappaB by Toll-like receptor 3. Nature 2001, 413, 732–738. [Google Scholar] [CrossRef]
- Doyle, S.; Vaidya, S.; O’Connell, R.; Dadgostar, H.; Dempsey, P.; Wu, T.; Rao, G.; Sun, R.; Haberland, M.; Modlin, R.; et al. IRF3 mediates a TLR3/TLR4-specific antiviral gene program. Immunity 2002, 17, 251–263. [Google Scholar] [CrossRef] [Green Version]
- Andersen, C.L.; Jensen, J.L.; Ørntoft, T.F. Normalization of Real-Time Quantitative Reverse Transcription-PCR Data: A Model-Based Variance Estimation Approach to Identify Genes Suited for Normalization, Applied to Bladder and Colon Cancer Data Sets. Cancer Res. 2004, 64, 5245–5250. [Google Scholar] [CrossRef] [Green Version]
- Pfaffl, M.W.; Tichopad, A.; Prgomet, C.; Neuvians, T.P. Determination of Stable Housekeeping Genes, Differentially Regulated Target Genes and Sample Integrity: BestKeeper—Excel-Based Tool Using Pair-Wise Correlations. Biotechnol. Lett. 2004, 26, 509–515. [Google Scholar] [CrossRef]
- Yu, Y.; Wei, S.; Wang, Z.; Huang, X.; Huang, Y.; Cai, J.; Li, C.; Qin, Q. Establishment of a New Cell Line from the Snout Tissue of Golden Pompano Trachinotus ovatus, and Its Application in Virus Susceptibility. J. Fish Biol. 2016, 88, 2251–2262. [Google Scholar] [CrossRef]
- Liu, C.S.; Sun, Y.; Zhang, M.; Sun, L. Identification and Analysis of a Sciaenops Ocellatus ISG15 Homologue that Is Involved in Host Immune Defense against Bacterial Infection. Fish Shellfish. Immunol. 2010, 29, 167–174. [Google Scholar] [CrossRef] [PubMed]
- Kubista, M.; Andrade, J.M.; Bengtsson, M.; Forootan, A.; Jonák, J.; Lind, K.; Sindelka, R.; Sjöback, R.; Sjögreen, B.; Strömbom, L.; et al. The Real-time Polymerase Chain Reaction. Mol. Asp. Med. 2006, 27, 95–125. [Google Scholar] [CrossRef] [PubMed]
- Zhang, Y.B.; Gui, J.F. Molecular Regulation of Interferon Antiviral Response in Fish. Dev. Comp. Immunol. 2012, 38, 193–202. [Google Scholar] [CrossRef] [PubMed]
- Langevin, C.; van der Aa, L.M.; Houel, A.; Torhy, C.; Briolat, V.; Lunazzi, A.; Harmache, A.; Bremont, M.; Levraud, J.P.; Boudinot, P. Zebrafish ISG15 Exerts a Strong Antiviral Activity against RNA and DNA Viruses and Regulates the Interferon Response. J. Virol. 2013, 87, 10025–10036. [Google Scholar] [CrossRef] [PubMed] [Green Version]
- Chen, X.; Guan, Y.; Li, K.; Luo, T.; Mu, Y.; Chen, X. IRF1 and IRF2 Act as Positive Regulators in Antiviral Response of Large Yellow Croaker (Larimichthys crocea) by Induction of Distinct Subgroups of Type I IFNs. Dev. Comp. Immunol. 2021, 118, 103996. [Google Scholar] [CrossRef]
- Yuan, Z.; Liu, S.; Yao, J.; Zeng, Q.; Tan, S.; Liu, Z. Expression of Bcl-2 Genes in Channel Catfish after Bacterial Infection and Hypoxia Stress. Dev. Comp. Immunol. 2016, 65, 79–90. [Google Scholar] [CrossRef] [Green Version]
- Tong, Z.; Gao, Z.; Wang, F.; Zhou, J.; Zhang, Z. Selection of Reliable Reference Genes for Gene Expression Studies in Peach Using Real-Time PCR. BMC Mol. Biol. 2009, 10, 71. [Google Scholar] [CrossRef] [Green Version]
- Wang, Q.; Ishikawa, T.; Michiue, T.; Zhu, B.L.; Guan, D.W.; Maeda, H. Stability of Endogenous Reference Genes in Postmortem Human Brains for Normalization of Quantitative Real-Time PCR Data: Comprehensive Evaluation Using GeNorm, NormFinder, and BestKeeper. Int. J. Leg. Med. 2012, 126, 943–952. [Google Scholar] [CrossRef]
- Schmid, H.; Cohen, C.D.; Henger, A.; Irrgang, S.; Schlöndorff, D.; Kretzler, M. Validation of Endogenous Controls for Gene Expression Analysis in Microdissected Human Renal Biopsies. Kidney Int. 2003, 64, 356–360. [Google Scholar] [CrossRef] [Green Version]
- Liu, Y.; Wu, S.; Jiang, N.; Liu, W.; Zhou, Y.; Zeng, L.; Zhong, Q.; Li, Z.; Fan, Y. Characterization of Reference Genes for qRT-PCR Normalization in Rice-Field Eel (Monopterus albus) to Assess Differences in Embryonic Developmental Stages, the Early Development of Immune Organs, and Cells Infected with Rhabdovirus. Fish Shellfish Immunol. 2022, 120, 92–101. [Google Scholar] [CrossRef]
- Zheng, W.J.; Sun, L. Evaluation of Housekeeping Genes as References for Quantitative Real Time RT-PCR Analysis of Gene Expression in Japanese Flounder (Paralichthys olivaceus). Fish Shellfish Immunol. 2011, 30, 638–645. [Google Scholar] [CrossRef] [PubMed]
- Liu, C.; Xin, N.; Zhai, Y.; Jiang, L.; Zhai, J.; Zhang, Q.; Qi, J. Reference Gene Selection for Quantitative Real-Time RT-PCR Normalization in the Half-Smooth Tongue Sole (Cynoglossus semilaevis) at Different Developmental Stages, in Various Tissue Types and on Exposure to Chemicals. PLoS ONE 2014, 9, e91715. [Google Scholar] [CrossRef] [PubMed] [Green Version]
- Chen, X.; Sun, Y.; Zhang, P.; Li, J.; Li, H.; Wei, C.; Cao, Z.; Zhou, Y. Screening of Stable Internal Reference Genes by Quantitative Real-Time PCR in Humpback Grouper Cromileptes altivelis. J. Oceanol. Limnol. 2021, 39, 1985–1999. [Google Scholar] [CrossRef]
- Dharmaratnam, A.; Sudhagar, A.; Nithianantham, S.R.; Das, S.; Swaminathan, T.R. Evaluation of Candidate Reference Genes for Quantitative RTqPCR Analysis in Goldfish (Carassius auratus L.) in Healthy and CyHV-2 Infected Fish. Vet. Immunol. Immunopathol. 2021, 237, 110270. [Google Scholar] [CrossRef] [PubMed]
- Pfaffl, M.W.; Horgan, G.W.; Dempfle, L. Relative Expression Software Tool (REST) for Group-wise Comparison and Statistical Analysis of Relative Expression Results in Real-time PCR. Nucleic Acids Res. 2002, 30, e36. [Google Scholar] [CrossRef]
- Silver, N.; Best, S.; Jiang, J.; Thein, S.L. Selection of Housekeeping Genes for Gene Expression Studies in Human Reticulocytes Using Real-time PCR. BMC Mol. Biol. 2006, 7, 33. [Google Scholar] [CrossRef] [Green Version]
- Gao, Y.; Gao, Y.; Huang, B.; Meng, Z.; Jia, Y. Reference Gene Validation for Quantification of Gene Expression during Ovarian Development of Turbot (Scophthalmus maximus). Sci. Rep. 2020, 10, 823. [Google Scholar] [CrossRef] [Green Version]
- Jorgensen, S.M.; Kleveland, E.J.; Grimholt, U.; Gjoen, T. Validation of Reference Genes for Real-Time Polymerase Chain Reaction Studies in Atlantic Salmon. Mar. Biotechnol. 2006, 8, 398–408. [Google Scholar] [CrossRef]
- Huggett, J.; Dheda, K.; Bustin, S.; Zumla, A. Real-Time RT-PCR Normalisation; Strategies and Considerations. Genes Immun. 2005, 6, 279–284. [Google Scholar] [CrossRef] [Green Version]
- Infante, C.; Matsuoka, M.P.; Asensio, E.; Cañavate, J.P.; Reith, M.; Manchado, M. Selection of Housekeeping Genes for Gene Expression Studies in Larvae from Flatfish Using Real-Time PCR. BMC Mol. Biol. 2008, 9, 28. [Google Scholar] [CrossRef]
- Chechi, K.; Gelinas, Y.; Mathieu, P.; Deshaies, Y.; Richard, D. Validation of Reference Genes for the Relative Quantification of Gene Expression in Human Epicardial Adipose Tissue. PLoS ONE 2012, 7, e32265. [Google Scholar] [CrossRef] [PubMed] [Green Version]
- Cinar, M.U.; Islam, M.A.; Pröll, M.; Kocamis, H.; Tholen, E.; Tesfaye, D.; Looft, C.; Schellander, K.; Uddin, M.J. Evaluation of Suitable Reference Genes for Gene Expression Studies in Porcine PBMCs in Response to LPS and LTA. BMC Res. Notes 2013, 6, 56. [Google Scholar] [CrossRef] [PubMed] [Green Version]
- Roy, J.G.; McElhaney, J.E.; Verschoor, C.P. Reliable Reference Genes for the Quantification of mRNA in Human T-Cells and PBMCs Stimulated with Live Influenza Virus. BMC Immunol. 2020, 21, 4. [Google Scholar] [CrossRef] [PubMed]
- Su, J.; Zhang, R.; Dong, J.; Yang, C. Evaluation of Internal Control Genes for qRT-PCR Normalization in Tissues and Cell Culture for Antiviral Studies of Grass Carp (Ctenopharyngodon idella). Fish Shellfish Immunol. 2011, 30, 830–835. [Google Scholar] [CrossRef]
- Zhang, Y.W.; Davis, E.G.; Bai, J. Determination of Internal Control for Gene Expression Studies in Equine Tissues and Cell Culture Using Quantitative RT-PCR. Vet. Immunol. Immunopathol. 2009, 130, 114–119. [Google Scholar] [CrossRef]
- Chen, Y.; Tan, Z.; Hu, B.; Yang, Z.; Xu, B.; Zhuang, L.; Huang, B. Selection and Validation of Reference Genes for Target Gene Analysis with Quantitative RT-PCR in Leaves and Roots of Bermudagrass under Four Different Abiotic Stresses. Physiol. Plant. 2015, 155, 138–148. [Google Scholar] [CrossRef] [PubMed]
- Wang, H.L.; Chen, J.; Tian, Q.; Wang, S.; Xia, X.; Yin, W. Identification and Validation of Reference Genes for Populus euphratica Gene Expression Analysis during Abiotic Stresses by Quantitative Real-time PCR. Physiol. Plant. 2014, 152, 529–545. [Google Scholar] [CrossRef]


| Gene | Function | GenBank Accession Number | Primer Sequence (5′→3′) | Product Size (bp) | PCR Efficiency (%) | Determination Coefficient (R²) |
|---|---|---|---|---|---|---|
| Actin | Cytoskeletal protein | KX987228.1 | F:CGTGCGTGACATCAAGGAGAA R:AAGGAAGGAAGGCTGGAAGAGG | 178 | 99% | 0.992 |
| B2M | Major histocompatibility complex | KX987233.1 | F:CCCTGATGCCAAACAGACAGA R:TGGTTGACCCATGAGTGACCTT | 125 | 100% | 0.991 |
| GAPDH | Glycolysis enzyme | KY006114.1 | F:AGTCCGTCTGGAGAAACCTGC R:GACACGGTTGCTGTAGCCGAACTCA | 235 | 106% | 0.993 |
| RPL13 | Ribosome Protein | KX987230.1 | F:TGAAGGAGTACCGCTCCAAACT R:GCACGGATGCCAAATAGACG | 238 | 104% | 0.990 |
| EF1A | Translation | KX987227.1 | F:GTCCGTCAAGGAAATCCGTCG R:TTGAACTTGCAGGCAATGTGAG | 174 | 100% | 0.996 |
| 18S | Ribosome subunit | KY014076.1 | F:GCATTCGTATTGTGCCGCTA R:AGTTGGCATCGTTTATGGTCG | 160 | 98% | 0.990 |
| UBCE | Protein degradation | KX987232.1 | F:CACGATGTCCAGCGAAGTACA R:GACCTCCACTCGTAGATGTTGTC | 270 | 96% | 0.991 |
| Cell Lines | Time | Actin | B2M | GAPDH | RPL13 | EF1A | 18S | UBCE |
|---|---|---|---|---|---|---|---|---|
| GPS | 2 h | 12.2 ± 0.3 | 30.7 ± 0.5 | 26.8 ± 0.3 | 24.3 ± 0.3 | 12.3 ± 0.2 | 6.4 ± 0.1 | 21.7 ± 0.3 |
| 4 h | 12.4 ± 0.2 | 30.6 ± 0.6 | 27.0 ± 0.2 | 23.9 ± 0.2 | 12.8 ± 0.4 | 6.4 ± 0.0 | 21.9 ± 0.0 | |
| 8 h | 12.9 ± 0.1 | 31.8 ± 0.8 | 27.1 ± 0.0 | 21.3 ± 0.3 | 13.1 ± 0.4 | 6.5 ± 0.1 | 21.8 ± 0.7 | |
| 12 h | 12.5 ± 0.3 | 31.7 ± 0.7 | 27.1 ± 0.1 | 22.5 ± 0.3 | 12.4 ± 0.4 | 6.6 ± 0.2 | 22.0 ± 0.7 | |
| GPHK | 2 h | 14.8 ± 0.1 | 20.3 ± 0.2 | 33.2 ± 0.1 | 17.2 ± 0.1 | 14.9 ± 0.2 | 7.9 ± 0.1 | 23.0 ± 0.2 |
| 4 h | 15.2 ± 0.1 | 20.6 ± 0.1 | 33.5 ± 0.3 | 17.1 ± 0.1 | 15.0 ± 0.0 | 7.7 ± 0.5 | 22.9 ± 0.3 | |
| 8 h | 15.7 ± 0.6 | 21.0 ± 0.2 | 34.4 ± 0.2 | 17.4 ± 0.3 | 15.3 ± 0.2 | 7.9 ± 0.2 | 23.6 ± 0.4 | |
| 12 h | 15.4 ± 0.4 | 20.3 ± 0.2 | 33.8 ± 0.5 | 17.2 ± 0.1 | 15.4 ± 0.4 | 7.9 ± 0.0 | 23.4 ± 0.3 |
| Reference Gene | Treatments | GPS | GPHK | ||||||
|---|---|---|---|---|---|---|---|---|---|
| 2 h | 4 h | 8 h | 12 h | 2 h | 4 h | 8 h | 12 h | ||
| Actin | PBS | 14.3 ± 0.5 | 15.7 ± 0.3 | 15.3 ± 0.2 | 14.4 ± 0.4 | 14.3 ± 0.3 | 14.1 ± 0.2 | 15.0 ± 0.2 | 13.9 ± 0.4 |
| LPS | 14.6 ± 0.6 | 15.8 ± 0.5 | 14.2 ± 1.0 | 15.2 ± 0.3 | 14.1 ± 0.1 | 13.8 ± 0.4 | 14.6 ± 0.3 | 13.6 ± 0.5 | |
| Poly I:C | 14.4 ± 0.9 | 15.5 ± 0.4 | 15.5 ± 0.6 | 16.3 ± 0.7 | 12.9 ± 1.0 | 15.2 ± 0.6 | 15.5 ± 0.4 | 14.0 ± 0.5 | |
| B2M | PBS | 26.9 ± 1.1 | 27.3 ± 0.8 | 28.2 ± 0.5 | 27.0 ± 0.7 | 19.6 ± 0.3 | 19.4 ± 0.1 | 20.7 ± 0.5 | 18.9 ± 0.3 |
| LPS | 27.7 ± 0.6 | 28.4 ± 0.2 | 27.5 ± 0.3 | 27.1 ± 0.8 | 19.1 ± 0.5 | 18.7 ± 0.4 | 21.3 ± 0.2 | 18.5 ± 0.4 | |
| Poly I:C | 26.1 ± 0.6 | 26.0 ± 0.5 | 26.4 ± 0.1 | 25.7 ± 0.5 | 18.1 ± 0.5 | 18.4 ± 0.5 | 18.4 ± 0.1 | 18.0 ± 0.4 | |
| GAPDH | PBS | 25.0 ± 0.3 | 26.0 ± 0.4 | 28.4 ± 0.7 | 26.4 ± 0.7 | 30.4 ± 0.5 | 30.6 ± 0.6 | 32.2 ± 0.9 | 31.8 ± 0.6 |
| LPS | 23.7 ± 0.3 | 27.3 ± 0.3 | 26.4 ± 0.4 | 25.7 ± 0.7 | 31.5 ± 0.3 | 32.3 ± 0.3 | 32.7 ± 0.1 | 32.5 ± 0.9 | |
| Poly I:C | 26.6 ± 0.0 | 27.1 ± 0.2 | 27.5 ± 0.4 | 25.8 ± 0.8 | 29.6 ± 1.5 | 32.1 ± 0.1 | 33.0 ± 0.3 | 30.7 ± 0.2 | |
| RPL13 | PBS | 23.7 ± 0.4 | 24.2 ± 0.2 | 25.9 ± 0.8 | 24.3 ± 0.1 | 16.8 ± 0.1 | 15.9 ± 0.3 | 17.1 ± 0.2 | 16.3 ± 0.4 |
| LPS | 24.0 ± 0.5 | 24.4 ± 0.4 | 24.8 ± 0.2 | 23.9 ± 0.1 | 16.5 ± 0.4 | 15.1 ± 0.1 | 16.4 ± 0.4 | 16.5 ± 0.2 | |
| Poly I:C | 24.2 ± 1.1 | 24.9 ± 0.7 | 26.5 ± 0.5 | 23.2 ± 0.4 | 15.1 ± 1.3 | 16.8 ± 0.7 | 17.5 ± 0.8 | 16.4 ± 0.6 | |
| EF1A | PBS | 13.2 ± 0.5 | 15.3 ± 0.1 | 14.7 ± 0.3 | 12.3 ± 0.1 | 15.0 ± 0.8 | 13.9 ± 0.3 | 14.4 ± 0.1 | 14.2 ± 0.3 |
| LPS | 12.5 ± 0.4 | 15.5 ± 0.5 | 13.4 ± 0.4 | 12.9 ± 0.8 | 15.4 ± 0.4 | 14.2 ± 0.7 | 14.5 ± 0.9 | 14.5 ± 0.3 | |
| Poly I:C | 13.0 ± 0.7 | 14.6 ± 0.4 | 15.2 ± 0.4 | 13.9 ± 0.7 | 13.7 ± 0.1 | 14.8 ± 0.5 | 14.8 ± 0.3 | 14.3 ± 0.9 | |
| 18S | PBS | 8.3 ± 0.3 | 8.1 ± 0.0 | 8.1 ± 0.0 | 8.8 ± 0.9 | 9.5 ± 0.3 | 7.5 ± 0.1 | 7.8 ± 0.1 | 7.8 ± 0.2 |
| LPS | 8.8 ± 1.0 | 8.3 ± 0.7 | 9.5 ± 0.9 | 8.0 ± 0.2 | 9.3 ± 0.1 | 7.2 ± 0.1 | 7.5 ± 0.4 | 8.1 ± 0.1 | |
| Poly I:C | 7.6 ± 0.5 | 8.5 ± 0.0 | 8.5 ± 0.5 | 8.7 ± 0.2 | 7.4 ± 0.0 | 7.4 ± 0.0 | 7.8 ± 0.1 | 8.1 ± 1.1 | |
| UBCE | PBS | 24.0 ± 0.8 | 27.4 ± 0.2 | 26.1 ± 0.4 | 24.6 ± 0.5 | 22.7 ± 0.2 | 21.7 ± 0.1 | 22.4 ± 0.3 | 23.4 ± 0.6 |
| LPS | 24.7 ± 0.3 | 28.5 ± 0.2 | 24.6 ± 0.4 | 25.3 ± 0.3 | 21.9 ± 0.6 | 21.1 ± 0.5 | 22.1 ± 0.6 | 23.7 ± 0.7 | |
| Poly I:C | 24.2 ± 0.3 | 27.2 ± 0.3 | 26.5 ± 0.0 | 26.7 ± 0.6 | 21.6 ± 0.2 | 23.2 ± 0.6 | 23.2 ± 0.1 | 23.8 ± 1.0 | |
| Cell Lines | Ranking Order | 1 | 2 | 3 | 4 | 5 | 6 | 7 |
|---|---|---|---|---|---|---|---|---|
| GPS | Gene | 18S | GAPDH | UBCE | Actin | EF1A | B2M | RPL13 |
| Stability | 0.026 | 0.026 | 0.039 | 0.154 | 0.228 | 0.492 | 1.095 | |
| GPHK | Gene | UBCE | Actin | RPL13 | EF1A | B2M | 18S | GAPDH |
| Stability | 0.075 | 0.101 | 0.103 | 0.114 | 0.154 | 0.188 | 0.206 |
| Cell Lines | Genes | Standard Deviation (SD) | Correlation Coefficient (r) | Coefficient of Variation (CV) | p-Value | Ranking Order |
|---|---|---|---|---|---|---|
| GPS | 18S | 0.11 | 0.674 | 1.64 | 0.016 | 1 |
| GAPDH | 0.16 | 0.280 | 0.59 | 0.379 | 2 | |
| Actin | 0.28 | 0.369 | 2.25 | 0.236 | 3 | |
| UBCE | 0.31 | 0.610 | 1.44 | 0.035 | 4 | |
| EF1A | 0.36 | 0.626 | 2.86 | 0.029 | 5 | |
| B2M | 0.61 | 0.174 | 1.95 | 0.588 | 6 | |
| RPL13 | 1.09 | −0.227 | 4.76 | 0.476 | 7 | |
| GPHK | RPL13 | 0.12 | 0.811 | 0.71 | 0.001 | 1 |
| 18S | 0.16 | 0.386 | 2.08 | 0.216 | 2 | |
| EF1A | 0.24 | 0.524 | 1.59 | 0.080 | 3 | |
| B2M | 0.25 | 0.691 | 1.21 | 0.013 | 4 | |
| Actin | 0.30 | 0.858 | 1.98 | 0.001 | 5 | |
| UBCE | 0.32 | 0.772 | 1.36 | 0.003 | 6 | |
| GAPDH | 0.45 | 0.742 | 1.33 | 0.006 | 7 |
| Cell Lines | Ranking Order | geNorm | NormFinder | BestKeeper | Recommended Comprehensive Ranking |
|---|---|---|---|---|---|
| GPS | 1 | 18S/GAPDH | 18S/GAPDH | 18S | 18S |
| 2 | GAPDH | GAPDH | |||
| 3 | UBCE | UBCE | Actin | UBCE | |
| 4 | Actin | Actin | UBCE | Actin | |
| 5 | EF1A | EF1A | EF1A | EF1A | |
| 6 | B2M | B2M | B2M | B2M | |
| 7 | RPL13 | RPL13 | RPL13 | RPL13 | |
| GPHK | 1 | RPL13/18S | UBCE | RPL13 | RPL13 |
| 2 | Actin | 18S | 18S | ||
| 3 | EF1A | RPL13 | EF1A | EF1A | |
| 4 | UBCE | EF1A | B2M | UBCE | |
| 5 | Actin | B2M | Actin | Actin | |
| 6 | B2M | 18S | UBCE | B2M | |
| 7 | GAPDH | GAPDH | GAPDH | GAPDH |
| Cell Lines | Stimuli | Ranking Order | 1 | 2 | 3 | 4 | 5 | 6 | 7 | |||||||
|---|---|---|---|---|---|---|---|---|---|---|---|---|---|---|---|---|
| GPS | LPS | 2 h | RPL13/Actin | (0.002) | 18S | (0.211) | UBCE | (0.327) | B2M | (0.377) | EF1A | (0.393) | GAPDH | (0.820) | ||
| 4 h | RPL13 | (0.207) | 18S | (0.209) | EF1A | (0.224) | Actin | (0.259) | UBCE | (0.264) | B2M | (0.306) | GAPDH | (0.384) | ||
| 8 h | RPL13/Actin | (0.007) | EF1A | (0.047) | B2M | (0.075) | UBCE | (0.307) | GAPDH | (0.588) | 18S | (1.299) | ||||
| 12 h | GAPDH | (0.114) | B2M | (0.203) | RPL13 | (0.228) | EF1A | (0.273) | Actin | (0.345) | UBCE | (0.562) | 18S | (0.725) | ||
| Poly I:C | 2 h | UBCE/Actin | (0.026) | EF1A | (0.066) | RPL13 | (0.130) | 18S | (0.385) | B2M | (0.508) | GAPDH | (0.848) | |||
| 4 h | UBCE/Actiin | (0.010) | 18S | (0.164) | EF1A | (0.387) | RPL13 | (0.412) | GAPDH | (0.605) | B2M | (0.662) | ||||
| 8 h | Actin | (0.055) | 18S | (0.207) | UBCE | (0.213) | EF1A | (0.299) | RPL13 | (0.324) | GAPDH | (0.435) | B2M | (0.985) | ||
| 12 h | UBCE/EF1A | (0.362) | 18S | (0.413) | Actin | (0.443) | RPL13 | (0.508) | GAPDH | (0.535) | B2M | (0.634) | ||||
| GPHK | LPS | 2 h | 18S/Actin | (0.003) | RPL13 | (0.029) | EF1A | (0.210) | B2M | (0.228) | UBCE | (0.417) | GAPDH | (0.673) | ||
| 4 h | 18S/Actin | (0.002) | EF1A | (0.137) | UBCE | (0.223) | B2M | (0.256) | RPL13 | (0.360) | GAPDH | (1.001) | ||||
| 8 h | EF1A | (0.030) | UBCE | (0.140) | 18S | (0.142) | RPL13 | (0.196) | Actin | (0.198) | GAPDH | (0.305) | B2M | (0.348) | ||
| 12 h | EF1A | (0.001) | 18S | (0.007) | RPL13 | (0.020) | UBCE | (0.055) | Actin | (0.254) | GAPDH | (0.295) | B2M | (0.339) | ||
| Poly I:C | 2 h | EF1A/Actin | (0.001) | B2M | (0.040) | UBCE | (0.153) | RPL13 | (0.154) | GAPDH | (0.354) | 18S | (0.392) | |||
| 4 h | EF1A/RPL13 | (0.013) | Actin | (0.135) | UBCE | (0.374) | 18S | (0.384) | GAPDH | (0.430) | B2M | (0.963) | ||||
| 8 h | EF1A | (0.010) | RPL13 | (0.016) | Actin | (0.031) | 18S | (0.114) | UBCE | (0.285) | GAPDH | (0.399) | B2M | (1.383) | ||
| 12 h | RPL13 | (0.052) | EF1A | (0.062) | Actin | (0.109) | 18S | (0.199) | UBCE | (0.281) | B2M | (0.426) | GAPDH | (0.552) |
| Cell Lines | Stimuli | Ranking Order | Genes | Standard Deviation (SD) | Correlation Coefficient (r) | Coefficient of Variation (CV) | p-Value | |||||||||||||||
|---|---|---|---|---|---|---|---|---|---|---|---|---|---|---|---|---|---|---|---|---|---|---|
| GPS | 2 h | 4 h | 8 h | 12 h | 2 h | 4 h | 8 h | 12 h | 2 h | 4 h | 8 h | 12 h | 2 h | 4 h | 8 h | 12 h | 2 h | 4 h | 8 h | 12 h | ||
| LPS | 1 | RPL13 | EF1A | B2M | RPL13 | 0.36 | 0.20 | 0.41 | 0.19 | 0.768 | 0.607 | 0.767 | 0.476 | 1.49 | 1.33 | 1.48 | 0.77 | 0.074 | 0.201 | 0.075 | 0.341 | |
| 2 | Actin | RPL13 | EF1A | B2M | 0.40 | 0.23 | 0.63 | 0.43 | 0.968 | 0.454 | 0.757 | 0.738 | 2.76 | 0.93 | 4.49 | 1.60 | 0.002 | 0.365 | 0.081 | 0.094 | ||
| 3 | EF1A | 18S | RPL13 | 18S | 0.48 | 0.26 | 0.64 | 0.48 | 0.594 | 0.754 | 0.674 | 0.021 | 3.77 | 3.19 | 2.52 | 5.60 | 0.213 | 0.083 | 0.143 | 0.970 | ||
| 4 | 18S | Actin | Actin | GAPDH | 0.52 | 0.29 | 0.67 | 0.55 | 0.923 | 0.765 | 0.914 | 0.883 | 6.14 | 1.81 | 4.53 | 2.05 | 0.009 | 0.076 | 0.011 | 0.020 | ||
| 5 | UBCE | UBCE | UBCE | EF1A | 0.54 | 0.53 | 0.78 | 0.58 | 0.544 | 0.628 | 0.807 | 0.719 | 2.21 | 1.88 | 3.09 | 4.52 | 0.263 | 0.183 | 0.052 | 0.107 | ||
| 6 | GAPDH | B2M | 18S | Actin | 0.69 | 0.57 | 0.81 | 0.67 | −0.022 | 0.619 | −0.166 | 0.712 | 2.83 | 2.05 | 9.17 | 4.46 | 0.970 | 0.189 | 0.751 | 0.112 | ||
| 7 | B2M | GAPDH | GAPDH | UBCE | 0.76 | 0.62 | 1.00 | 0.81 | −0.059 | 0.705 | 0.779 | 0.662 | 2.80 | 2.33 | 3.63 | 3.18 | 0.910 | 0.117 | 0.067 | 0.151 | ||
| Poly I:C | 1 | 18S | UBCE | UBCE | 18S | 0.39 | 0.17 | 0.26 | 0.29 | 0.768 | 0.737 | 0.497 | 0.061 | 4.93 | 0.64 | 0.99 | 3.43 | 0.074 | 0.095 | 0.314 | 0.910 | |
| 2 | UBCE | 18S | Actin | UBCE | 0.46 | 0.18 | 0.27 | 0.32 | 0.576 | 0.012 | 0.756 | 0.368 | 1.92 | 2.21 | 1.73 | 1.19 | 0.231 | 0.985 | 0.082 | 0.474 | ||
| 3 | EF1A | Actin | 18S | EF1A | 0.48 | 0.25 | 0.30 | 0.35 | 0.927 | 0.841 | 0.774 | 0.488 | 3.69 | 1.57 | 3.64 | 2.59 | 0.008 | 0.036 | 0.071 | 0.325 | ||
| 4 | Actin | EF1A | EF1A | Actin | 0.50 | 0.43 | 0.35 | 0.45 | 0.972 | 0.325 | 0.586 | 0.571 | 3.44 | 2.85 | 2.31 | 2.80 | 0.001 | 0.528 | 0.221 | 0.237 | ||
| 5 | B2M | RPL13 | GAPDH | RPL13 | 0.58 | 0.43 | 0.46 | 0.59 | 0.005 | 0.318 | 0.348 | 0.338 | 2.20 | 1.74 | 1.64 | 2.46 | 0.993 | 0.540 | 0.500 | 0.511 | ||
| 6 | RPL13 | GAPDH | RPL13 | B2M | 0.59 | 0.52 | 0.56 | 0.69 | 0.798 | 0.365 | 0.824 | 0.414 | 2.47 | 1.95 | 2.13 | 2.60 | 0.057 | 0.479 | 0.044 | 0.414 | ||
| 7 | GAPDH | B2M | B2M | GAPDH | 0.79 | 0.69 | 0.91 | 0.70 | 0.003 | 0.235 | −0.079 | 0.665 | 3.07 | 2.60 | 3.32 | 2.63 | 0.993 | 0.656 | 0.881 | 0.150 | ||
| GPHK | LPS | 1 | 18S | 18S | 18S | 18S | 0.14 | 0.16 | 0.22 | 0.16 | 0.496 | 0.781 | 0.838 | 0.367 | 1.50 | 2.14 | 2.82 | 1.97 | 0.318 | 0.067 | 0.037 | 0.474 |
| 2 | Actin | Actin | Actin | EF1A | 0.15 | 0.21 | 0.26 | 0.22 | 0.795 | 0.793 | 0.835 | 0.490 | 1.07 | 1.49 | 1.73 | 1.54 | 0.059 | 0.060 | 0.039 | 0.325 | ||
| 3 | RPL13 | B2M | UBCE | RPL13 | 0.20 | 0.33 | 0.33 | 0.25 | 0.285 | 0.567 | −0.147 | 0.322 | 1.20 | 1.72 | 1.46 | 1.55 | 0.587 | 0.240 | 0.779 | 0.534 | ||
| 4 | B2M | EF1A | EF1A | Actin | 0.37 | 0.34 | 0.36 | 0.34 | 0.626 | 0.129 | 0.663 | 0.510 | 1.91 | 2.39 | 2.48 | 2.45 | 0.183 | 0.808 | 0.151 | 0.300 | ||
| 5 | UBCE | UBCE | RPL13 | B2M | 0.48 | 0.40 | 0.38 | 0.35 | 0.309 | 0.562 | 0.649 | 0.011 | 2.14 | 1.87 | 2.29 | 1.88 | 0.551 | 0.245 | 0.162 | 0.985 | ||
| 6 | EF1A | RPL13 | B2M | UBCE | 0.48 | 0.40 | 0.39 | 0.50 | 0.439 | 0.907 | 0.069 | 0.337 | 3.15 | 2.60 | 1.85 | 2.11 | 0.383 | 0.013 | 0.895 | 0.511 | ||
| 7 | GAPDH | GAPDH | GAPDH | GAPDH | 0.56 | 0.82 | 0.49 | 0.66 | −0.083 | −0.575 | 0.207 | 0.784 | 1.83 | 2.62 | 1.51 | 2.05 | 0.873 | 0.231 | 0.696 | 0.065 | ||
| Poly I:C | 1 | UBCE | 18S | 18S | Actin | 0.55 | 0.04 | 0.08 | 0.39 | 0.883 | −0.611 | −0.106 | 0.341 | 2.47 | 0.47 | 1.07 | 2.76 | 0.020 | 0.198 | 0.844 | 0.506 | |
| 2 | EF1A | EF1A | EF1A | RPL13 | 0.69 | 0.48 | 0.25 | 0.40 | 0.853 | 0.978 | 0.402 | 0.729 | 4.80 | 3.33 | 1.70 | 2.45 | 0.031 | 0.001 | 0.429 | 0.100 | ||
| 3 | Actin | B2M | Actin | EF1A | 0.69 | 0.53 | 0.29 | 0.43 | 0.913 | −0.341 | 0.609 | 0.904 | 5.06 | 2.79 | 1.94 | 3.01 | 0.011 | 0.506 | 0.198 | 0.013 | ||
| 4 | GAPDH | Actin | UBCE | 18S | 0.70 | 0.55 | 0.36 | 0.44 | 0.657 | 0.991 | 0.426 | 0.949 | 2.35 | 3.76 | 1.57 | 5.57 | 0.157 | 0.001 | 0.400 | 0.004 | ||
| 5 | B2M | RPL13 | RPL13 | B2M | 0.75 | 0.57 | 0.37 | 0.46 | 0.987 | 0.953 | 0.482 | 0.257 | 3.95 | 3.48 | 2.16 | 2.48 | 0.001 | 0.003 | 0.333 | 0.624 | ||
| 6 | RPL13 | UBCE | GAPDH | GAPDH | 0.99 | 0.71 | 0.61 | 0.59 | 0.921 | 0.959 | 0.672 | −0.138 | 6.22 | 3.16 | 1.87 | 1.87 | 0.009 | 0.002 | 0.143 | 0.793 | ||
| 7 | 18S | GAPDH | B2M | UBCE | 1.05 | 0.75 | 1.18 | 0.60 | 0.929 | 0.722 | 0.055 | −0.563 | 12.49 | 2.40 | 6.01 | 2.53 | 0.007 | 0.105 | 0.918 | 0.245 | ||
| Cell Lines | Stimuli | Ranking Order | geNorm | NormFinder | BestKeeper | Recommended Comprehensive Ranking | ||||||||||||
|---|---|---|---|---|---|---|---|---|---|---|---|---|---|---|---|---|---|---|
| 2 h | 4 h | 8 h | 12 h | 2 h | 4 h | 8 h | 12 h | 2 h | 4 h | 8 h | 12 h | 2 h | 4 h | 8 h | 12 h | |||
| GPS | LPS | 1 | RPL13/Actin | RPL13/18S | RPL13/Actin | RPL13/B2M | RPL13/Actin | RPL13 | RPL13/Actin | GAPDH | RPL13 | EF1A | B2M | RPL13 | RPL13 | RPL13 | RPL13 | RPL13 |
| 2 | 18S | B2M | Actin | RPL13 | EF1A | B2M | Actin | 18S | Actin | B2M | ||||||||
| 3 | 18s | EF1A | EF1A | GAPDH | 18S | EF1A | EF1A | RPL13 | EF1A | 18S | RPL13 | 18S | 18S | EF1A | EF1A | GAPDH | ||
| 4 | UBCE | Actin | B2M | EF1A | UBCE | Actin | B2M | EF1A | 18S | Actin | Actin | GAPDH | UBCE | Actin | B2M | EF1A | ||
| 5 | B2M | UBCE | UBCE | Actin | B2M | UBCE | UBCE | Actin | UBCE | UBCE | UBCE | EF1A | EF1A | UBCE | UBCE | Actin | ||
| 6 | EF1A | B2M | GAPDH | UBCE | EF1A | B2M | GAPDH | UBCE | GAPDH | B2M | 18S | Actin | B2M | B2M | GAPDH | UBCE | ||
| 7 | GAPDH | GAPDH | 18S | 18S | GAPDH | GAPDH | 18S | 18S | B2M | GAPDH | GAPDH | UBCE | GAPDH | GAPDH | 18S | 18S | ||
| Poly I:C | 1 | UBCE/Actin | UBCE/Actin | UBCE/18S | UBCE/EF1A | UBCE/Actin | UBCE/Actin | Actin | UBCE/EF1A | 18S | UBCE | UBCE | 18S | UBCE | UBCE | UBCE | UBCE | |
| 2 | 18S | UBCE | 18S | Actin | UBCE | Actin | Actin | 18S | EF1A | |||||||||
| 3 | EF1A | 18S | EF1A | 18S | EF1A | 18S | UBCE | 18S | EF1A | Actin | 18S | EF1A | EF1A | 18S | Actin | 18S | ||
| 4 | RPL13 | RPL13 | RPL13 | Actin | RPL13 | EF1A | EF1A | Actin | Actin | EF1A | EF1A | Actin | 18S | EF1A | EF1A | Actin | ||
| 5 | 18S | GAPDH | Actin | RPL13 | 18S | RPL13 | RPL13 | RPL13 | B2M | RPL13 | GAPDH | RPL13 | RPL13 | RPL13 | RPL13 | RPL13 | ||
| 6 | B2M | EF1A | GAPDH | GAPDH | B2M | GAPDH | GAPDH | GAPDH | RPL13 | GAPDH | RPL13 | B2M | B2M | GAPDH | GAPDH | GAPDH | ||
| 7 | GAPDH | B2M | B2M | B2M | GAPDH | B2M | B2M | B2M | GAPDH | B2M | B2M | GAPDH | GAPDH | B2M | B2M | B2M | ||
| GPHK | LPS | 1 | 18S/Actin | 18S/Actin | 18S/UBCE | 18S/EF1A | 18S/Actin | 18S/Actin | EF1A | EF1A | 18S | 18S | 18S | 18S | 18S | 18S | 18S | 18S |
| 2 | UBCE | 18S | Actin | Actin | Actin | EF1A | Actin | Actin | UBCE | EF1A | ||||||||
| 3 | RPL13 | UBCE | RPL13 | UBCE | RPL13 | EF1A | 18S | RPL13 | RPL13 | B2M | UBCE | RPL13 | RPL13 | UBCE | EF1A | RPL13 | ||
| 4 | B2M | B2M | Actin | RPL13 | EF1A | UBCE | RPL13 | UBCE | B2M | EF1A | EF1A | Actin | B2M | B2M | Actin | UBCE | ||
| 5 | UBCE | RPL13 | EF1A | GAPDH | B2M | B2M | Actin | Actin | UBCE | UBCE | RPL13 | B2M | UBCE | EF1A | RPL13 | Actin | ||
| 6 | EF1A | EF1A | GAPDH | Actin | UBCE | RPL13 | GAPDH | GAPDH | EF1A | RPL13 | B2M | UBCE | EF1A | RPL13 | GAPDH | GAPDH | ||
| 7 | GAPDH | GAPDH | B2M | B2M | GAPDH | GAPDH | B2M | B2M | GAPDH | GAPDH | GAPDH | GAPDH | GAPDH | GAPDH | B2M | B2M | ||
| Poly I:C | 1 | EFIA/Actin | EF1A/RPL13 | EF1A/Actin | EF1A/RPL13 | EF1A/Actin | EF1A/RPL13 | EF1A | RPL13 | UBCE | 18S | 18S | Actin | EF1A | EF1A | EF1A | RPL13 | |
| 2 | RPL13 | EF1A | EF1A | EF1A | EF1A | RPL13 | Actin | RPL13 | Actin | EF1A | ||||||||
| 3 | B2M | Actin | RPL13 | Actin | B2M | Actin | Actin | Actin | Actin | B2M | Actin | EF1A | UBCE | Actin | RPL13 | Actin | ||
| 4 | UBCE | UBCE | UBCE | 18S | UBCE | UBCE | 18S | 18S | GAPDH | Actin | UBCE | 18S | B2M | 18S | 18S | 18S | ||
| 5 | RPL13 | GAPDH | GAPDH | UBCE | RPL13 | 18S | UBCE | UBCE | B2M | RPL13 | RPL13 | B2M | RPL13 | UBCE | UBCE | UBCE | ||
| 6 | GAPDH | 18S | 18S | B2M | GAPDH | GAPDH | GAPDH | B2M | RPL13 | UBCE | GAPDH | GAPDH | GAPDH | B2M | GAPDH | B2M | ||
| 7 | 18S | B2M | B2M | GAPDH | 18S | B2M | B2M | GAPDH | 18S | GAPDH | B2M | UBCE | 18S | GAPDH | B2M | GAPDH | ||
Disclaimer/Publisher’s Note: The statements, opinions and data contained in all publications are solely those of the individual author(s) and contributor(s) and not of MDPI and/or the editor(s). MDPI and/or the editor(s) disclaim responsibility for any injury to people or property resulting from any ideas, methods, instructions or products referred to in the content. |
© 2022 by the authors. Licensee MDPI, Basel, Switzerland. This article is an open access article distributed under the terms and conditions of the Creative Commons Attribution (CC BY) license (https://creativecommons.org/licenses/by/4.0/).
Share and Cite
Zhao, N.; Zhang, H.; Zhu, L.; Hou, Y.; Wu, Y.; Cao, Z.; Sun, Y. Selection and Verification of Reference Genes for Gene Expression Studies in Different Cell Lines of Golden Pompano (Trachinotus ovatus). Fishes 2023, 8, 8. https://doi.org/10.3390/fishes8010008
Zhao N, Zhang H, Zhu L, Hou Y, Wu Y, Cao Z, Sun Y. Selection and Verification of Reference Genes for Gene Expression Studies in Different Cell Lines of Golden Pompano (Trachinotus ovatus). Fishes. 2023; 8(1):8. https://doi.org/10.3390/fishes8010008
Chicago/Turabian StyleZhao, Na, Han Zhang, Lin Zhu, Yongwei Hou, Ying Wu, Zhenjie Cao, and Yun Sun. 2023. "Selection and Verification of Reference Genes for Gene Expression Studies in Different Cell Lines of Golden Pompano (Trachinotus ovatus)" Fishes 8, no. 1: 8. https://doi.org/10.3390/fishes8010008