Article

Effects of Water Temperature on the Growth, Antioxidant Capacity, and Gut Microbiota of Percocypris pingi Juveniles

1
Key Laboratory of Freshwater Biodiversity Conservation, Ministry of Agriculture and Rural Affairs of China, Yangtze River Fisheries Research Institute, Chinese Academy of Fishery Sciences, Wuhan 430223, China
2
Research and Development Center, Guangdong Meilikang Bio-Science, Ltd., Foshan 528000, China
*
Author to whom correspondence should be addressed.
Fishes 2022, 7(6), 374; https://doi.org/10.3390/fishes7060374
Submission received: 3 November 2022 / Revised: 29 November 2022 / Accepted: 4 December 2022 / Published: 6 December 2022
(This article belongs to the Special Issue Impacts of Climate Change on Small-Scale Fisheries)

Abstract

:
It is necessary to determine the optimal temperature for Percocypris pingi growth in recirculating aquaculture systems. To describe the effects of temperature, we evaluated the growth, antioxidant enzyme activity, and gut microbiota structure of P. pingi at different temperatures, including 14, 18, 22, and 26 °C. Results showed that increases in body weight of individuals of the groups subjected to 18 and 22 °C temperatures were considerably higher than those in the groups subjected to temperatures of 14 and 26 °C between 20 and 60 d after the experiment started. Acid phosphatase activity in the liver and kidneys of P. pingi did not differ significantly among the various temperature groups (p > 0.05). A gradual restoration of the alkaline phosphatase and superoxide dismutase activities to variations in the surrounding temperature was observed in the liver and kidney of P. pingi. Interestingly, the water temperature did not affect the α-diversity or composition of the gut microbiota of P. pingi. In conclusion, water temperatures between 14 and 26 °C significantly impacted the growth of P. pingi (p < 0.05) but not the liver and kidney antioxidant capacity or the gut microbiota within 60 d.

1. Introduction

As an endemic species in the upstream regions of the Yangtze River, Percocypris pingi is an economically important freshwater fish in southeast China because of its high protein level, reduced fat content, and high nutritional value [1,2,3]. However, owing to the destruction of its natural habitat caused by environmental degradation, dam construction, and overfishing, its population has sharply declined in recent years. These issues have led the fish species to be included in the list of key protected wild animals in China (2021) [4]. Artificial reproduction and breeding are crucial for meeting consumer demand and preventing the depletion of natural P. pingi resources [5]. Currently, regarding reproduction and breeding, research has been conducted on the embryonic development of P. pingi [2], the impact of temperature, pH, and salinity on the survival of juvenile stages [6], and the allometric growth of P. pingi larvae [3].
As ectotherms, fish physiology is strongly affected by temperature [7,8]. The temperature usually affects: basal metabolism; fish energy storage by influencing nutrient digestion and assimilation; surplus energy investment in reproduction and growth; and energy intake via feeding [8,9]. The thermal safety margin and resilience have become important indicators for assessing fish adaptation to the surrounding aquatic environment owing to climate change, specifically global warming [10,11]. Although previous studies have shown that the tolerance range of larval P. pingi retrodorslis to temperature is 0–32 °C, the optimal growth temperature is 8–27 °C [6], and the tolerance range of adult P. pingi to temperature is 2–28 °C, and the optimal growth temperature is 20–25 °C [12]. The effect of temperature on the physiological processes and metabolism of P. pingi has not yet been explained thoroughly.
The gut microbiota plays a crucial role in various physiological processes in the host [13,14,15,16,17]. These elements are also integral to the health of host fish [18]. Understanding the effects of temperature on host–microbiota interactions would improve predictions of biodiversity responses to climate warming [19]. Recently, Ghosh et al. [18] reported that temperature changes to 18 and 8 °C from the control level of 13 °C triggered marked dysbiosis in the fecal microbiota of chum salmon, Oncorhynchus keta, and the opportunistic pathogenic Vibrio and Tenacibaculum sequence variants were highly abundant at high and low temperatures, respectively, and may impede host immunity. However, the influence of temperature change on the gut microbiota of P. pingi remains unclear.
To describe the effects of temperature on the physiology and gut microbiota of P. pingi, we compared the growth, antioxidant enzyme activity, and gut microbiota structure of P. pingi under different water temperatures. These results provide essential data for the breeding and ecological management of the fish species.

2. Materials and Methods

2.1. Experimental Design and Sample Collection

P. pingi juveniles with an initial body weight of 34.02 ± 1.20 g and body length of 12.83 ± 0.53 cm were collected from the Yangtze River Fisheries Research Institute and stocked in a recirculating aquaculture system at 18 °C before the experiment. In April 2018, 840 fish were selected and distributed evenly across four independent recirculating aquaculture systems at a starting temperature of 18 °C. Three conical polypropylene tanks (diameter = 80 cm, water volume = 300 L, and water flow rate = 0.286 L/s) were included in each recirculating aquaculture system, with a fish density of 70 individuals per tank. The water temperature was adjusted at four temperatures of 14, 18, 22, and 26 °C (named T1, T2, T3, and T4) at a rate of 1 °C/4 h using a 1.47 KW aquarium refrigerating and heating machine (temperature control accuracy 0.1 °C) in four independent recirculating aquaculture systems. After the target temperature was stable within a deviation of <0.5 °C for one week, fish were subjected to the acclimation procedure for 60 d. Fish were fed the formulated feed twice (09:00 and 17:00) per day. The remaining feed was drained after 2 h of feeding. The biochemical composition of the formulated feed comprised of crude protein, crude lipid, crude ash, crude fiber, lysine, total phosphorus, and moisture at ≥42.0, ≥5.0, ≥16.0, ≥1.0, ≥2.4, and ≤12.0%, respectively. During the experiment, the one-third volume of water was replaced with aerated tap water of the same volume and temperature in each tank daily. The photoperiod was 12L:12D. All fish were individually weighed 0, 20, 40, and 60 d after the start of the experiment to calculate the weight gain rate (WGR) and specific growth rate (SGR). WGR and SGR were calculated according to the method described by Zeng et al. [20].
When the target temperature was stable (deviation < 0.5 °C) for one week and before feeding, three random fish (named S1, S2, and S3) were collected from each tank and anesthetized with an overdose (70 mg/L) MS 222 (Syndel, Ferndale, WA, USA) [21,22], and the time was labeled as D0. Body weight was measured before tissue sampling. The exterior surfaces of the fish were swabbed using 75% ethanol before dissecting the ventral midline. Liver, kidney, and fecal contents in the intestine were collected using a sterile scalpel and forceps and then stored at −80 °C until further analysis. After feeding, three fish samples were collected at 20 (D20), 40 (D40), and 60 (D60) days, when the experiment was completed, using the same process as D0.

2.2. Determination of Antioxidant Enzyme Activities in the Liver and Kidney

The levels of superoxide dismutase (SOD), alkaline phosphatase (AKP), and acid phosphatase (ACP) in the liver and kidney of P. pingi samples were measured using the corresponding kits (A060-2 for ACP, A059-2 for AKP, and A001-1 for SOD; Nanjing Jiancheng Bioengineering Institute, Nanjing, China) on a Chemray 240 automatic biochemical analyzer (Rayto, Shenzhen, China) according to the manufacturer’s instructions.

2.3. Gut Microbiota Structure Analyses

Total microbiota genomic DNA was extracted from approximately 0.3 g of the freshly dissected gut of each fish using the FastDNA spin kit for soil (MP, Solon, OH, USA). DNA quality was evaluated using a Nanodrop 2000 spectrophotometer (Thermo Scientific, Waltham, MA, USA), and DNA integrity was evaluated using 1.2% agarose gels. According to the concentration, the DNA was diluted to 10 ng/μL using sterile water for further amplification. The V4-V5 hypervariable region of 16S rDNA was amplified using the universal primer pair 515F and 909R, with a 12-nucleotide sample-specific barcode included at the 5′-end of the 515F sequence to distinguish samples, as previously described [23,24]. The amplicons were purified and sequenced using the HiSeq platform at Guangdong Meilikang Bio-Science Ltd. (Foshan, China).
Raw reads were merged using FLASH 1.2.8 and subsequently processed using QIIME 1.9.0 [25], as previously described [26]. Briefly, all the merged sequences were assigned to each sample based on their barcode sequences, and trimmed barcodes and primer sequences were removed using QIIME 1.9.0 software. Low-quality and chimeric sequences were removed using QIIME 1.9.0 and UCHIME, respectively. Subsequently, the remaining high-quality sequences were clustered into operational taxonomic units (OTUs) with 97% identity using UPARSE [27]. The taxonomy of each OTU was assigned using the RDP classifier [28] in the gg_13_8 database. Alpha-diversity indices and weighted and unweighted UniFrac distances were calculated using the QIIME version 1.9.0.

2.4. Data Analyses

The results are presented as the mean ± standard error. Nonparametric multivariate analysis of variance was used to test for differences between microbial communities using the R vegan package [29]. RDA with the Monte Carlo method was conducted using the R vegan package. Pearson’s correlation analysis was conducted using R psych, reshape2, and corrplot packages. Heatmap plots and boxplots were drawn using the R pheatmap and ggpubr packages, respectively. Statistical significance was set at p < 0.05.

3. Results

3.1. Effects of Water Temperature on the Growth of P. pingi

During the experiment, the dissolved oxygen was 7.1–8.6 mg/L, ammonia nitrogen was 0.3–0.7 mg/L, nitrite nitrogen was 0.02–0.08 mg/L, and pH was in the range of 7.5–8.1. None of the fish died during the experiment. The body weight of P. pingi in each temperature group increased with culture time. The body weights of the individuals in the groups subjected to 18 and 22 °C increased significantly between D20 and D60 compared to those in the groups subjected to 14 and 26 °C (p < 0.05). However, there was no significant difference between the 18 and 22 °C groups and between the 14 and 26 °C groups (p > 0.05; Table 1).
The weight gain rates of the 14, 18, and 22 °C groups reached a maximum at D40 and decreased at D60. The weight gain rate of the group subjected to 26 °C was the highest at D20, the lowest at D40, and increased at D60. The weight gain rates of the 18 and 22 °C groups were significantly higher than those of the 14 and 26 °C groups between D0 and D40 (p < 0.05). There was no significant difference in the weight gain rate between the 18 and 22 °C groups and between the 14 and 26 °C groups (p > 0.05). The weight gain rate of the group subjected to 22 °C was significantly higher than that of the groups subjected to 14 and 26 °C between D40 and D60, and there was no significant difference between the other groups (Table 1).

3.2. Effects of Water Temperature on the Activities of Three Antioxidant Enzymes in the Liver and Kidney of P. pingi

There was no significant difference in ACP activity in the liver and kidney of P. pingi among the different temperature groups. At D40 of culture, the AKP activities of the liver and kidney in the 22 °C group were significantly higher than those of the other groups. Moreover, the SOD activity in the kidneys of P. pingi individuals in the group subjected to 22 °C was also significantly higher than that in other groups (p < 0.05; Figure 1). At D60 of culture, the SOD activity in the livers of P. pingi individuals in the group subjected to 22 °C was significantly higher than that in the group subjected to 26 °C, and the SOD activity in the kidneys of the individuals in the group subjected to 22 °C was significantly higher than that in the group subjected to 18 °C (p < 0.05; Figure 1). These results implied that AKP and SOD activities in the liver and kidney of P. pingi gradually adapted to changes in ambient temperature.

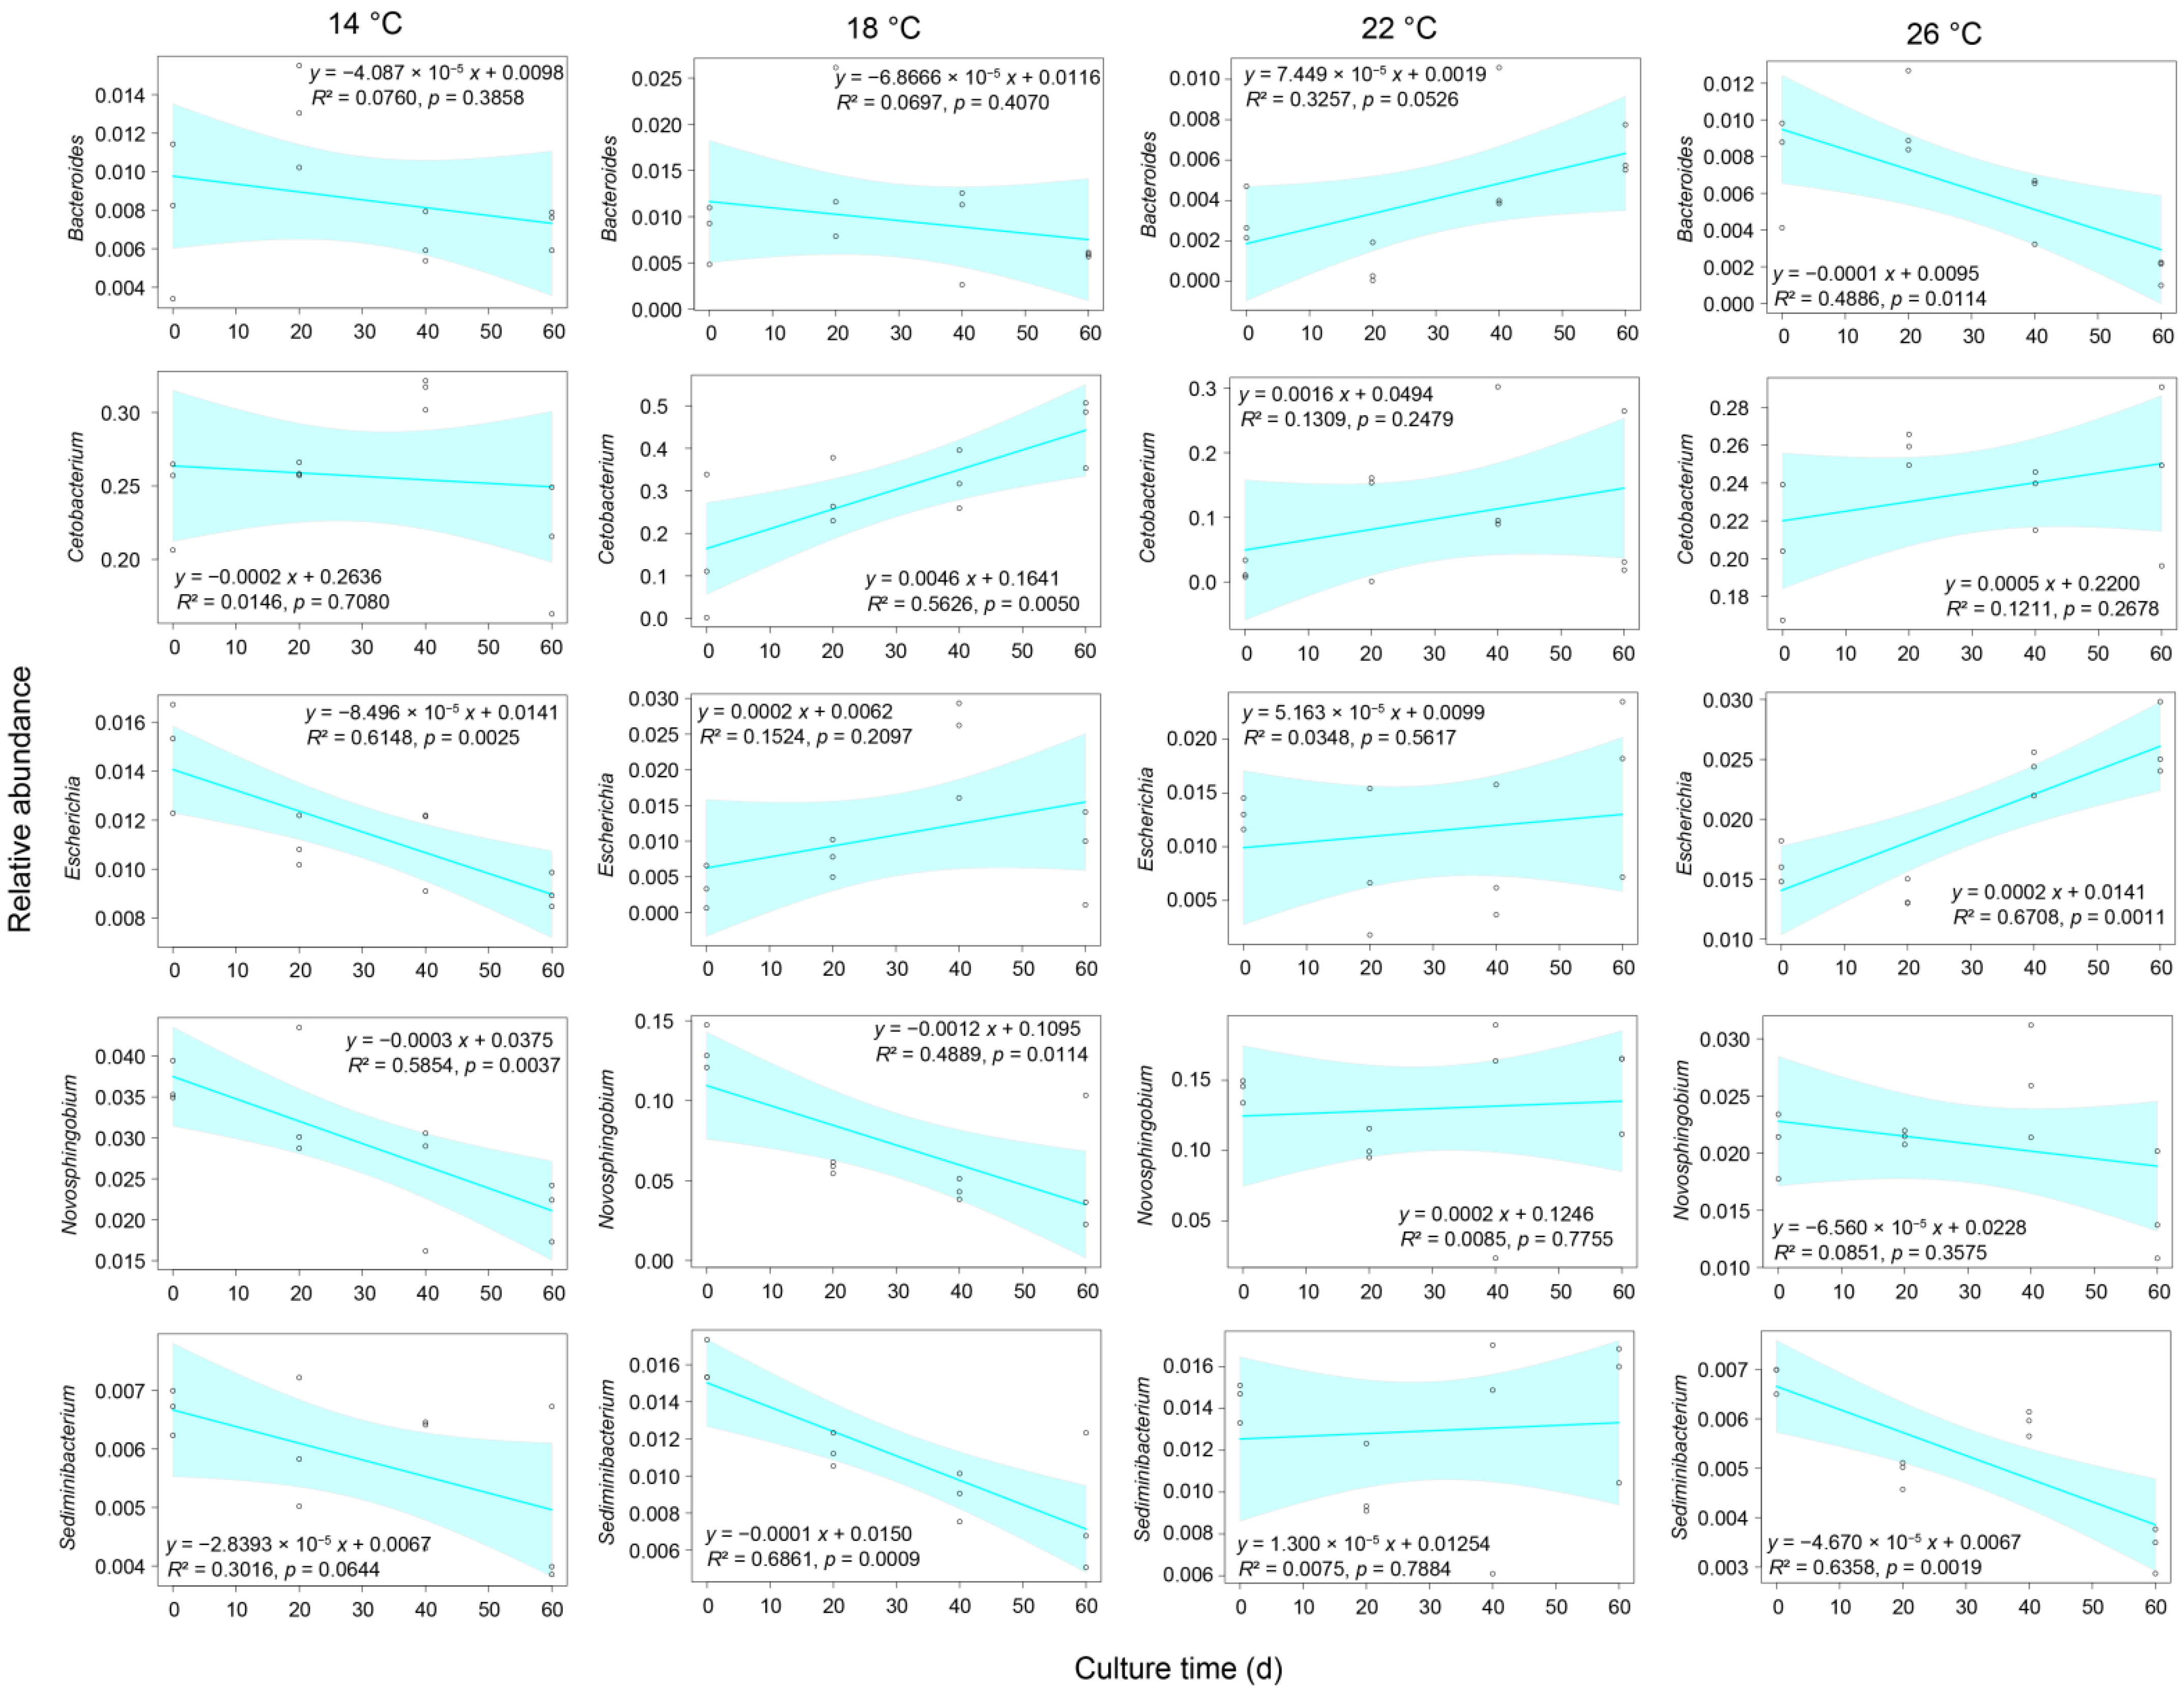
3.3. Effect of Water Temperature on the Gut Microbiota Structure of Percocypris pingi

After removing low-quality sequences, 1,527,925 high-quality sequences were obtained from 48 gut microbiota samples of P. pingi cultured at different temperatures. To eliminate the interference of various sample sequencing depths on the subsequent analysis results, we randomly selected 22,306 sequences from each sample for subsequent analysis. Although 65 phyla were detected in these sequences, Crenarchaeota, Euryarchaeota, Parvarchaeota, Acidobacteria, Actinobacteria, Bacteroidetes, Chloroflexi, Cyanobacteria, Firmicutes, Fusobacteria, Planctomycetes, Proteobacteria, SBR1093, Tenericutes, and Verrucomicrobia dominated the gut microbiota, containing 97.33 ± 0.20% of the high-quality sequences analyzed in this study (Figure 2A). Although their relative abundances varied between different temperature groups at distinct time points during culture, only the relative abundances of Actinobacteria and Verrucomicrobia in the group subjected to 18 °C decreased gradually with culture time, whereas the relative abundance of Fusobacteria gradually increased (Figure 3 and Figure 4).
A total of 12,090 OTUs were identified. However, an average of 1763.83 ± 55.67 OTUs were detected in each sample (Figure 2B). At the beginning of the experiment, there was no significant difference in the average weight and activities of ACP, AKP, and SOD in the liver and kidney of P. pingi samples between different temperature groups (Table 1), and the α-diversity indices of the gut microbiota were significantly different between the different temperature groups (Figure 2B–E). Particularly, the richness, Shannon, and Simpson indices of the gut microbiota in the groups subjected to 26 °C were significantly higher than those in the groups subjected to 18 °C and 22 °C, and the ACE index was significantly higher than that of the group subjected to 22 °C. Moreover, the richness, ACE, and Shannon indices of the gut microbiota in the group subjected to 14 °C were significantly higher than those in the group subjected to 18 °C (p < 0.05; Figure 2B–E). Although these α-diversity indices changed significantly during the experiment, they did not correlate with culture temperature (Figure 2B–E). These results suggest that culture temperature did not affect the α-diversity of the P. pingi gut microbiota.
At the genus level, 1212 genera were detected in the gut microbiota, of which 47 were dominant (Figure 5). Although the relative abundances of the most dominant genera were significantly different between the groups (p < 0.05; Figure 5), only Bacteroides, Cetobacterium, Novosphingobium, Sediminibacterium, and Escherichia weakly correlated with temperature (Figure 6). The ratio of the relative abundance of Bacteroides in the 22 °C and 26 °C groups was reversed with the passage of culture time (Figure 6 and Figure 7). The relative abundance of Cetobacterium in the group subjected to 18 °C exhibited an upward trend with the increase in culture time, whereas that of Novosphingobium and Sediminibacterium gradually declined (Figure 6 and Figure 7). Moreover, the relative abundance of Escherichia in the group subjected to 26 °C group exhibited an upward trend with the increase in culture time (Figure 6 and Figure 7).
To analyze the correlation between the gut microbiota composition of P. pingi and the culture conditions (temperature and sampling time) and the activities of ACP, AKP, and SOD in the liver and kidney of P. pingi, RDA with the Monte Carlo method was used to analyze the correlation between OTU and the dominant genus composition of P. pingi gut microbiota and the indicators. The results showed that only sample time and kidney ACP activity were significantly correlated with the composition of P. pingi gut microbiota (Figure 8A,B). Pearson correlation analysis showed that the sample time was significantly positively correlated with the relative abundances of Cetobacterium and Curvibacter but significantly negatively correlated with the relative abundances of Mycoplasma, Streptococcus, Corynebacterium, and Laceyella. Culture temperature was significantly positively correlated with the relative abundance of Escherichia and Vitreoscilla and was significantly negatively correlated with Bacteroides. ACP activity in the liver was significantly positively correlated with the relative abundance of Exiguobacterium spp. Liver SOD activity was significantly negatively correlated with the relative abundance of Aeromonas and Vitreoscilla. Kidney ACP and AKP activities were significantly positively correlated with the relative abundances of Aeromonas and Curvibacter, respectively (Figure 8C,D).

4. Discussion

With the continuous increase in global temperatures, the impact of temperature rise on aquatic ecosystems has attracted extensive attention [30,31,32,33]. The most noticeable ecological impact of global warming is a shift in species’ range toward higher altitudes and latitudes, in agreement with their thermal preferences at biogeographical scales [34,35,36]. Daufresne et al. [31] reported a significant increase in the proportion of small-sized species and young age classes and a decrease in the size of fish in aquatic ecosystems, in agreement with Bergmann’s, James’, and temperature-size rules [37,38]. Moreover, the temperature-size rule predicts a higher growth rate but a lower final size at higher temperatures within the appropriate temperature range [39]. However, when the temperature exceeds the suitable growth temperature, the growth rates of ectotherms decrease with an increase in temperature [39]. In this study, our results showed that the growth rates of P. pingi at 18 and 22 °C were significantly higher than those at 14 and 26 °C (Table 1), although the optimum temperature of P. pingi was reported to range from 8–27 °C [6]. These results imply that the temperatures ranging from 8–14 °C and from 26–27 °C probably were not the optimum temperature for P. pingi, which were similar to results obtained in the report by Chen et al. [12].
The effect of temperature on the gut microbiota of vertebrates has attracted extensive attention because the gut microbiota plays multiple essential functions in hosts, including digestion, immunity, and life history [19,40]. Bestion et al. [19] reported that a 2–3 °C warmer climate caused a 34% loss of gut microbiota diversity in common lizard (Zootoca vivipara) populations. Chen et al. [41] reported that the OTU number of the gut microbiota of Rhinogobio cylindricus collected in autumn was significantly higher than that collected in summer, but they could not exclude the influence of fish size on the results. However, our results did not show a significant impact of temperature changes on the composition and diversity of P. pingi gut microbiota when temperatures were within the optimum range. This may be because of the short experimental period. Therefore, longer experimental periods, including intergenerational experiments, are needed to study the impact of long-term temperature changes on fish gut microbiota.
Adaptation to changing temperatures involves adjustments of both the density and functional properties of fish mitochondria, thus affecting reactive oxygen species (ROS) generation and antioxidant defenses [42]. Low temperatures increase unsaturated fatty acids in membrane lipids, which increases the risk of lipid hydrogen peroxide formation and oxidative injury [43]. Yang et al. [44] investigated the effects of temperature on the activities of antioxidant enzymes in Schizothorax prenanti by raising the culture water temperature from 11 °C to the critical thermal maximum within 1 °C/h and sampled and analyzed the activities of antioxidant enzymes at 11, 16, 21, 26, and 31 °C. They found that at 21 °C, catalase activity was significantly lower than that at 11, 16, and 26 °C in the livers of S. prenanti, and SOD activities at 16 and 21 °C were significantly lower than those at 11 and 26 °C [44]. However, our results showed that only SOD activity at 22 °C was significantly higher than that at 26 °C in the livers of P. pingi collected on the 60th day. No significant difference in ACP activity in the liver and kidney of P. pingi among the different temperature groups was observed. Based on the existing data, the water temperature range upstream of the Yangtze River is between 6 and 25 °C [45,46,47]. Therefore, we speculate that climate warming over a short period does not threaten the survival of wild P. pingi individuals.
Although our results did not show the significant impact of temperature changes on the composition and diversity of P. pingi gut microbiota, it is still noteworthy that there were significant positive correlations between Escherichia and Vitreoscilla and temperature, and a significant negative correlation between Bacteroides and temperature. Escherichia is a common pathogen [48,49], the bacterial hemoglobin from Vitreoscilla can support the aerobic growth of Escherichia coli lacking terminal oxidases [50], and Bacteroides has potential as a probiotic [51,52]. The impact of changes in the relative abundance of these bacteria in the gut microbiota caused by temperature changes on P. pingi health requires further study.

5. Conclusions

In the experimental temperature range (14–26 °C), the environmental water temperature significantly affected the growth of P. pingi but did not affect the activities of the ACP, AKP, and SOD in the liver and kidney or the composition of gut microbiota. P. pingi grew fastest at 22 °C, and this information helps P. pingi culture. Moreover, our results imply that climate warming over a short period does not threaten the survival of wild P. pingi.

Author Contributions

Conceptualization, X.W., X.L. and D.Y.; methodology, X.W., X.L. and Y.Z.; software, X.L. and J.N.; validation, X.W., X.L. and J.N.; formal analysis, X.W.; investigation, X.W., X.L., Y.Z., J.G., T.Z. and D.Y.; resources, X.L. and D.Y.; data curation, T.Z.; writing—original draft preparation, X.W. and J.N.; writing—review and editing, X.L. and D.Y.; visualization, X.W. and J.N.; supervision, Y.Z., J.G. and T.Z.; project administration, X.L.; funding acquisition, X.L. and D.Y. All authors have read and agreed to the published version of the manuscript.

Funding

This research was funded by the Central Public-interest Scientific Institution Basal Research Fund, grant number 2017JBF0203; China Agriculture Research System of MOF and MARA, grant number CARS-46; and Central Public-interest Scientific Institution Basal Research Fund, CAFS, grant number 2020TD57.

Institutional Review Board Statement

All animal experiments in the present study were approved by the Institutional Animal Care and Use Committee of the Yangtze River Fisheries Research Institute, Chinese Academy of Fishery Sciences (approval no. 2018YFI-WXB-01), and they were performed following the institutional ethical guidelines for experimental animals.

Informed Consent Statement

Not applicable.

Data Availability Statement

All DNA sequences were deposited in the NCBI Sequence Read Archive database with the accession number PRJNA893412.

Acknowledgments

The authors are grateful to Zhijun Shu for his help in culturing the experimental fish and sample collection, and to an anonymous technician at Guangdong Meilikang Bio-Science Ltd. (Foshan, China), China for assistance with data analysis.

Conflicts of Interest

JN is an employee of Guangdong Meilikang Bio-Science Ltd., (Foshan, China).

References

  1. Li, Y.; Wang, J.; Peng, Z. The complete mitochondrial genome of Percocypris pingi (Teleostei, Cypriniformes). Mitochondrial. DNA 2013, 24, 40–42. [Google Scholar] [CrossRef] [PubMed]
  2. Wang, Y.; Yue, X. Embryonic development of Percocypris pingi. Sichuan J. Zool. 2013, 32, 530–534. [Google Scholar] [CrossRef]
  3. He, Y.; Wu, X.; Zhu, Y.; Yang, D.; Zhan, H. Allometric growth pattern of Percocypris pingi pingi larvae. Chin. J. Zool. 2013, 48, 8–15. [Google Scholar]
  4. National Forestry and Grassland Administration. List of Key Protected Wild Animals in China. Available online: http://www.gov.cn/xinwen/2021-02/09/5586227/files/e007df5cdb364bcdbcb89d169047d6c5.pdf (accessed on 1 March 2021).
  5. Zhan, H.; Yang, D.; Li, Z.; Wang, Y.; Zhou, L.; Wu, X.; Yang, L. Artificial propagation of Percocypris pingi. J. Hydroecol. 2016, 37, 84–88. [Google Scholar] [CrossRef]
  6. Jin, F.-P.; Li, G.-H.; Li, L.; Qin, X.; Li, K.; Wu, J.-J.; Gao, H.-T.; Xia, Y.-D.; Liu, F. Effects of temperature, pH and salinity on the survival of juvenile Percocypris pingi retrodorslis. Acta Hydrobiol. Sinica 2018, 42, 578–583. [Google Scholar]
  7. Crawshaw, L.I. Physiological and behavioral reactions of fishes to temperature change. J. Fish. Res. Board. Can. 1977, 34, 730–734. [Google Scholar] [CrossRef]
  8. Volkoff, H.; Rønnestad, I. Effects of temperature on feeding and digestive processes in fish. Temperature 2020, 7, 307–320. [Google Scholar] [CrossRef]
  9. Neubauer, P.; Andersen, K.H. Thermal performance of fish is explained by an interplay between physiology, behaviour and ecology. Conserv. Physiol. 2019, 7, coz025. [Google Scholar] [CrossRef] [Green Version]
  10. Christensen, E.A.F.; Norin, T.; Tabak, I.; van Deurs, M.; Behrens, J.W. Effects of temperature on physiological performance and behavioral thermoregulation in an invasive fish, the round goby. J. Exp. Biol. 2021, 224, jeb237669. [Google Scholar] [CrossRef]
  11. Alfonso, S.; Gesto, M.; Sadoul, B. Temperature increase and its effects on fish stress physiology in the context of global warming. J. Fish. Biol. 2021, 98, 1496–1508. [Google Scholar] [CrossRef]
  12. Chen, X.; Deng, S.; Li, X.; Tan, Z.; Wan, Y.; Yao, L. Biological characteristics and culture techniques of Percocypris pingi. Hebei Fish. 2015, 254, 32–34. [Google Scholar] [CrossRef]
  13. Jandhyala, S.M.; Talukdar, R.; Subramanyam, C.; Vuyyuru, H.; Sasikala, M.; Reddy, D.N. Role of the normal gut microbiota. World J. Gastroenterol. 2015, 21, 8787–8803. [Google Scholar] [CrossRef]
  14. Jones, R.M. The influence of the gut microbiota on host physiology: In pursuit of mechanisms. Yale J. Biol. Med. 2016, 89, 285–297. [Google Scholar]
  15. Pickard, J.M.; Zeng, M.Y.; Caruso, R.; Núñez, G. Gut microbiota: Role in pathogen colonization, immune responses and inflammatory disease. Immunol. Rev. 2017, 279, 70–89. [Google Scholar] [CrossRef]
  16. Rowland, I.; Gibson, G.; Heinken, A.; Scott, K.; Swann, J.; Thiele, I.; Tuohy, K. Gut microbiota functions: Metabolism of nutrients and other food components. Eur. J. Nutr. 2018, 57, 1–24. [Google Scholar] [CrossRef] [Green Version]
  17. Yang, J.; Yang, Y.; Ishii, M.; Nagata, M.; Aw, W.; Obana, N.; Tomita, M.; Nomura, N.; Fukuda, S. Does the gut microbiota modulate host physiology through polymicrobial biofilms? Microbes Environ. 2020, 35, ME20037. [Google Scholar] [CrossRef]
  18. Ghosh, S.K.; Wong, M.K.-S.; Hyodo, S.; Goto, S.; Hamasaki, K. Temperature modulation alters the gut and skin microbial profiles of chum salmon (Oncorhynchus keta). Front. Marine Sci. 2022, 9, 1027621. [Google Scholar] [CrossRef]
  19. Bestion, E.; Jacob, S.; Zinger, L.; Gesu, L.D.; Richard, M.; White, J.; Cote, J. Climate warming reduces gut microbiota diversity in a vertebrate ectotherm. Nature Ecol. Evol. 2017, 1, 0161. [Google Scholar] [CrossRef] [PubMed]
  20. Zeng, B.; Zhang, B.; Liu, H.; Wang, J.; Wang, W.; Zhu, C.; Mu, Z.; Wang, J.; Zhou, J.; Wang, J. Effects of dietary protein level on growth, feed utilization, morphology parameters and muscle nutritional components of Schizopygopsis younghusbandi Regan. Chin. J. Anim. Nutr. 2019, 31, 1231–1239. [Google Scholar] [CrossRef]
  21. Gabryelak, T.; Zalesna, G.; Roche, H.; Pérès, G. Peroxide metabolism enzymes in erythrocytes of freshwater and marine fish species. Comp. Biochem. Physiol. 1989, 92, 5–8. [Google Scholar] [CrossRef]
  22. Popovic, N.T.; Strunjak-Perovic, I.; Coz-Rakovac, R.; Barisic, J.; Jadan, M.; Berakovic, A.P.; Klobucar, R.S. Tricaine methane-sulfonate (MS-222) application in fish anaesthesia. J. Appl. Ichthyol. 2012, 28, 553–564. [Google Scholar] [CrossRef] [Green Version]
  23. Xiang, J.; He, T.; Wang, P.; Xie, M.; Xiang, J.; Ni, J. Opportunistic pathogens are abundant in the gut of cultured giant spiny frog (Paa spinosa). Aquacul. Res. 2018, 49, 2033–2041. [Google Scholar] [CrossRef]
  24. Ni, J.; Huang, R.; Zhou, H.; Xu, X.; Li, Y.; Cao, P.; Zhong, K.; Ge, M.; Chen, X.; Hou, B.; et al. Analysis of the relationship between the degree of dysbiosis in gut microbiota and prognosis at different stages of primary hepatocellular carcinoma. Front. Microbiol. 2019, 10, 1458. [Google Scholar] [CrossRef] [PubMed]
  25. Caporaso, J.G.; Kuczynski, J.; Stombaugh, J.; Bittinger, K.; Bushman, F.D.; Costello, E.K.; Fierer, N.; Peña, A.G.; Goodrich, J.K.; Gordon, J.I.; et al. QIIME allows analysis of high-throughput community sequencing data. Nat. Methods 2010, 7, 335–336. [Google Scholar] [CrossRef] [PubMed] [Green Version]
  26. Ni, J.; Fu, C.; Huang, R.; Li, Z.; Li, S.; Cao, P.; Zhong, K.; Ge, M.; Gao, Y. Metabolic syndrome cannot mask the changes of faecal microbiota compositions caused by primary hepatocellular carcinoma. Lett. Appl. Microbiol. 2021, 73, 73–80. [Google Scholar] [CrossRef] [PubMed]
  27. Edgar, R.C. UPARSE: Highly accurate OTU sequences from microbial amplicon reads. Nat. Methods 2013, 10, 996–998. [Google Scholar] [CrossRef]
  28. Wang, Q.; Garrity, G.M.; Tiedje, J.M.; Cole, J.R. Naïve Bayesian classifier for rapid assignment of rRNA sequences into the new bacterial taxonomy. Appl. Environ. Microbiol. 2007, 73, 5261–5267. [Google Scholar] [CrossRef] [Green Version]
  29. Dixon, P. VEGAN, a package of R functions for community ecology. J. Veg. Sci. 2003, 14, 927–930. [Google Scholar] [CrossRef]
  30. Meyer, J.L.; Sale, M.J.; Mulholland, P.J.; Poff, N.L. Impacts of climate change on aquatic ecosystem functioning and health. J. Am. Water Resour. Assoc. 1999, 35, 1373–1386. [Google Scholar] [CrossRef]
  31. Daufresne, M.; Lengfellner, K.; Sommer, U. Global warming benefits the small in aquatic ecosystems. Proc. Natl. Acad. Sci. USA 2009, 106, 12788–12793. [Google Scholar] [CrossRef] [Green Version]
  32. Eissa, A.E.; Zaki, M.M. The impact of global climatic changes on the aquatic environment. Procedia Environ. Sci. 2011, 4, 251–259. [Google Scholar] [CrossRef] [Green Version]
  33. Häder, D.-P.; Barnes, P.W. Comparing the impacts of climate change on the responses and linkages between terrestrial and aquatic ecosystems. Sci. Total. Environ. 2019, 682, 239–246. [Google Scholar] [CrossRef] [PubMed]
  34. Walther, G.R.; Post, E.; Convey, P.; Menzel, A.; Parmesan, C.; Beebee, T.J.C.; Fromentin, J.-M.; Hoegh-Guldberg, O.; Bairlein, F. Ecological responses to recent climate change. Nature 2002, 416, 389–395. [Google Scholar] [CrossRef] [PubMed]
  35. Parmesan, C.; Yohe, G. A globally coherent fingerprint of climate change impacts across natural systems. Nature 2003, 421, 37–42. [Google Scholar] [CrossRef] [PubMed]
  36. Root, T.L.; Price, J.T.; Hall, K.R.; Schneider, S.H.; Rosenzweig, C.; Pounds, J.A. Fingerprints of global warming on wild animals and plants. Nature 2003, 421, 57–60. [Google Scholar] [CrossRef] [PubMed]
  37. Bergmann, C. About the relationships between heat conservation and body size of animals. Goett. Stud. 1847, 1, 595–708. [Google Scholar]
  38. Atkinson, D. Temperature and organism size: A biological law for ectotherms? Adv. Ecol. Res. 1994, 25, 1–58. [Google Scholar]
  39. Angilletta, M.J.; Dunham, A.E. The temperature-size rule in ectotherms: Simple evolutionary explanations may not be general. Am. Nat. 2003, 162, 332–342. [Google Scholar] [CrossRef] [Green Version]
  40. Turnbaugh, P.J.; Ley, R.E.; Hamady, M.; Fraser-Liggett, C.M.; Knight, R.; Gordon, J.I. The human microbiome project. Nature 2007, 449, 804–810. [Google Scholar] [CrossRef] [Green Version]
  41. Chen, X.J.; Zhu, Q.G.; Yang, Z.; Zhao, N.; Ni, J.J. Cross seasonal inheritance and impact of ambient water microbiota on the gut microbiota of Rhinogobio cylindricus Günther. Appl. Ecol. Environ. Res. 2022, 20, 4539–4551. [Google Scholar] [CrossRef]
  42. Pörtner, H.O. Climate variations and the physiological basis of temperature dependent biogeography: Systemic to molecular hierarchy of thermal tolerance in animals. Comp. Biochem. Physiol. 2002, 132, 739–761. [Google Scholar] [CrossRef] [PubMed]
  43. Martínez-Álvarez, R.M.; Morales, A.E.; Sanz, A. Antioxidant defenses in fish: Biotic and abiotic factors. Rev. Fish. Biol. Fish. 2005, 15, 75–88. [Google Scholar] [CrossRef]
  44. Yang, S.; Yan, T.; Zhao, L.; Wu, H.; Du, Z.; Yan, T.; Xiao, Q. Effects of temperature on activities of antioxidant enzymes and Na+/K+—ATPase, and hormone levels in Schizothorax prenanti. J. Thermal. Biol. 2018, 72, 155–160. [Google Scholar] [CrossRef] [PubMed]
  45. Luo, H.; Li, Q.; Li, C. The impact of water temperature during the fish reproduction in the upper Yangtze River due to the cascade development in the lower Jinsha River. J. China Inst. Water Resour. Hydropow. Res. 2012, 10, 256–259. [Google Scholar]
  46. Li, Q.; Li, C.; Luo, H. Ecological target water temperature of rare and endemic fish in Yangtze River upstream. J. China Inst. Water Resour. Hydropow. Res. 2012, 10, 86–91. [Google Scholar]
  47. Sun, D.; Tian, H.; Zhang, H.; Zhou, Z.; Zhou, H. Monitoring of water temperature and changing relationship between the water temperature and air temperature in the upper Yangtze River. J. Build. Energ. Effic. 2010, 12, 74–77. [Google Scholar] [CrossRef]
  48. Kalita, A.; Hu, J.; Torres, A.G. Recent advances in adherence and invasion of pathogenic Escherichia coli. Curr. Opin. Infect. Dis. 2014, 27, 459–464. [Google Scholar] [CrossRef]
  49. Poolman, J.T.; Wacker, M. Extraintestinal pathogenic Escherichia coli, a common human pathogen: Challenges for vaccine development and progress in the field. J. Infect. Dis. 2016, 213, 6–13. [Google Scholar] [CrossRef] [Green Version]
  50. Dikshit, R.P.; Dikshit, K.L.; Liu, Y.; Webster, D.A. The bacterial hemoglobin from Vitreoscilla can support the aerobic growth of Escherichia coli lacking terminal oxidases. Arch. Biochem. Biophys. 1992, 293, 241–245. [Google Scholar] [CrossRef]
  51. Deng, H.; Li, Z.; Tan, Y.; Guo, Z.; Liu, Y.; Wang, Y.; Yuan, Y.; Yang, R.; Bi, Y.; Bai, Y.; et al. A novel strain of Bacteroides fragilis enhances phagocytosis and polarises M1 macrophages. Sci. Rep. 2016, 6, 29401. [Google Scholar] [CrossRef] [Green Version]
  52. Tan, H.; Zhai, Q.; Chen, W. Investigations of Bacteroides spp. towards next-generation probiotics. Food Res. Int. 2019, 116, 637–644. [Google Scholar] [CrossRef] [PubMed]
Figure 1. Enzymatic activities of ACP, AKP, and SOD in the liver (A); and kidney (B) of Percocypris pingi at different culture temperatures. The difference in the lower-case letters above the boxes indicates a significant difference between the two groups (p < 0.05).
Fishes 07 00374 g001
Figure 2. Dominant phylum compositions (A); and α-diversity indices (BE) of Percocypris pingi gut microbiota at different culture temperatures. (B) Richness index; (C) ACE index; (D) Shannon index; and (E) Simpson index. Dots in the boxplots indicate values measured in samples. Different letters above the boxes indicate significant differences (p < 0.05).
Fishes 07 00374 g002
Figure 3. Relative abundance changes of commonly dominant phyla of Percocypris pingi gut microbiota at different culture temperatures. Dots in the boxplots indicate values measured in samples. Distinct letters above the boxes indicate significant differences (p < 0.05).
Fishes 07 00374 g003
Figure 4. Correlation between the culture time and the relative abundances of Actinobacteria, Fusobacteria, and Verrucomicrobia in Percocypris pingi gut microbiota. Dots in the boxplots indicate values measured in samples.
Fishes 07 00374 g004
Figure 5. Heatmap profile of dominant genera of Percocypris pingi gut microbiota at different culture temperatures. * p < 0.05; ** p < 0.01; *** p < 0.001.
Fishes 07 00374 g005
Figure 6. Relative abundance changes of commonly dominant genera of Percocypris pingi gut microbiota at different culture temperatures. Dots in the boxplots indicate values measured in samples. Distinct letters above the boxes indicate significant differences (p < 0.05).
Fishes 07 00374 g006
Figure 7. Correlation between the culture time and the relative abundances of Bacteroides, Cetobacterium, Novosphingobium, Sediminibacterium, and Escherichia in Percocypris pingi gut microbiota. Dots in the boxplots indicate values measured in samples.
Fishes 07 00374 g007
Figure 8. Correlation between gut microbiota compositions and activities of ACP, AKP, and SOD in the liver and kidney of Percocypris pingi: (A) RDA profile shows the correlation between operational taxonomic unit (out) compositions of P. pingi gut microbiota and internal- and external-physicochemical factors; (B) RDA profile shows the correlation between dominant genus compositions of P. pingi gut microbiota and internal- and external-physicochemical factors; (C) the bubble chart shows the correlation between the commonly dominant genera of P. pingi gut microbiota and internal- and external-physicochemical factors; and (D) significant correlation between the commonly dominant genera of P. pingi gut microbiota and internal- and external-physicochemical factors. * p < 0.05; ** p < 0.01; *** p < 0.001.
Fishes 07 00374 g008
Table 1. Body weight and weight gain rate of juvenile Percocypris pingi at different temperatures. Significant differences in means between the four culture temperature groups are indicated using distinct shoulder letters in the same row (p < 0.05).
ItemCulture Time (d)Culture Temperature (°C)
14182226
Body weight (g/ind.)033.61 ± 0.7734.65 ± 0.4534.43 ± 0.9733.39 ± 0.93
2035.95 ± 0.64 a40.84 ± 0.97 b40.34 ± 0.68 b36.11 ± 1.00 a
4039.94 ± 1.21 a48.33 ± 1.17 b46.84 ± 1.12 b37.42 ± 1.16 a
6042.58 ± 0.48 a53.25 ± 1.41 b52.79 ± 1.09 b40.02 ± 1.36 a
Weight gain rate (%)206.97 ± 0.55 a17.87 ± 3.02 b17.22 ± 2.26 b8.19 ± 4.05 a
4011.08 ± 1.39 a18.34 ± 0.74 b16.13 ± 1.40 b3.62 ± 0.35 c
606.66 ± 2.24 a10.17 ± 0.76 ab12.7 ± 2.79 b6.96 ± 1.96 a
Specific growth rate (%)200.34 ± 0.03 a0.82 ± 0.13 b0.79 ± 0.10 b0.39 ± 0.19 a
400.53 ± 0.07 a0.84 ± 0.03 b0.75 ± 0.06 b0.18 ± 0.02 c
600.32 ± 0.11 a0.48 ± 0.03 a,b0.60 ± 0.13 b0.33 ± 0.09 a
Publisher’s Note: MDPI stays neutral with regard to jurisdictional claims in published maps and institutional affiliations.

