1. Introduction
A decade or more ago, the future of tuna farming in terms of both human and fish nutrition against a scenario of diminishing global supply of marine resources, fishmeal (FM) and fish oil (FO), was envisaged and discussed [
1,
2]. Part of the solution has come through the partial replacement of FM and FO with plant meals and vegetable oils (VO), respectively [
3]. Any formulated feed for farmed tuna would have to be dependent, to some extent, upon global supplies of FM and FO in order to meet both the fish’s nutritional requirements and to tailor for market expectations. Fish performance, as well as flesh quality, could be influenced by feeds containing more sustainable alternatives to FM and FO, which in turn could have a greater market impact on tuna than on most other fish species [
2].
In comparison to FO, the main issue with terrestrial alternatives such as VO is the lack of omega-3 long-chain polyunsaturated fatty acids (n-3 LC-PUFA; ≥20 carbons and ≥3 double bonds), such as the health-beneficial eicosapentanoate (EPA; 20:5n-3) and docosahexaonate (DHA; 22:6n-3). These fatty acids are characteristic of the marine environment, with microalgae and other marine microbes being the primary producers. Consequently, a major undesirable effect of substituting FO with VO is the reduction in levels of LC-PUFA in flesh, which ultimately impacts the human consumer. Therefore, the main issue in replacing dietary FO is maintaining the supply of essential omega-3 LC-PUFA [
4]. Very recently, alternative sustainable terrestrial sources of EPA and DHA have become available in the form of oils from microalgae and GM oilseed crops [
3,
5,
6,
7,
8,
9,
10]. Metabolic engineering of oilseed crops, for example,
Camelina sativa, has allowed the production of “hybrid” VOs rich in omega-3 LC-PUFA, characteristics of the marine environment, as well as shorter chain PUFA such as α-linolenic (LNA; 18:3n-3) and linoleic (LA; 18:2n-6) acids, characteristic of terrestrial environments [
11,
12,
13]. Oils derived from different iterations of GM Camelina have already been tested in Atlantic salmon (
Salmo salar) [
14,
15,
16,
17] as well as in sea bream (
Sparus aurata) [
18] and European sea bass (
Dicentrarchus labrax) [
19]. These new gene technologies can revolutionize the way we produce our food and, in aquaculture, have the potential to release pressure on wild fish stocks and improve the nutritional profiles of farmed fish for human consumption [
6,
7,
9,
20].
While uptake, digestion and storage of appropriate lipids improve the survival and growth of all fish species, for highly active migratory predator fish species such as tunas is particularly relevant [
1,
2]. The presence of n-3 LC-PUFA in fish is derived both from their diet and endogenous biosynthesis, with the latter varying considerably with species [
21,
22]. Furthermore, the n-3 LC-PUFA, EPA and DHA, are essential for the survival, normal growth and development of most marine fish [
23], with DHA in particular shown to be critical for the function of neural and retinal tissues [
24,
25,
26,
27,
28,
29]. Thus, the replacement of FO with VO lacking EPA and DHA makes farmed fish more dependent on the endogenous production of n-3 LC-PUFA via biosynthetic pathways depending upon the expression of key enzymes such as fatty acyl desaturases (Fads) and elongases of very long chain fatty acids (Elovl) [
14,
23]. Nonetheless, it has been reported recently that the capability of fish species for de novo synthesis of LC-PUFA is inversely correlated to the trophic level and those carnivorous marine fish species occupying higher levels are unable or exhibit only limited capacity to synthesize LC-PUFA from C
18 PUFA precursors [
22,
30]. Thus, top predators such as bluefin tuna species are known to have a poor capacity for the endogenous biosynthesis of EPA and DHA [
22,
31,
32,
33]. Furthermore, limited knowledge exists regarding the metabolic response of these species when fed reduced levels of marine ingredients are largely unknown.
Many enzymes and nuclear receptors (NR) in fish play key roles in lipogenesis and lipolysis including, among others, lipases, Fads, Elovl, transferases, and NR such as peroxisome proliferator-activated receptors (PPAR), sterol regulatory-element binding proteins (SREBP) and liver or retinoid receptors (LXR, RXR). As LC-PUFA are natural ligands that can bind and activate these NR, influencing the circulating levels of lipogenic and lipolytic genes [
22,
34], dietary n-3 LC-PUFA content affects the expression levels of a range of genes associated with lipid homeostasis and other pathways, such as antioxidant genes [
35,
36]. Therefore, studying the impacts of dietary lipids on fish metabolism, including lipid and fatty acid compositional changes, as well as the patterns of expression of genes involved in major lipid metabolic pathways in ABT is highly relevant [
37,
38,
39,
40].
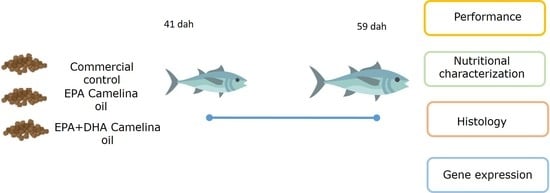
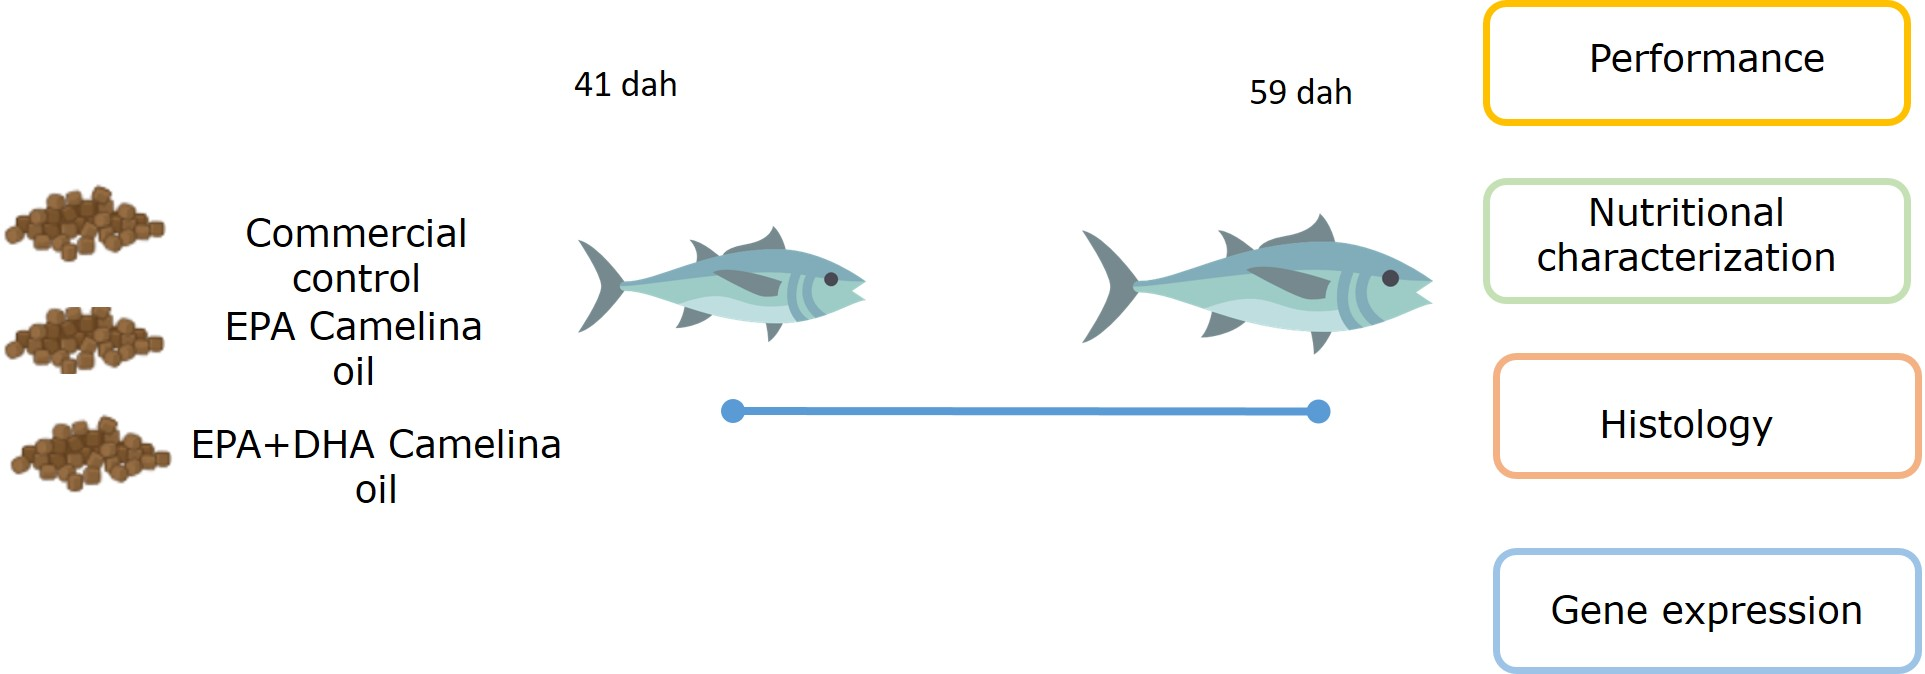
In this study, the efficacy of oils derived from transgenic Camelina sativa containing either EPA alone or EPA + DHA was evaluated in juvenile ABT using feeds that reflected current sustainable formulations compared to a commercial-like feed for pacific bluefin tuna (PBT) as a reference diet. The impacts of these new sources of de novo EPA and DHA on ABT growth performance and survival, feed utilisation, tissue fatty acid profiles, liver and intestine histo-morphology, and nutritional regulation of hepatic and intestinal gene expression were investigated.
4. Discussion
New, scalable sources of DHA and EPA that can increase the declining n-3 LC-PUFA contents of commercial feeds and, at the same time, do not compromise growth or feed efficiency are required to ensure the sustainable growth of aquaculture. A viable and feasible new source of EPA and DHA in aquafeeds could be the genetic modification of oilseed crops [
8]. In the present study, the ability of oils derived from GM-
Camelina sativa, containing either EPA or EPA + DHA, to promote growth, support tissue n-3 LC-PUFA levels, and impact metabolism were evaluated in ABT for the first time, and benchmarked against commercial feed formulated with marine FO that has been used successfully with PBT.
In the present study, values for growth performance, feed utilisation and survival were better than those obtained previously in ABT juveniles [
39] and similar to studies in PBT juveniles of the same size [
59]. While some parameters (weight gain %, FCR and survival) showed no difference among treatments, others (final length and weight, SGR, CF, total intake, protein and energy retention) showed significant differences, mostly in the rank order MGK (reference) > DCO ≥ ECO. In contrast, DFR and lipid retention were lower in ABT fed the reference diet than in fish fed the test diets. However, despite the differences, it was clear both test feeds supported good growth and feed efficiency with the DCO diet containing higher DHA performing slightly better than diet ECO. No significant differences among diets were observed in terms of survival, partly due to high variability among treatments. However, studies in PBT juveniles showed that the major mortality at this stage is normally not associated with dietary deficiencies but with stress responses to external stimuli (light, noise, etc.) often resulting in collisions with the tank wall and death of the fish [
59,
60,
61].
Diet did not affect gross composition (protein, lipid and carbohydrate) or caloric content of whole ABT and there were no differences in lipid contents of the intestine, muscle, brain and eyes among the dietary treatments. Related to the latter, it was noteworthy that
fas expression (and likely lipogenesis) was upregulated in ABT fed the test feeds, probably in response to the slightly lower lipid content (~15%) of these feeds compared to the reference diet (17%). The lipid content of the liver was higher than in the other tissues reflecting lipid storage in this organ and was increased in fish fed the test diets compared to ABT fed the reference diet. In agreement, hepatocyte lipid vacuolisation was higher in ABT fed the test diets than in fish fed the commercial reference diet. This is a common outcome in many fish, especially marine species when fed VOs [
39,
62,
63,
64]. This may suggest that the fatty acid profiles of VOs could be less efficiently utilised by tuna as a source of metabolic energy, and thus more accumulated in the liver although the precise mechanism is unclear [
65,
66].
As expected, fatty acid compositions of whole fish and tissues generally reflected those of diets [
67]. In whole fish, it was clear that ABT fed the test diets accumulated only around half as much n-3 LC-PUFA as fish fed the high marine ingredient reference diet, and fish fed the DCO diet had a higher DHA level and DHA/EPA ratio than fish fed the ECO diet. However, irrespective of diet, the proportions of total n-3 LC-PUFA and DHA, and DHA/EPA ratio were higher in ABT than in the diet. Therefore, the test diets formulated with GM-
Camelina oils performed similarly to the reference feed formulated with FO in terms of supply of n-3 LC-PUFA, within the constraints of the lower level of DHA and EPA present in the test feeds. This was consistent with the results obtained previously in similar studies using feeds formulated with these
Camelina oils in other fish species such as Atlantic salmon, gilthead sea bream and European sea bass [
14,
15,
16,
17,
18].
Levels of LC-PUFA were similar in the intestine and muscle, and higher compared to levels in the liver, which may reflect the lower lipid levels and thus higher proportions of polar lipids in these tissues. It is well known that EPA and DHA tend to be selectively incorporated into polar lipids that are less responsive to diet in comparison to storage lipids [
4,
67,
68]. In a recent study, marine fish showed net gain and selective deposition of LC-PUFA in their tissues, despite having very limited capacity for endogenous biosynthesis [
68]. However, the impact of the different diets was similar in all tissues with the levels of n-3 LC-PUFA being lower in ABT fed the test diets compared to fish fed the reference diet, with tissues of fish fed the DCO diet showing higher DHA and DHA/EPA ratio than fish fed the ECO diet, all in line with the dietary levels of the fatty acids.
While still showing the above pattern, the fatty acid compositions of the brain and eye proved to be the least plastic, with fewer fatty acids showing significant differences among the different diets and the magnitude of the differences being lower than in other tissues. The neural/visual tissues also presented the highest levels of n-3 LC-PUFA, particularly DHA, reflecting the specific fatty acid requirements and metabolism of these tissues, and that their fatty acid profiles are under strict physiological control and, therefore, less representative of diet [
28,
68]. The specific accumulation of dietary and/or biosynthesised DHA (and ARA) in fish neural tissues, particularly during the development of the brain and retina, is well known [
24,
25,
26,
27,
28,
29]. This reflects the importance of DHA for neural and visual functions which is supported by the fact that diets deficient in DHA can lead to visual and behavioral impairments that are particularly critical in top visual predators such as ABT [
69,
70].
The impacts of feeds with low levels of marine ingredients and, thus, low levels of n-3 LC-PUFA on metabolic responses and the nutritional quality of ABT for human consumption are largely unknown. Marine fish evolved in LC-PUFA-rich food webs where there was insufficient selection pressure to develop and/or maintain the enzymatic capacity to biosynthesize LC-PUFA de novo in most species. Indeed, it was demonstrated that the biosynthetic capacity of LC-PUFA from C
18 PUFA is very restricted in bluefin tuna species [
31,
32,
33] although the production of DHA from EPA and/or 22:5n-3 is likely possible [
22]. The liver and intestine are generally two of the most active tissues in terms of lipid metabolism and both have been shown to be important sites for LC-PUFA biosynthesis in fish [
16,
22,
67,
68,
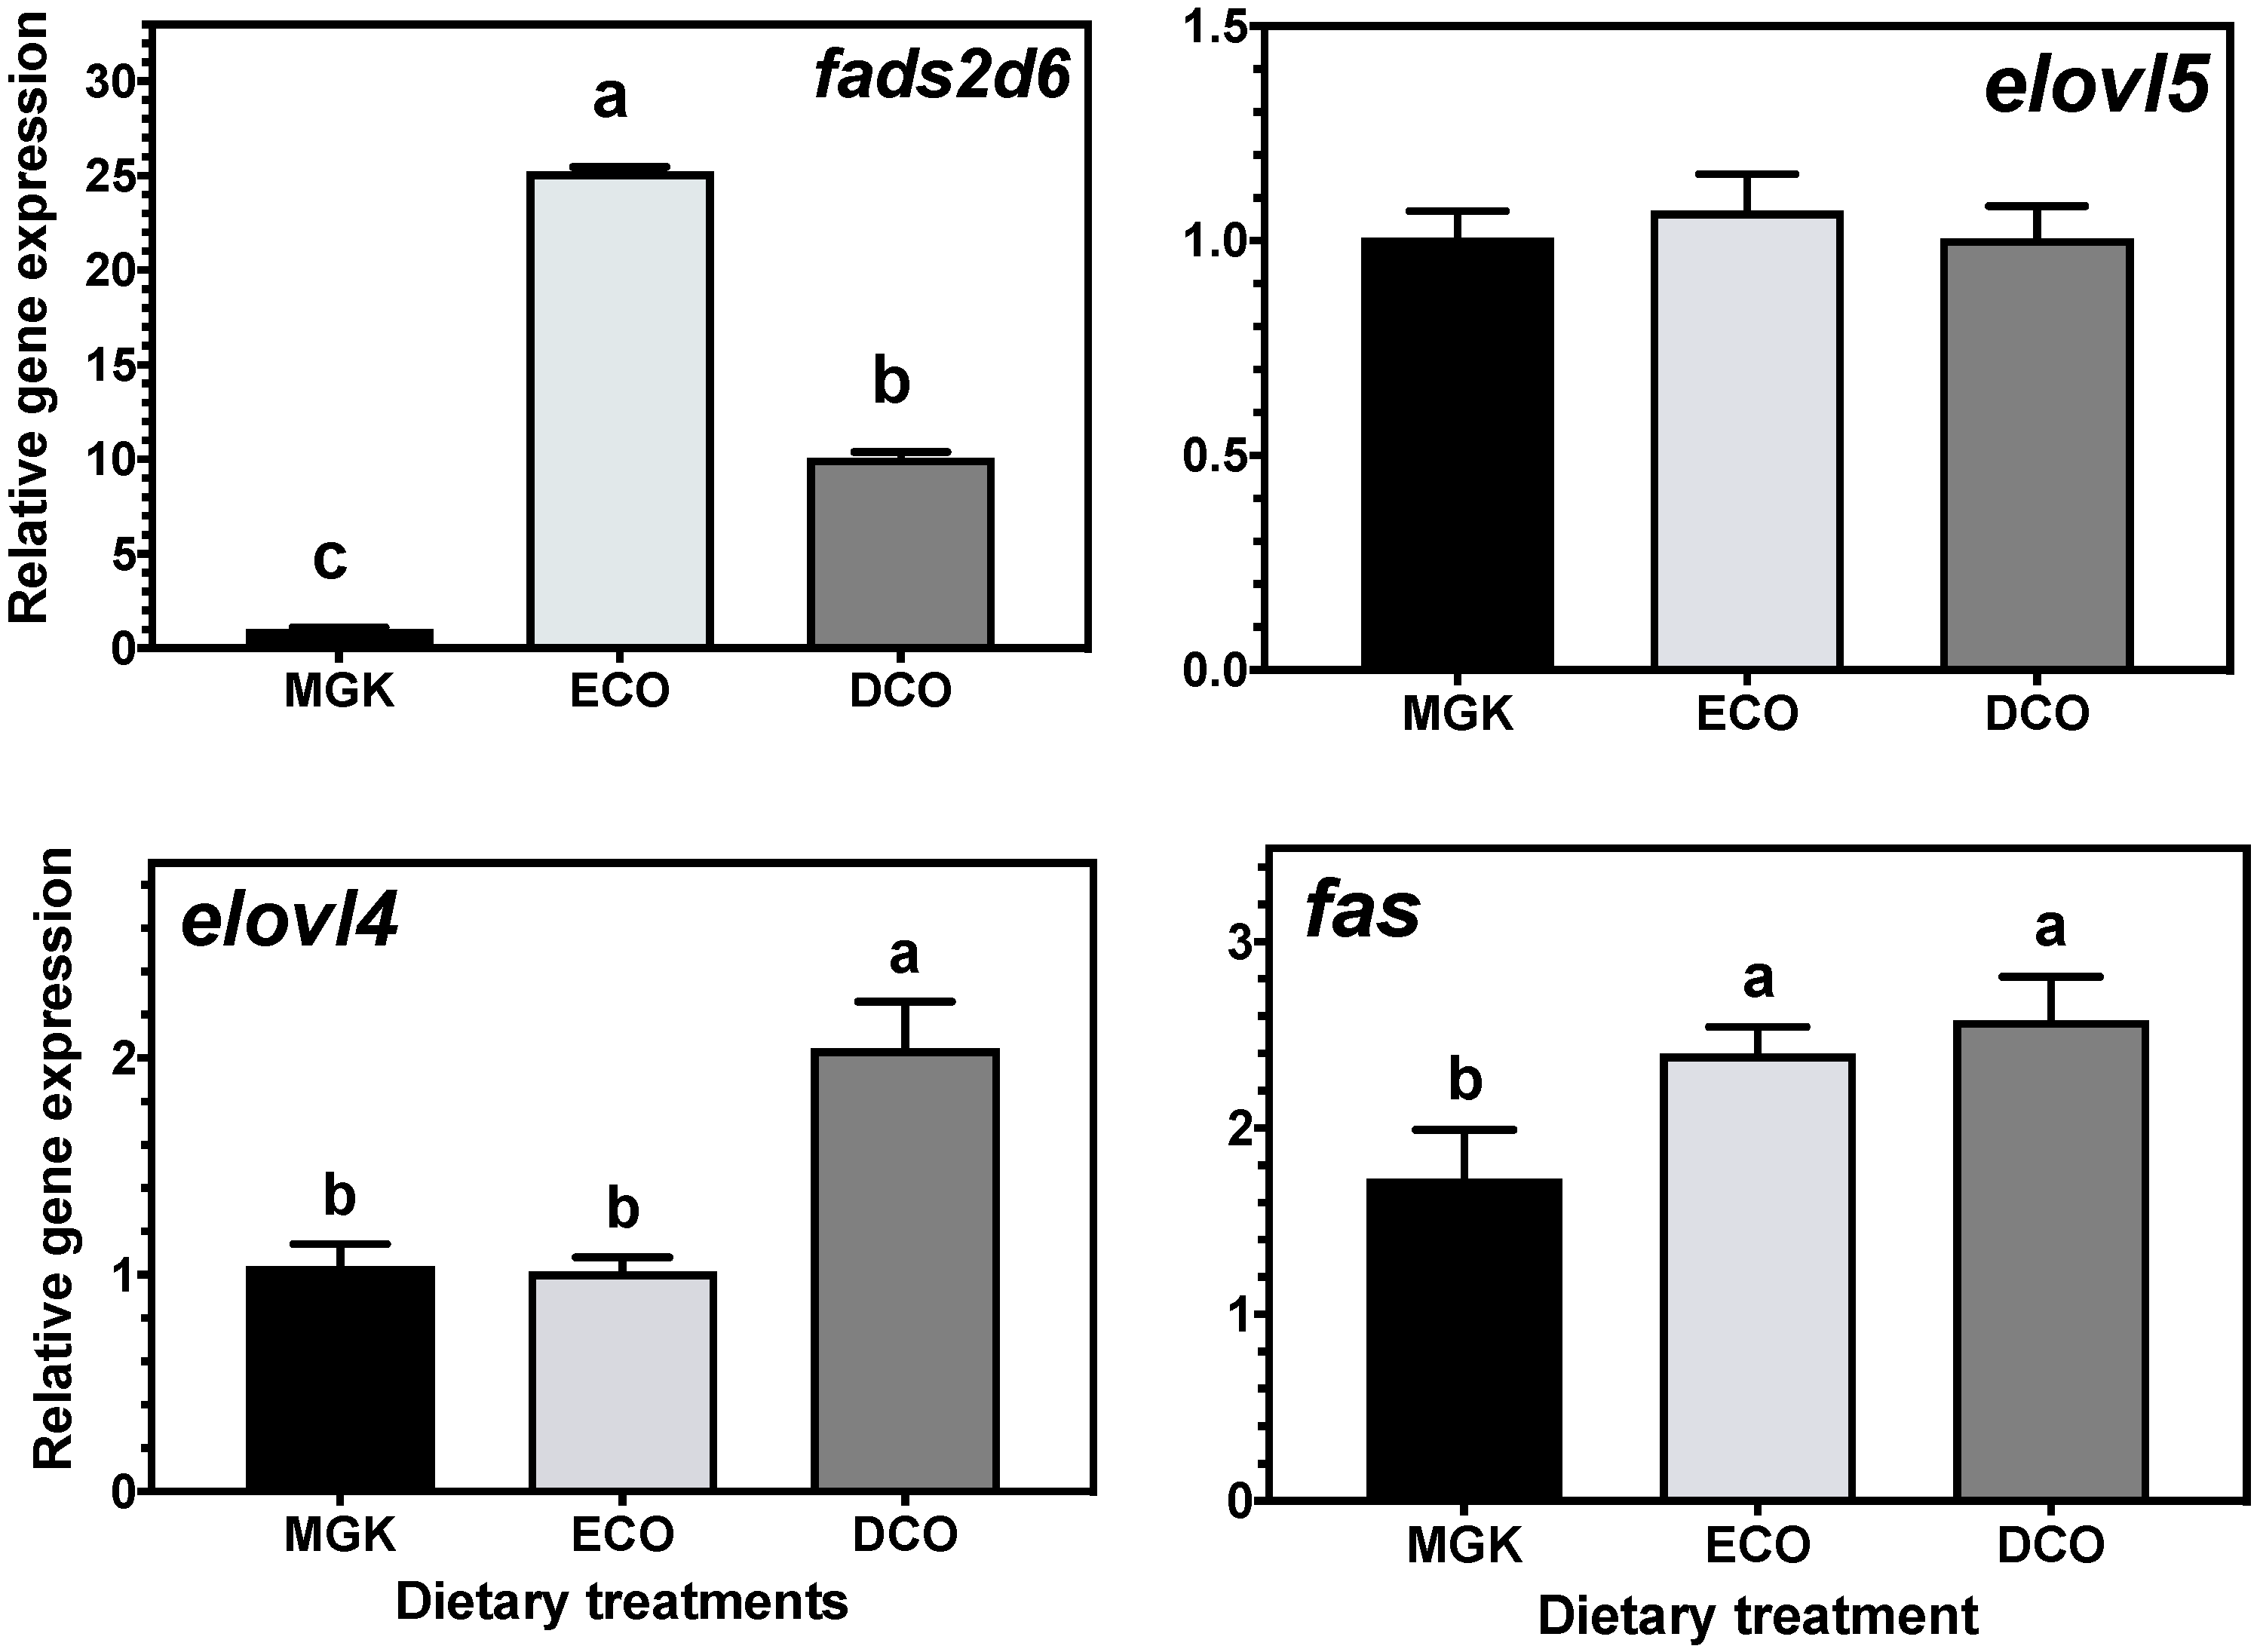
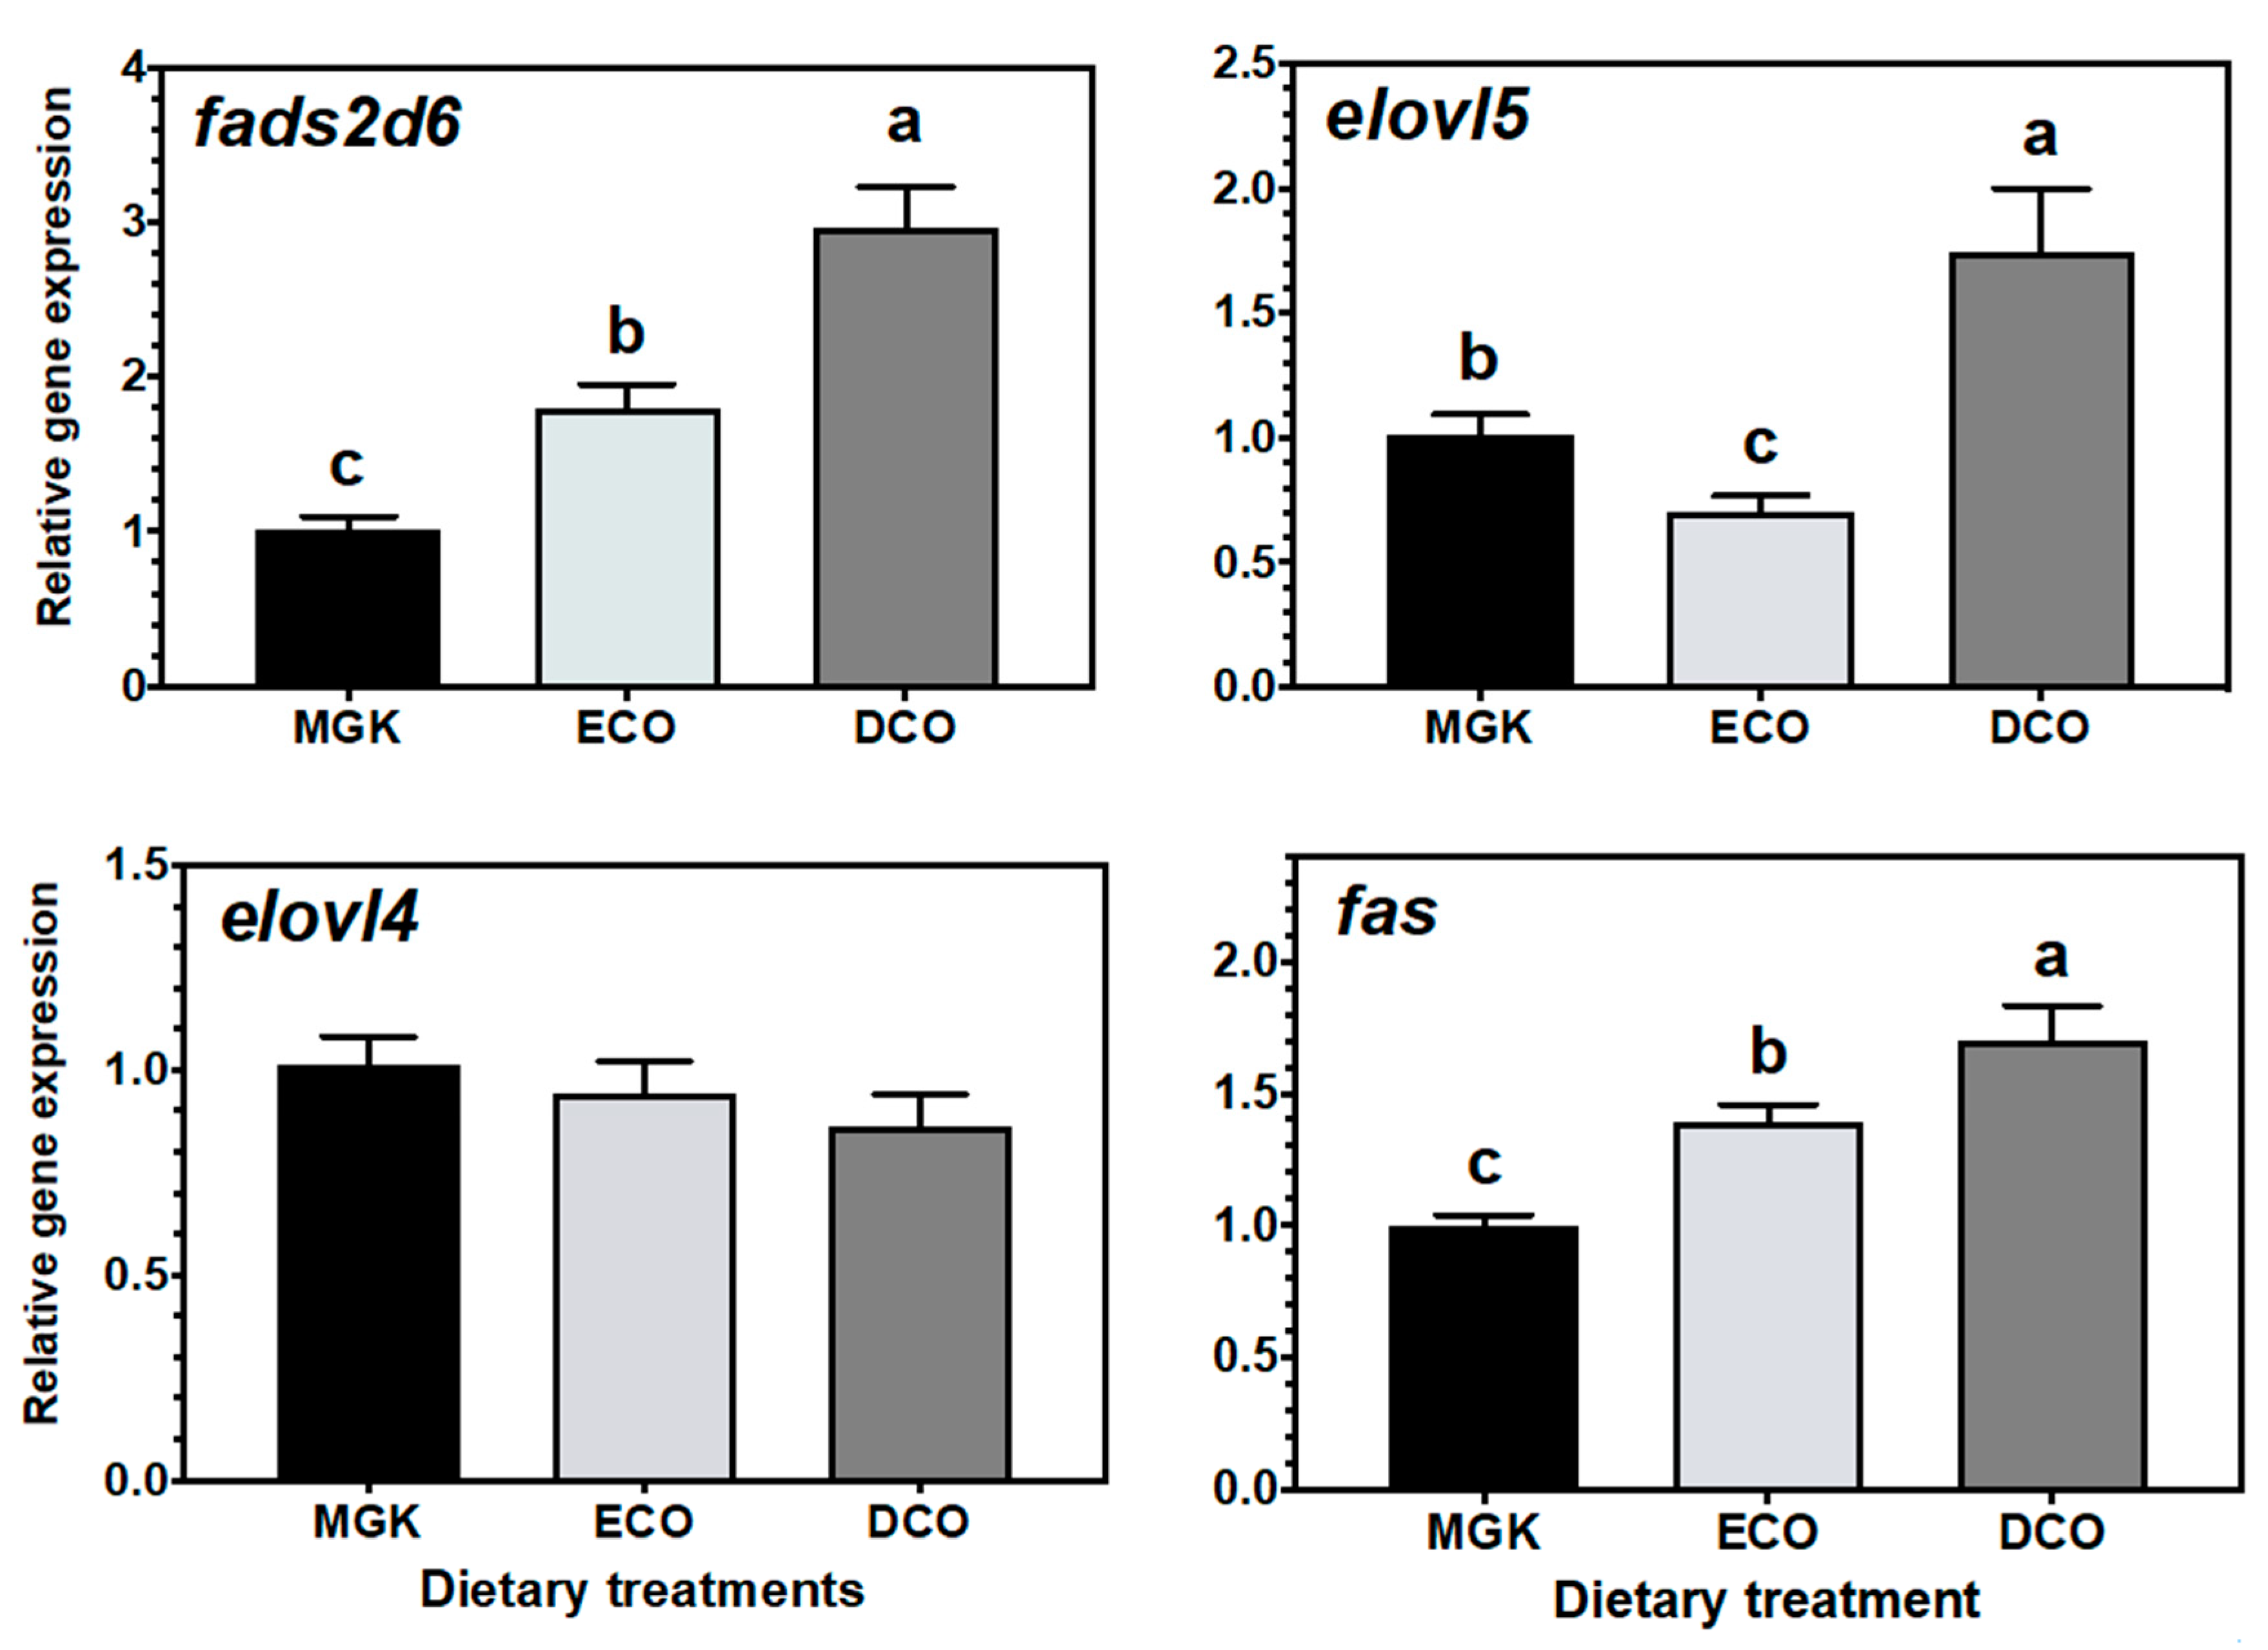
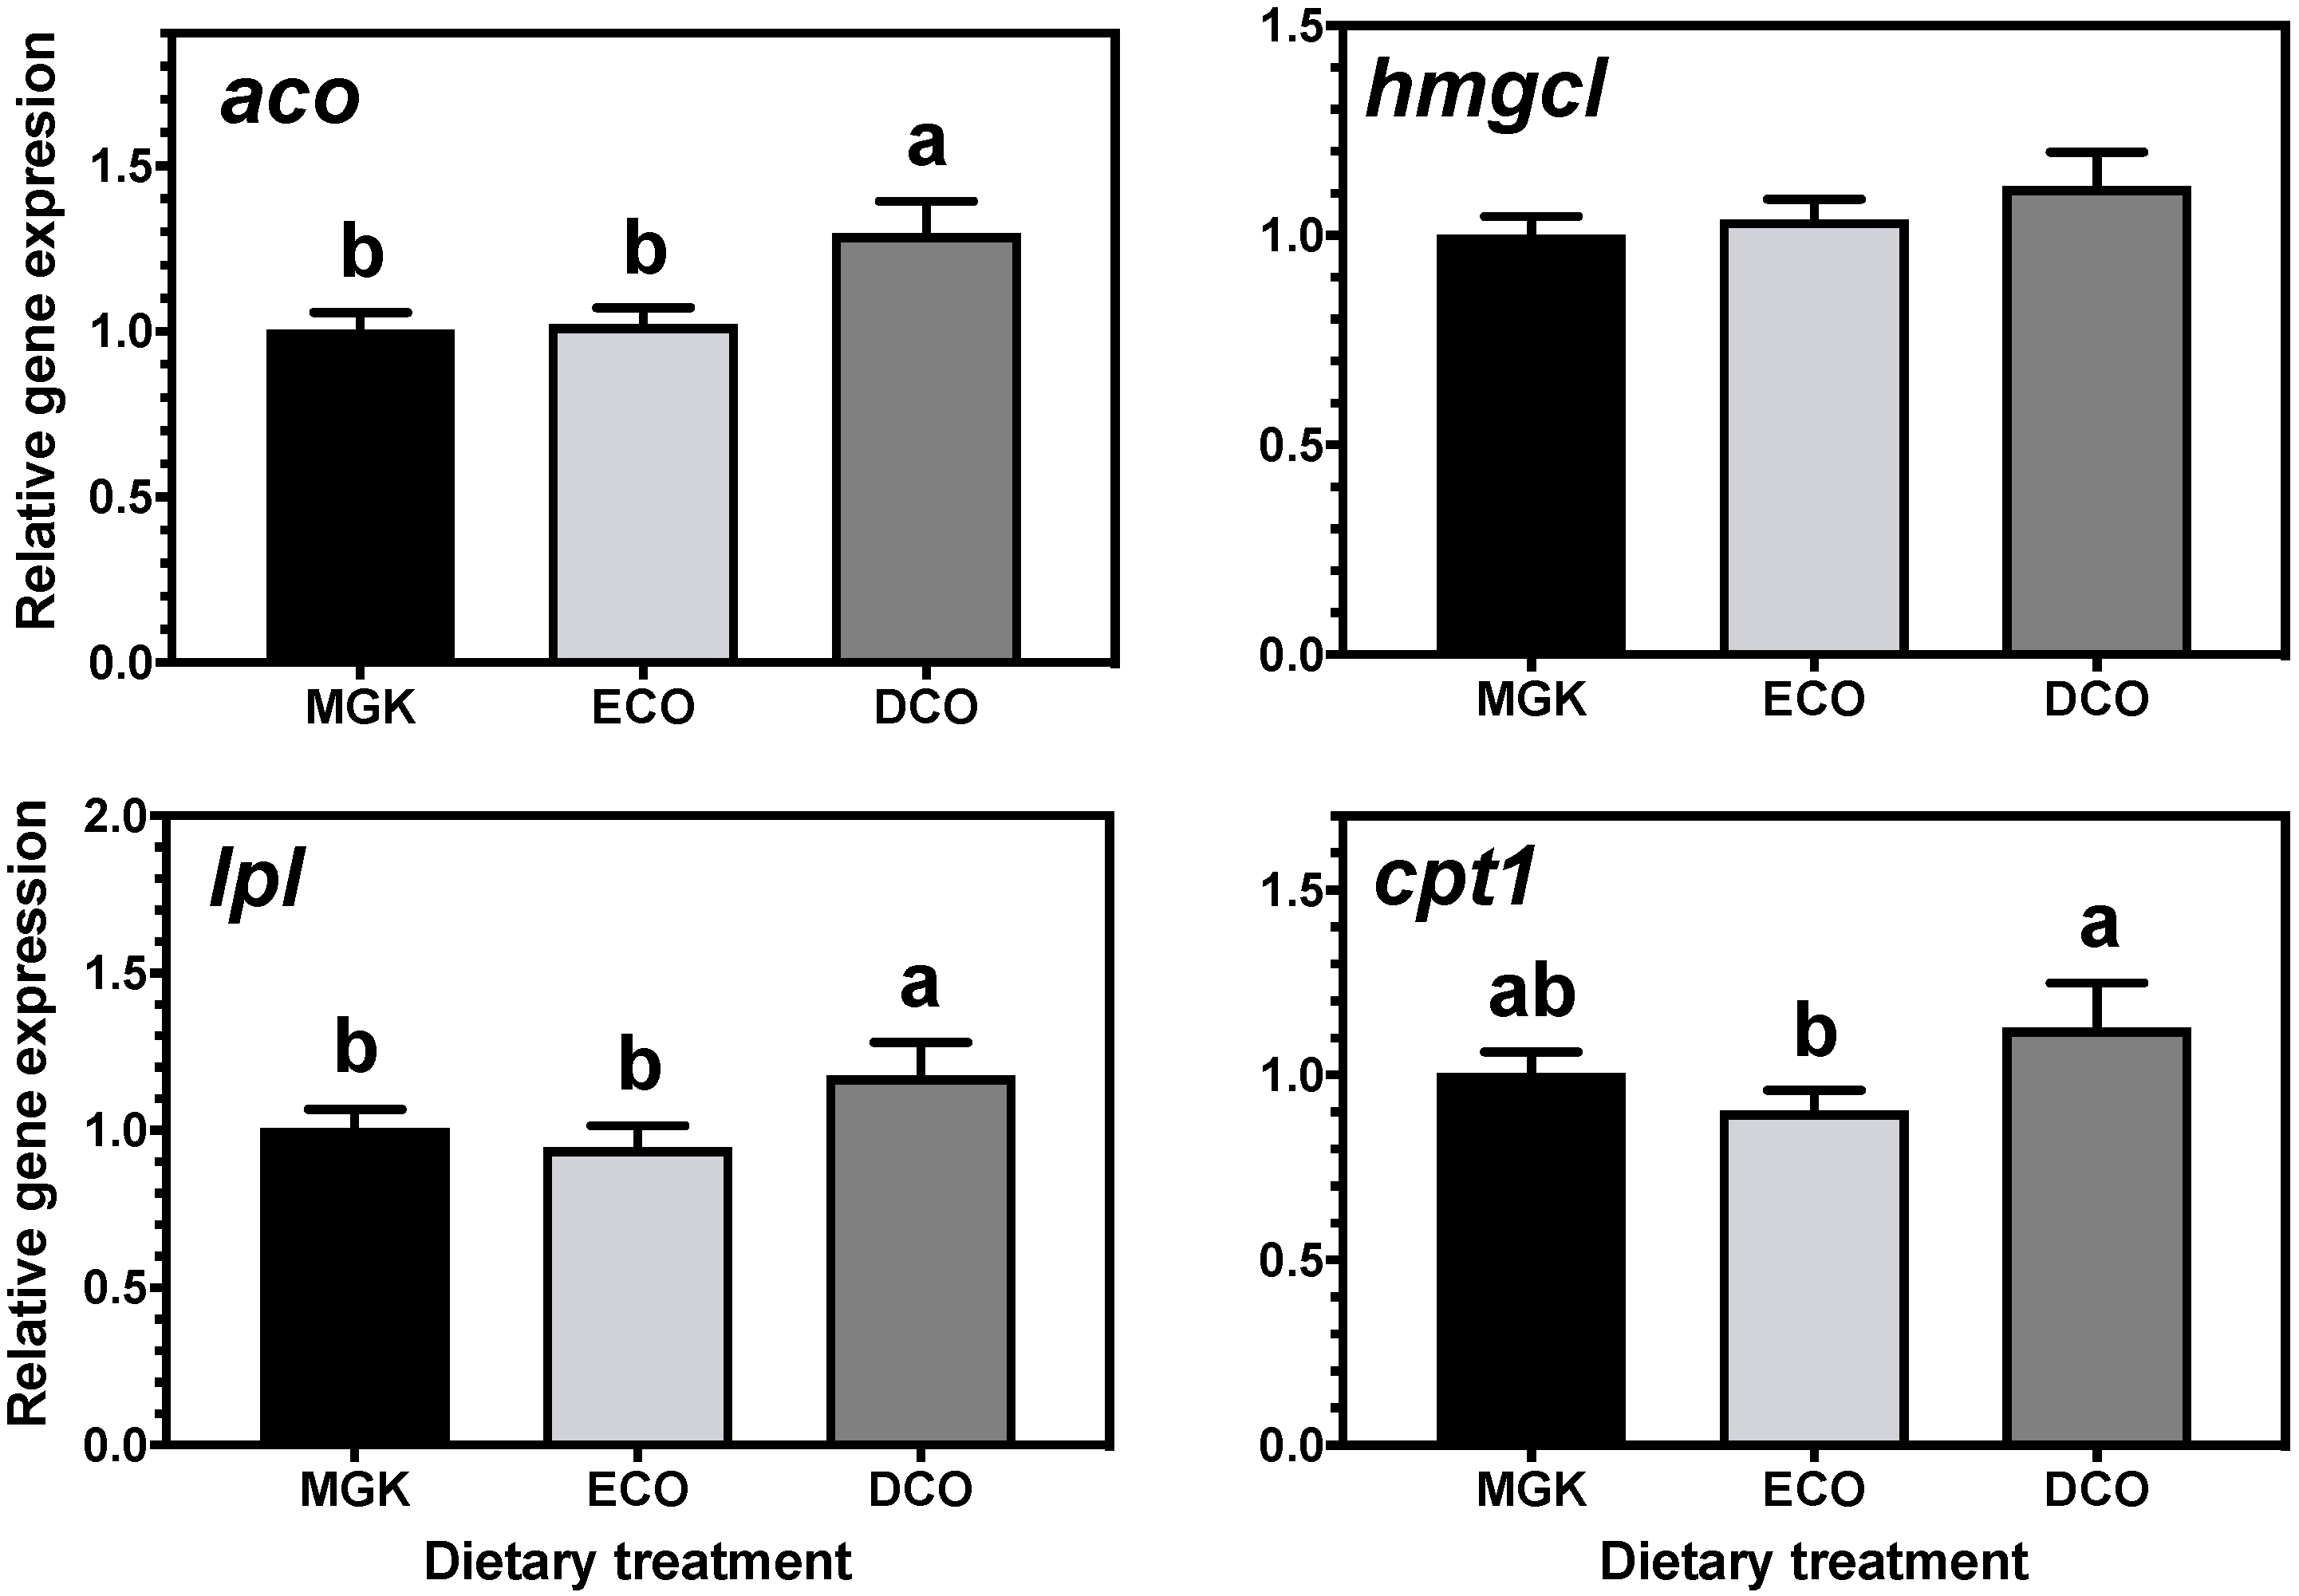
71]. In the present study, the expression of genes of LC-PUFA biosynthesis showed nutritional regulation in response to diet, with increased expression of
fads2d6 in both tissues, and
elovl4 and
elovl5 in the liver and intestine, respectively, in fish fed the test feeds compared to the reference diet. The upregulation of the expression of the
fads2d6 gene in both tissues in fish fed the test diets likely reflects the lower DHA in these diets and thus points to a slight deficiency for ABT juveniles. Thus, the DHA requirement for ABT juveniles is likely above the amount present in the higher of the test diets (DCO, 7.3 mg·g
−1 dry mass), although it is not possible to speculate if the level in the reference diet (15.0 mg·g
−1 dry mass) is sufficient.
Generally, when fish are fed low levels of n-3 LC-PUFA, the upregulation of
fads2d6 expression is observed, whereas reduced expression occurs when high dietary levels are ingested [
15,
72]. In the present study, there were differences between the ECO and DCO feeds in the extent of the upregulation in the different tissues. In the liver,
fads2d6 expression was upregulated by both test diets, but more in the liver of fish fed the ECO diet (lower in DHA) than in those fed DCO. Similar effects on liver
fads2d6 expression in response to transgenic
Camelina sativa oils were found in Atlantic salmon [
16], gilthead sea bream [
18] and European sea bass [
19]. In contrast, intestinal
fads2d6 expression was higher in ABT fed DCO than in fish fed ECO, with a similar trend reported in gilthead sea bream intestine, while no regulation was observed in European sea bass [
18,
19]. The response in ABT liver was consistent both with dietary DHA level and previous studies, whereas the response in the intestine was opposite to previous results where fadsd6 was upregulated in marine fish fed lower levels of DHA [
18,
73,
74,
75]. It was also noteworthy that
elovl5 expression was not nutritionally regulated in the liver but was downregulated in the intestine of ABT fed the ECO diet and upregulated in fish fed the DCO diet. Similarly,
elovl5 was not nutritionally regulated in the liver of salmon, gilthead sea bream and European sea bass [
16,
18,
19]. In contrast,
elovl4 was similarly not regulated in the intestine but upregulated in the liver of ABT fed DCO. Irrespective of species or tissue, increased endogenous LC-PUFA biosynthesis capacity seldom compensates completely for the reduction in dietary LC-PUFA [
68,
76].
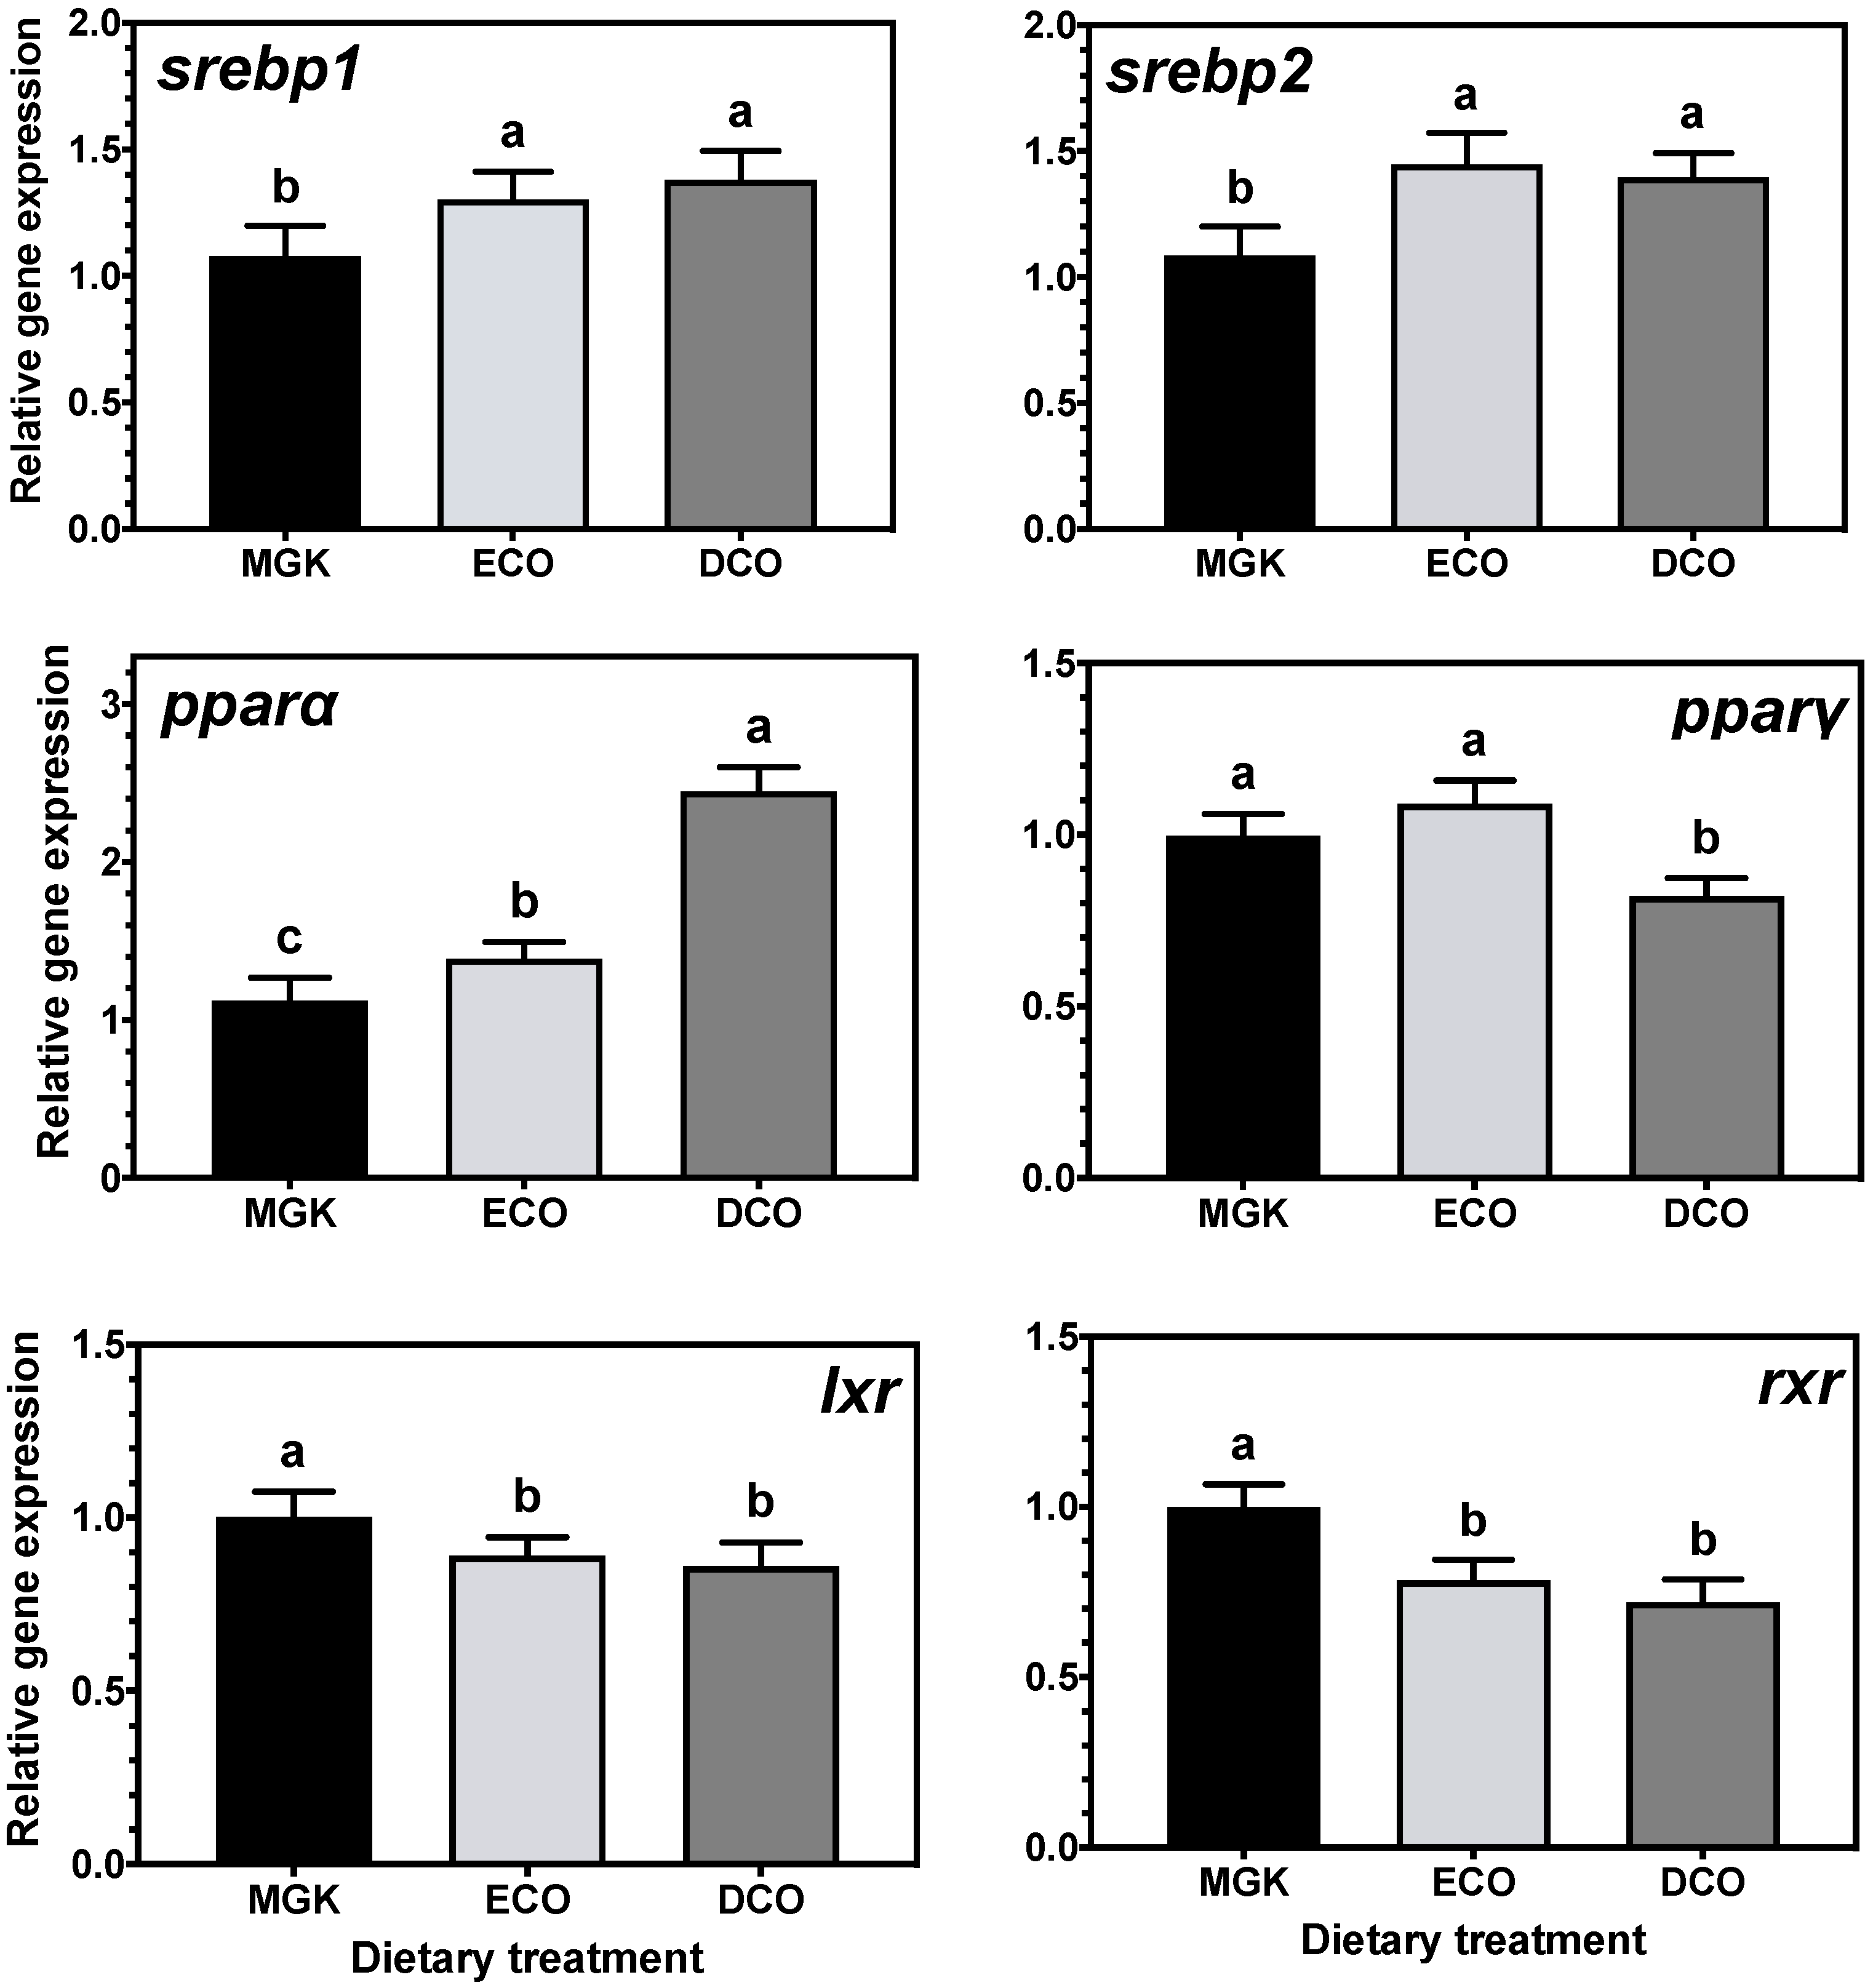
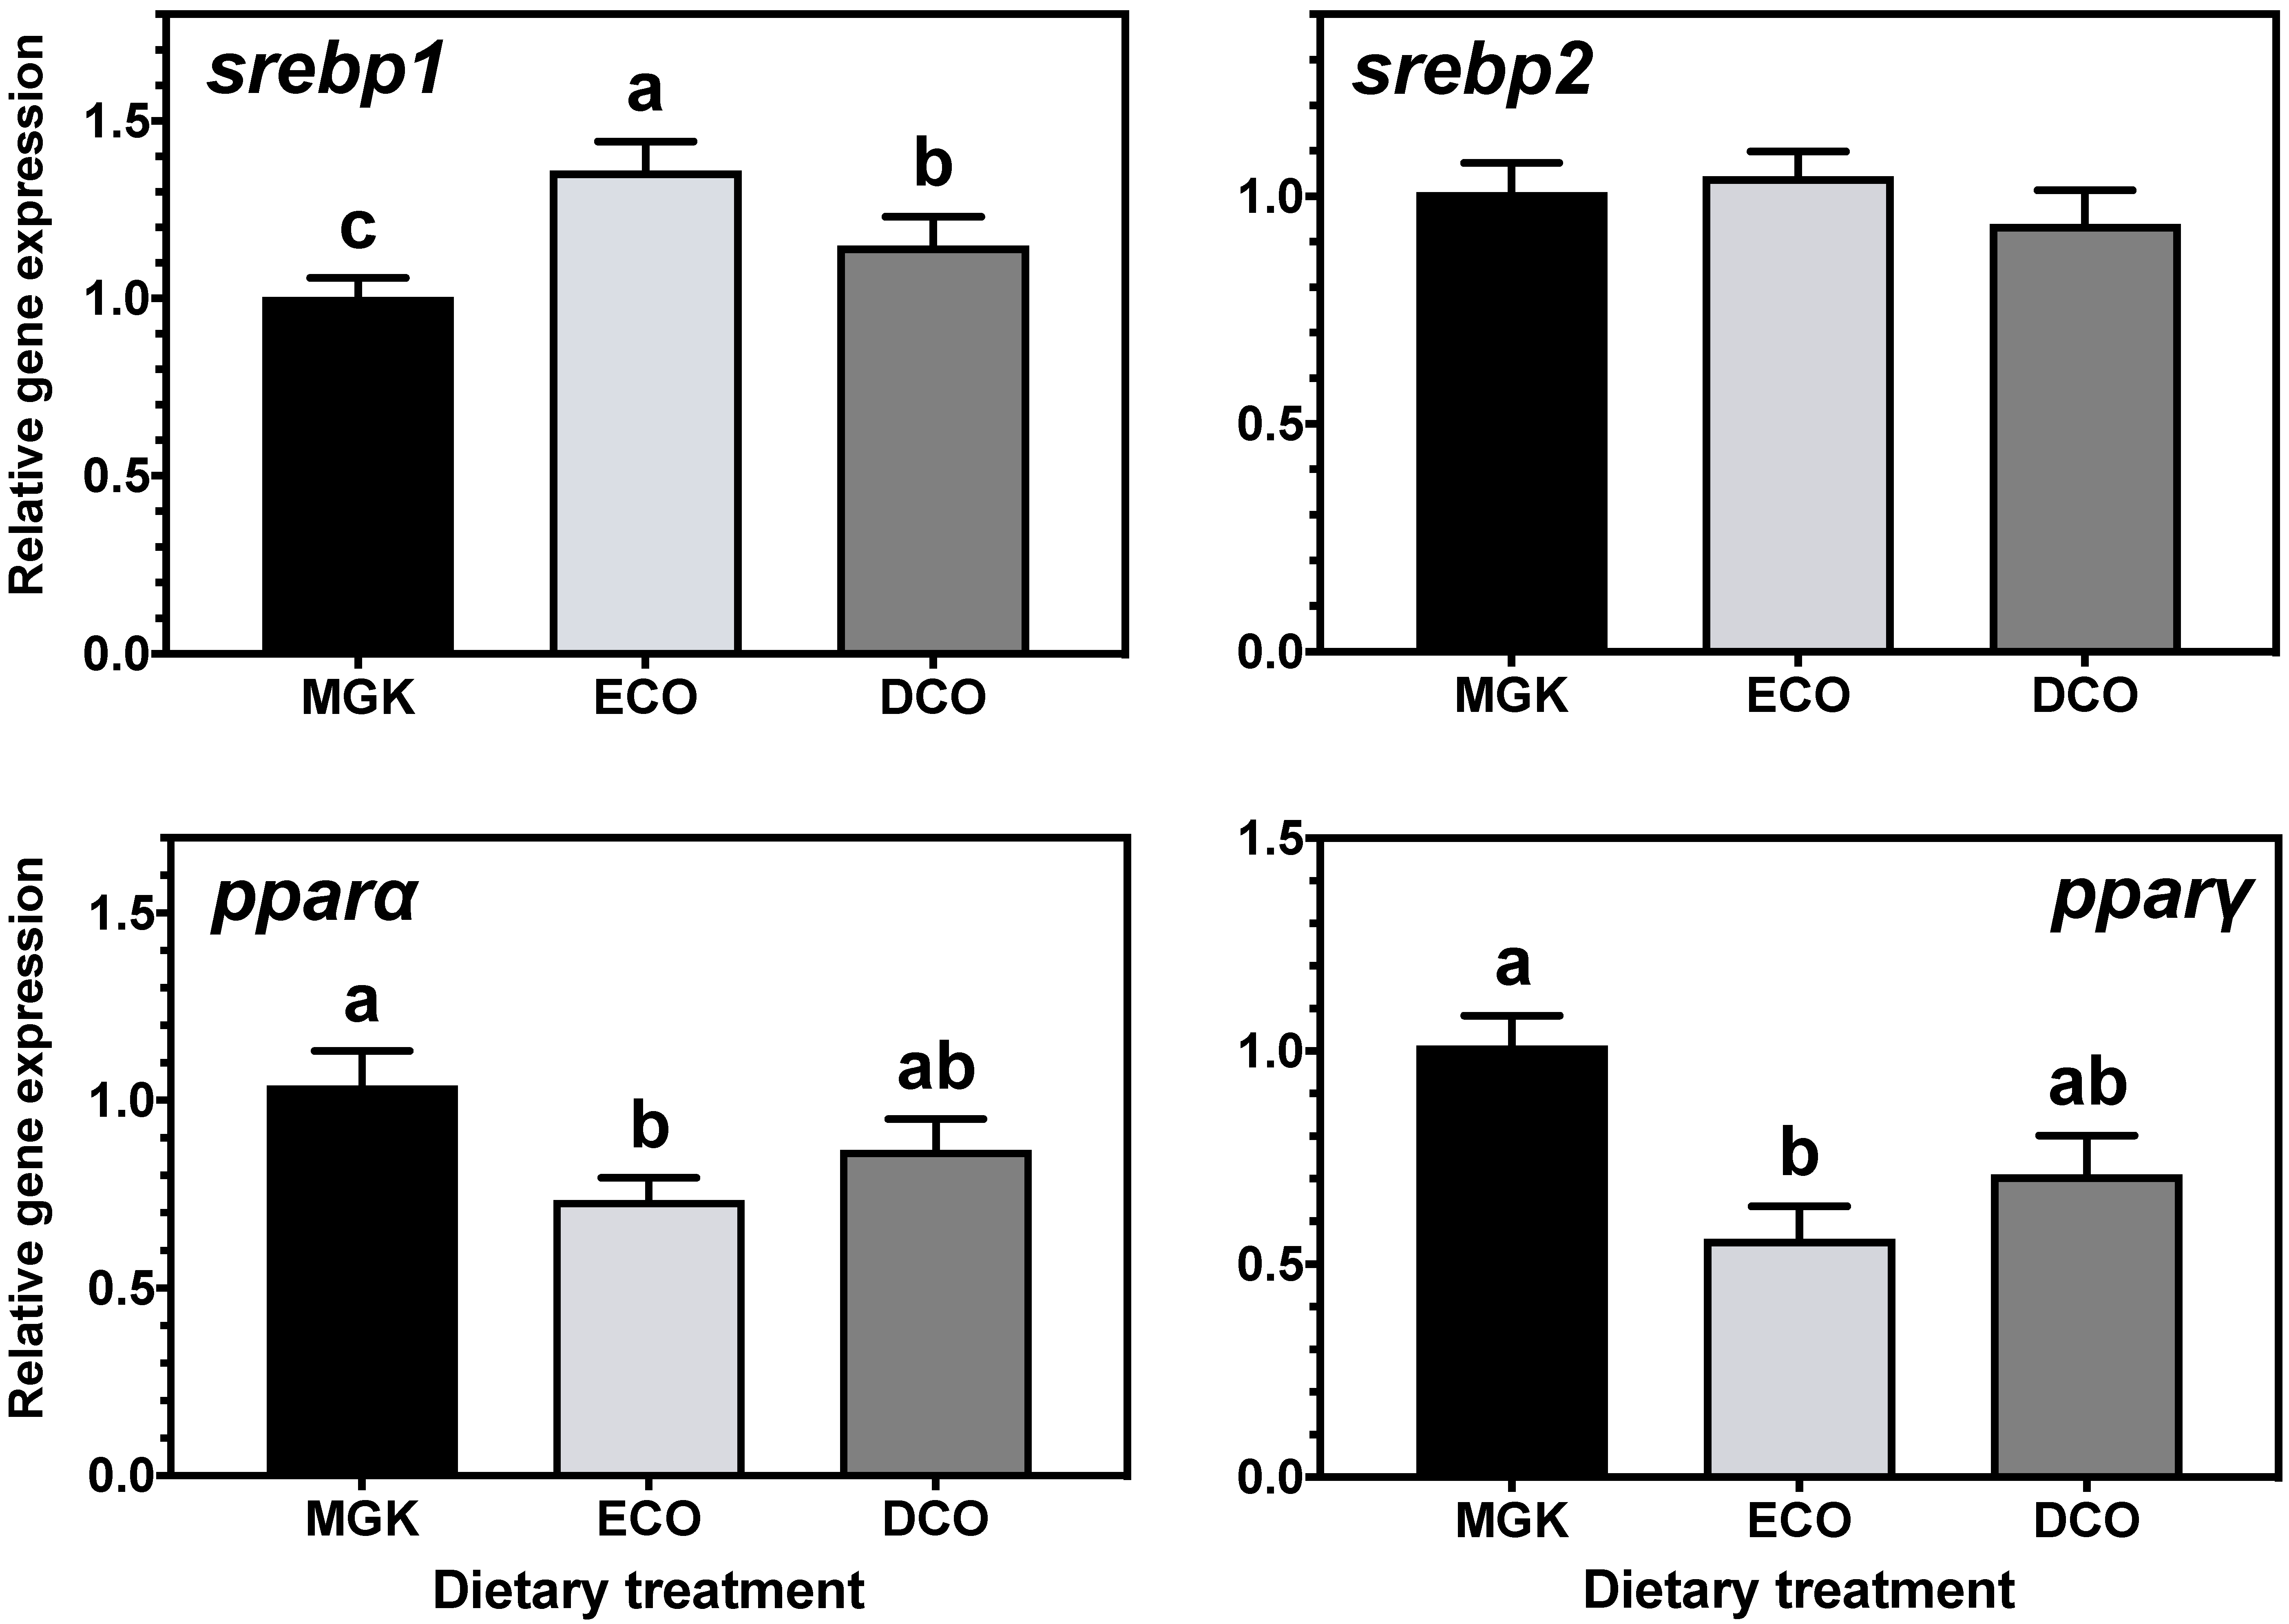
Nuclear receptors
pparα and
srebp1 are implicated in catabolism and fatty acid biosynthesis, respectively [
77,
78], and their expression can be regulated by dietary fatty acids [
79,
80,
81]. Specifically, n-3 LC-PUFA, including DHA, can act as ligands for
pparα and
srebp1, regulating LC-PUFA biosynthesis [
82,
83,
84,
85]. In the present study, expression levels of
srebp1 and
pparα were upregulated in the liver of ABT fed the test diets that contained lower levels of EPA and DHA than the reference diet. In agreement, studies on numerous fish species showed that
srebp1 expression was upregulated when feeds contained low levels of n-3 LC-PUFA [
18,
32,
35,
85,
86,
87]. The upregulation of
srebp1 in ABT liver and intestine induced LC-PUFA synthesis by upregulating the
srebp1 target genes
fads2d6 and
elovl4 expression in the liver together with the upregulation of
fas,
fads2d6 and
elovl5 in the intestine, as well as fatty acid synthesis by upregulating the expression of
fas, with both genes showing a similar pattern of expression as shown previously in ABT larvae [
40].
Similarly, the expression of
srebp2, a regulator of cholesterol synthesis [
88,
89] was upregulated in the liver but not the intestine by both test diets. In agreement, the hepatic expression of
srebp2 was increased in rainbow trout fed plant-based diets [
90] although, contrary to the present study, the expression of
lxr was unaffected by dietary cholesterol levels. Lxr regulates bile acid biosynthesis from cholesterol in mammals [
77] and previous studies in Atlantic salmon [
91] and ABT [
39] have shown upregulation of
lxr when fish were fed diets containing VOs. Previously, Zhu et al. [
90] explained the lack of dietary regulation of
lxr and other genes involved in cholesterol excretion and bile acid synthesis by the short duration of the trial (10 weeks). In the present study, this was not the case, as
lxr was downregulated in ABT fed low EPA + DHA levels after only two weeks, which might indicate species-specific regulation of cholesterol biosynthesis pathways.
Adipocyte function and differentiation are regulated by Pparγ which also has important roles in lipogenesis and lipid storage [
34,
50,
92,
93], and its expression was downregulated in the liver of ABT fed DCO and the intestine of fish fed ECO. This might indicate, as reported previously in ABT [
39], that given the fast growth rate of ABT juveniles, most of the available dietary resources are used for energy to fuel anabolic processes, given that an increase in biomass prevails over lipid storage. The nuclear receptor RXR forms heterodimers with PPARγ among other NRs, to regulate the transcription of lipid metabolism genes, and its transcript levels are known to be decreased in vitro in response to dietary LA and LNA [
66], which agrees with the results obtained in vivo in ABT in the present study.
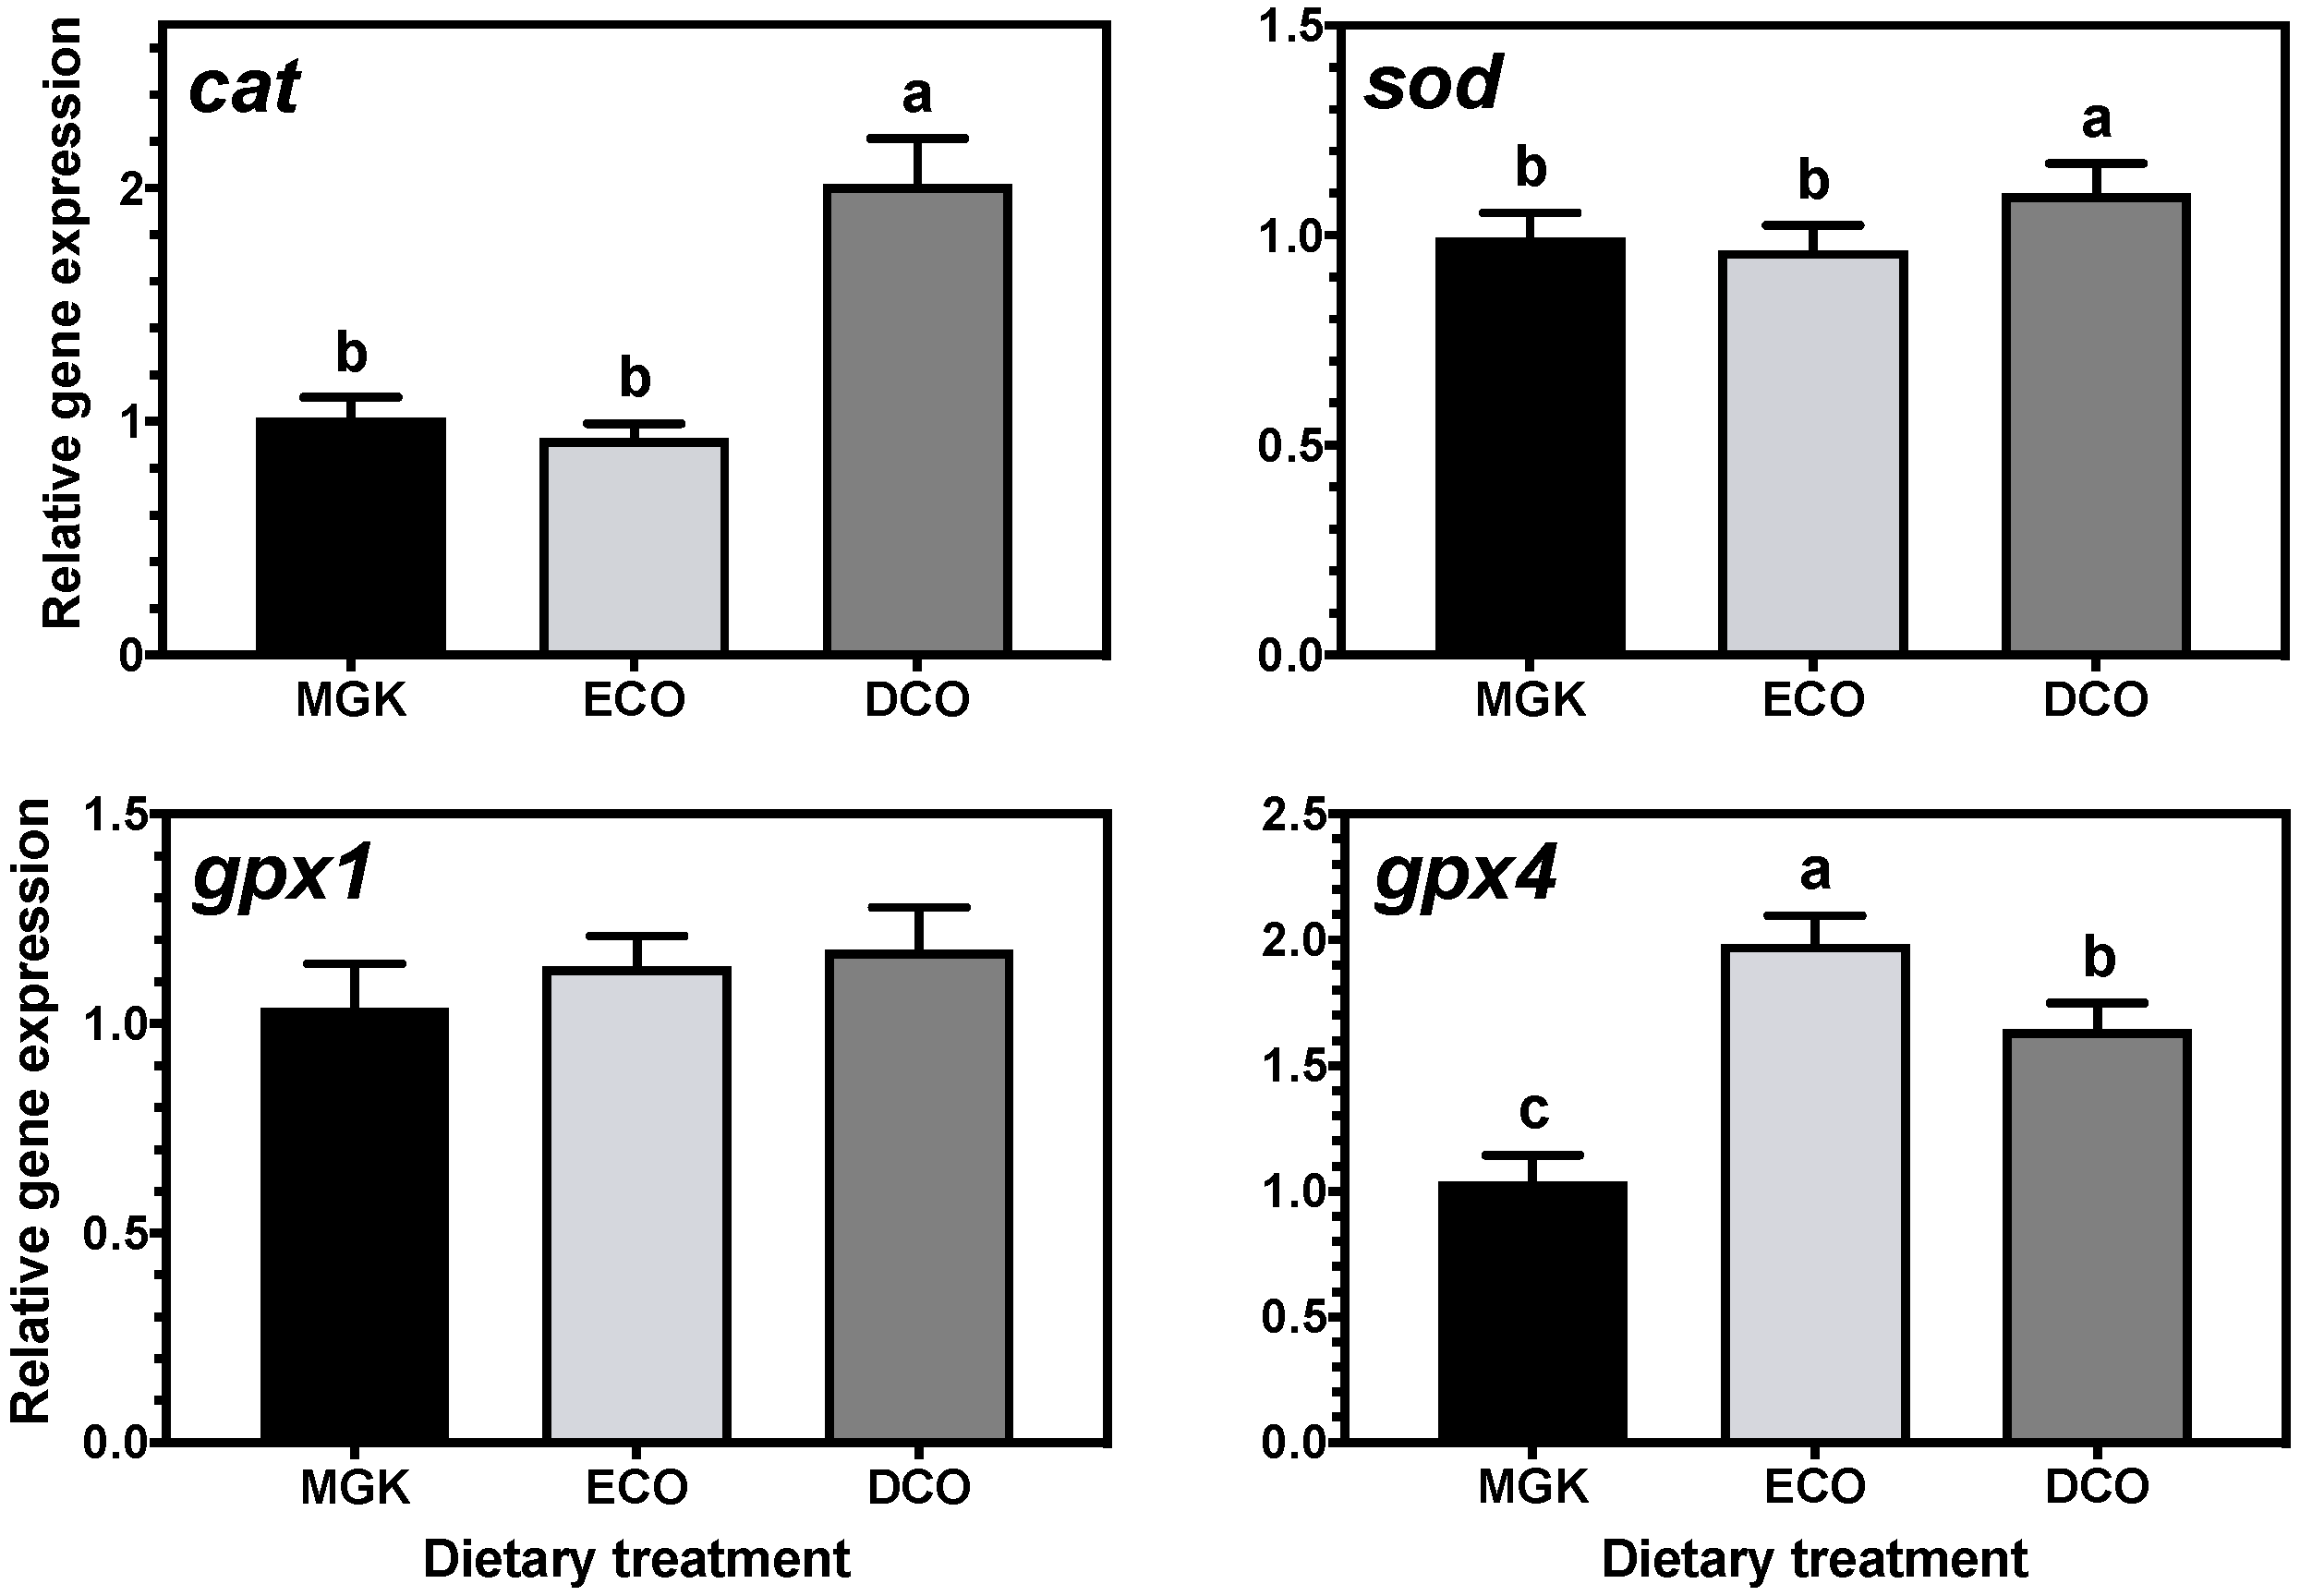
In fish, an effective antioxidant system needs to operate in order to maintain health and prevent adverse effects of oxidation. In this study, the mRNA levels of antioxidant enzyme genes in the liver were influenced by diet. In this respect,
cat and
sod were upregulated in the liver of ABT fed DCO, which contained the highest of n-6 and n-3 PUFA and the lowest MUFA levels. It is known that high substitution of FO by VO can lead to reduced expression of both
cat and
sod [
94]. This result is quite surprising given that both ECO and DCO oils could be considered as a “blend” of FO and VO, but still the expression profile between fish fed both treatments differed greatly. In contrast, the expression profile of
glutathione peroxidases was generally similar between fish fed ECO and DCO. It has been demonstrated recently that the nuclear factor erythoid 2-related factor 2 (Nrf2) can modify mRNA levels of antioxidant response element (ARE)-containing genes such as
cat and
sod [
95], which could explain why the direction of regulation diverged between these two enzymes and
gpx in the liver of fish fed the GM oil derived feeds.
The expression of
gpx4, a mitochondrial enzyme that acts mainly on peroxidised fatty acids of membrane phospholipids, was significantly downregulated in fish fed the commercial control diet with the highest levels of n-3 LC-PUFA. High dietary levels of EPA + DHA are known to suppress the hepatic expression of
gpx4 in sea bream [
96], in agreement with the present results. This pattern of expression was not observed in the cytosolic enzyme
gpx1, which could indicate that fish prime the in situ repair of oxidised phospholipids instead of the turnover of membrane phospholipids from the cytosolic pool, as had been speculated previously [
96].
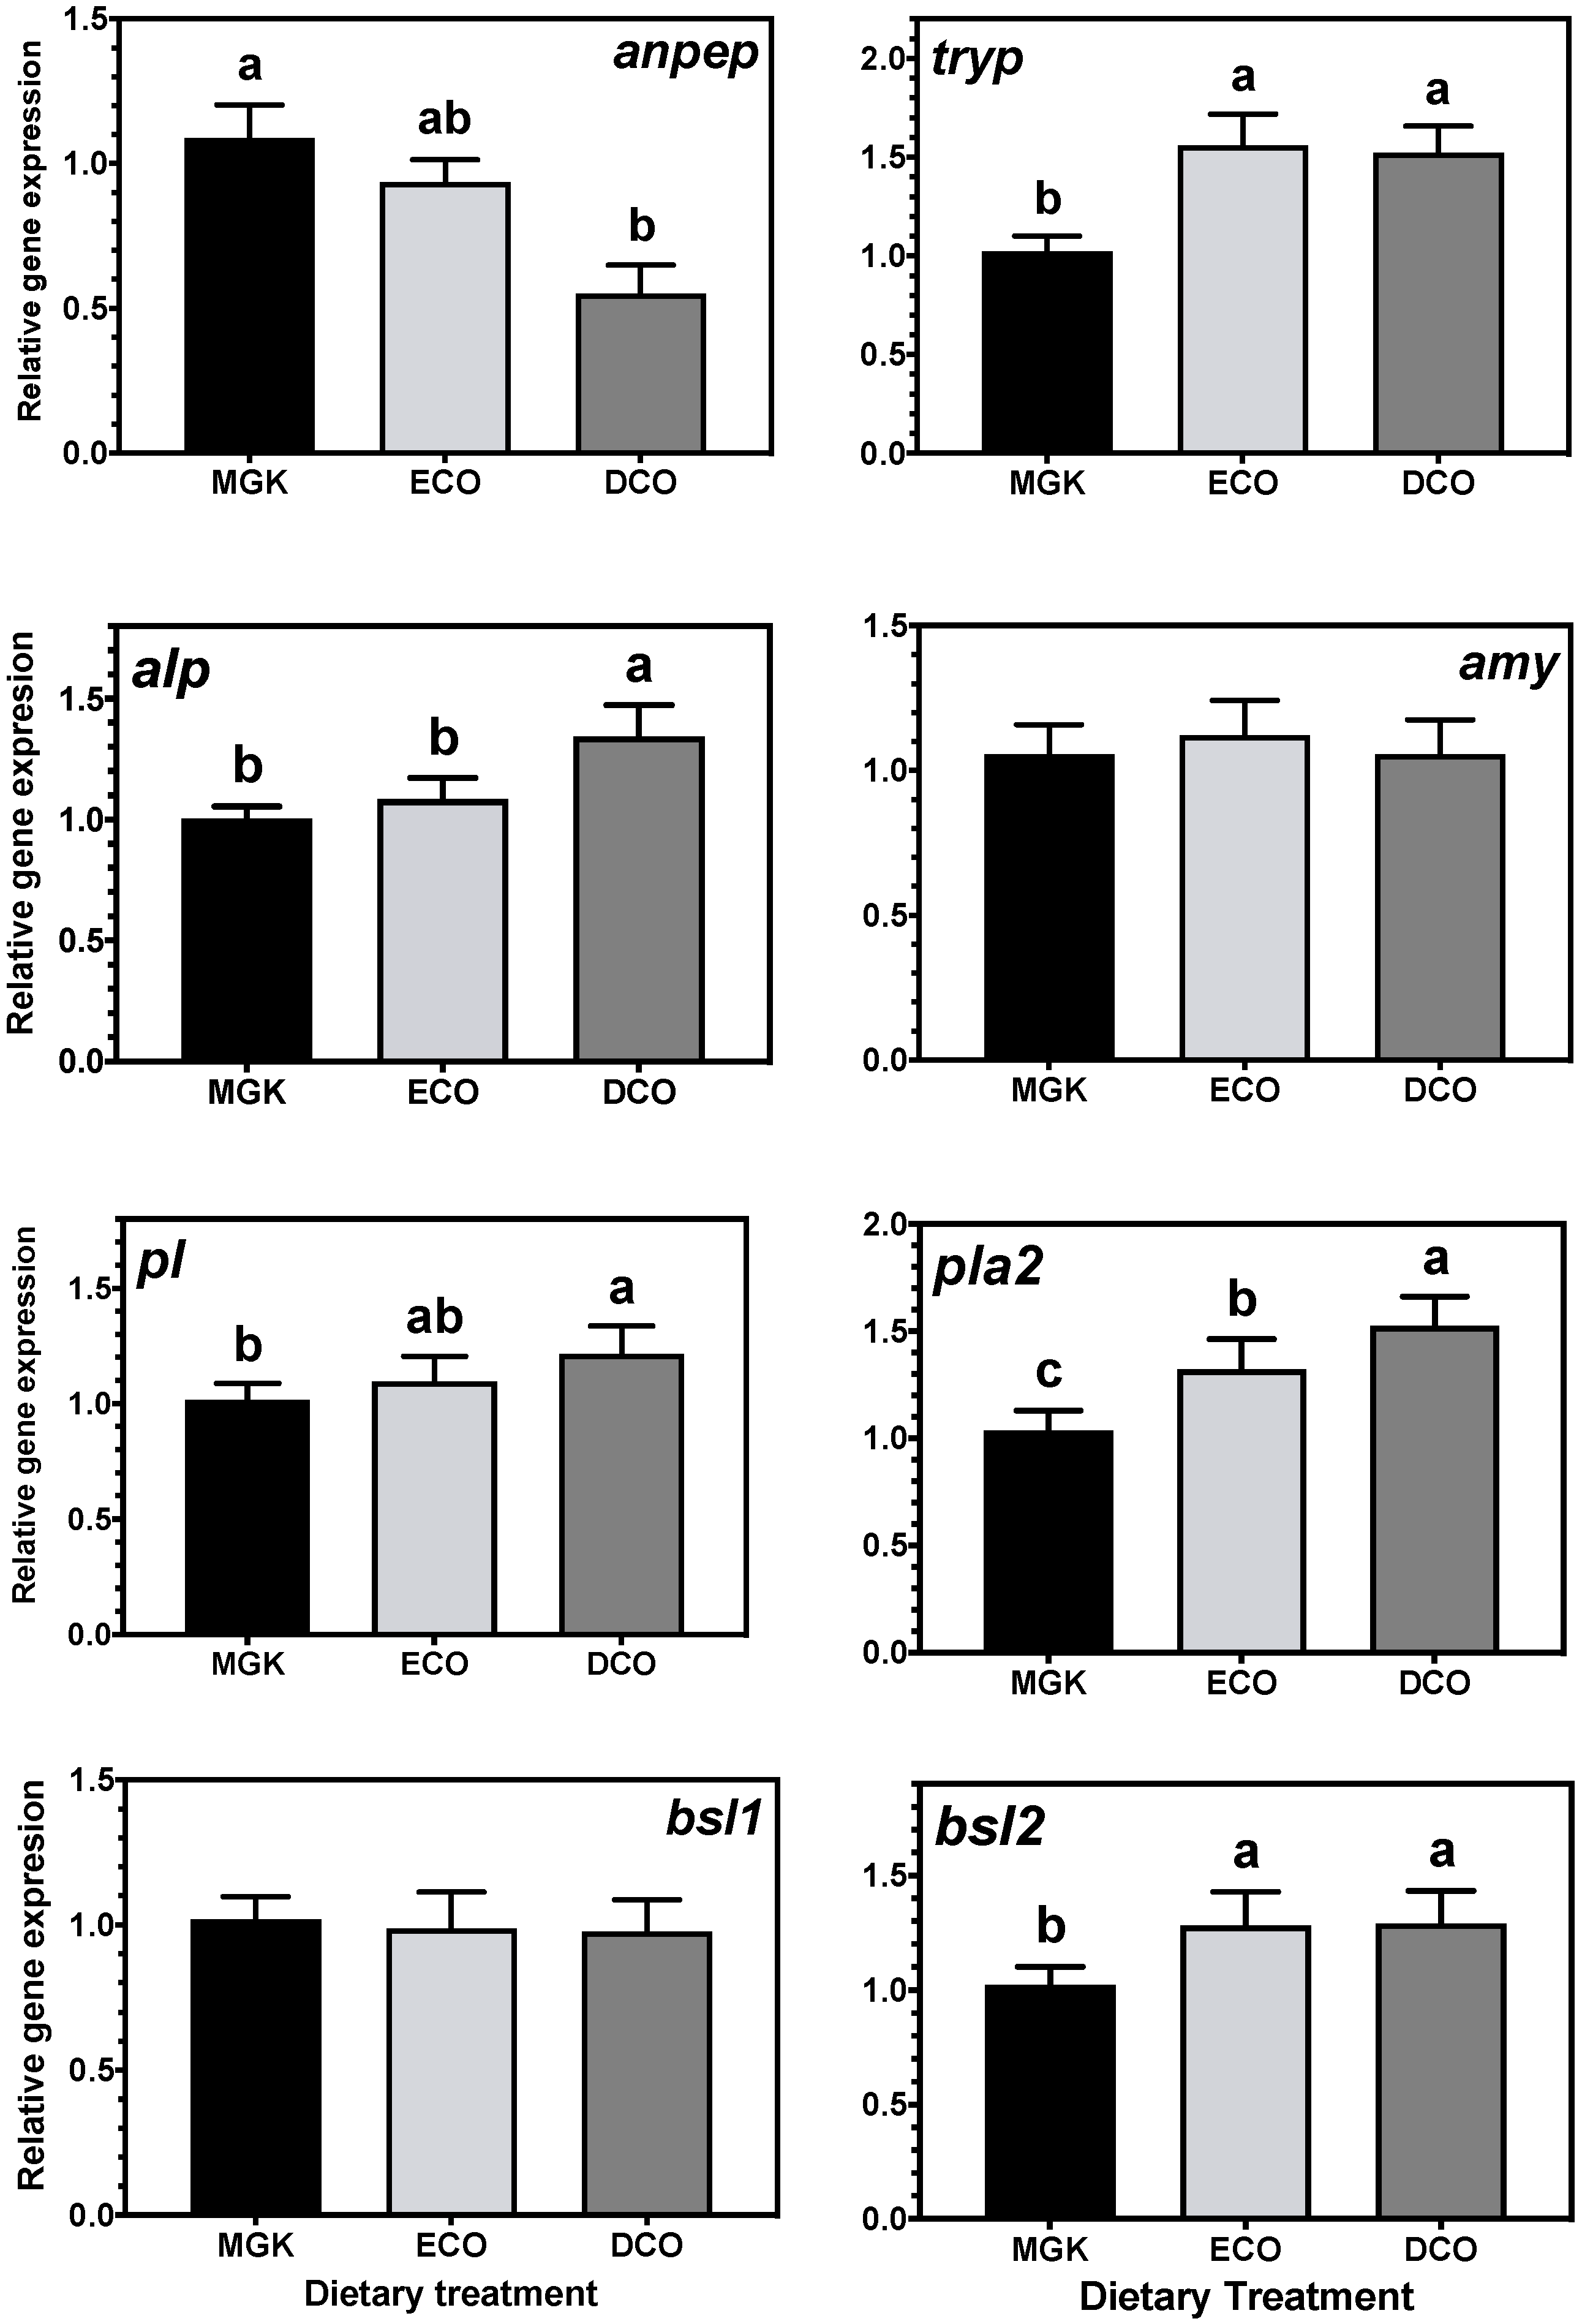
The intestinal expression of
amy did not present any nutritional regulation in response to dietary treatment and had previously shown a lack of rhythmicity in ABT juveniles [
97]. This is no surprise, as in carnivorous fish, such as ABT, lipid and protein pathways dominate intermediary metabolism given that carbohydrate is only a minor component of their natural diet [
1,
2,
67]. In contrast, the expression of proteolytic digestive enzymes was impacted by dietary treatment. Given that the commercial control diet contained a different blend of raw materials, it is not surprising to find differences in the expression levels of
tryp between ABT fed this treatment and fish fed the experimental diets, as has been found in other fish species [
98,
99]. The fish fed the DCO diet displayed the highest intestinal mRNA levels of
alp. Previously, European sea bass fed VO diets displayed higher alkaline phosphatase activity than fish fed a FO-rich diet [
62], which could be linked to the slower release of proteases into the intestinal lumen due to a decrease in transit rate in fish fed VO [
100]. The opposite pattern of expression was observed for
anpep, where DCO-fed fish displayed the lowest mRNA level. Another potential explanation for the differences observed in protease activities could be due to different levels of antinutritional factors present in the diets as it is known that the inhibition of proteases can be due to the presence of protease inhibitors.
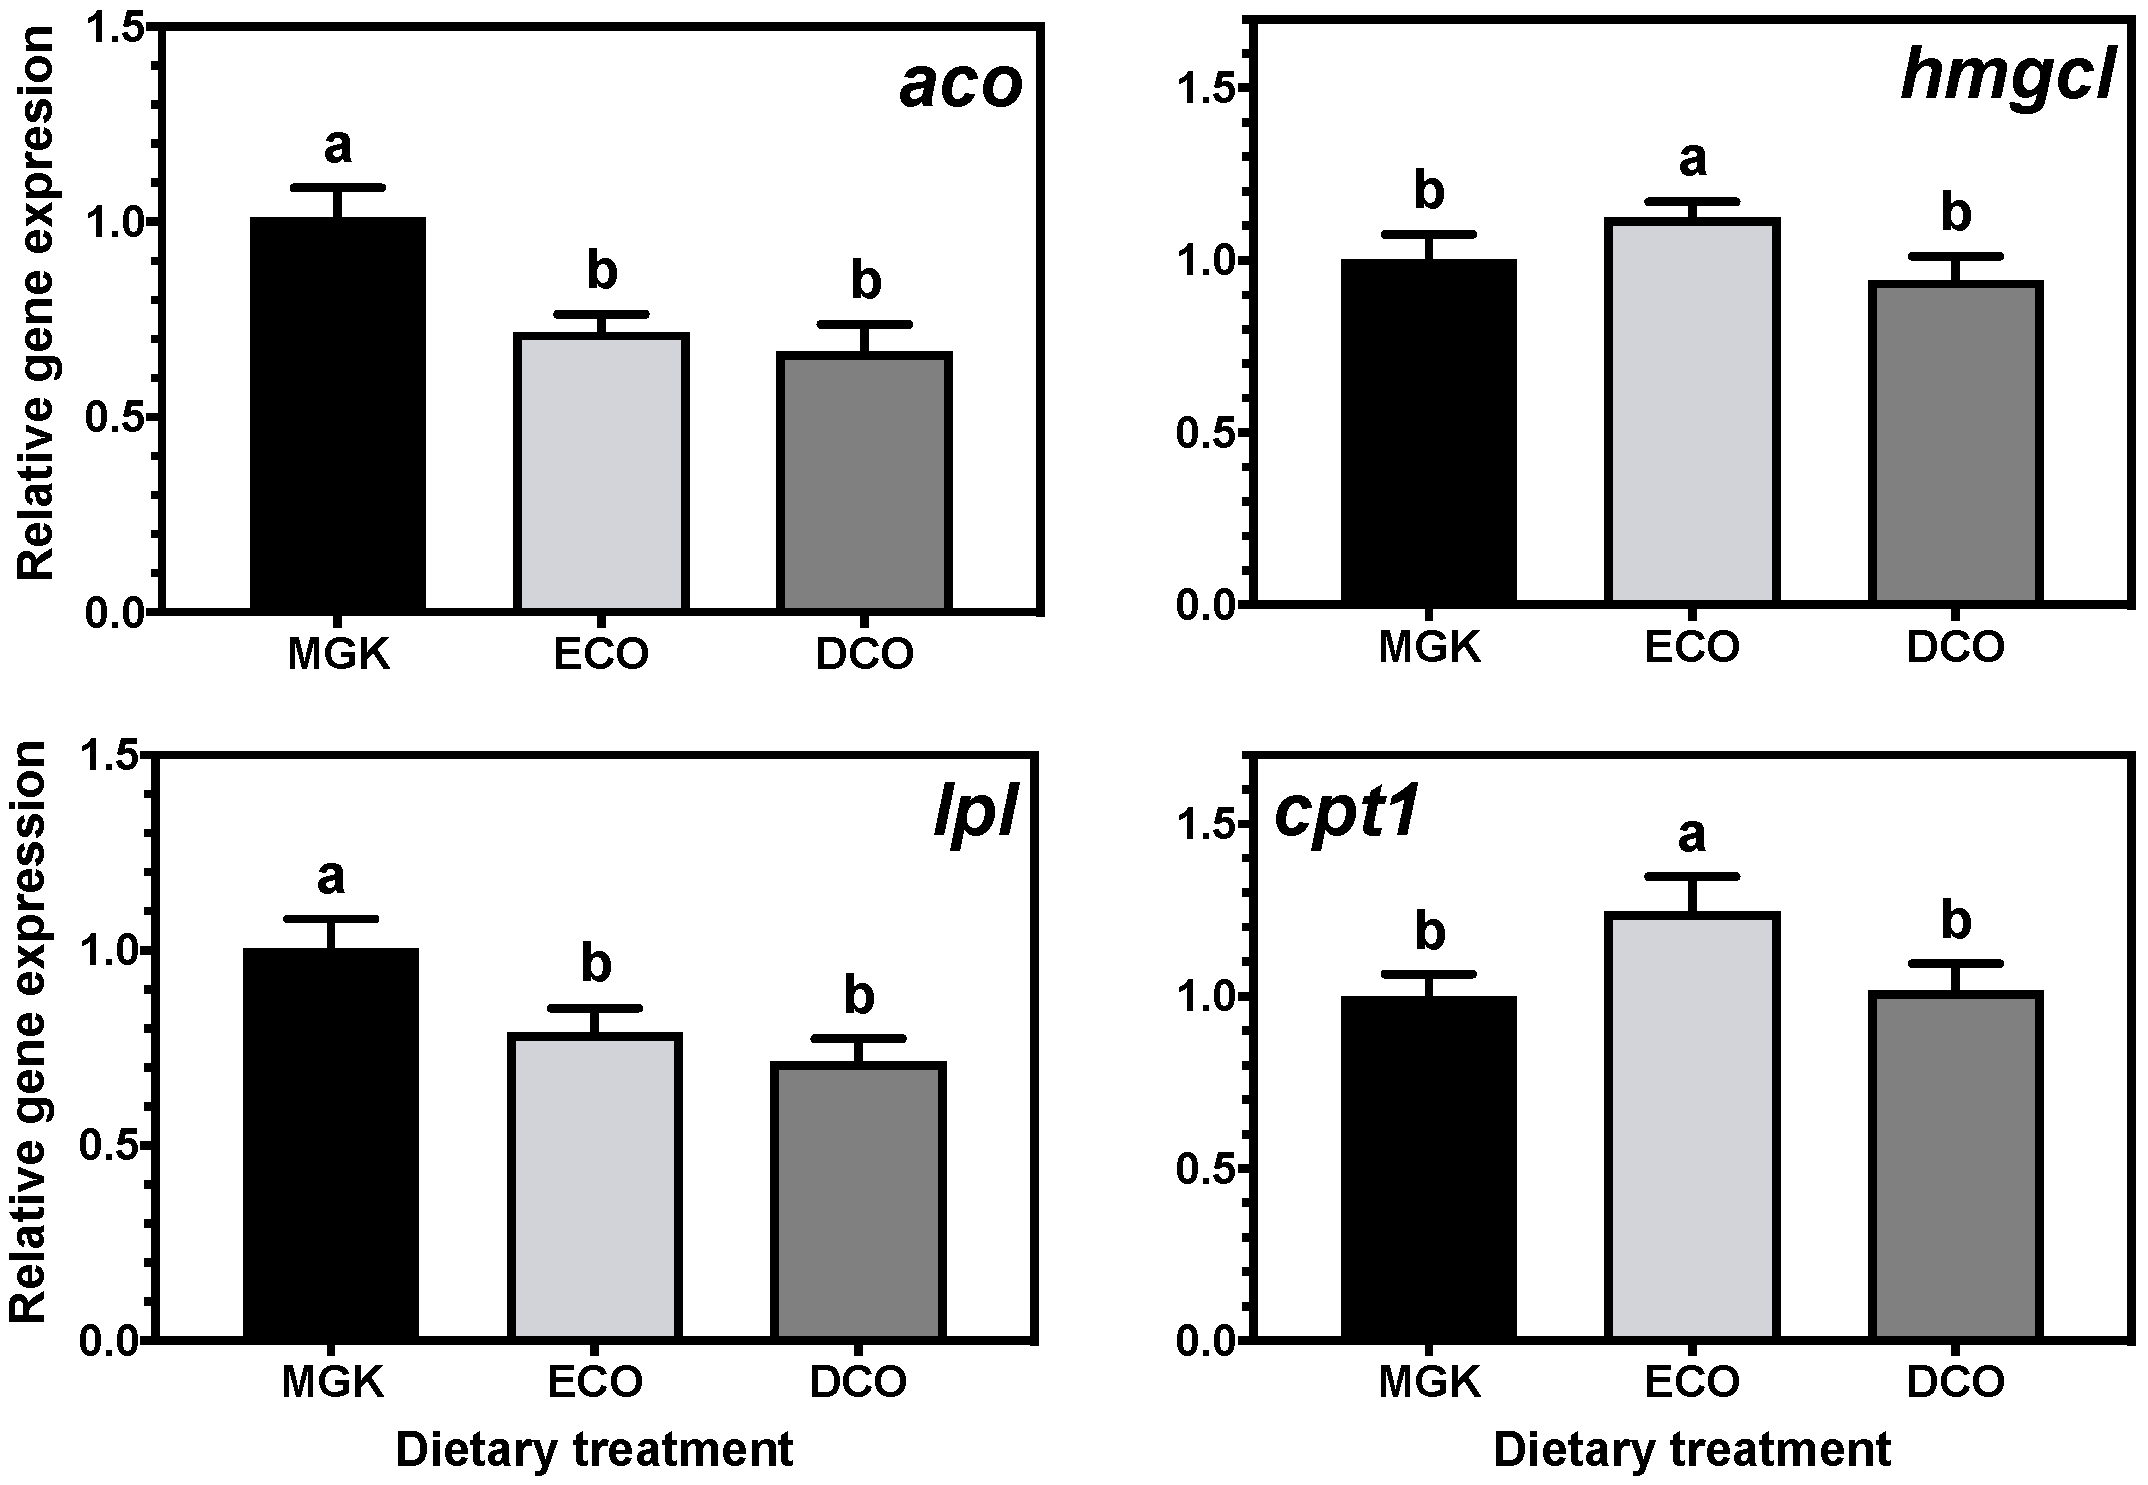
Regarding the expression levels of lipases, the lowest expression levels of
pl,
pla2 and
bsl2 were observed in the intestines of fish fed the reference MGK diet. In general terms, high expression of these lipases might be a direct response to the lower lipid levels of the two experimental feeds (15 vs. 17%) and/or high C
18 PUFA and low LC-PUFA levels. Curiously, low expression levels of
pla2 have been associated with high dietary LNA levels in Senegalese sole (
Solea senegalensis) intestine, particularly after stress [
101]. However, in the aforementioned trial, the levels of dietary DHA were similar among the treatments whereas in the present study they were 6.5- and 2.5-times higher in diet MGK compared to diets ECO and DCO, respectively. It is known that low dietary DHA levels can increase adiposity and plasma lipid levels [
102] that, in turn, could explain the high expression levels of lipases in fish fed the diets with the lowest DHA (ECO and DCO). Apart from participating in phospholipid digestion and metabolism, PLA2 plays crucial roles in several other cellular responses such as providing precursors for eicosanoid production. Indeed, the expression of
pla2 has been used as an indicator of intestinal integrity in fish [
103]. Nevertheless, despite the relatively high intestinal
pla2 mRNA levels found in the present study, no signs of inflammation were observed histologically in the intestine, which suggests that the upregulation of
pla2 in fish fed the experimental feeds is probably related to phospholipid metabolism rather than inflammatory processes.

 ,
, 


