Article

Factors Influencing Early Growth of Juvenile Tiger Trout Stocked into Subalpine Lakes as Biocontrol and to Enhance Recreational Angling

1
Aquatic Research Section, Colorado Parks and Wildlife, 317 West Prospect Road, Fort Collins, CO 80526, USA
2
Department of Fish, Wildlife, and Conservation Biology, Colorado State University, 1474 Campus Delivery, Fort Collins, CO 80523, USA
3
New Mexico Cooperative Fish and Wildlife Research Unit, Department of Fish, Wildlife and Conservation Ecology, New Mexico State University, 2980 South Espina, Las Cruces, NM 88003, USA
4
Colorado Parks and Wildlife, 2300 South Townsend Avenue, Montrose, CO 81401, USA
*
Author to whom correspondence should be addressed.
Fishes 2022, 7(6), 342; https://doi.org/10.3390/fishes7060342
Submission received: 2 November 2022 / Revised: 18 November 2022 / Accepted: 21 November 2022 / Published: 23 November 2022
(This article belongs to the Special Issue New Trends in Freshwater Fishes)

Abstract

:
Tiger trout (Salmo trutta × Salvelinus fontinalis) are sterile hybrids often stocked as a biocontrol agent for undesirable fishes and to enhance recreational angling. Yet, how different ecological processes affect their post-stocking performance remain poorly understood. Rapid growth early in life can foster rapid transitions to piscivory, and improve survival. Identifying factors that benefit early growth can help managers optimize tiger trout stocking for meeting multiple fisheries management objectives. Here, we characterized the trophic ecology and growth of tiger trout stocked at varying densities into seven lentic subalpine systems in Colorado, USA. Study systems supported different species of undesirable fish (e.g., minnows or suckers). We used stable isotopes of carbon and nitrogen to quantify trophic relationships among tiger trout and other fishes in each system. We then evaluated several system-specific attributes as predictors for the size of tiger trout at age-1 using a Random Forest model. Stable isotopes demonstrated the potential for resource competition among tiger trout and other fishes, but potential varied by system. Indices of resource competition ranked highest in the Random Forest model, but the stocking density of tiger trout was most important, suggesting that intraspecific competition outweighed interspecific competition in driving early growth. These processes were mediated by system productivity. Thus, stocking density in combination with the realized carrying capacities of systems should be considered when making management decisions for tiger trout.

Graphical Abstract

1. Introduction

Fish are frequently used to control nuisance aquatic plants [1], invertebrates [2], and other fish species [3]. Intentional stocking of piscivorous fish to control nuisance or prolific forage fishes is a common management practice in lakes and reservoirs supporting recreational fisheries [4,5,6]. However, introductions of piscivorous fish as biocontrol measures may have unintended consequences that negatively affect native or valuable/desirable sport fish populations (e.g., [7]). To minimize potential adverse effects, fisheries managers often stock sterile predators to suppress undesirable species. Because sterile fish do not reproduce, they pose a lower or shorter-term risk to fisheries and will not hybridize with existing native fishes or establish unwanted naturally reproducing populations [8,9]. Piscivorous fishes are often prized and targeted by anglers [10], and therefore, stocking these predators can also enhance angling opportunities.
Tiger trout (female brown trout [Salmo trutta] × male brook trout [Salvelinus fontinalis]) are sterile and can be effective piscivores that offer high potential as biocontrol while simultaneously providing novel angling opportunities. Although the use of tiger trout as a management tool has shown promise, stocking approaches and results have varied. For example, tiger trout in combination with Bonneville cutthroat trout (Oncorhynchus clarkii utah) were stocked annually at relatively low densities (88 fish·ha−1·year−1) in Scofield Reservoir (UT, USA) to control Utah chub (Gila artraria). The estimated consumption demand of the stocked predators was deemed sufficient to reduce the Utah chub population. Rates of piscivory were highest in tiger trout with some individuals reaching trophy sizes and adding a unique component to the recreational fishery [11]. A single tiger trout stocking event (598 fish/ha) of catchable-sized (200–370 mm TL) fish in Wallace Lake (ID, USA) reduced redside shiner (Richardsonius balteatus) abundance and resulted in the creation of a new and unique element to the fishery [12]. However, Miller [13] found tiger trout stocked in Washington (USA) lakes at different densities (9–701 fish·ha−1·year−1) demonstrated poor growth and low piscivory across a range of elevations, sizes, and productivities. Within the set of systems examined by Miller [13], several small-bodied prey populations were available (e.g., redside shiners), but did not appear to support tiger trout growth to piscivorous (i.e., point during ontogeny when fish prey become accessible and consumed) or trophy sizes. Thus, despite the potential utility of tiger trout for meeting multiple management objectives, their effectiveness appears mixed, and a number of biotic and abiotic processes could limit or promote the post-stocking success of tiger trout, but these remain poorly understood.
Factors such as stocking density, prey size and availability, or the abundance of other potential competitors may influence the ability of tiger trout to grow and survive well enough post-stocking to control undesirable fishes and contribute to recreational fisheries [13,14]. Rapid growth early in life has two key advantages in the context of biocontrol and fisheries. First, if juvenile mortality is size-dependent, obtaining larger body size quickly can confer survival advantages resulting in greater recruitment of stocked fish to piscivorous size [15,16]. Similarly, rapid growth may result in earlier transition to piscivory as mediated by the sizes of available prey, which can have additional growth and survival benefits over the first year of life [17]. Understanding the primary ecological processes or factors affecting the early growth of juvenile tiger trout could help inform best stocking practices for different system types and prey assemblages. Because the production of unique fish like tiger trout by fisheries management agencies is typically limited, informed stocking is necessary for maximizing their benefits to anglers and as biocontrol.
The growth of juvenile fish can be negatively affected by intra- and interspecific competition [18,19]. Collectively, previous studies described above suggest that the ability of juvenile tiger trout to grow and reach piscivorous size could be particularly sensitive to intraspecific competition driven by within-year stocking density, or repeated stocking and cross-cohort interactions. Based on previous observations, stocking tiger trout at high densities could unintentionally result in elevated intraspecific competition and limit the early growth of juveniles and their potential to switch to piscivory. However, these findings also suggest that if tiger trout stocking density can be balanced/optimized with an understanding of resource limitation/competition, then managers could regulate tiger trout growth. Yet, the relative importance of intraspecific versus interspecific competition as mediated by other biotic or abiotic factors has not been evaluated. If intraspecific interactions are important, fisheries managers could affect tiger trout performance by adjusting stocking densities. If interspecific interactions are more important, then modifying tiger trout stocking densities alone may not be sufficient for achieving management objectives [20].
In this study, we investigated the early trophic ecology and growth of juvenile tiger trout stocked as fingerlings into seven lentic subalpine systems in Colorado as biocontrol for undesirable fishes and to provide unique fishing opportunities. The systems were in close proximity and contained different undesirable fish species including stunted brook trout (S. fontinalis), fathead minnows (Pimephales promelas), or white suckers (Catostomus comersonii). Thus, study systems supported a range of potential prey fishes and competitors. Desirable stocked rainbow trout (O. mykiss) and cutthroat trout (O. clarkii) were also present in a subset of systems. Our primary objective was to discern the relative importance of intra- versus interspecific interactions in driving the growth of tiger trout over their first year of life, after accounting for other key physical and biological attributes of the study systems. First, we used stable isotope ratios of carbon (δ13C) and nitrogen (δ15N) to quantify the diet, trophic niche space, and niche overlap among different size-groups of tiger trout and other fish species in each system to characterize the potential for resource competition [21]. Next, we tested the importance of different attributes of the study systems derived from stocking records and field sampling for predicting the back-calculated lengths tiger trout achieved at age-1 using a machine learning (Random Forest) modeling approach [22]. Indices for the degree of intra- (i.e., cohort-specific stocking density) and interspecific (i.e., catch per unit effort of undesirable fishes) interactions were explicitly included in the predictive modeling.

2. Materials and Methods

2.1. Study Area

We sampled the fish community and other biological attributes of seven lakes and reservoirs located on the Grand Mesa plateau in western CO, USA. The systems varied in metrics of productivity (explained below; Table 1) and ranged between 3048 and 3188 m in elevation, 6.3 to 25.3 ha in surface area, and 4.6 to 13.7 m maximum depth. Prior to field sampling in 2017, each system had been stocked (from 2007–2016) with either a single cohort or multiple cohorts of age-0, fingerling-sized tiger trout (73–109 mm total length [TL] on average) at varying densities by Colorado Parks and Wildlife (CPW) fisheries managers to control undesirable species (brook trout [2 systems], fathead minnows [5 systems], and white suckers [1 system]) and to create unique angling opportunities on the Grand Mesa (Table 2). In all systems, most stocking events occurred in mid-to-late June (14th–26th; n = 12), although a small number occurred in mid-to-late July (11th–27th; n = 4), and one occurred in late August (25th).

2.2. Field Sampling

Field sampling protocols resembled other standard subalpine procedures [23] and were designed to rapidly (over a single day visit) characterize the (1) physical limnology (vertical profiles of temperature and dissolved oxygen [DO]), (2) zooplankton density, size-structure, and community composition, and (3) the relative abundance and size structure of undesirable fish, other stocked salmonid sport fish, and tiger trout in each study system. Procedures also allowed for collection of biological samples. The timing of sampling coincided with typical tiger trout stocking, so fish released in 2016 (six of the seven systems; Table 2) were in the environment for one full year. The rapid sampling scheme ensured that collections occurred over a brief period (from 28 June 2017–13 July 2017) and under similar environmental conditions to standardize among-lake comparisons of biotic and abiotic variables. All sampling occurred during daylight hours.

2.2.1. Physical Limnology, Zooplankton, and Invertebrate Collections

Three equally dispersed offshore stations along the longitudinal axis of each study system were sampled for limnology and zooplankton. One station was always located in the deepest region. At each station, Secchi disk depth (m) was measured and vertical temperature (°C) and DO (mg/L) profiles were measured with a YSI Pro-DO meter and DataSonde from the surface to the bottom at 1 m intervals. Next, zooplankton were sampled with a 153-μm Wisconsin style net towed from the lake bottom to the water surface at each station and preserved in 4% sugared formalin (buffered). We estimated the mean (across three stations) biomass density (g dry weight/m2) of all zooplankters following Hansen et al. [24]. Briefly, zooplankters from at least three 1-mL subsamples—containing at least 150 organisms of the dominant taxon—were identified to species, counted, and measured for body length (BL). Body lengths were converted to dry weights using taxon-specific length-weight regressions found in Watkins et al. [25], then applied to taxon-specific counts to estimate total biomass in each tow, then scaled based on the surface area (107.5 cm2) of the net opening assuming 100% capture efficiency. Bulk samples of zooplankton for δ13C and δ15N analyses were also collected by towing a larger diameter 153-μm mesh net through surface waters adjacent to each station. Lastly, we hand collected available benthic invertebrates with dip nets and beach seines from three locations spread across each lake (including near inlet and outlet) for stable isotope analysis. These samples, combined with the bulk zooplankton, were used to determine baseline δ13C and δ15N values for informing fish diet estimation with stable isotope mixing models (see below).

2.2.2. Fish Sampling and Collection of Biological Samples

We used a suite of gears to characterize the relative abundance (number captured per hour of effort or “catch rate”), size-structure, and spatial distribution of fish in each study system. Fishing multiple gears reduced the size-selective bias of any single gear and ensured sufficient capture of small-bodied fishes. Sampling equipment included two 15.24 m long × 1.52 m deep micro-mesh gill nets with 5 randomly positioned mesh panels of equal length (1.27 cm; 0.64 cm; 1.91 cm; 0.95 cm; 1.59 cm bar measure), two 24.38 m long × 1.83 m deep experimental gill nets with 8 randomly positioned mesh panels of equal length (3.81 cm; 5.72 cm; 2.54 cm; 4.45 cm; 1.91 cm; 6.35 cm; 3.18 cm; 5.08 cm bar measure; [26]), and two 0.95 cm knotless mesh, miniature trap nets with a 0.61 m × 0.91 m box frame and 7.62 m lead.
Paired micro-mesh and experimental gill nets were set during daylight hours for short periods (30 min to 1.5 h) depending on fish density to minimize gear saturation and undue mortality on tiger trout. Because the systems were thermally stratified, the first net was attached to, and set perpendicular to, the shoreline within warmer epilimnetic depths (generally 0–2 m and ranged from 17–19 °C across systems during the sampling period), and the second net was set along the same axis but in deeper, offshore water at depths within the cooler thermocline (generally 2–6 m and ranged from 5–17 °C). We attempted to complete three independent paired short-term sets with each gill net type in each system. Set locations were dispersed and selected to capture the range of variability in observed habitat types (typically steeper shoreline with rocky/wooded substrate versus more gradually sloped shoreline with vegetated substrate). Lastly, two miniature trap nets were attached to, and fished perpendicular to, the shoreline in different habitat types. One was always placed near the inlet if possible. Trap nets were set first and pulled after all other sampling and fish processing was completed.
All fish captured were counted and measured for TL in mm and weighed to the nearest 0.1 g. Fish were then categorized by TL to facilitate among lake comparisons and account for size-dependent trophic relationships [21]. Fish < 150 mm were deemed ‘small’, fish 150–249 mm were ‘medium’, and fish ≥ 250 mm were ‘large’. Groups were chosen based on clear, shared inter-species size-delineations present in length-frequency histograms (Figure 1). In addition, we non-lethally collected caudal fin tissue (flash frozen on dry ice) from all, or a systematic random subsample of fish (five per 25 mm size-bin) depending on catch rates in nets for analysis of δ13C and δ15N [27]. To supplement invertebrate samples for stable isotope analysis and capture as broad a diversity as possible, we collected gut contents from all tiger trout, and subsamples of brook trout and cutthroat trout (where present), to collect rare prey items or items that were difficult to sample directly (e.g., leeches and terrestrial invertebrates). Lastly, we non-lethally removed 5–10 scales (within six scales of the lateral line at the intersection point of an axis extending from the posterior base of the dorsal fin to the anterior base of the anal fin) from each tiger trout captured for age and growth analysis. Scales were stored in wax paper until analysis in the laboratory.

2.3. Laboratory Analysis of Biological Samples

2.3.1. Stable Isotope Analysis

Fin tissue from fishes, bulk zooplankton, and whole-body invertebrate samples representative of each study system were dried at 60 °C for 72 h, homogenized into a powder with a mortar and pestle, encapsulated in tins, and analyzed (for estimation of δ13C and δ15N) using a Thermo Delta V isotope ratio mass spectrometer interfaced to a NC2500 elemental analyzer at the Cornell Stable Isotope Laboratory, Cornell University (Ithaca, NY, USA). Reference material was Vienna Pee Dee Belemnite for carbon and N2 for nitrogen. To avoid bias from variable lipid concentrations among samples and species, we normalized δ13C values (if necessary) using C:N ratios following Post et al. [28].

2.3.2. Age and Growth of Tiger Trout

Scale samples from tiger trout (n = 128 across study systems) were first sorted under a dissecting microscope to remove regenerated scales. Then, 3–5 non-regenerated scales were placed on a microscope slide and imaged individually with a stereoscope and Infinity X camera (©2021 Teledyne Lumenera, Ottawa, ON, Canada). Annuli on the clearest scale image from each fish were counted and measured (distance from focus to outer edge of annuli in mm) by two experienced readers using ImageJ. When age interpretations differed, scales were reanalyzed by both readers until consensus was reached [29]. To standardize comparisons of growth across study systems, measurements were used to back-calculate the TL of each fish at the first annulus (i.e., age-1). We observed a strong linear relationship between fish TL at capture and total scale radius (TSR; TL = 201.9·TSR + 18.22; p < 0.001; r2 = 0.81). Therefore, we used the Fraser-Lee method [29] to back-calculate TL-at-first-annulus for each fish individually. We used an a value of 18.22 mm (intercept of TL-TSR relationship and estimate of TL-at-first-scale-formation). The presence of known-aged cohorts (based on year stocked) helped corroborate scale interpretations.

2.4. Data Analysis

2.4.1. Stable Isotope Analysis of Trophic Niche Space and Overlap

We defined trophic niche space as the bivariate distribution of δ13C and δ15N values (in per mil units [‰]; [30]). Strong overlap in these isotopic regions (characterized by ellipses) among species within the same system would provide evidence for potential competitive interactions under resource limitation [21,31]. For each system, we used the ‘nicheROVER’ package [32] in R [33] to fit 95% bivariate prediction ellipses for every size-group and species of fish sampled and to compute the probability that an individual tiger trout from one size-group would fall within the trophic niche space of another size-group and species. Probabilities were accompanied by 95% credible intervals (CIs; [34]).

2.4.2. Diet Characterization from Stable Isotopes of Carbon and Nitrogen

To support the trophic niche overlap analysis and evaluate diet composition more explicitly, we fit Bayesian stable isotope mixing models using the ‘simmr’ package [35] in R to estimate the proportion (and uncertainty represented by 95% CIs) of different prey items consumed by each size-group and species of trout encountered. Model results were also used to examine whether the degree of piscivory achieved by alternate size-groups of trout varied among species and systems supporting different undesirable fish. The δ13C and δ15N values (and corresponding SDs) for prey sources were specific to each study system, but sources were lumped into five categories for ease of comparison: fish (edible-sized brook trout, fathead minnows or white suckers), aquatic invertebrates (Chaoboridae, Chironomidae, Diptera, Ephemeroptera, Gammaridae, Gastropoda, Hirudinea, Odonata, and Trichoptera observed across systems), terrestrial invertebrates (Coleoptera, Hymenoptera, and Hemiptera observed across systems), tiger salamander (Ambystoma tigrinum; only included in analysis if detected by sampling), and bulk zooplankton.
Fish was not included as a prey source for small tiger trout (only one fish sampled) and brook trout (no small cutthroat trout were encountered) given likely gape limitations [11], but included as prey for both medium and large fishes. Mixing models were fitted with uninformative priors on diet composition using default Markov Chain Monte Carlo parameters provided within simmr. However, we incorporated trophic enrichment factors (mean ± SD) of 0.4‰ ± 1.0 for δ¹³C and 3.4‰ ± 1.0 for δ¹⁵N [36].

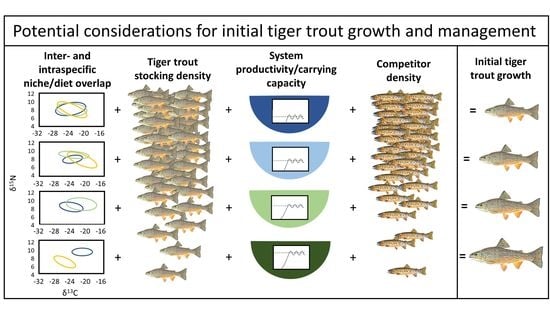
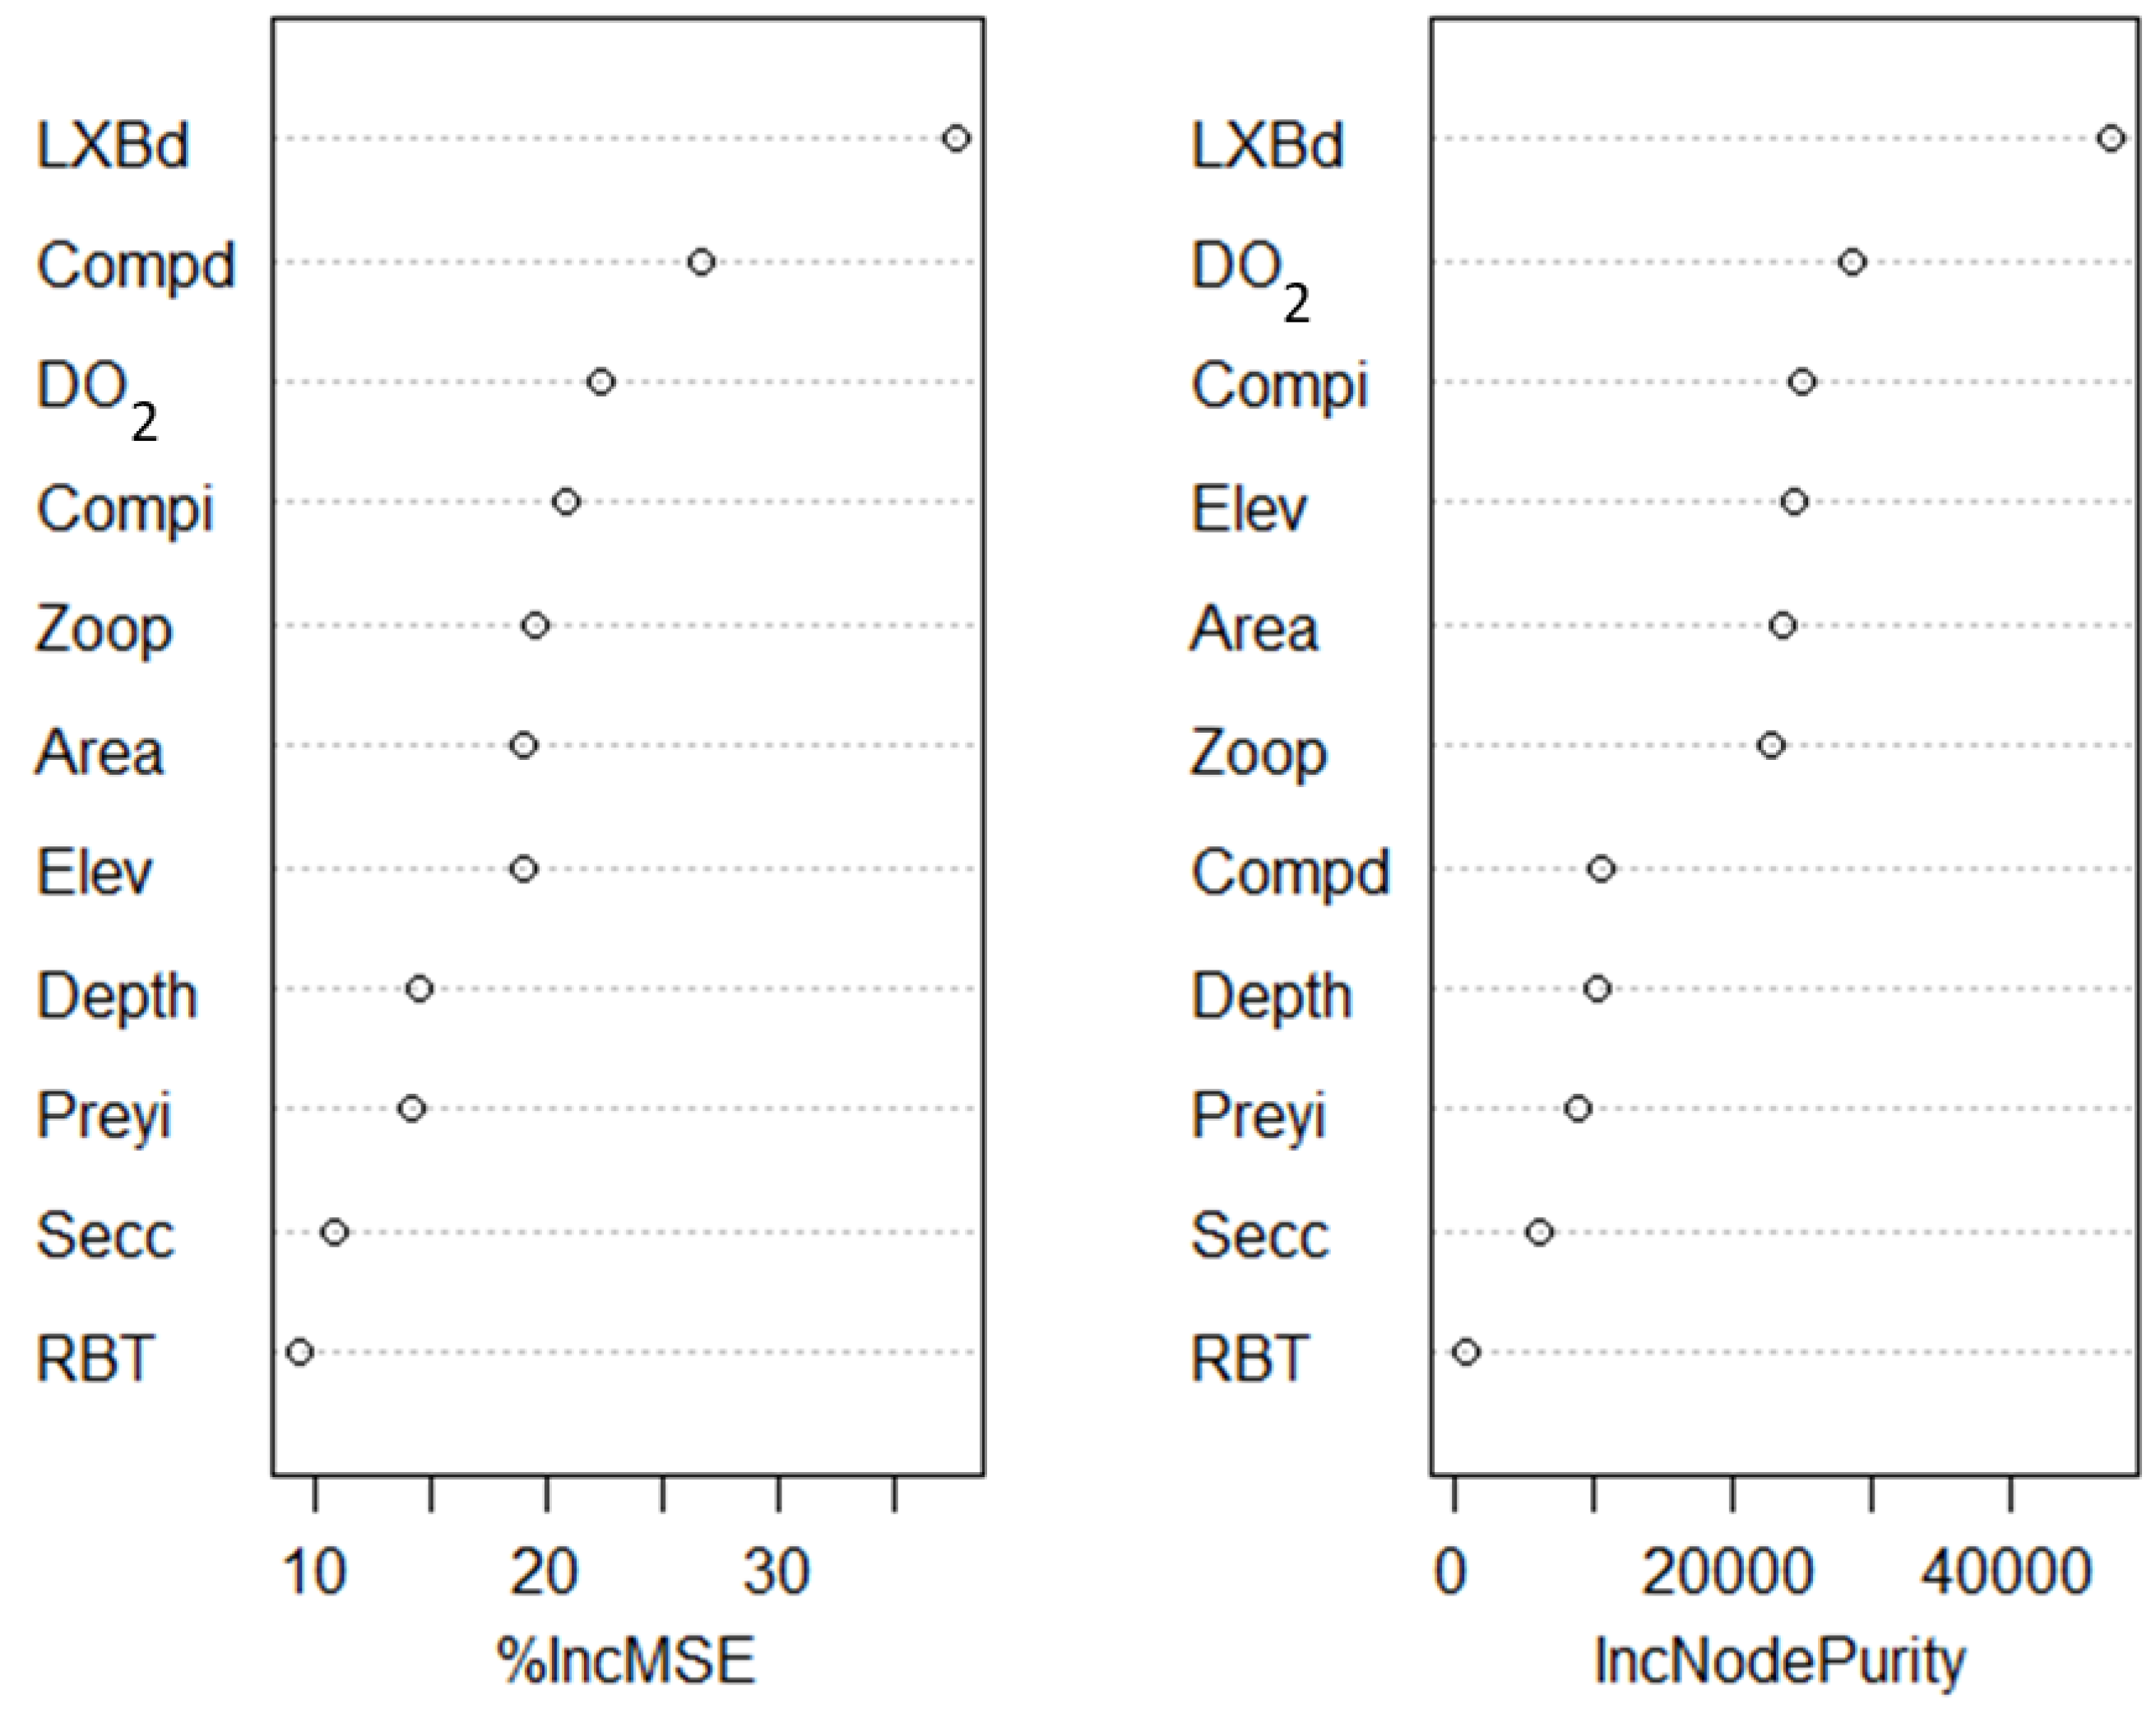
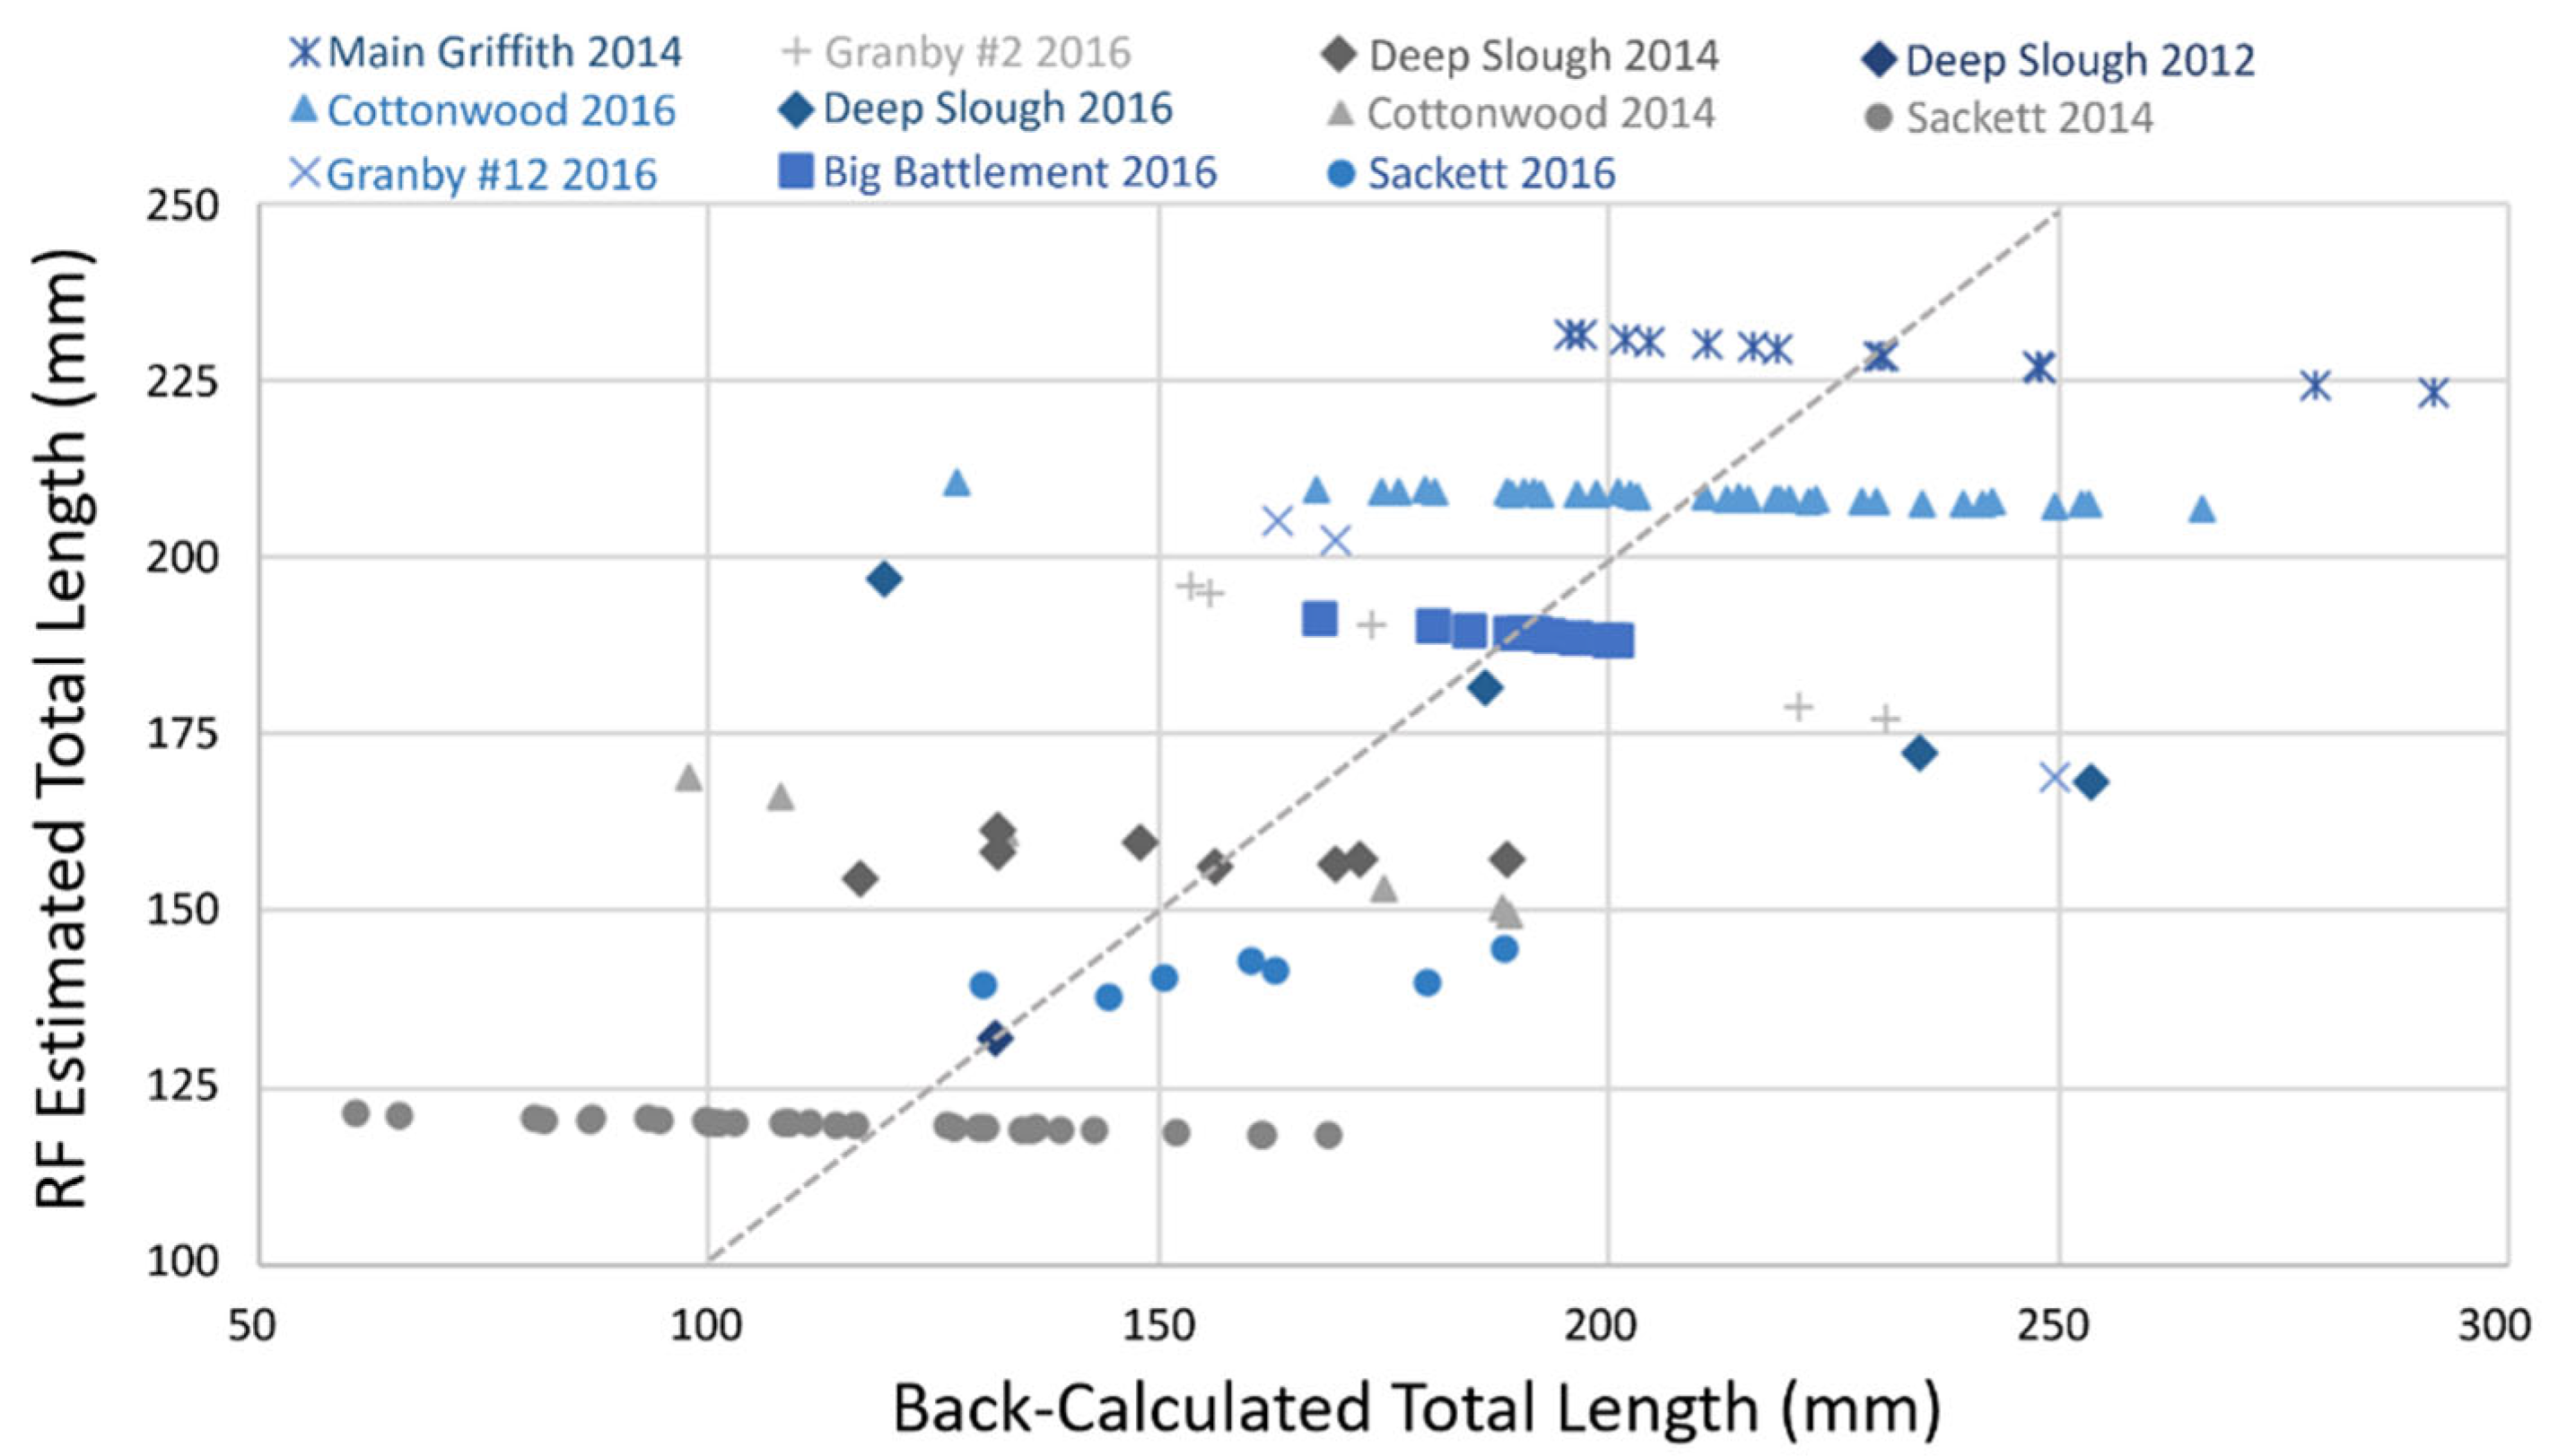
2.4.3. Predictors of Early Tiger Trout Growth and Random Forest Modeling

We applied a machine learning technique called Random Forest (RF; [22]) to statistically evaluate predictors of early tiger trout growth (represented by back-calculated TLs at the first scale annulus). The RF approach is relatively novel and well suited for ranking the importance of predictors that may be correlated or interact in complex ways. Although mean size-at-stocking (73–109 mm TL; Table 2) varied among cohorts released since 2007, most cohorts encountered during our 2017 field sampling were stocked at a similar time of year (late June) and size (ranged from 87–96 mm TL [n = 9]). However, one cohort was stocked earlier in the year (mid-June) at a slightly smaller size (73 mm), but an earlier stocking date allowed more time for growth. Similarly, one cohort was stocked later in the year (late July) at slightly larger size (109 mm), but a later stocking date allowed less time for growth. Therefore, we did not adjust for mean size-at-stocking, and assumed that the TL-at-first-annulus of surviving fish best reflected ecological conditions within each study system and was most appropriate for predictive modeling.
For predictors, we selected physical and biological attributes that characterized visual differences in habitat complexity among study systems, potential density-dependent species interactions, food web structure, prey availability, and system productivity (Table 1, Table 2 and Table 3). Lake morphometry and water clarity can influence fish growth in complex ways by affecting the spatial-temporal dimensions of oxy-thermal habitat, availability of suitable growth habitats, behavioral responses and predator-prey overlap, and foraging efficiency [37,38,39,40]. Because of these complexities, the directional effect of any one physical attribute is hard to predict, but collectively, may help explain variation in fish growth, particularly if representative of typical summer growing conditions. Therefore, physical attributes included: elevation (‘Elev’; m), maximum depth (‘Depth’; m), surface area (‘Area’; ha), summer Secchi disk depth (2017 sampling), an indicator of water clarity (‘Secc’; m), and percent of the water column with DO levels ≤2 mg/L (‘DO2’; %) during summer (2017 sampling). The DO2 metric was designed to capture variability in the coverage and structural complexity of submerged macrophytes [41] observed among study systems in the field and provide a relative index of system productivity ([42]; see Section 4).
Biological attributes characterized potential density-dependent species interactions [43]. Metrics included the cohort-specific stocking density of fingerling tiger trout (‘LXBd’; number/ha)—a relative index of potential intraspecific competition at time of stocking; the stocking density (number/ha) of other salmonid sport fish (cutthroat and rainbow trout combined; ‘Compd’) in the same year as tiger trout—an index of potential interspecific competition; the presence/absence of stocking ‘large competitors’ (i.e., catchable rainbow trout ≥ 225 mm TL; ‘RBT’) at any point in the recent history of each system—a metric of potential legacy competition; the relative abundance of non-tiger trout (i.e., other stocked salmonids and undesirable fish species combined) captured in standard experimental gill nets during 2017 field sampling (‘Compi’; number fish/hour)—another index of potential interspecific competition; the relative abundance of prey-sized fish captured in micro-mesh gill nets and miniature trap nets combined (‘Preyi’; number fish/hour)—an index of prey availability; and the mean summer biomass density of zooplankton (‘Zoop’; g dry weight/m2; 2017 field sampling)—a secondary measure of system productivity that integrated bottom-up and top-down food web processes [44,45] and provided an index of early food supply available for juvenile salmonids post-stocking [46].
To perform the RF analysis, we used the ‘randomForest’ package [47] in R. Accuracy and error rate calculations for each observation (i.e., TL-at-first-annulus for each individual within each cohort of tiger trout sampled) using out-of-bag predictions (i.e., predicting data that were withheld) were based on 2000 regression trees. Predictions of data that were not used to evaluate model fit represented a form of cross-validation. The relative importance of different growth predictors outlined above was assessed by comparing the increase in (1) mean squared prediction error and (2) node purity if removed from the model [22,47,48]. Lastly, predictors related to lake morphometry (Elev, Depth, and Area) are stable through time, and therefore, could be applied to each individual from each cohort sampled. Similarly, CPW stocking records used to obtain LXBd, Compd, and RBT were specific to when each cohort of tiger trout was stocked. However, we were forced to assume that physical and biological metrics measured during 2017 field sampling (i.e., Secc, DO2, Compi, Preyi, and Zoop) were representative of past summer conditions, even for tiger trout stocked prior to 2016 that were older than age-1 in 2017 (mostly fish stocked in 2014). Having one or more of these metrics (1) help explain significant levels of variation in TL-at-first-annulus and (2) exhibit high variable importance in the RF model would support the validity of this assumption.

3. Results

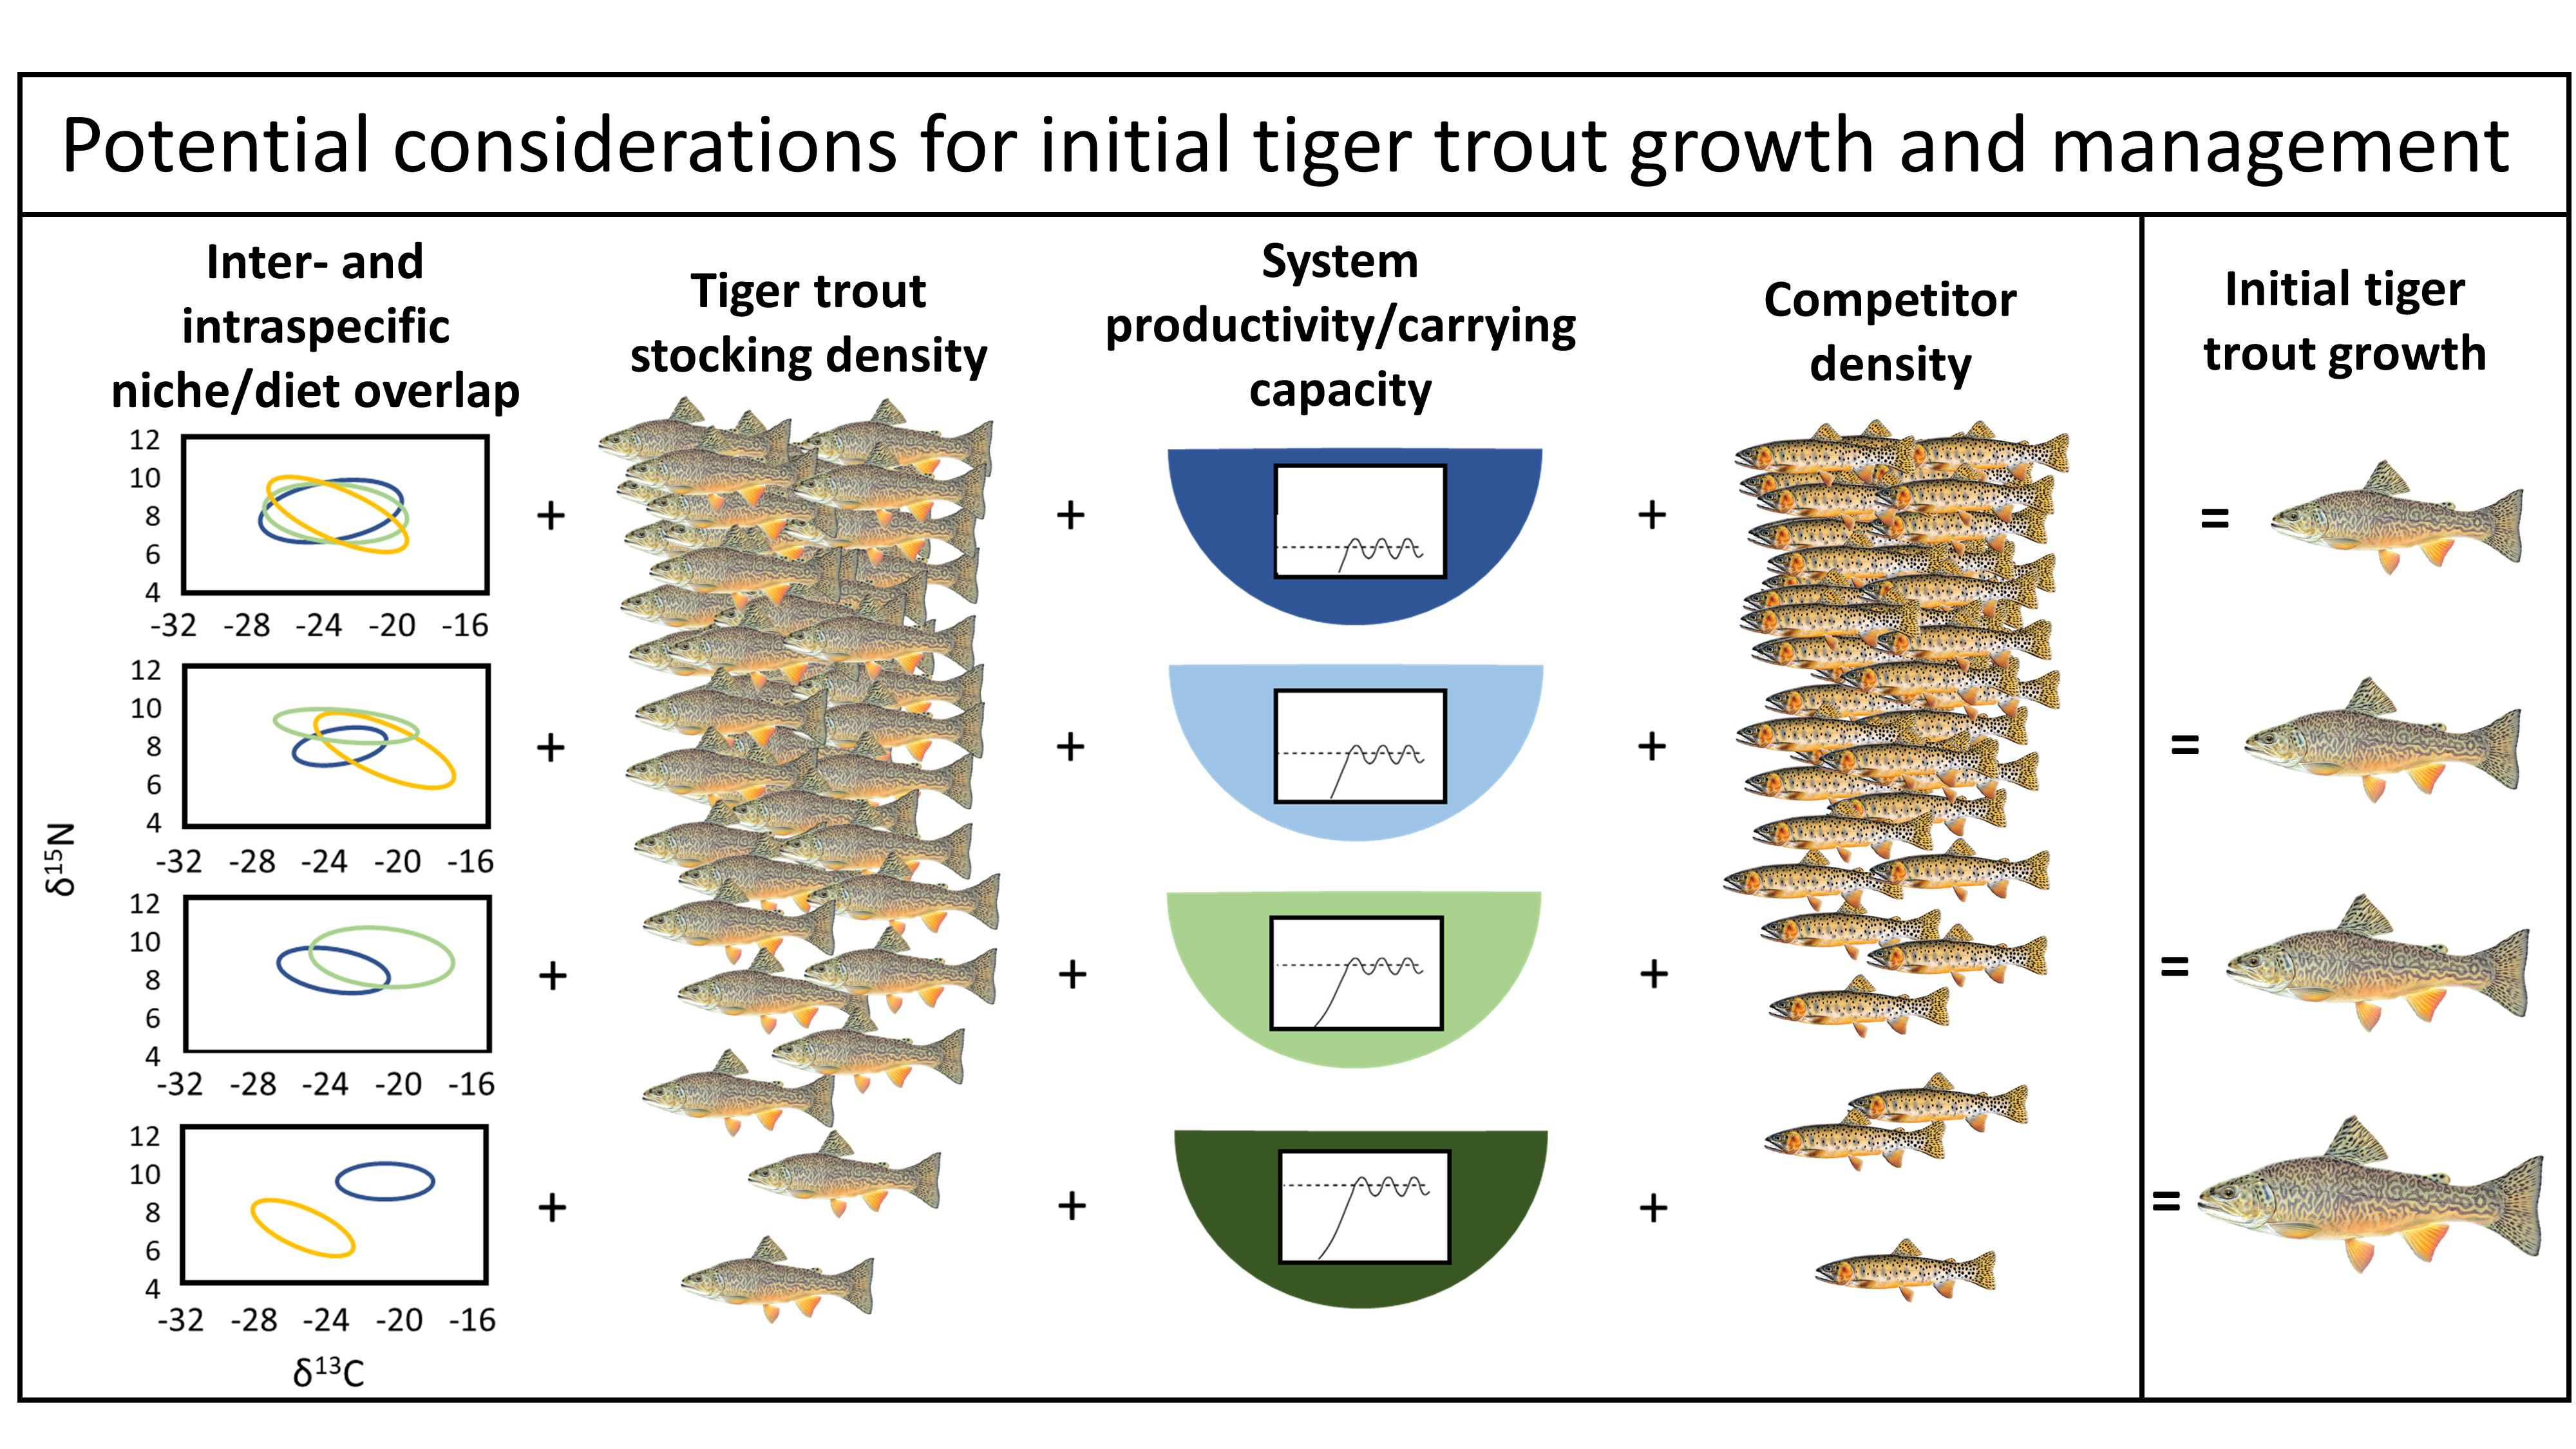
3.1. Variation and Patterns in Tiger Trout Growth and System Attributes

We observed a broad range of variation in the back-calculated TLs of tiger trout at the first scale annulus and other physical and biological attributes when looking across study systems. First, back-calculated TLs of individual tiger trout ranged from 612–292 mm TL. Cohort-specific means ranged from 115–229 mm TL. Cohorts encountered were predominately age-1 and age-3 tiger trout stocked in 2016 and 2014, respectively, but one age-5 fish stocked in 2012 was encountered in Deep Slough Reservoir. Mean summer Secchi disk depths ranged from 1.25–4.88 m; DO2 ranged from 5–61% (Sackett Reservoir was 0%); and Zoop ranged from 0.03-1.53 g dry weight/m2 (Table 1). Cohort-specific stocking densities of tiger trout ranged from 14–867 fish/ha. The stocking densities of other salmonid sport fish fell within this same range of variation (65–721 fish/ha), but cutthroat trout were only stocked as fingerlings, whereas rainbow trout were stocked as larger catchable-sized fish ≥ 225 mm (Table 2). Simultaneous stocking of tiger trout and other salmonid sport fish only occurred for three cohorts (Table 2), one of which was not encountered during 2017 field sampling (2014 and 2016 cohorts in Cottonwood Lake #4 encountered and 2011 cohort in Sackett not encountered).
The relative abundance of fishes varied across study systems (Table 3). The catch rates of tiger trout ranged from 0.22–6.03 fish/hour in experimental gill nets and 0.00–4.14 fish/hour in micro-mesh gill nets. No tiger trout appeared in trap nets, which only captured small-bodied fathead minnows and white suckers. In general, gill net catch rates of tiger trout were higher in systems (i.e., Cottonwood, Deep Slough, and Sackett) stocked at higher densities and/or that received multiple cohorts of fish, indicating that our standard sampling procedures were adequate for characterizing relative abundance. For example, after one year of mortality, there was a strong linear relationship between the gill net catch rates (experimental and micro-mesh combined) of age-1 tiger trout (GCRLXB) and their stocking density (SDLXB) the previous year (GCRLXB = 0.027·SDLXB − 0.31; n = 5; r2 = 0.81; p = 0.038; Deep Slough excluded since micro-mesh nets were not fished and Griffith Lake excluded since only age-3 tiger trout were present).
Two study systems contained brook trout. Catch rates (number fish/hour) of brook trout in experimental (mean ± SD; 9.29 ± 5.29) and micro-mesh gill nets (5.00 ± 3.47) were higher in Big Battlement Lake than in Sackett (0.98 ± 1.13 and 1.47 ± 1.30, respectively). Big Battlement was only stocked in 2016 with a low density of tiger trout (29 fish/ha) whereas Sackett had received three cohorts since 2011 at rates reaching 867 fish/ha in 2014 (highest observed), but then reduced to 131 fish/ha in 2016. Tiger trout catch in Sackett during 2017 was dominated (78%) by the densely stocked 2014 cohort (i.e., age-3 fish), and the mean back-calculated TL-at-first-annulus for this group (mean ± 2SE; 115 ± 10 mm; n = 32; range = 61–152 mm) was the lowest estimated across systems. Field sampling in 2017 indicated that the productivity of Sackett was low relative to other systems (DO2 = 0%; Secc = 3.75 m; Zoop = 0.03 g dry weight/m2; Table 1), which may have been a contributing factor during 2014. Comparatively, the 2016 cohort in Sackett was stocked at an 85% lower rate, and reached 41% greater size on average (162 ± 14 mm; n = 8; range = 131–188 mm). The 2016 cohort of tiger trout in Big Battlement was stocked at a 97% lower rate than the 2014 cohort in Sackett, and reached 64% greater size (189 ± 7 mm; n = 11; range = 168–201 mm), despite the higher relative abundance of potential large-bodied, brook trout competitors. Although, growth in Big Battlement may have been compensated for by greater productivity relative to Sackett, indicated by metrics collected during 2017 (DO2 = 14%; Secc = 4.88 m; Zoop = 1.53 g dry weight/m2; Table 1).
Four study systems contained small-bodied fathead minnows. Catch rates (number fish/hour) of fathead minnows in micro-mesh gill nets (mean ± SD) were higher in systems only containing a single age-1 cohort of tiger trout stocked in 2016 (13.69 ± 19.92 in Granby Reservoir #2 and 91.03 ± 101.97 in Granby Reservoir #12) when compared to systems that contained age-3 tiger trout stocked in 2014 (0.17 ± 0.41 in Cottonwood and 1.98 ± 3.3 in Griffith). Similar patterns were observed in the miniature trap nets, although these nets were not fished in Granby #2 (Table 3). Of the fathead minnow systems examined, Granby #12 was stocked with the lowest density of tiger trout (one cohort in 2016 at 14 fish/ha), while Cottonwood was stocked with the highest densities (2014 cohort at 138 fish/ha and 2016 cohort at 207 fish/ha). Granby #2 (one cohort in 2016 at 75 fish/ha) and Griffith (one cohort in 2014 at 39 fish/ha) were stocked at intermediate densities (Table 2). Some differences in TL-at-first-annulus (mean ± 2 SE) were also observed. Fish stocked at low or intermediate densities in Granby #2 (187 ± 33 mm; n = 5; range = 154–231 mm) and #12 (194 ± 5 mm; n = 3; range = 163–249 mm) achieved similar size. Productivity metrics measured in 2017 from these reservoirs were similar, but Zoop in Granby #12 (DO2 = 5%; Secc = 2.71 m; Zoop = 0.50 g dry weight/m2) exceeded Granby #2 (DO2 = 29%; Secc = 2.88 m; Zoop = 0.07 g dry weight/m2), yet DO2 in Granby #2 exceeded Granby #12 (Table 1). In Cottonwood, the 2016 cohort (210 ± 10 mm; n = 36; range = 128–266 mm) stocked at a 50% greater density performed better than the 2014 cohort (148 ± 33; n = 6; range = 98–189 mm), but relatively high densities of both fingerling cutthroat trout (656 fish/ha) and catchable rainbow trout (197 fish/ha) were stocked in the same year as the 2014 cohort, whereas only catchable rainbow trout (194 fish/ha) were stocked in the same year as the 2016 cohort (Table 2). Both the DO2 (40%) and Zoop (0.47 g dry weight/m2) metrics indicated that Cottonwood (Secc = 3.46 m) was more productive than the Granby and brook trout systems, which may have contributed to the 2016 cohort obtaining the second largest mean TL-at-first-annulus across all systems examined despite the high stocking density. The 2014 cohort stocked into Griffith obtained the largest size observed (229 ± 17 mm; n = 13; range = 193–292 mm), which may have reflected the lower stocking density, but also relatively high system productivity (DO2 = 61%; Secc = 3.63 m; Zoop = 0.10 g dry weight/m2). Visually, Griffith exhibited the greatest extent and density of submerged macrophytes, which was captured by our DO2 metric (61%).
We only sampled one reservoir containing white suckers (Deep Slough). Catch rates (number fish/hour) of white suckers in experimental gill nets (mean ± SD; 44.25 ± 22.50) exceeded those of undesirable fish species in other study systems (fathead minnows were never captured in experimental nets), indicating that Deep Slough contained the greatest density and biomass of potential competitors, but also small-bodied prey fish. High catch rates in experimental gill nets (larger-bodied fish more vulnerable) precluded use of the micro-mesh gill nets (small-bodied fish more vulnerable), but relatively high numbers of prey-sized suckers appeared in the miniature trap nets (Table 3). Three of the four tiger trout cohorts stocked in Deep Slough were encountered during 2017 field sampling (2012, 2014 and 2016 encountered, 2011 not encountered). The 2016 cohort was stocked at about half the density (83 fish/ha) as the 2012 (132 fish/ha) and 2014 cohorts (164 fish/ha; Table 2), and achieved 30–51% greater mean TL-at-first-annulus (mean ± 2SE; 199 ± 60 mm; n = 4; range = 119–254 mm) when compared to 2012 (132 ± 17; n = 1) and 2014 (153 ± 15 mm; n = 9; range = 117–189 mm) fish. Despite the high relative abundance of potential large-bodied, white sucker competitors, and the presence of previously stocked cohorts of tiger trout (age-3 fish stocked in 2014 comprised 64% of 2017 catch), some tiger trout from the 2016 cohort in Deep Slough obtained a similar size as conspecifics from the best growing cohorts sampled across study systems. The relatively high productivity of Deep Slough based on 2017 metrics (DO2 = 20%; Secc = 1.25 m; Zoop = 1.47 g dry weight/m2; Table 1) could have contributed to this observation.

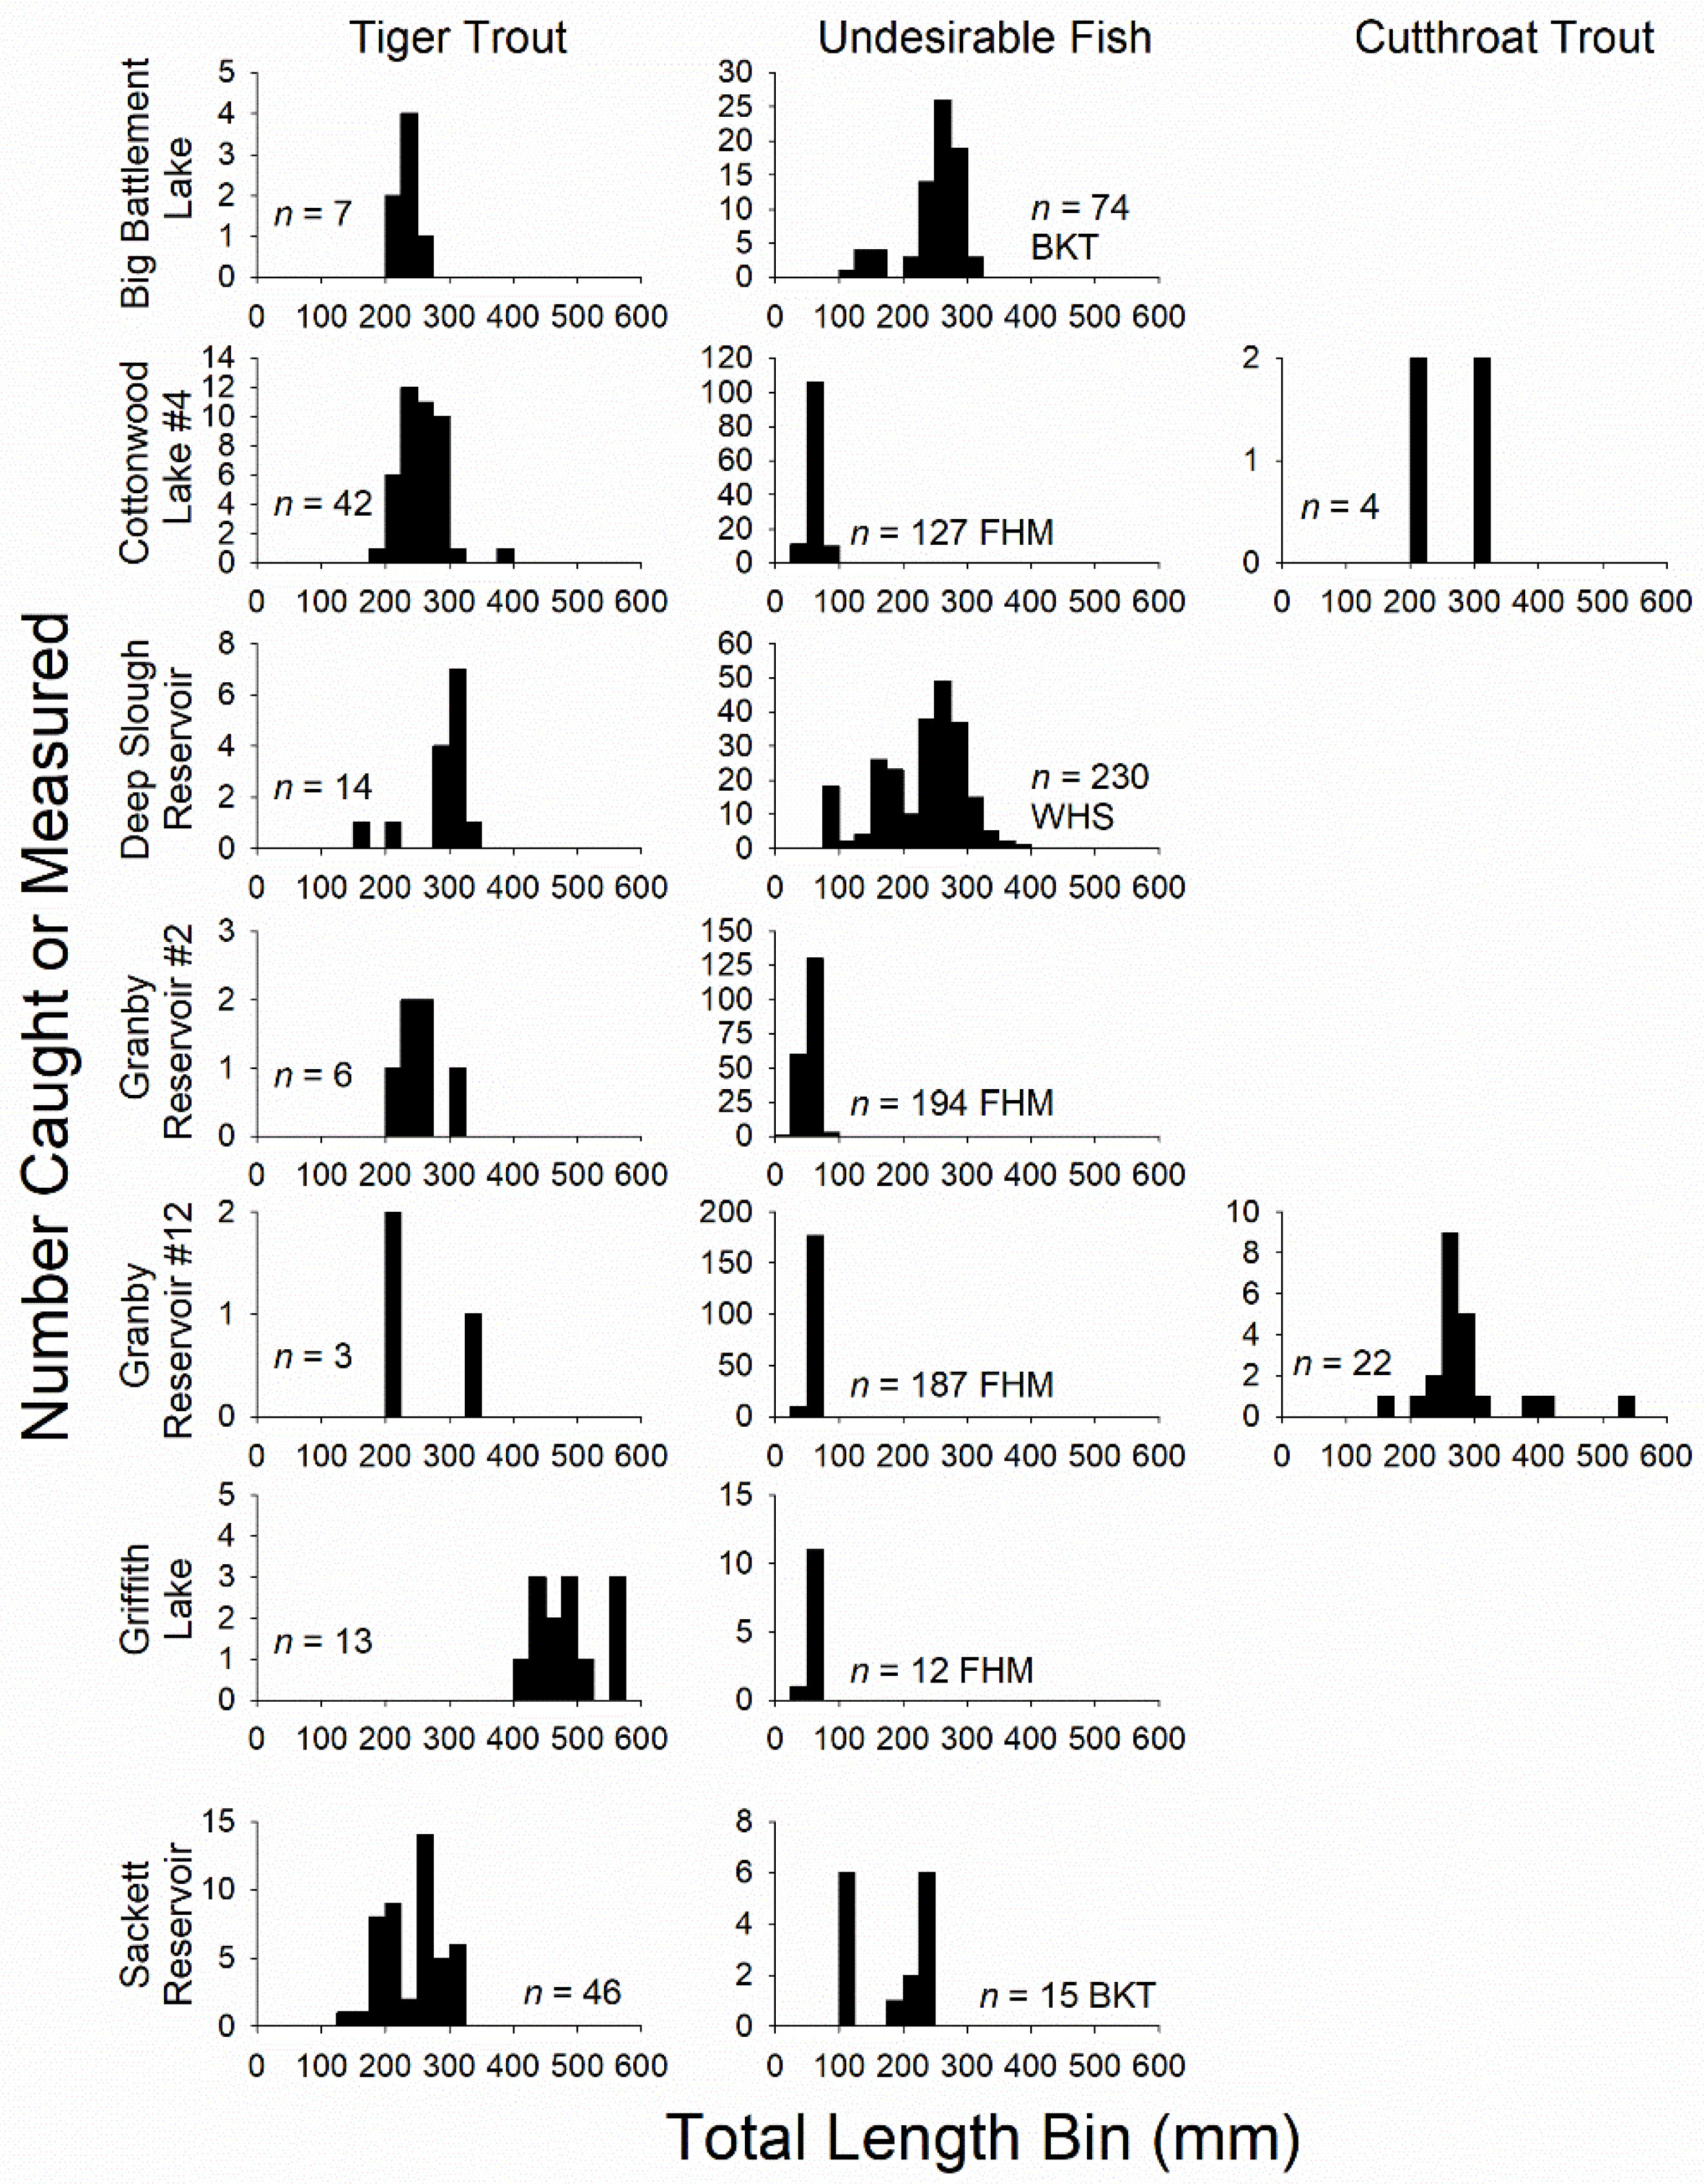
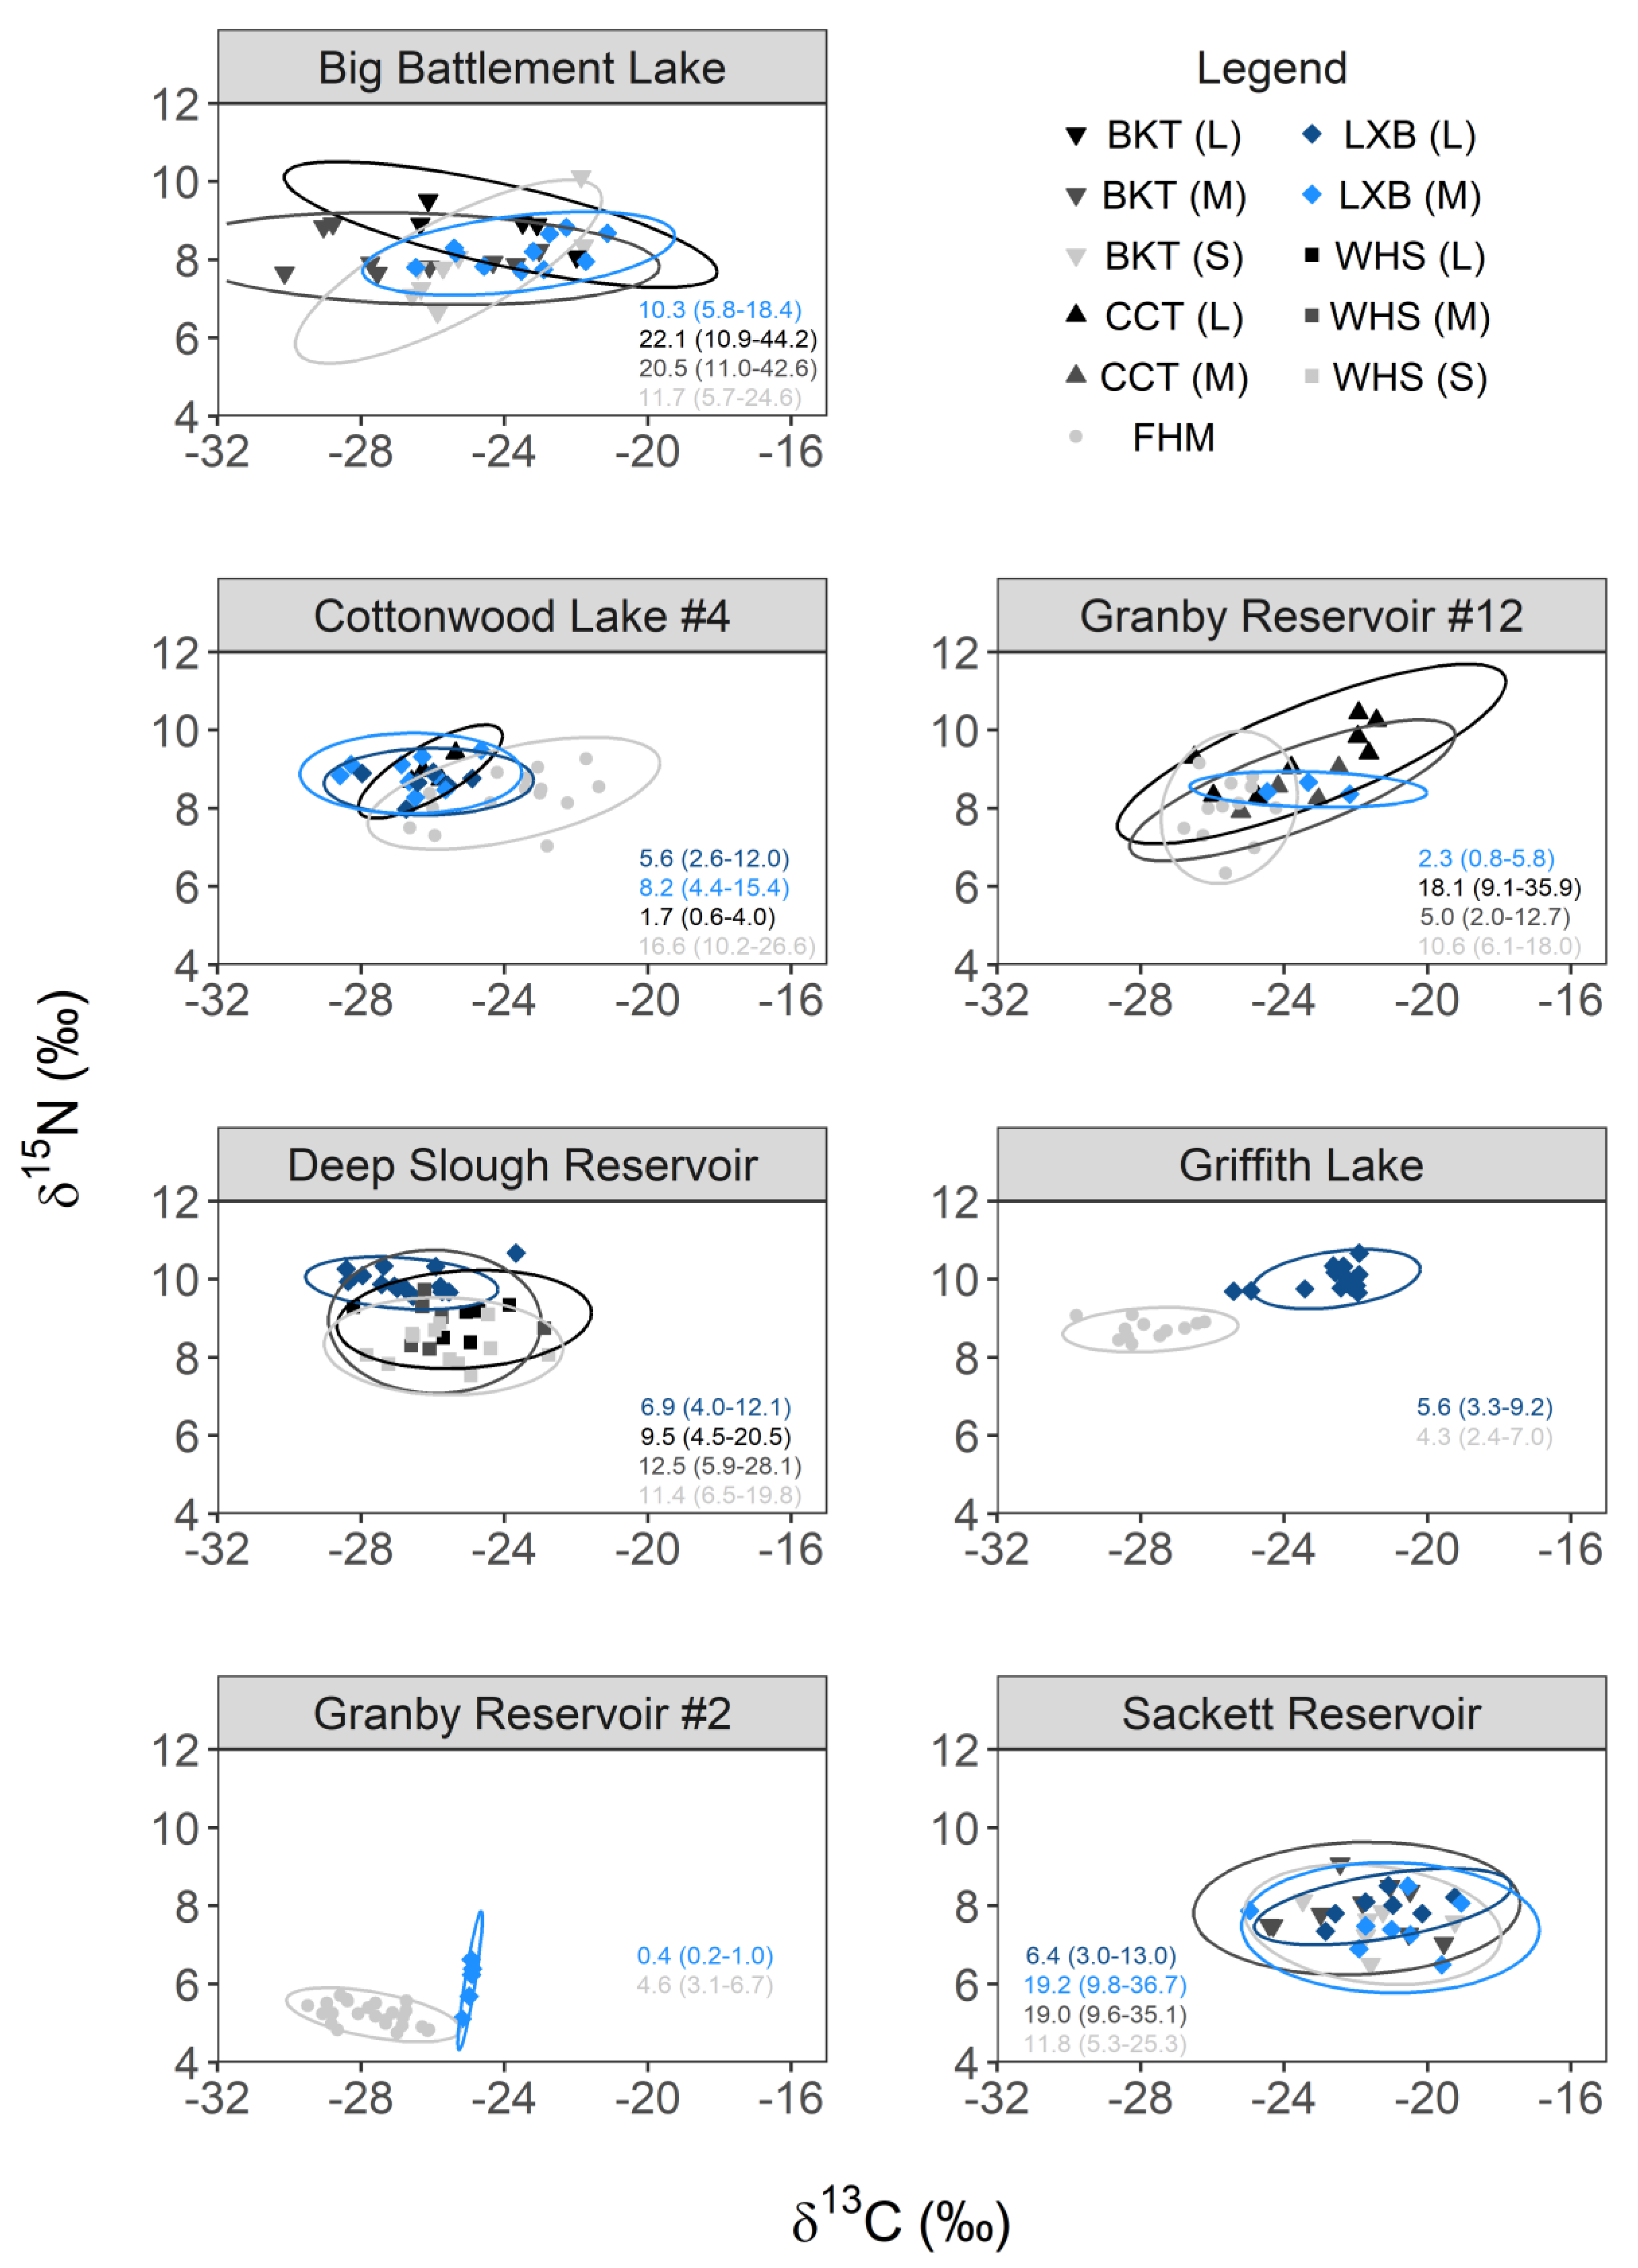
3.2. Trophic Niche Overlap and Potential for Competition

Patterns in tiger trout growth, the relative abundance of different fishes, and metrics of productivity derived from 2017 field sampling indicated that the potential for food resource competition could vary across study systems. This potential, however, also depends on the degrees of trophic niche overlap. Trophic niche space ranged from 0.4–22.1‰2 across species, size-groups, and study systems (Figure 2). This variation translated into varying degrees of trophic niche overlap between different size-groups of tiger trout and between tiger trout and other stocked salmonid sport fish or undesirable fish (Table 4). Tiger trout consistently overlapped most with medium and large brook trout, averaging 79-94% across Big Battlement and Sackett. In Sackett where small, medium, and large tiger trout were encountered, intraspecific overlap varied by size-group. Overlap between small and medium tiger trout (combined) and large tiger trout was intermediate (41% [95% CI = 17–72%]), but the probability of a large tiger trout falling within the trophic niche space of small and medium tiger trout was high (91% [61–100%]). These disparate overlap probabilities reflected the larger trophic niche space occupied by small and medium tiger trout (i.e., relied on a greater diversity of prey), which subsumed that of large tiger trout, indicating increased specialization with trophic ontogeny. Lastly, different sizes of tiger trout and brook trout in these systems exhibited relatively large trophic niche spaces when compared to fishes in the other systems (6.4–19.2‰2 and 11.7–22.1‰2, respectively; Figure 2).
Niche overlap between tiger trout and fathead minnows varied across systems. In Granby #2 and Griffith, the trophic niche space occupied by each species were among the smallest observed (0.4–4.6‰2), and overlap between them was negligible (<5% on average; Table 4). The latter was anticipated in Griffith as only larger age-3 tiger trout were present (Figure 1), and separation from prey to predator is expected with isotopic fractionation and trophic ontogeny. However, although δ15N values for tiger trout in Griffith were elevated above fathead minnows, they were separated along the δ13C axis more than expected from fractionation alone, indicating minimal reliance on minnows as prey at the time of sampling (Figure 2). The probability of an individual tiger trout falling within the trophic niche space of fathead minnows was higher in Cottonwood (34% [95% CI = 4–18%] for medium fish and 59% [13-98%] for large fish) and Granby #12 (31% [1–81%]; Table 4), and the trophic niche spaces occupied by these species were also larger (2.3–16.6‰2). Relative to Griffith, the bivariate isotopic positions of tiger trout in the latter two systems indicated greater reliance on minnows as prey at the time of sampling (Figure 2).
Patterns in intraspecific overlap between size-groups of tiger trout sampled in Cottonwood resembled those in Sackett. Overlap between medium and large tiger trout was intermediate (66% [95% CI = 35–95%]), but the probability of a large tiger trout falling within the trophic niche space of medium tiger trout was high (84% [46–100%]; Table 4), reflecting differences in trophic niche space and increased specialization with trophic ontogeny (Figure 2). Lastly, tiger trout overlapped considerably with medium and large cutthroat trout (68–71%), particularly in Granby #12 where cutthroat trout occupied relatively large trophic niche spaces (5.0–18.1‰2; Figure 2).
The trophic niche spaces occupied by large tiger trout (6.9‰2) and different size-groups of white suckers (9.5–12.5‰2) in Deep Slough were of intermediate size, and overlap among these regions varied (Figure 2). The probability that an individual tiger trout would fall within the trophic niche space of small white suckers was very low (4% [95% CI = 0–29%]), intermediate with medium white suckers (43% [2–95%]), and low with large white suckers (29% [1–89%]; Table 4). The bivariate isotopic positions of large tiger trout indicated that small-bodied suckers could represent important fractions of their diet since they exhibited higher δ15N values, but a similar range of δ13C values, which change little moving from prey to predator.

3.3. Rates of Piscivory among Size-Groups, Species and Study Systems

Rates of piscivory (i.e., mean percentage of diet comprised of fish prey) estimated from the Bayesian stable isotope mixing models were generally low and ranged from 5.9–32.3% across size-groups, species of trout, and study systems (Table 5). In brook trout systems, large tiger trout achieved greater rates of piscivory (mean = 19.5% [95% CI = 2.4–56.4%] in Big Battlement; 18.0% [2.9–37.1%] in Sackett) than medium tiger trout (12.6% [2.0–30.7%] in Big Battlement; 10.6% [1.6–26.4%] in Sackett), but considerable overlaps in 95% CIs were observed. Similar patterns were observed from medium and large brook trout, which exhibited comparable rates of piscivory as tiger trout in both systems (Table 5), providing evidence for cannibalism. These results also aligned with patterns in trophic niche overlap.
Rates of piscivory estimated for tiger trout in fathead minnow systems aligned with those observed from brook trout systems, with one exception. Piscivory estimated for tiger trout in Granby #2, Granby #12, and Cottonwood varied little among size-groups and systems, only ranging from 15.1–22.0% on average, and these estimates also exhibited relatively high degrees of uncertainty based on 95% CIs (Table 5). Differences in piscivory were minimal despite the Granby systems exhibiting higher relative abundances of small-bodied fathead minnows when compared to Cottonwood. We would not expect other stocked salmonid sport fish to influence these observations given their timing and size-at-stocking in relation to tiger trout, and because those encountered in 2017 were of equal or greater size than tiger trout (Figure 1). Mixing models indicated that medium and large cutthroat trout in Cottonwood and Granby #12 achieved higher rates of piscivory (21.9–26.0%; Table 5) on average than tiger trout—expected in Granby #12 given differences in body size (Figure 1).
Griffith and Deep Slough were notable exceptions to the above patterns. First, piscivory estimated for age-3 tiger trout in Griffith was the lowest (mean = 5.9% [95% CI = 0.8–16.4]) observed, despite being the largest fish sampled across study systems (Figure 1). Tiger trout in Griffith consumed predominately invertebrates, but a small fraction of their diet was composed of tiger salamanders (9.8% [1.3–24.2%]; Table 5). Compared to the Granby systems, the relative abundance of fathead minnows in Griffith was low, and cutthroat trout stocked as fingerlings in 2015, one year after tiger trout, were not detected during 2017 field sampling. Thus, the availability of fish prey was low at the time of sampling, and it is possible that tiger trout had already suppressed fathead minnows. In Deep Slough, large tiger trout exhibited the highest rate of piscivory (32.3% [7.7–55.0%]; Table 5), which aligned with the high relative abundance of small-bodied white suckers and patterns in stable carbon and nitrogen isotopes (Figure 2).

3.4. Predictors of Early Tiger Trout Growth and Random Forest Modeling

The RF model helped clarify the relative importance of different factors influencing the early growth of tiger trout. The most important predictor was the cohort-specific stocking density of tiger trout, an index of potential intraspecific competition at time of stocking. This predictor significantly outperformed others with respect to both percent increase in mean square error when removed from the model (%IncMSE; 38%), and in node purity (IncNodePurity; Figure 3). Other predictors that carried some importance included Compd and Compi—both indices of potential interspecific competition—and DO2, a metric designed to reflect system productivity. Though these observations do not correspond directly to causation, we expected that indicators related to competition would be among the most important predictors. Less important predictors included those describing the physical attributes of the study systems (Figure 3).
Overall, the RF model performed well, explaining nearly 60% (58.54%) of the variability in back-calculated TL-at-first-annulus across individual tiger trout, systems, and years, with a mean of squared residuals equal to 1021.5. There was a tendency for RF predictions to center around the mean of the training data. Therefore, observed and predicted values largely fell along a one-to-one line (Figure 4). Important to note that these findings are only relevant to the growth of tiger trout up to age-1. The relative importance of different predictor variables (e.g., the density of fish prey present or others) could change ontogenetically as tiger trout age.

4. Discussion

Our assessment of tiger trout growth and trophic ecology across multiple lentic subalpine systems indicated that the post-stocking success of fingerlings can be sensitive to competitive interactions early in life, particularly intraspecific interactions driven by stocking density, but are mediated by system productivity. These results may help explain the inconsistent outcomes from previous evaluations of tiger trout stocking efforts. Specifically, tiger trout stocked as fingerlings at high densities over multiple years into Black Lake (WA, USA), exhibited poor growth and minimal piscivory on small-bodied redside shiners [13]. Despite a similarly high stocking density, the opposite was observed in Wallace Lake where only a single cohort of tiger trout was released, but at much larger size to avoid growth bottlenecks early in life [12]. Juvenile tiger trout of intermediate size released into Scofield Reservoir ultimately exhibited high rates of piscivory on Utah chub, but were stocked annually at a much lower density than the other waters [11]. Collectively, our study and others indicate that fisheries managers can enhance tiger trout performance by adjusting size-at-stocking, stocking density, and stocking frequency within the constraints of perceived or measured system carrying capacity.
Density-dependent processes in salmonids are common, particularly in the context of consumption and growth (e.g., [49]). A recent meta-analysis of 199 published datasets encompassing 21 species of salmonids found that 71% of studies demonstrated reduced growth with increasing population density [43]. Intraspecific competition, particularly among young-of-year fish, was deemed a primary mechanism producing negative density-dependent growth dynamics, which appears applicable to sterile hybrids such as tiger trout based on this study. Negative density-dependent mortality was also common (detected in 23% of studies), which can be driven by intraspecific competition reducing consumption, growth and body size, thereby potentially increasing starvation mortality, increasing vulnerability to predation, or limiting energy reserves needed for surviving overwinter [16]. Because growth and mortality are interconnected, understanding tradeoffs between them is important in the context of tiger trout stocking and biocontrol. For tiger trout to suppress undesirable fishes, enough must survive and grow to piscivorous size such that resulting consumption demand exceeds the productivity of unwanted prey. This outcome would also contribute to quality recreational angling opportunities (e.g., [11]). We only examined factors affecting early growth, but future research is needed on the potential for size- and density-dependent mortality to obtain a more comprehensive understanding of tiger trout ecology and appropriate stocking strategies.
Growth measurements were derived from the surviving individuals from each cohort of tiger trout. If negative size- or density-dependent mortality—which can have reciprocal positive effects on the growth of surviving individuals [50]—was operating, then we may have only encountered the “best growing” fish from each cohort during 2017 field sampling. As a result, variation in observed body size could have been lower than otherwise expected if these processes were not occurring. Despite this possibility, we still observed a 5-fold difference in TL-at-first-annulus among individuals and a 2-fold difference among the means of cohorts. In addition, we observed a strong linear relationship between the catch rates of age-1 tiger trout and their stocking density (ranging from 14 to 207 fish/ha) the previous year—unexpected if notable density-dependent mortality was operating. However, this relationship could decouple at higher stocking densities. For example, the 2014 cohort of tiger trout in Sackett was stocked at 867 fish/ha. Yet, fish from the 2014 cohort still dominated the catch in 2017, despite experiencing two additional years of mortality when compared to the 2016 cohort. Fish from the 2016 cohort were encountered at a lower rate than expected based on their comparatively high stocking density (131 fish/ha) and corresponding catch rates of tiger trout in other systems. Collectively, these patterns suggest that density-dependent mortality within cohorts of tiger trout may have been less important in our study than the effects of previously stocked cohorts on new cohort survival. Therefore, future research considering cross-cohort interactions more explicitly could be useful.
Potential growth reductions from overstocking tiger trout may be exacerbated in systems already containing a dense population of conspecifics. In systems where multiple size- and age-classes of tiger trout were present (i.e., Cottonwood and Sackett), significant trophic niche overlap was observed between medium (predominately younger) and large (predominately older) individuals, indicating that intraspecific competition may occur among cohorts in addition to within cohorts. In both Cottonwood and Sackett, the trophic niche space occupied by medium fish was greater than and subsumed that of large fish. Reductions in trophic niche space as piscivores grow is common, but usually reflects increasing rates of piscivory (or other ontogenetic habitat/diet shifts; [51]) with size, resulting in the separation of bivariate isotopic niche regions due to trophic fractionation [21]. Because niche space declined, but remained overlapping for each size-group of tiger trout, these patterns may reflect intraspecific competition whereby larger individuals outcompeted (through interference rather than exploitation) smaller individuals for preferred prey accessible to both size-groups (resulting in reduced niche space), necessitating smaller individuals to diversify feeding habits (resulting in larger niche space). Such patterns are supported theoretically and empirically [52,53].
Potential growth reductions from overstocking tiger trout could also be amplified in systems supporting other species of naturalized or stocked salmonid sport fish that may already occupy a similar trophic niche through interspecific competition [14,54]. Compared to fathead minnows and white suckers, the trophic niche space of tiger trout overlapped most with brook trout, and patterns were consistent between Big Battlement and Sackett. Both species also exhibited similar rates of piscivory. In addition, the trophic niche space of tiger trout overlapped considerably with larger, older cutthroat trout previously stocked (spanning 2011–2015) into Granby #12, which also exhibited similar rates of piscivory. Notably, Compd—a relative index of interspecific competition with other stocked salmonid sport fish—ranked second (according to %IncMSE) to tiger trout stocking density (LXBd) in the RF model, which reinforced the importance of trophic relationships observed among tiger trout and other salmonids from stable isotope analyses. This does not, however, negate the competitive potential of the other undesirable, lower trophic level fishes, especially early in the ontogeny of piscivores when invertebrates are an important food source [55]. Similar to Compd, Compi—a field-based index of potential interspecific competition with naturalized undesirable species—also ranked relatively high in the RF model (according to both %IncMSE and IncNodePurity). However, later in life, potential exploitative competition may diminish as piscivores grow and gain access to lower trophic level fishes as prey [56], assuming concurrent ontogenetic shifts in physiology, life history requirements, or other factors (e.g., interference competition) do not limit temporal-spatial overlap [57].
The latter interactions outlined above may have occurred in Deep Slough. Although intermediate to low trophic niche overlap between tiger trout and white suckers was observed in 2017, only large, piscivorous tiger trout were encountered, so some separation in isotopic niche space was expected. More importantly, the relative abundance of white suckers (particularly large-bodied individuals) in this system far exceeded salmonids or undesirable species in the other study systems, and the first years growth exhibited by two of three tiger trout cohorts encountered (2012 and 2014) was relatively poor despite comparatively high metrics of system productivity. Nongame fishes such as suckers that feed predominately on invertebrates are capable of achieving high abundance and biomass levels, and can compete with salmonid sport fish [58]. For example, the angling yield of stocked brook trout was 4-fold higher when released into lakes containing virtually no competitors versus lakes already containing naturalized brook trout, or brook trout and white suckers, demonstrating the importance of both intra- and interspecific competition. Competitive effects were also additive—yield of stocked fish progressively declined moving from lakes with no competitors, to lakes with brook trout only, to lakes with brook trout and white suckers [59]. Further, mass removal of white suckers from similar lakes improved the growth and increased the relative abundance and biomass of brook trout (desired in this situation), signifying a compensatory response to the release from interspecific competition [60].
Large tiger trout originally stocked as fingerlings into Deep Slough exhibited the highest rates of piscivory. Thus, small-bodied white suckers ultimately became important prey items, despite the potential for ecological bottlenecks early in life. Therefore, one management strategy to consider in this situation is to stock larger, catchable-sized tiger trout (if feasible to produce and raise) to bypass potential limitations for smaller fingerlings. This strategy may enable development of a more robust population of predatory fish for biocontrol and recreational angling in the face of high abundance and biomass levels of undesirable fish. Alternatively, stocking sterile hybrids that can achieve larger body sizes than tiger trout, making them less prone to gape limitations (e.g., tiger muskellunge [northern pike Esox lucius × muskellunge E. masquinongy]), could be most effective, but this strategy may also limit ability to stock alternative salmonid sport fish [7]. Conversely, stocking fingerling tiger trout may be most cost-effective in situations where prolific small-bodied fish prey are present (e.g., fathead minnows), which can foster rapid transitions to piscivory and alleviate competitive interactions early in life [61]. Indeed, age-1 tiger trout encountered in systems containing fathead minnows (i.e., Granby systems) exhibited relatively high rates of piscivory when compared to larger, older conspecifics or previously stocked cutthroat trout in the other study systems. One exception was Griffith, but the relative abundance of fathead minnows was low at the time of sampling, and large-bodied tiger trout consumed mostly invertebrates. It is possible that tiger trout stocked in 2014 had already suppressed fathead minnows in Griffith by 2017, but we could not confirm this since standardized sampling did not occur prior to the introduction of tiger trout. Although outside the scope of this study, future research incorporating controlled before-and-after tiger trout stocking designs might better elucidate their efficacy as biocontrol across system types and undesirable species.
System productivity can mediate negative density-dependent interactions among fishes [62,63], and results from our study suggest that similar processes were occurring. Our metrics of productivity and food web structure (i.e., DO2 and Zoop) collected during 2017 field sampling ranked relatively high in the RF model based on %IncMSE. In shallow systems such as those sampled in this study, as the concentration of total phosphorus (TP; a more direct “bottom-up” indicator of primary productivity) increases, so can mean summer zooplankton biomass density [44]. However, the biomass of zooplankton is also mediated by other “top-down” food web processes such as grazing by planktivorous fishes, which can be influenced by piscivorous fishes, but the efficacy of piscivory declines in more eutrophic systems [64]. Thus, changes in zooplankton size-structure, community composition, and biomass along gradients of TP can manifest in complex ways depending on fish community structure or other system attributes [45,65]. Therefore, unlike TP alone, we felt mean summer zooplankton biomass density would more effectively integrate over multiple simultaneous food web processes that could perceivably influence the post-stocking feeding and growth of tiger trout, and thus, provide a relative index of inherent productivity available to support stocked fish after accounting for prevailing food web structure. For these reasons, we expected Zoop to rank above DO2 in the RF model, but the opposite was observed, perhaps due to limited temporal sampling, poor characterization of system conditions prior to 2017, or other factors. Future studies may benefit from greater temporal sampling of zooplankton (within each year fish are stocked) or use of algal-based indices of trophic status (e.g., [66]). In situations where water clarity is driven by organic rather than inorganic turbidity, simple indicators of primary productivity such as Secchi disk depth may be sufficient for characterizing relative differences among systems (e.g., [62]). Although water clarity in our study systems is driven largely by algal-based turbidity [42], Secc was ultimately a poor predictor of early tiger trout growth.
The metric DO2 was designed to capture variability in the coverage and structural complexity of submerged macrophytes across study systems. Summer DO dynamics in shallow vegetated systems like those found on the Grand Mesa are complex, and DO can become depleted at deeper depths during daylight if light penetration (disrupted by either rooted plants or seston) is insufficient to promote photosynthesis and favor respiration [41]. In addition, regional geology fuels plant production in systems on the Grand Mesa, as volcanic rocks provide significantly greater levels of essential plant nutrients when compared to other subalpine systems in Colorado where granitic rocks predominate [42]. This process is considered a key driver of plant growth in our study systems, including production of algal-based turbidity and resulting DO depletion at depth, which varies among lakes [42]. Therefore, we felt DO2 was a suitable indicator of vegetative habitat complexity and primary productivity. In addition, because macroinvertebrate densities are often greater in more vegetated habitats, we regarded DO2 as a relative indicator of secondary productivity available for fueling juvenile fish (e.g., [67]). In some circumstances, dense vegetation can reduce the foraging efficiency of fish [68], or low DO can inhibit fish growth due to metabolic stress [69], but DO2 ranked high in the RF model and exhibited a positive correlation with the TL-at-first-annulus of individual tiger trout, indicating that it likely effectively characterized relative productivity among study systems.

5. Conclusions

Stocking sterile piscivores can be an effective strategy for meeting multiple fisheries management objectives (i.e., biocontrol and recreational angling) in situations where natural reproduction must be controlled. However, stocking improperly could limit the ultimate success of such efforts, requiring additional, often limited, hatchery resources. Evaluating the post-stocking performance of sterile piscivores across a range of physical and biological conditions helps elucidate important ecological processes and best stocking practices. Here, we examined factors influencing the early growth of fingerling tiger trout stocked into a suite of subalpine lakes and reservoirs. Given inherent linkages among growth early in life, survival, and piscivory, stocking regimes tailored toward enhancing post-stocking growth, or encouraging rapid transitions to piscivory, could bolster success. Collectively, trophic relationships from stable isotope analyses combined with predictive modeling highlighted the importance of intraspecific interactions. The early growth of juvenile tiger trout was negatively associated with stocking density, but cross-cohort interactions may have also been important. In general, tiger trout stocked at densities < 100 fingerlings/ha grew the best over their first year of life, but responses were mediated by system productivity and other factors according to the RF model, so stocking densities around 200 fingerlings/ha also performed relatively well under some circumstances. Specifically, we found evidence that interspecific interactions with other stocked salmonid sport fish and/or small- or large-bodied undesirable fishes influenced growth, but to a lesser degree than intraspecific interactions. Therefore, it may be prudent to avoid stocking other salmonid sport fish in the same years as tiger trout. Further, modifying size-at-stocking (or species of sterile predator) depending on the presence of prolific small- (e.g., minnows) versus large-bodied (e.g., suckers) undesirable fish that act as both prey and potential competitors of tiger trout should be considered by fisheries managers. Lastly, future research would benefit from more explicit characterization of cross-cohort interactions, increased temporal sampling of key system attributes, and longer-term field investigations that track the before and after responses of undesirable fish communities to tiger trout or other sterile predator stocking efforts.

Author Contributions

A.G.H.: Conceptualization, Formal Analysis, Investigation, Project Administration, Resources, Writing—original draft, Writing—review and editing; E.T.C.: Conceptualization, Data Curation, Formal Analysis, Writing—original draft, Writing—review and editing; M.M.M.: Data Curation, Formal Analysis, Writing—review and editing; M.W.M.: Data Curation, Formal Analysis, Writing—review and editing; E.I.G.: Conceptualization, Data Curation; Writing—review and editing; J.M.L.: Conceptualization, Data Curation, Formal Analysis, Writing—original draft, Writing—review and editing. All authors have read and agreed to the published version of the manuscript.

Funding

This research was funded by Colorado Parks and Wildlife.

Institutional Review Board Statement

No organisms involved in this study were subject to regulations requiring oversight by an institutional animal care and use committee. All fish sampling and collections were covered by the State of Colorado Scientific Collection License number DOW087. No state or federally endangered species were involved in this study. All study locations were on public land. No specific permissions were required for research activities at study locations, but all managing entities were consulted during the study.

Informed Consent Statement

Not applicable.

Data Availability Statement

Data will be provided by the corresponding author upon reasonable request.

Acknowledgments

We thank B. Felt, L. Hargis, D. Kowalski, C. McComas, and J. Thompson for field and laboratory assistance during the project. We also thank C. Farrell for assistance in creating Figure 2 and the Cornell Stable Isotope Laboratory for sample analysis.

Conflicts of Interest

The authors declare no conflict of interest.

References

  1. Pipalova, I.A. Review of grass carp use for aquatic weed control and its impact on water bodies. J. Aquat. Plant Manag. 2006, 44, 1–12. [Google Scholar]
  2. Bickerton, M.W.; Corleto, J.; Verna, T.N.; Williges, E.; Matadha, D. Comparative efficacy of Pimephales promelas, Fundulus diaphanous, and Gambusia affinis and influence of prey density for biological control of Culex pipiens molestus larvae. J. Am. Mosq. Control. Assoc. 2018, 34, 99–106. [Google Scholar] [CrossRef] [PubMed] [Green Version]
  3. Koenig, M.K.; Meyer, K.A.; Kozfkay, J.R.; Dupont, J.M.; Schriever, E.B. Evaluating the ability of tiger muskellunge to eradicate brook trout in Idaho alpine lakes. N. Am. J. Fish. Manag. 2015, 35, 659–670. [Google Scholar] [CrossRef]
  4. Kerr, S.J.; Lasenby, T.A. Esocid Stocking: An Annotated Bibliography and Literature Review; Ontario Ministry of Natural Resources Fish and Wildlife Branch: Peterborough, ON, Canada, 2001.
  5. Irwin, B.J.; Devries, D.R.; Wright, R.A. Evaluating the potential for predatory control of gizzard shad by largemouth bass in small impoundments: A bioenergetics approach. Trans. Am. Fish. Soc. 2003, 132, 913–924. [Google Scholar] [CrossRef]
  6. Bunnell, D.B.; Madenjian, C.P.; Claramunt, R.M. Long-term changes of the Lake Michigan fish community following the reduction of exotic Alewife (Alosa pseudoharengus). Can. J. Fish. Aquat. Sci. 2006, 63, 2434–2446. [Google Scholar] [CrossRef]
  7. Lepak, J.M.; Cathcart, C.N.; Stacy, W.L. Tiger muskellunge predation on stocked salmonids intended for recreational fisheries. Lake Reserv. Manag. 2014, 30, 250–257. [Google Scholar] [CrossRef]
  8. Kozfkay, J.R.; Dillon, J.C.; Schill, D.J. Routine use of sterile fish in salmonid sport fisheries: Are we there yet? Fisheries 2006, 31, 392–401. [Google Scholar] [CrossRef]
  9. Farrell, C.J.; Johnson, B.M.; Hansen, A.G.; Myrick, C.A. Induced triploidy reduces mercury bioaccumulation in a piscivorous fish. Can. J. Fish. Aquat. Sci. 2022, 79, 200–212. [Google Scholar] [CrossRef]
  10. Martinez, P.J.; Bigelow, P.E.; Deleray, M.A.; Fredenberg, W.A.; Hansen, B.S.; Horner, N.J.; Lehr, S.K.; Schneidervin, R.W.; Tolentino, S.A.; Viola, A.E. Western lake trout woes. Fisheries 2009, 34, 424–442. [Google Scholar] [CrossRef]
  11. Winters, L.K.; Budy, P.; Thiede, G.P. Earning their stripes: The potential of tiger trout and other salmonids as biological controls of forage fishes in a western reservoir. N. Am. J. Fish. Manag. 2017, 37, 380–394. [Google Scholar] [CrossRef]
  12. Messner, J.; Schoby, G.; Belnap, M.; Amick, M.; Loffredo, J. Fisheries Management Annual Report, Salmon Region, IDFG 16–115; Idaho Department of Fish and Game: Salmon, ID, USA, 2017.
  13. Miller, A.L. Diet, Growth, and Age Analysis of Tiger Trout from Ten Lakes in Eastern Washington. Master’s Thesis, Eastern Washington University, Cheney, WA, USA, 2010. [Google Scholar]
  14. Winters, L.K.; Budy, P. Exploring crowded trophic niche space in a novel reservoir fish assemblage: How many is too many? Trans. Am. Fish. Soc. 2015, 144, 1117–1128. [Google Scholar] [CrossRef]
  15. Sogard, S.M. Size-selective mortality in the juvenile stage of teleost fishes: A review. Bull. Mar. Sci. 1997, 60, 1129–1157. [Google Scholar]
  16. Stige, L.C.; Rogers, L.A.; Neuheimer, A.B.; Hunsicker, M.E.; Yaragina, N.A.; Ottersen, G.; Ciannelli, L.; Langangen, Ø.; Durant, J.M. Density- and size-dependent mortality in fish early life stages. Fish Fish. 2019, 20, 962–976. [Google Scholar] [CrossRef] [Green Version]
  17. Olson, M.H. Ontogenetic niche shifts in largemouth bass: Variability and consequences for first-year growth. Ecology 1996, 77, 179–190. [Google Scholar] [CrossRef]
  18. Hanson, J.M.; Leggett, W.C. Experimental and field evidence for inter- and intraspecific competition in two freshwater fishes. Can. J. Fish. Aquat. Sci. 1985, 42, 280–286. [Google Scholar] [CrossRef]
  19. Nunn, A.D.; Vickers, L.H.; Mazik, K.; Bolland, J.D.; Peirson, G.; Axford, S.N.; Henshaw, A.; Cowx, I.G. Dynamic competition and resource partitioning during the early life of two widespread, abundant and ecologically similar fishes. Hydrobiologia 2020, 847, 2211–2224. [Google Scholar] [CrossRef]
  20. Kennedy, G.J.A.; Strange, C.D. The effects of intra- and inter-specific competition on the survival and growth of stocked juvenile Atlantic salmon, Salmo salar L., and resident trout, Salmo trutta L., in an upland stream. J. Fish. Biol. 1986, 28, 479–489. [Google Scholar] [CrossRef]
  21. Hansen, A.G.; Gardner, J.A.; Connelly, K.A.; Polacek, M.; Beauchamp, D.A. Resource use among top-level piscivores in a temperate reservoir: Implications for a threatened coldwater Specialist. Ecol. Freshw. Fish 2022, 31, 469–491. [Google Scholar] [CrossRef]
  22. Cutler, D.R.; Edwards, T.C., Jr.; Beard, K.J.; Cutler, A.; Hess, K.T.; Gibson, J.; Lawler, J.J. Random forests for classification in ecology. Ecology 2007, 88, 2783–2792. [Google Scholar] [CrossRef]
  23. California Department of Fish and Wildlife. High Mountain Lakes Project. Available online: https://www.wildlife.ca.gov/Regions/6/High-Mountain-Lakes-Project (accessed on 31 October 2022).
  24. Hansen, A.G.; Gardner, J.R.; Beauchamp, D.A.; Paradis, R.; Quinn, T.P. Recovery of sockeye salmon in the Elwha River, Washington, after dam removal: Dependence of smolt production on the resumption of anadromy by landlocked kokanee. Trans. Am. Fish. Soc. 2016, 145, 1303–1317. [Google Scholar] [CrossRef]
  25. Watkins, J.; Rudstam, L.; Holeck, K. Length-Weight Regressions for Zooplankton Biomass Calculations—A Review and a Suggestion for Standard Equations; Cornell Biological Field Station, Cornell University: Ithaca, NY, USA, 2011. [Google Scholar]
  26. Beauchamp, D.A.; Parrish, D.L.; Whaley, R.A. Coldwater fish in large standing waters. In Standard Methods for Sampling North American Freshwater Fishes; Bonar, S.A., Hubert, W.A., Willis, D.W., Eds.; American Fisheries Society: Bethesda, MD, USA, 2009; pp. 97–118. [Google Scholar]
  27. Sanderson, B.L.; Tran, C.D.; Coe, H.J.; Pelekis, V.; Steel, E.A.; Reichert, W.L. Nonlethal sampling of fish caudal fins yields valuable stable isotope data for threatened and endangered fishes. Trans. Am. Fish. Soc. 2009, 138, 1166–1177. [Google Scholar] [CrossRef]
  28. Post, D.M.; Layman, C.A.; Arrington, D.A.; Takimoto, G.; Quattrochi, J.; Montana, C.G. Getting to the fat of the matter: Models, methods, and assumptions for dealing with lipids in stable isotope analyses. Oecologia 2007, 152, 179–189. [Google Scholar] [CrossRef] [PubMed]
  29. Quist, M.C.; Pegg, M.A.; DeVries, D.R. Age and growth. In Fisheries Techniques, 3rd ed.; Zale, A.V., Parrish, D.L., Sutton, T.M., Eds.; American Fisheries Society: Bethesda, MD, USA, 2013; pp. 677–721. [Google Scholar]
  30. Hansen, A.G.; Gardner, J.R.; Connelly, K.A.; Polacek, M.; Beauchamp, D.A. Trophic compression of lake food webs under hydrologic disturbance. Ecosphere 2018, 9, e02304. [Google Scholar] [CrossRef] [Green Version]
  31. Herwig, B.R.; Zimmer, K.D.; Staples, D.F. Using stable isotope data to quantify niche overlap and diets of muskellunge, northern pike and walleye in a deep Minnesota lake. Ecol. Freshw. Fish 2022, 31, 60–71. [Google Scholar] [CrossRef]
  32. Lysy, M.; Stasko, A.D.; Swanson, H.K. nicheROVER: Niche Region and Niche Overlap Metrics for Multidimensional Ecological Niches. Version 1.1.0. Available online: https://CRAN.R-project.org/package=nicheROVER (accessed on 24 June 2022).
  33. R Core Team. R: A Language and Environment for Statistical Computing. Available online: https://www.R-project.org/ (accessed on 24 June 2022).
  34. Swanson, H.K.; Lysy, M.; Power, M.; Stasko, A.D.; Johnson, J.D.; Reist, J.D. A new probabilistic method for quantifying n-dimensional ecological niches and niche overlap. Ecology 2015, 96, 318–324. [Google Scholar] [CrossRef]
  35. Parnell, A.C. simmr: A Stable Isotope Mixing Model. Version 0.4.5. Available online: https://CRAN.R-project.org/package=simmr (accessed on 24 June 2022).
  36. Post, D.M. Using stable isotopes to estimate trophic position: Models, methods, and assumptions. Ecology 2002, 83, 703–718. [Google Scholar] [CrossRef]
  37. Hansen, A.G.; Beauchamp, D.A.; Baldwin, C.M. Environmental constraints on piscivory: Insights from linking ultrasonic telemetry to a visual foraging model for cutthroat trout. Trans. Am. Fish. Soc. 2013, 142, 300–316. [Google Scholar] [CrossRef]
  38. Murdoch, A.; Power, M. The effect of lake morphometry on thermal habitat use and growth in Arctic charr populations: Implications for understanding climate-change impacts. Ecol. Freshw. Fish 2013, 22, 453–466. [Google Scholar] [CrossRef]
  39. Estlander, S.; Nurminen, L.; Mrkvicka, T.; Olin, M.; Rask, M.; Lehtonen, H. Sex-dependent responses of perch to changes in water clarity and temperature. Ecol. Freshw. Fish 2015, 24, 544–552. [Google Scholar] [CrossRef]
  40. Church, K.D.W.; Grant, J.W.A. Does increasing habitat complexity favour particular personality types of juvenile Atlantic salmon, Salmo salar? Anim. Behav. 2018, 135, 165–176. [Google Scholar] [CrossRef]
  41. Andersen, M.R.; Kragh, T.; Sand-Jensen, K. Extreme diel dissolved oxygen and carbon cycles in shallow vegetated lakes. Proc. R. Soc. B. 2017, 284, 20171427. [Google Scholar] [CrossRef] [PubMed] [Green Version]
  42. Pennak, R.W. A Limnological Reconnaissance of Grand Mesa, Colorado; University of Colorado: Boulder, CO, USA, 1950. [Google Scholar]
  43. Grossman, G.D.; Simon, T.N. Density-dependent effects on salmonid populations: A review. Ecol. Freshw. Fish 2020, 29, 400–418. [Google Scholar] [CrossRef]
  44. Jeppesen, E.; Jensen, J.P.; Sondergaard, M.; Lauridsen, T.L.; Landkildehus, F. Trophic structure, species richness and biodiversity in Danish lakes: Changes along a phosphorus gradient. Freshw. Biol. 2000, 45, 201–218. [Google Scholar] [CrossRef]
  45. Jeppesen, E.; Noges, P.; Davidson, T.A.; Haberman, J.; Noges, T.; Blank, K.; Lauridsen, T.L.; Sondergaard, M.; Sayer, C.; Laugaste, R.; et al. Zooplankton as indicators in lakes: A scientific-based plea for including zooplankton in the ecological quality assessment of lakes according to the European Water Framework Directive (WFD). Hydrobiologia 2011, 676, 279. [Google Scholar] [CrossRef]
  46. Sorel, M.H.; Hansen, A.G.; Connelly, K.A.; Beauchamp, D.A. Trophic feasibility of reintroducing anadromous salmonids in three reservoirs on the North Fork Lewis River, Washington: Prey supply and consumption demand of resident fishes. Trans. Am. Fish. Soc. 2016, 145, 1331–1347. [Google Scholar] [CrossRef]
  47. Liaw, A.; Wiener, M. Classification and regression by random forest. R News 2002, 2, 18–22. [Google Scholar]
  48. Gini, C. Variabilità e Mutabilità; Tipografia di Paolo Cuppini: Bologna, Italy, 1912. [Google Scholar]
  49. Amundsen, P.; Knudsen, R.; Klemetsen, A. Intraspecific competition and density dependence of food consumption and growth in Arctic charr. J. Anim. Ecol. 2007, 767, 149–158. [Google Scholar] [CrossRef]
  50. Matte, J.-M.; Fraser, D.J.; Grant, J.W.A. Population variation in density-dependent growth, mortality and their trade-off in a stream fish. J. Anim. Ecol. 2020, 89, 541–552. [Google Scholar] [CrossRef]
  51. McIntyre, J.K.; Beauchamp, D.A.; Mazur, M.M.; Overman, N.C. Ontogenetic trophic interactions and benthopelagic coupling in Lake Washington: Evidence from stable isotopes and diet analysis. Trans. Am. Fish. Soc. 2006, 135, 1312–1328. [Google Scholar] [CrossRef]
  52. Ward, A.J.; Webster, M.M.; Hart, P.J.B. Intraspecific food competition in fishes. Fish Fish. 2006, 7, 231–261. [Google Scholar] [CrossRef]
  53. Prati, S.; Henriksen, E.H.; Smalås, A.; Knudsen, R.; Klemetsen, A.; Sánchez-Hernández, J.; Amundsen, P. The effect of inter- and intraspecific competition on individual and population niche widths: A four-decade study on two interacting salmonids. Oikos 2021, 130, 1679–1691. [Google Scholar] [CrossRef]
  54. Raborn, S.W.; Miranda, L.E.; Driscoll, M.T. Diet overlap and consumption patterns suggest seasonal flux in the likelihood for exploitative competition among piscivorous fishes. Ecol. Freshw. Fish 2004, 13, 276–284. [Google Scholar] [CrossRef]
  55. Sanchez-Hernandez, J.; Nunn, A.D.; Adams, C.E.; Amundsen, P.-A. Causes and consequences of ontogenetic dietary shifts: A global synthesis using fish models. Biol. Rev. 2019, 94, 539–554. [Google Scholar] [CrossRef] [PubMed]
  56. Marrin, D.L.; Erman, D.C. Evidence against competition between trout and nongame fishes in Stampede Reservoir, California. N. Am. J. Fish. Manag. 1982, 2, 262–269. [Google Scholar] [CrossRef]
  57. Tremblay, S.; Magnan, P. Interactions between two distantly related species, brook trout (Salvelinus fontinalis) and white sucker (Catostomus commersoni). Can. J. Fish. Aquat. Sci. 1991, 48, 857–867. [Google Scholar] [CrossRef]
  58. Teuscher, D.; Luecke, C. Competition between kokanees and Utah chub in Flaming Gorge Reservoir, Utah–Wyoming. Trans. Am. Fish. Soc. 1996, 125, 505–511. [Google Scholar] [CrossRef]
  59. Lachance, S.; Magnan, P. Performance of domestic, hybrid, and wild strains of brook trout, Salvelinus fontinalis, after stocking: The impact of intra- and interspecific competition. Can. J. Fish. Aquat. Sci. 1990, 47, 2278–2284. [Google Scholar] [CrossRef]
  60. Brodeur, P.; Magnan, P.; Legault, M. Response of fish communities to different levels of white sucker (Catostomus commersoni) biomanipulation in five temperate lakes. Can. J. Fish. Aquat. Sci. 2001, 58, 1998–2010. [Google Scholar] [CrossRef]
  61. Sanchez-Hernandez, J.; Eloranta, A.P.; Finstad, A.G.; Amundsen, P.-A. Community structure affects trophic ontogeny in a predatory fish. Ecol. Evol. 2017, 7, 358–367. [Google Scholar] [CrossRef]
  62. Rieman, B.E.; Myers, D.L. Influence of fish density and relative productivity on growth of kokanee in ten oligotrophic lakes and reservoirs in Idaho. Trans. Am. Fish. Soc. 1992, 121, 178–191. [Google Scholar] [CrossRef]
  63. Arranz, I.; Mehner, T.; Benejam, L.; Argillier, C.; Holmgren, K.; Jeppesen, E.; Lauridsen, T.L.; Volta, P.; Winfield, I.J.; Brucet, S. Density-dependent effects as key drivers of intraspecific size structure of six abundant fish species in lakes across Europe. Can. J. Fish. Aquat. Sci. 2015, 73, 519–534. [Google Scholar] [CrossRef] [Green Version]
  64. Persson, L.; Diehl, S.; Johansson, L.; Andersson, G.; Harmin, S.F. Shifts in fish communities along the productivity gradient of temperate lakes—Patterns and the importance of size-structured interactions. J. Fish. Biol. 1991, 38, 281–293. [Google Scholar] [CrossRef]
  65. Carpenter, S.R.; Cole, J.J.; Hodgson, J.R.; Kitchell, J.F.; Pace, M.L.; Bade, D.; Cottingham, K.L.; Essington, T.E.; Houser, J.N.; Schindler, D.E. Trophic cascades, nutrients, and lake productivity: Whole-lake experiments. Ecol. Monogr. 2001, 71, 163–186. [Google Scholar] [CrossRef]
  66. Carlson, R.E. A trophic state index for lakes. Limnol. Oceanogr. 1977, 22, 361–369. [Google Scholar] [CrossRef] [Green Version]
  67. Richardson, W.B.; Zigler, S.J.; Dewey, M.R. Bioenergetic relations in submerged aquatic vegetation: An experimental test of prey use by juvenile bluegills. Ecol. Freshw. Fish 1998, 7, 1–12. [Google Scholar] [CrossRef]
  68. Savino, J.F.; Marschall, E.A.; Stein, R.A. Bluegill growth as modified by plant density: An exploration of underlying mechanisms. Oecologia 1992, 89, 153–160. [Google Scholar] [CrossRef] [Green Version]
  69. Waldrop, T.; Summerfelt, S.; Mazik, P.; Kenney, P.B.; Good, C. The effects of swimming exercise and dissolved oxygen on growth performance, fin condition and survival of rainbow trout Oncorhynchus mykiss. Aquac. Res. 2020, 51, 2582–2589. [Google Scholar] [CrossRef]
Figure 1. Length-frequency histograms of all fishes including tiger trout, different species of undesirable fish, and cutthroat trout (columns) captured in each study system (rows) during 2017 field sampling. Sample sizes are noted on each panel. The species abbreviation BKT = brook trout, FHM = fathead minnow, and WHS = white sucker. Two large-sized (≥250 mm TL) rainbow trout were also sampled in Cottonwood Lake #4, but not included in the histogram.
Fishes 07 00342 g001
Figure 2. Bi−plot of δ13C and δ15N values (points) for each individual of each species and size-group of fish sampled from each study system. Lines represent corresponding 95% prediction ellipses used to compute trophic niche space (‰2; values on each panel) and trophic niche overlap among species and size-groups within the same system. In some instances, size-groups of fish needed to be combined to meet minimum sample size requirements for computing trophic niche overlap. Medium (M; 150−249 mm TL; n = 10) and large (L; ≥250 mm TL; n = 1) tiger trout (LXB) in Big Battlement Lake were combined, but coded as medium-sized fish as these were the majority. Medium (n = 2) and large (n = 2) cutthroat trout (CCT) were combined in Cottonwood Lake #4, but since medium fish were close in size to large fish, they were all coded as large. Medium (n = 2) and large (n = 12) tiger trout in Deep Slough Reservoir were combined and coded as large-sized fish as these were the majority. Medium (n = 3) and large (n = 2) tiger trout in Granby Reservoir #2 were combined, but coded as medium-sized fish as these were the majority. Medium (n = 2) and large (n = 1) tiger trout in Granby Reservoir #12 were combined, but coded as medium-sized fish as these were the majority. Lastly, small (n = 1) and medium (n = 6) tiger trout were combined in Sackett Reservoir, but coded as medium-sized fish as these were the majority.
Fishes 07 00342 g002
Figure 3. Importance metrics for different variables considered as potential predictors of early tiger trout growth in the Random Forest Model. Predictor variables are ranked for relative importance (top-to-bottom) according to their percent increase in mean square error if removed from the model (%IncMSE; left panel) and in node purity (IncNodePurity; right panel). Predictors included surface area (Area; ha), maximum depth (Depth; m), elevation (Elev; m), dissolved oxygen (DO2; % of water column with DO ≤2.0 mg/L), an integrative index of food web structure and early food supply (Zoop; mean biomass density of zooplankton [g dry weight/m2]), cohort-specific tiger trout stocking density (LXBd; number/ha), an index of interspecific competition (Compd: stocking density [number/ha] of other salmonid sport fish in the same year as tiger trout), a field-based index of interspecific competition (Compi: catch rates [number fish/hour] of non-tiger trout in gill nets during 2017), a legacy index of stocking large salmonid sport fish (RBT; presence or absence of stocking ≥ 225 mm fish in recent history), and an index of prey fish availability (Preyi; number fish/hour of non-tiger trout captured additively in micro-mesh gill nets and miniature trap nets during 2017).
Fishes 07 00342 g003
Figure 4. Predicted (from Random Forest model; RF) versus observed back-calculated TLs-at-first-annulus for individuals from each cohort (years) of tiger trout sampled from each study system.
Fishes 07 00342 g004
Table 1. Characteristics of the study systems including surface area (ha), maximum depth (m), mean summer Secchi disk depth (SD; m), elevation (Elev.; m), percent (%) of water column with dissolved oxygen (DO) levels ≤2 mg/L, and the summer biomass density (g dry weight/m2) of zooplankton (mean ± SD)—an indicator of system productivity (number of individual zooplankton tows listed in parentheses).
SystemSurface Area (ha)Max. Depth (m)Mean SD (m)Elev. (m)%DO ≤ 2 (mg/L)Zooplankton Biomass Density (g Dry Weight/m2)
Big Battlement Lake16.613.74.88307214%1.53 ± 2.12 (3)
Cottonwood Lake #415.310.73.46311040%0.47 ± 0.10 (3)
Deep Slough Reservoir18.24.61.25305320%1.47 ± 2.42 (3)
Granby Reservoir #25.46.72.88306629%0.07 ± 0.09 (3)
Granby Reservoir #1217.17.02.7130485%0.50 ± 0.61 (3)
Griffith Lake25.39.43.63306361%0.10 ± 0.02 (3)
Sackett Reservoir2.37.33.7531880%0.03 ± 0.03 (3)
Table 2. Stocking history for each study system prior to 2017 field sampling. Values represent the annual stocking density (number/ha) of different salmonid sport fish. Values inside parentheses represent the total number of fish stocked (listed first) and the mean total length (mm) of fish stocked as measured by the hatchery (e.g., 476 @ 87.4 indicates 476 individuals were stocked with a mean length of 87.4 mm). Although not listed, Cottonwood Lake #4 also received golden trout (O. aguabonita) at ~11 fish/ha (161 @ 202.9 mm) in 2013, and Deep Slough Reservoir received brook trout at 74 fish/ha (1350 @ 77.0 mm) in 2011.
Year StockedTiger TroutCutthroat TroutRainbow Trout
Big Battlement Lake
201629 (476 @ 87.4)
Cottonwood Lake #4
2010 393 (6000 @ 245.6)
2011 98(1500 @ 256.8)
2012 158 (2416 @ 241.8)
2013 721 (11000 @ 139.2)361 (5499 @ 249.2)
2014138 (2100 @ 108.2)656 (10000 @ 127.5)197 (3000 @ 261.1)
2015 196 (2985 @ 250.7)
2016207 (3153 @ 93.7) 194 (2960 @ 257.3)
Deep Slough Reservoir
201155 (1000 @ 89.2)
2012132 (2400 @ 73.2)
2014164 (3000 @ 95.5)
201683 (1505 @ 87.4)
Granby Reservoir #2
2011 65 (350 @ 23.6)
2013 279 (1500 @ 34.5)
2015 279 (1500 @ 34.5)
201675 (404 @ 87.4)
Granby Reservoir #12
2011 292 (5000 @ 23.6)
2013 292 (5000 @ 23.6)
2015 292 (5000 @ 23.6)
201614 (238 @ 87.4)
Griffith Lake
201439 (1000 @ 95.5)
2015 39 (1000 @ 95.5)
Sackett Reservoir
2011650 (1500 @ 109.0) 633 (1455 @ 202.9)
2013 434 (1000 @ 255.5)
2014867 (2000 @ 95.5)
2016131 (303 @ 87.4)
Table 3. Catch rates (means and SDs; number fish/hour; index of relative abundance) of tiger trout, cutthroat trout, and other undesirable fishes (brook trout, fathead minnow, and white sucker) captured in different sampling gears in each study system. Values in parentheses represent the total number of fish encountered in each gear.
SpeciesExperimental Gill NetsMicro-Mesh Gill NetsMiniature Trap Nets
MeanSDMeanSDMeanSD
Big Battlement Lake 1
Tiger trout0.36 (2)0.550.98 (5)1.180.000.00
Brook trout9.29 (49)5.295.00 (25)3.470.000.00
Cottonwood Lake #4
Tiger trout6.03 (30)4.621.32 (12)1.160.000.00
Cutthroat trout0.62 (3)0.420.11 (1)0.270.000.00
Fathead minnow0.000.000.17 (1)0.413.68 (34)3.92
Deep Slough Reservoir
Tiger trout3.42 (14)2.76Not fished 20.000.00
White sucker44.25 (183)22.502.75 (22)3.89
Granby Reservoir #2
Tiger trout0.45 (2)1.110.75 (4)1.85Not fished 2
Cutthroat trout0.000.000.19 (1)0.46
Fathead minnow0.000.0013.69 (78)19.92
Granby Reservoir #12
Tiger trout0.22 (3)0.470.000.000.000.00
Cutthroat trout1.88 (19)2.501.00 (3)1.220.000.00
Fathead minnow0.000.0091.03 (435)101.977.92 (44)6.08
Griffith Lake
Tiger trout2.21 (11)1.970.29 (2)0.720.000.00
Fathead minnow0.000.001.98 (10)3.30.23 (2)0.00
Sackett Reservoir
Tiger trout3.52 (20)2.804.14 (26)0.300.000.00
Brook trout0.98 (6)1.131.47 (9)1.300.000.00
1 Tiger trout samples collected from Big Battlement Lake in this study (n = 7) were supplemented by samples (n = 4) encountered by other CPW personnel conducting a separate study on adjacent Little Battlement Lake (same sampling day). Big and Little Battement lakes are connected by a 90 m section of stream, and fish encountered in Little Battlement Lake were from the same cohort of fish stocked into Big Battlement Lake the year prior. Given close proximity, we assumed fish that moved to Little Battlement Lake experienced similar conditions as in Big Battlement Lake. 2 If a gear (only pertaining to micro-mesh gill nets and miniature trap nets and characterization of ‘Preyi’ for the RF analysis) was not deployed, the catch rate (number fish/hour) from the gear type that was deployed was used to represent the catch rate for the gear that was not deployed (only two instances). This substitution was made because catches of prey-sized fishes were sometimes higher in the micro-mesh gill nets than miniature trap nets and vice versa.
Table 4. Bayesian estimates of mean percent overlap in trophic niche space between different size-groups of tiger trout and between tiger trout and other species of undesirable fish. Values in parentheses represent 95% credible intervals. For the matrix, values represent the probability (expressed as a %) of an individual tiger trout of a given size listed in each row falling within the trophic niche space of each fish species and size-group listed in column headings (italicized) adjacent to each study system name. Reciprocal probabilities are not shown. The acronyms BKT, FHM, WHS, and LXB stand for brook trout, fathead minnow, white sucker, and tiger trout, respectively. The letter “L” stands for large fish (≥250 mm TL), “M” for medium fish (150−249 mm TL), and “S” for small fish (<150 mm TL). In some cases, size-groups were combined for analysis to meet minimum sample size requirements.
Lake and Tiger Trout Size-GroupSpecies and Size-Group of Potential Competitor
Big Battlement Lake:BKT (S)BKT (M)BKT (L)
Medium + Large45 (21–78)88 (61–100)83 (42–100)
Cottonwood Lake #4:FHM (S)CCT (M+L)LXB (M)LXB (L)
Medium34 (4–81)30 (11–58) 66 (35–95)
Large59 (13–98)33 (9–69)84 (46–100)
Deep Slough Reservoir:WHS (S)WHS (M)WHS (L)
Medium + Large4 (0–29)43 (2–95)29 (1–89)
Granby Reservoir #2:FHM (S)
Medium + Large2 (0–16)
Granby Reservoir #12:FHM (S)CCT (M)CCT (L)
Medium31 (1–81)71 (27–100)68 (9–100)
Griffith Lake:FHM (S)
Large0.2 (0–2)
Sackett Reservoir:BKT (S)BKT (M)LXB (M)LXB (L)
Small + Medium69 (37–95)79 (46–99) 41 (17–72)
Large78 (40–100)94 (71–100)91 (61–100)
Table 5. Diet compositions of different size-groups of trout encountered during 2017 field sampling. Estimates (mean % and corresponding 95% credible interval in parentheses) for different prey sources were derived using Bayesian stable isotope mixing models. The letter “S” stands for small fish (<150 mm TL), “M” for medium (150–249 mm TL), and “L” for large (≥250 mm TL).
Species and Size-GroupSample SizeFishAquatic InvertebratesTerrestrial InvertebratesZooplanktonTiger Salamander
Big Battlement Lake
Brook trout (S)7 38.0 (9.4–63.5)35.2 (5.5–77.9)26.8 (5.0–52.2)
Brook trout (M)811.0 (1.8–27.0)40.1 (16.6–62.5)22.7 (3.1–55.5)26.3 (4.9–51.5)
Brook trout (L)717.1 (2.4–39.9)30.0 (7.2–51.4)33.6 (4.9–73.7)19.3 (3.2–42.2)
Tiger trout (M)1012.6 (2.0–30.7)45.3 (30.0–61.0)30.1 (5.2–56.6)11.9 (2.1–27.8)
Tiger trout (L)119.5 (2.4–56.4)41.1 (11.0–74.9)24.1 (2.4–66.4)15.3 (2.1–42.7)
Cottonwood Lake #4
Cutthroat trout (M)223.3 (2.7–60.3)25.7 (2.7–68.5)17.2 (2.3–42.7)33.9 (3.4–75.2)
Cutthroat trout (L)226.0 (3.0–63.5)25.7 (2.8–69.3)15.5 (2.2–40.0)32.8 (3.6–72.5)
Tiger trout (M)716.3 (2.5–36.0)20.7 (2.8–51.6)8.9 (1.9–19.6)54.1 (21.3–78.1)
Tiger trout (L)816.1 (3.4–31.9)20.2 (3.2–47.5)13.3 (4.6–23.2)50.5 (26.8–69.4)
Rainbow trout (L)223.0 (2.3–61.4)25.9 (2.4–70.4)16.5 (2.1–44.6)34.6 (3.9–79.3)
Deep Slough Reservoir
Tiger trout (M)224.6 (2.5–67.3)28.2 (2.9–69.8)16.7 (2.1–47.2)30.5 (3.1–73.9)
Tiger trout (L)1232.3 (2.3–61.4)35.4 (16.3–52.9)10.6 (1.9–23.9)21.7 (5.4–43.4)
Granby Reservoir #2
Tiger trout (M)317.5 (1.9–51.5)20.7 (2.1–64.7)25.2 (2.4–61.5)13.6 (1.8–37.8)23.0 (2.0–65.3)
Tiger trout (L)218.1 (1.6–5.4)22.4 (2.1–62.8)22.9 (2.2–63.9)15.1 (1.9–45.8)21.6 (2.1–63.5)
Granby Reservoir #12
Cutthroat trout (M)221.9 (2.4–62.6)25.8 (2.9–68.9)30.1 (2.9–76.4)22.2 (2.6–60.9)
Cutthroat trout (L)1025.6 (6.9–44.5)25.8 (3.5–54.1)33.8 (4.3–69.7)14.8 (2.6–32.7)
Tiger trout (M)222.0 (2.5–62.0)24.8 (3.0–65.0)31.8 (3.2–75.0)21.3 (2.6–55.5)
Tiger trout (L)115.1 (1.9–41.0)36.9 (4.3–75.8)33.3 (3.2–79.4)14.7 (1.9–42.2)
Griffith Lake
Tiger trout (L)135.9 (0.8–16.4)17.2 (1.5–43.9)62.9 (31.7–88.6)4.3 (0.7–12.0)9.8 (1.3–24.2)
Sackett Reservoir
Brook trout (S)6 66.3 (50.4–80.7)20.7 (5.0–40.0)13.0 (2.6–26.8)
Brook trout (M)914.6 (2.3–32.3)58.3 (47.1–69.6)14.9 (2.3–32.8)12.2 (2.7–23.9)
Tiger trout (S)1 59.6 (16.4–92.0)31.8 (2.9–74.6)8.6 (1.5–20.6)
Tiger trout (M)610.6 (1.6–26.4)68.4 (50.6–82.6)10.5 (1.7–27.1)10.5 (1.8–23.7)
Tiger trout (L)818.0 (2.9–37.1)55.8 (45.0–66.5)17.5 (2.9–37.6)8.7 (1.7–18.9)
Publisher’s Note: MDPI stays neutral with regard to jurisdictional claims in published maps and institutional affiliations.

