
RNA-Seq Analysis of the Key Long Noncoding RNAs and mRNAs Related to the Regulation of Hepatic Lipid Metabolism in Oreochromis niloticus

Abstract
:1. Introduction
2. Materials and Methods
2.1. Experimental Design and Sampling
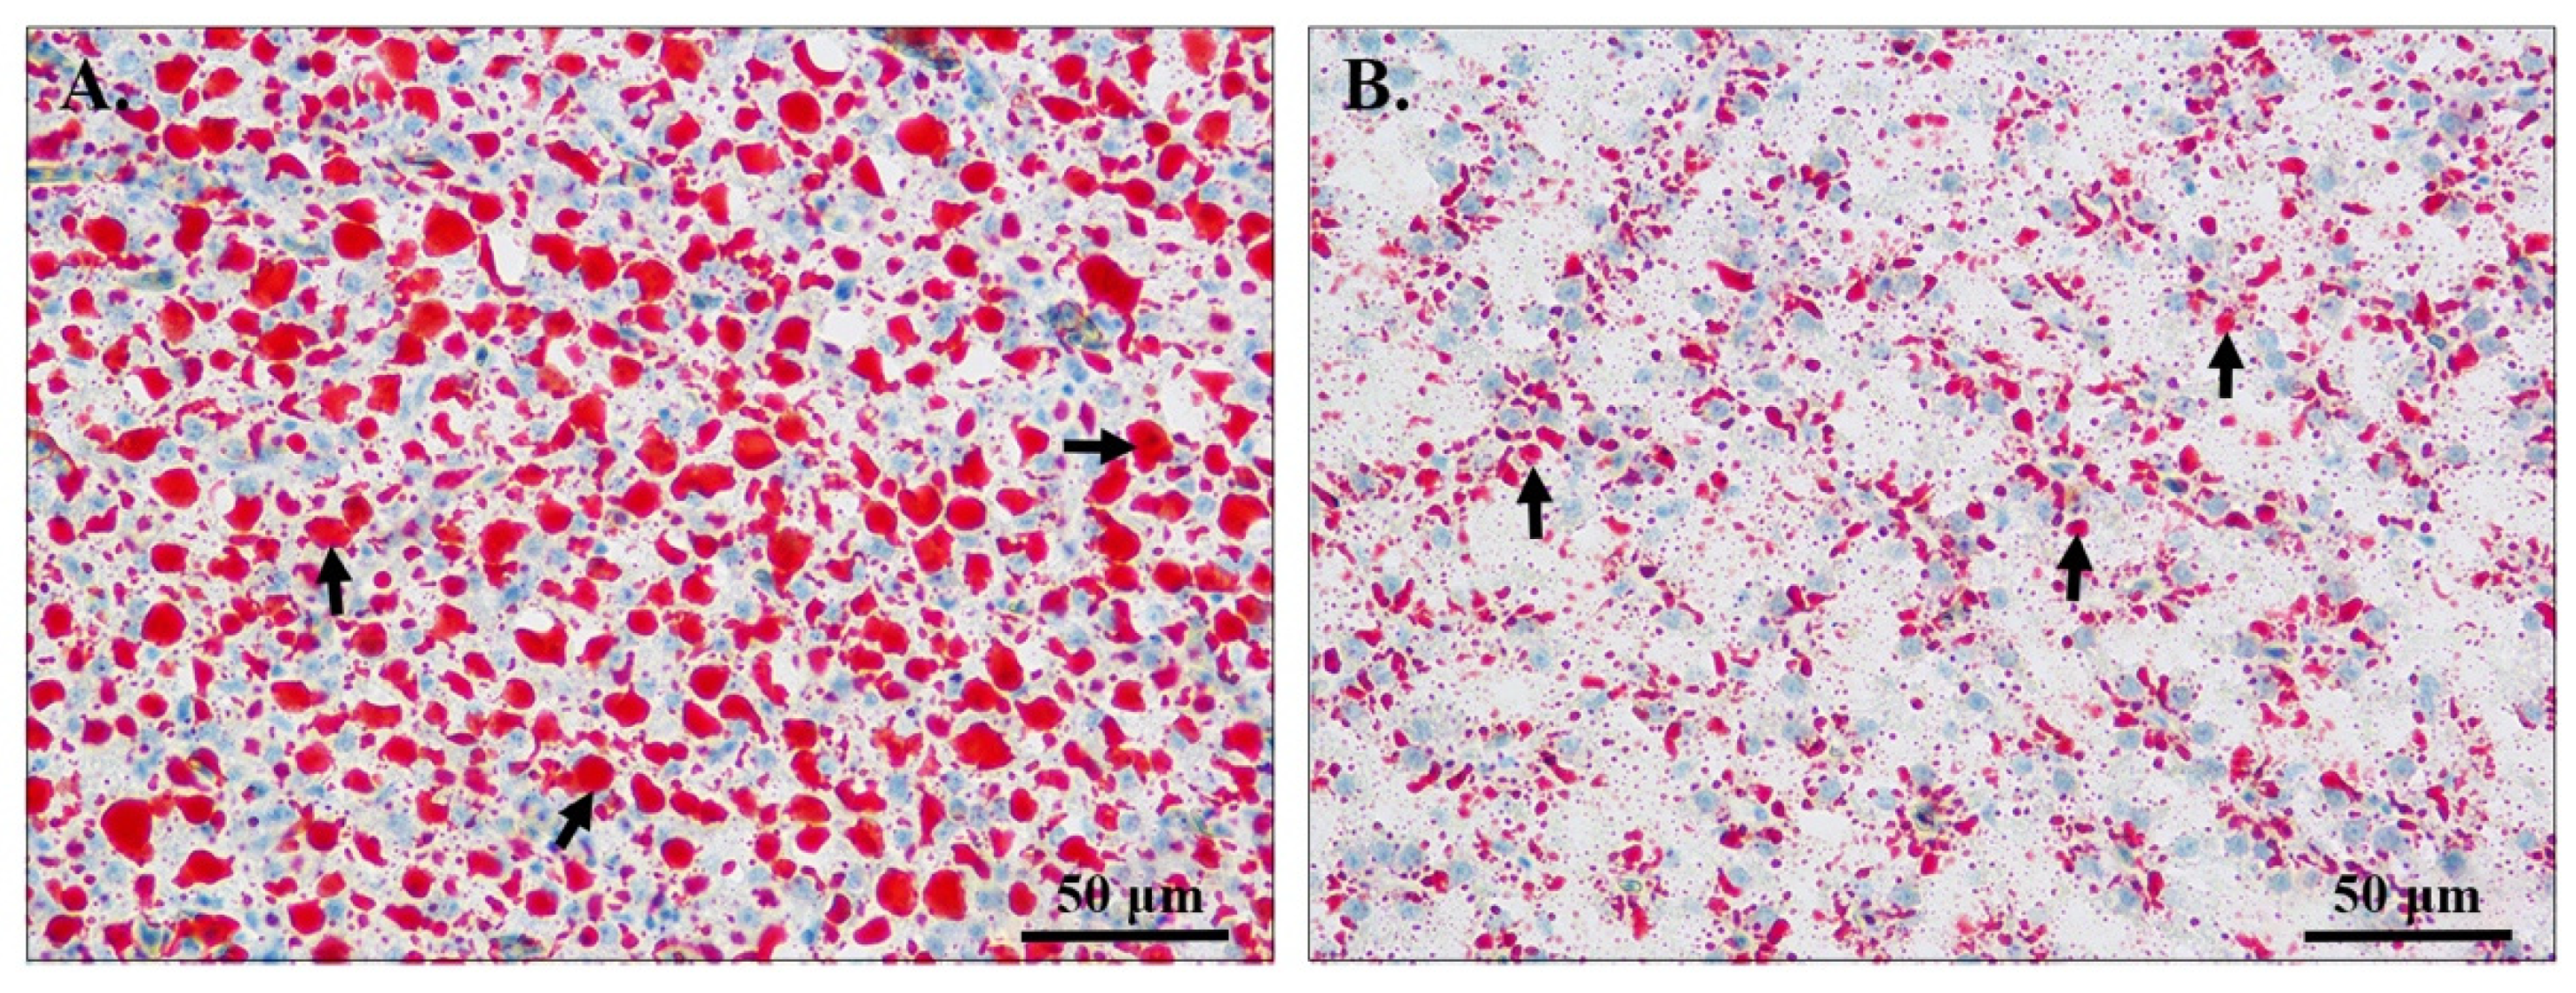
2.2. Hepatic Histological Analysis
2.3. RNA Extraction and Sequencing
2.4. Data Filtering and lncRNA Identification
2.5. Differential Expression Analyses of lncRNAs and mRNAs
2.6. Target Gene Prediction
2.7. Pathway Enrichment Analysis
2.8. qRT-PCR Analyses
3. Results
3.1. Hepatic Histological Analysis
3.2. Overview of Liver RNA Sequencing
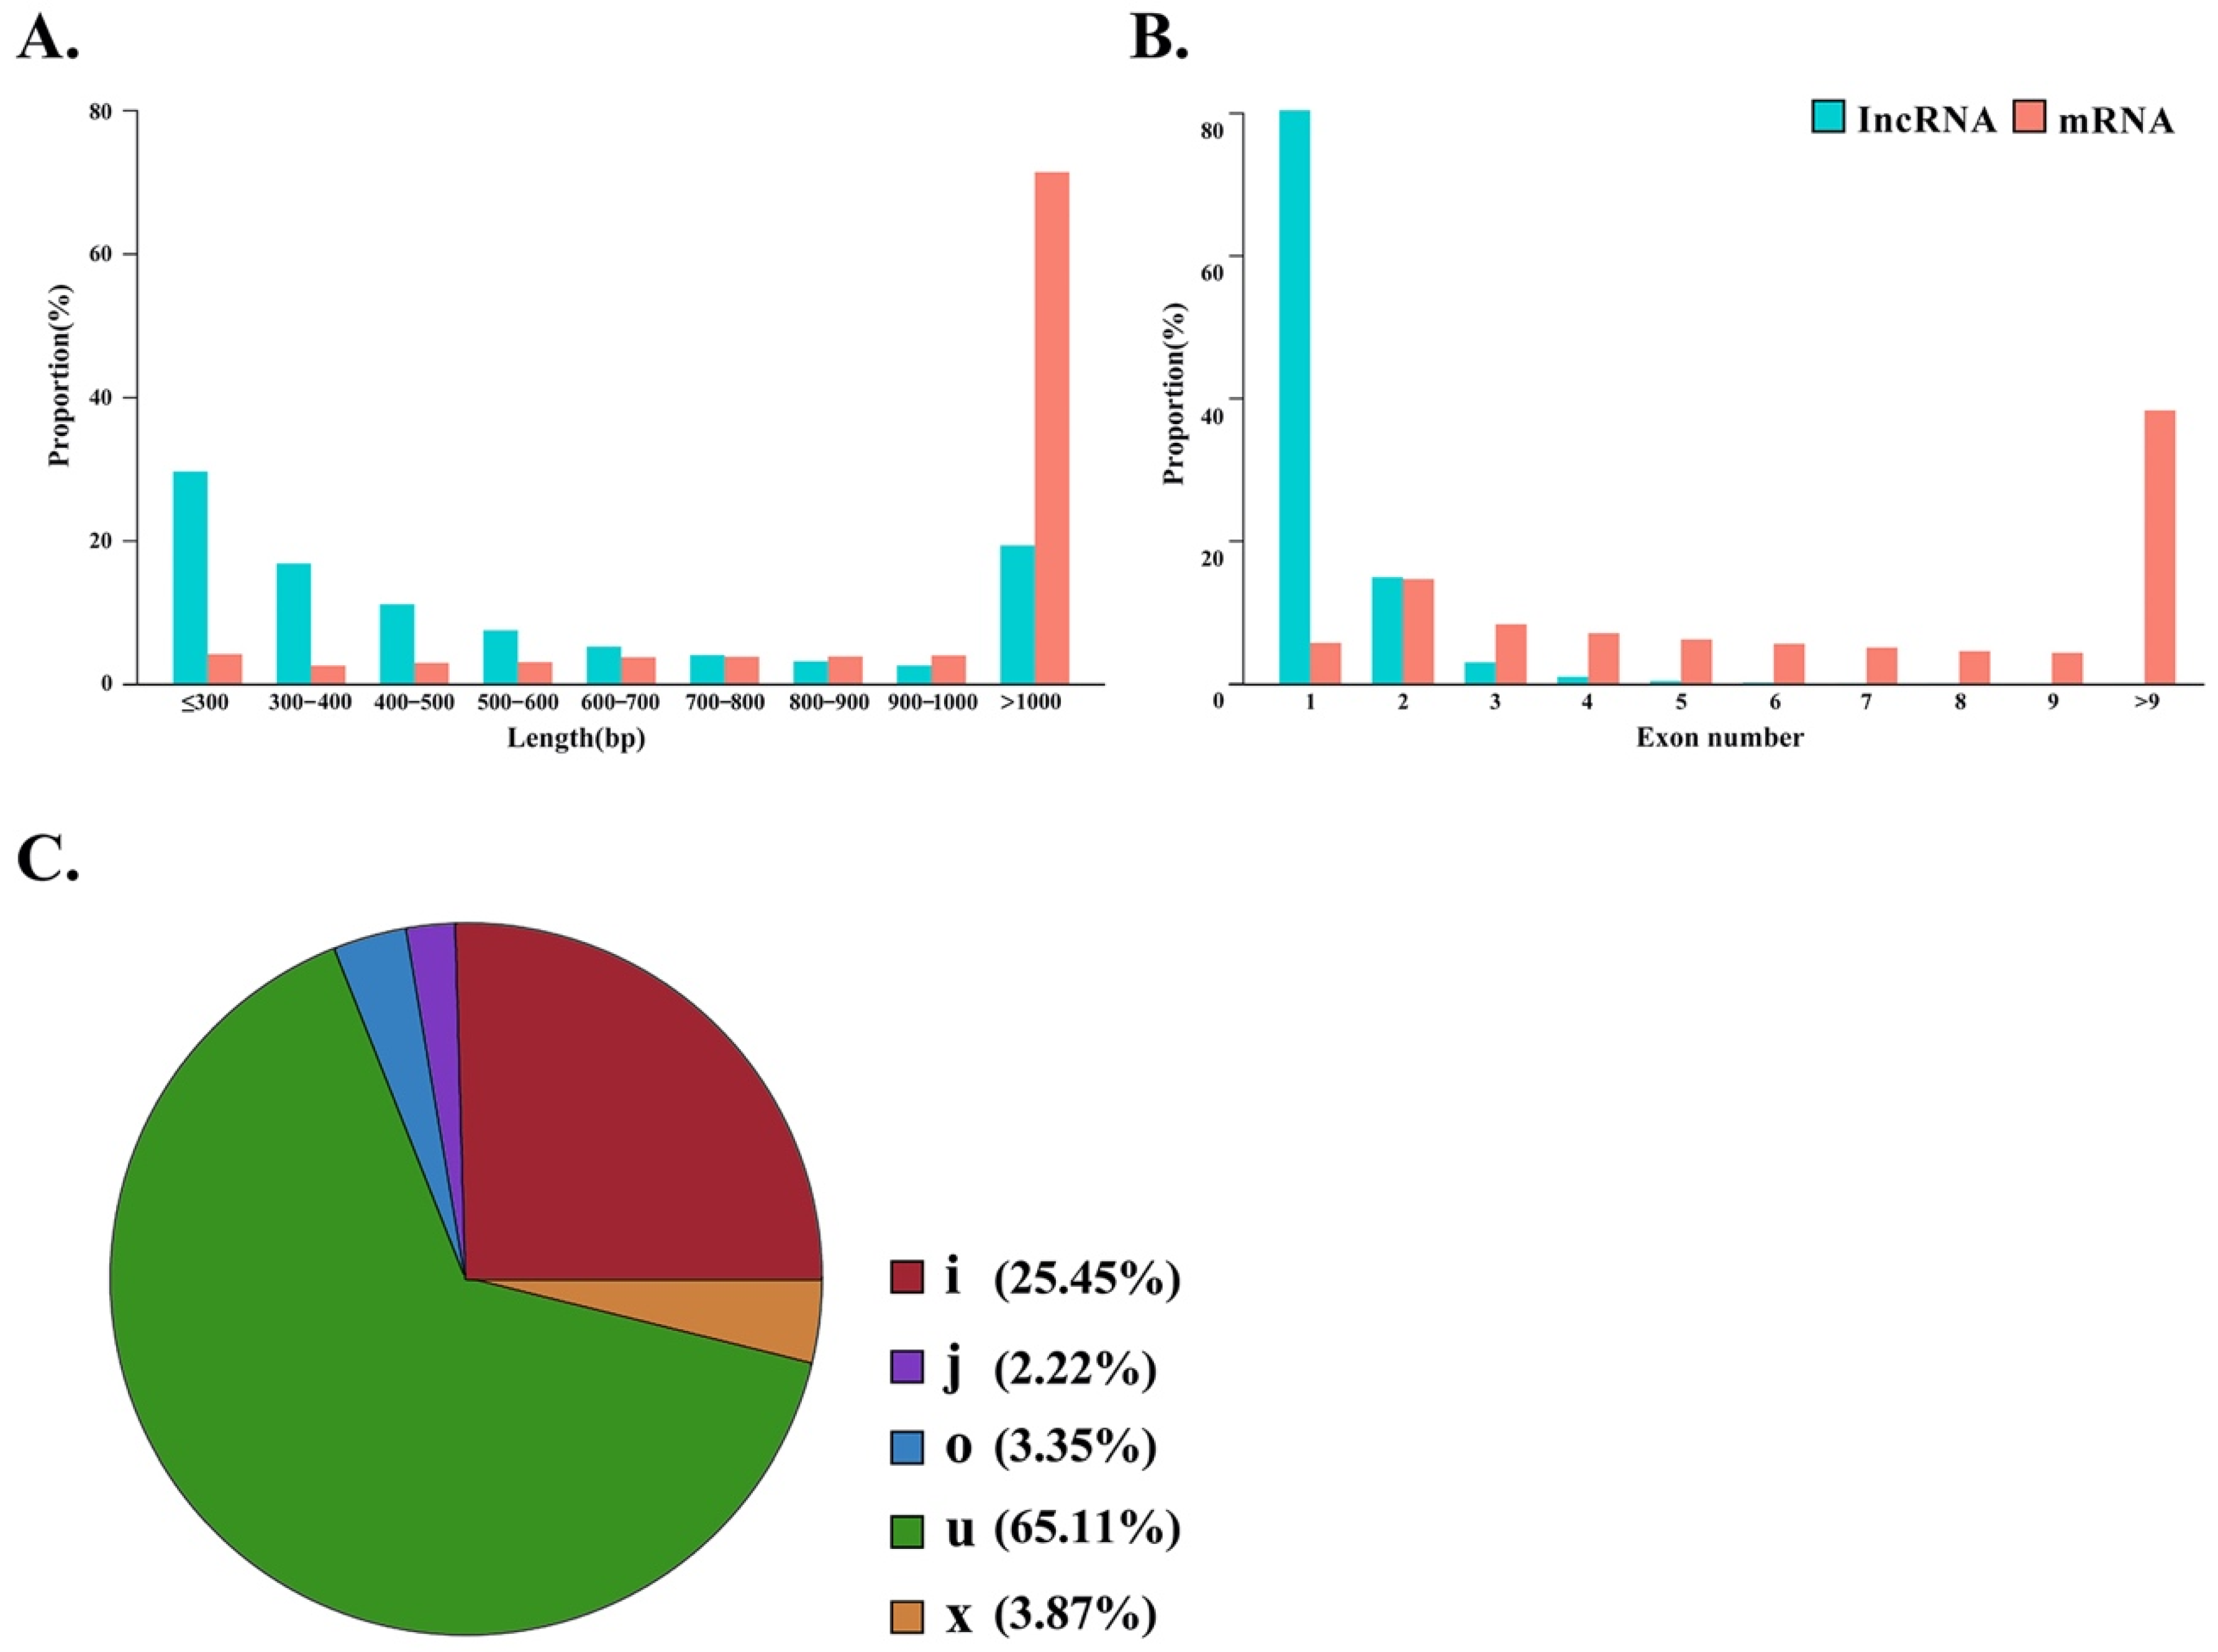
3.3. Identification and Quantification of lncRNAs
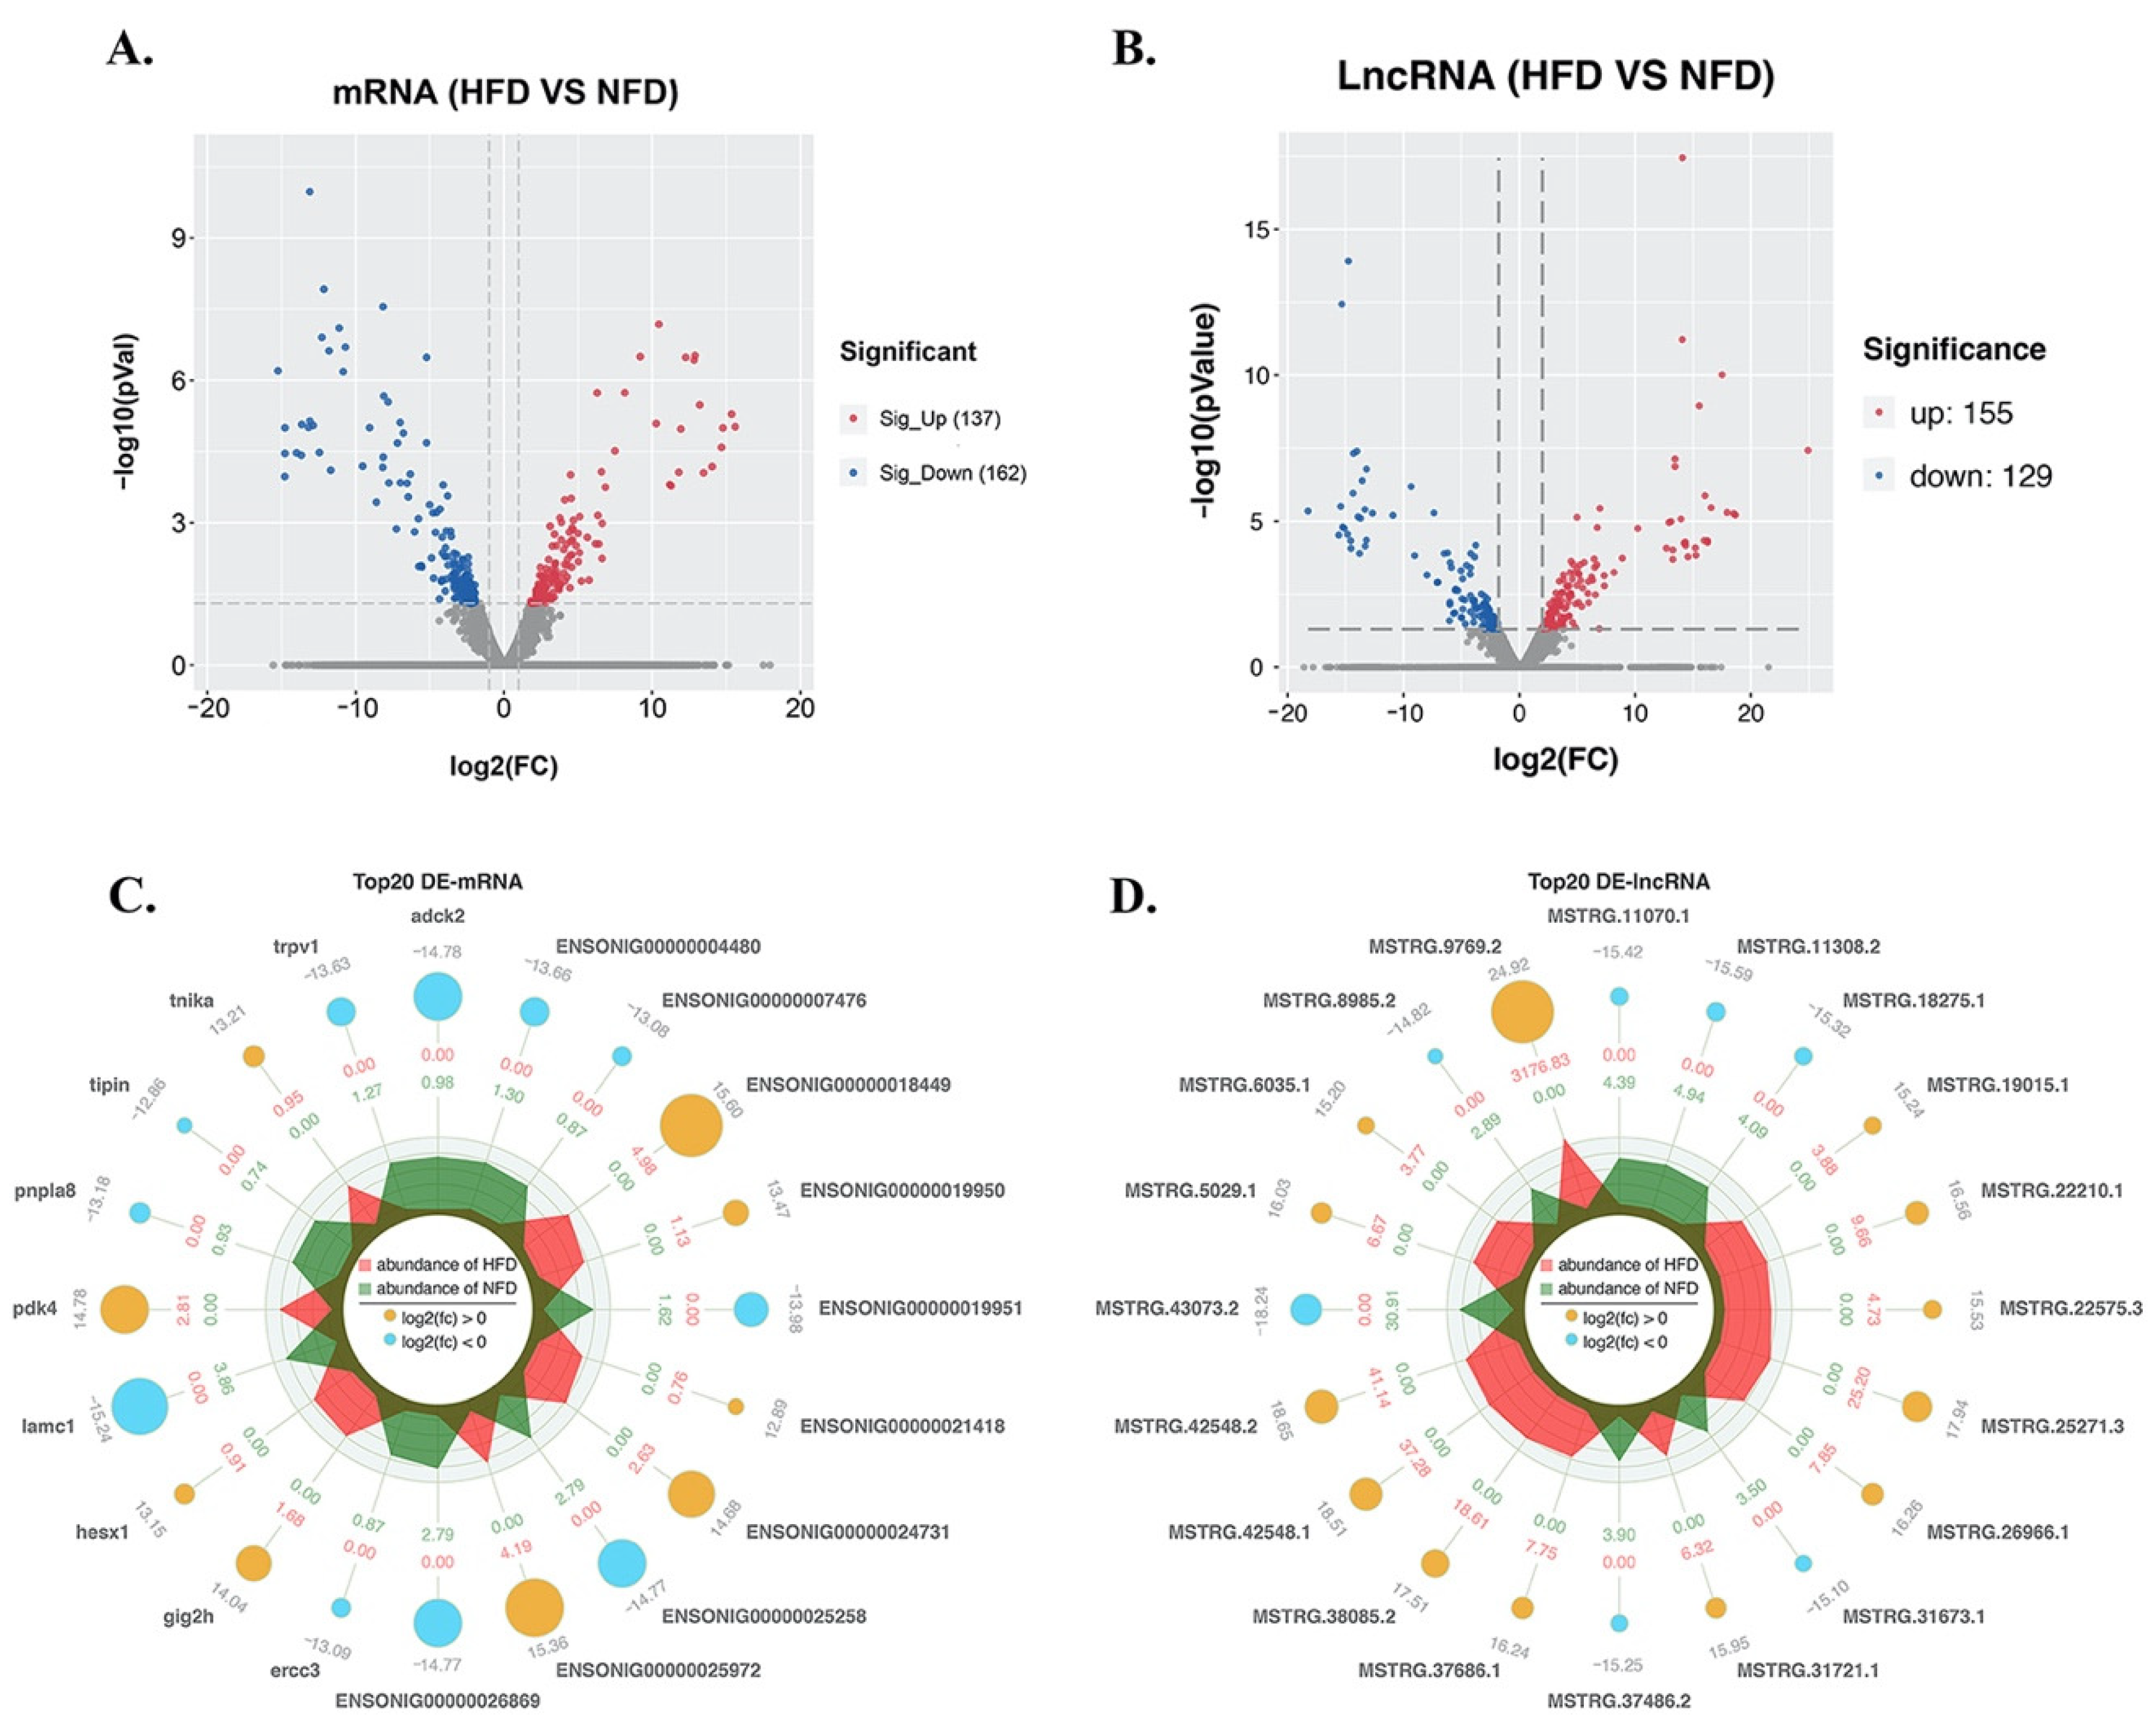
3.4. Screening of DE-lncRNAs and DE-mRNAs in Response to a High-Fat Diet
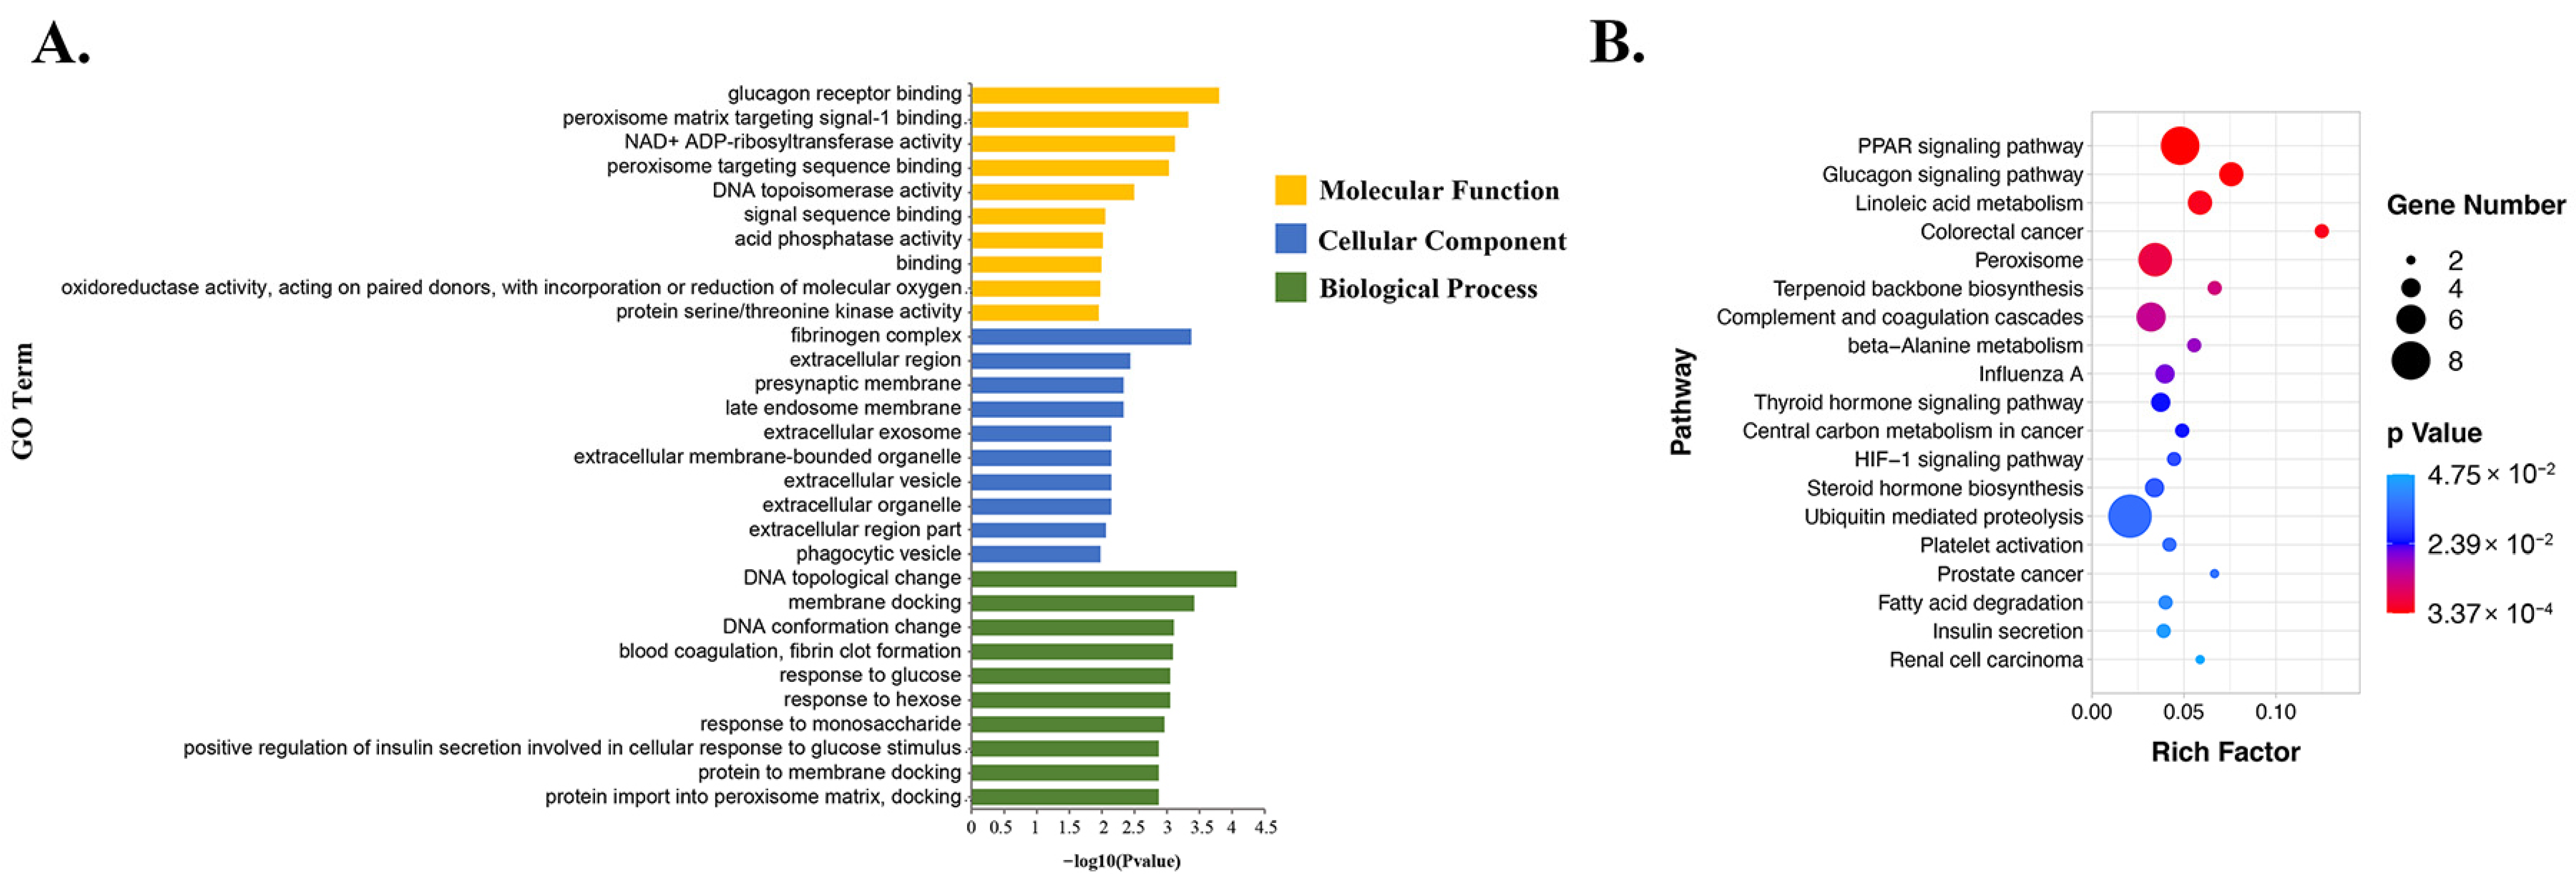
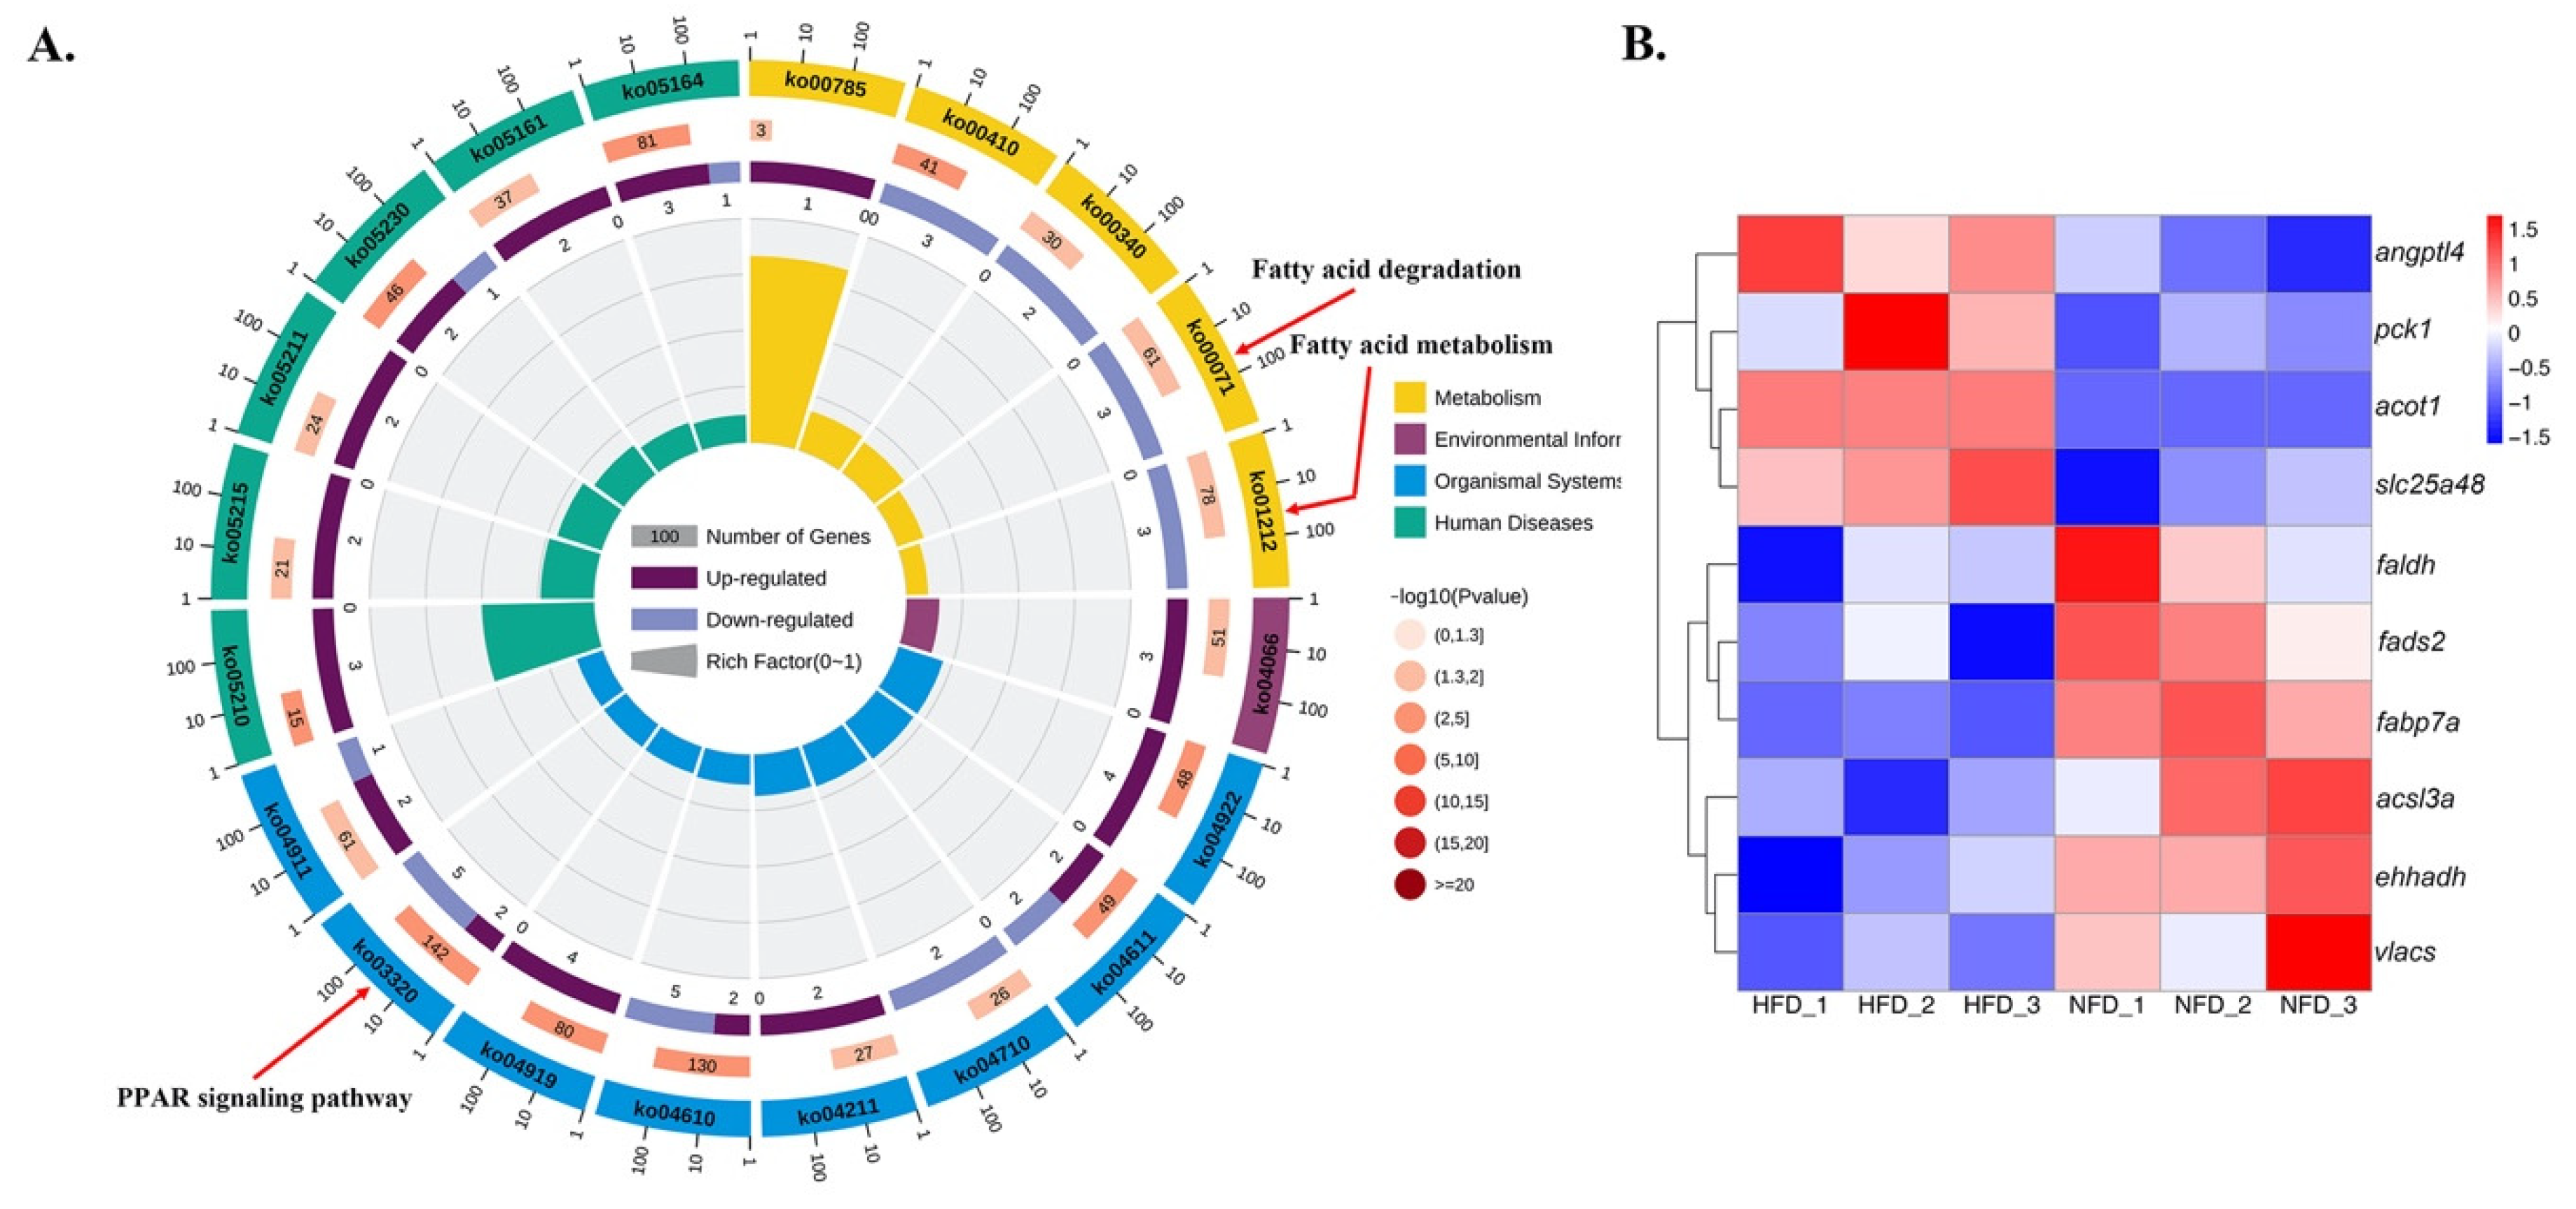
3.5. Functional Enrichment Analysis of DE-mRNAs
3.6. Data Confirmation by qRT-PCR
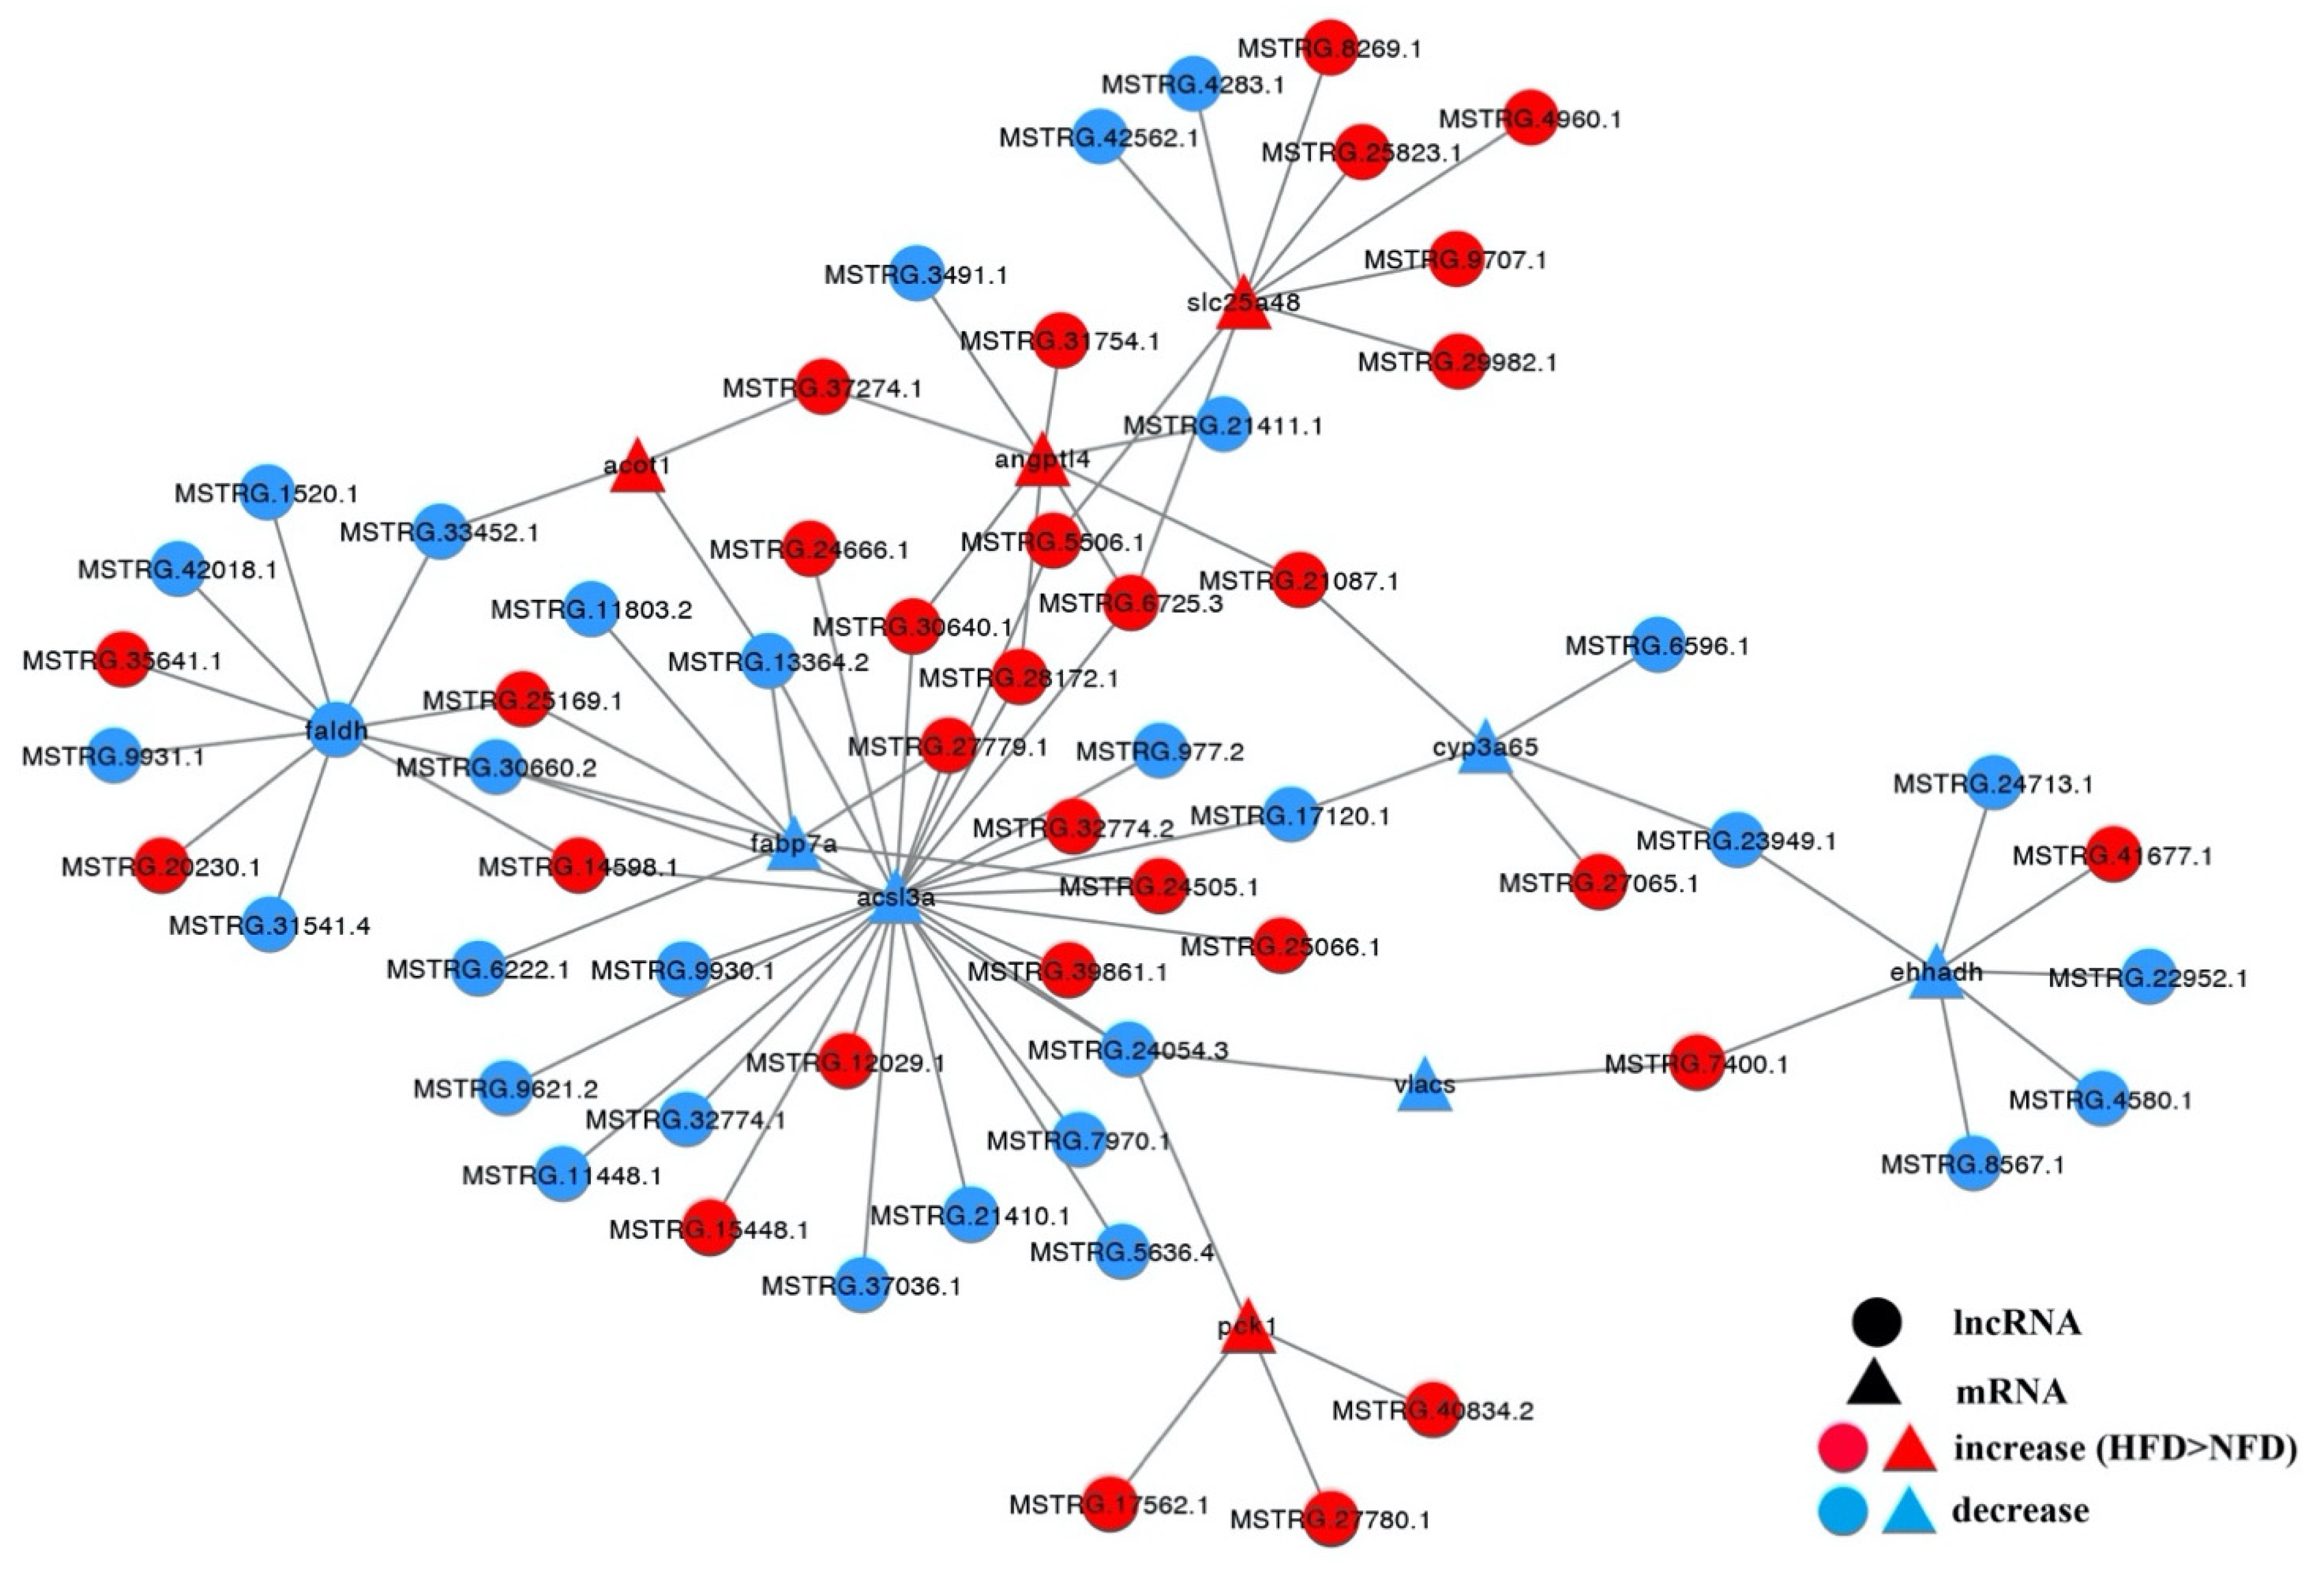
3.7. Cis and Trans Roles of DE-lncRNAs
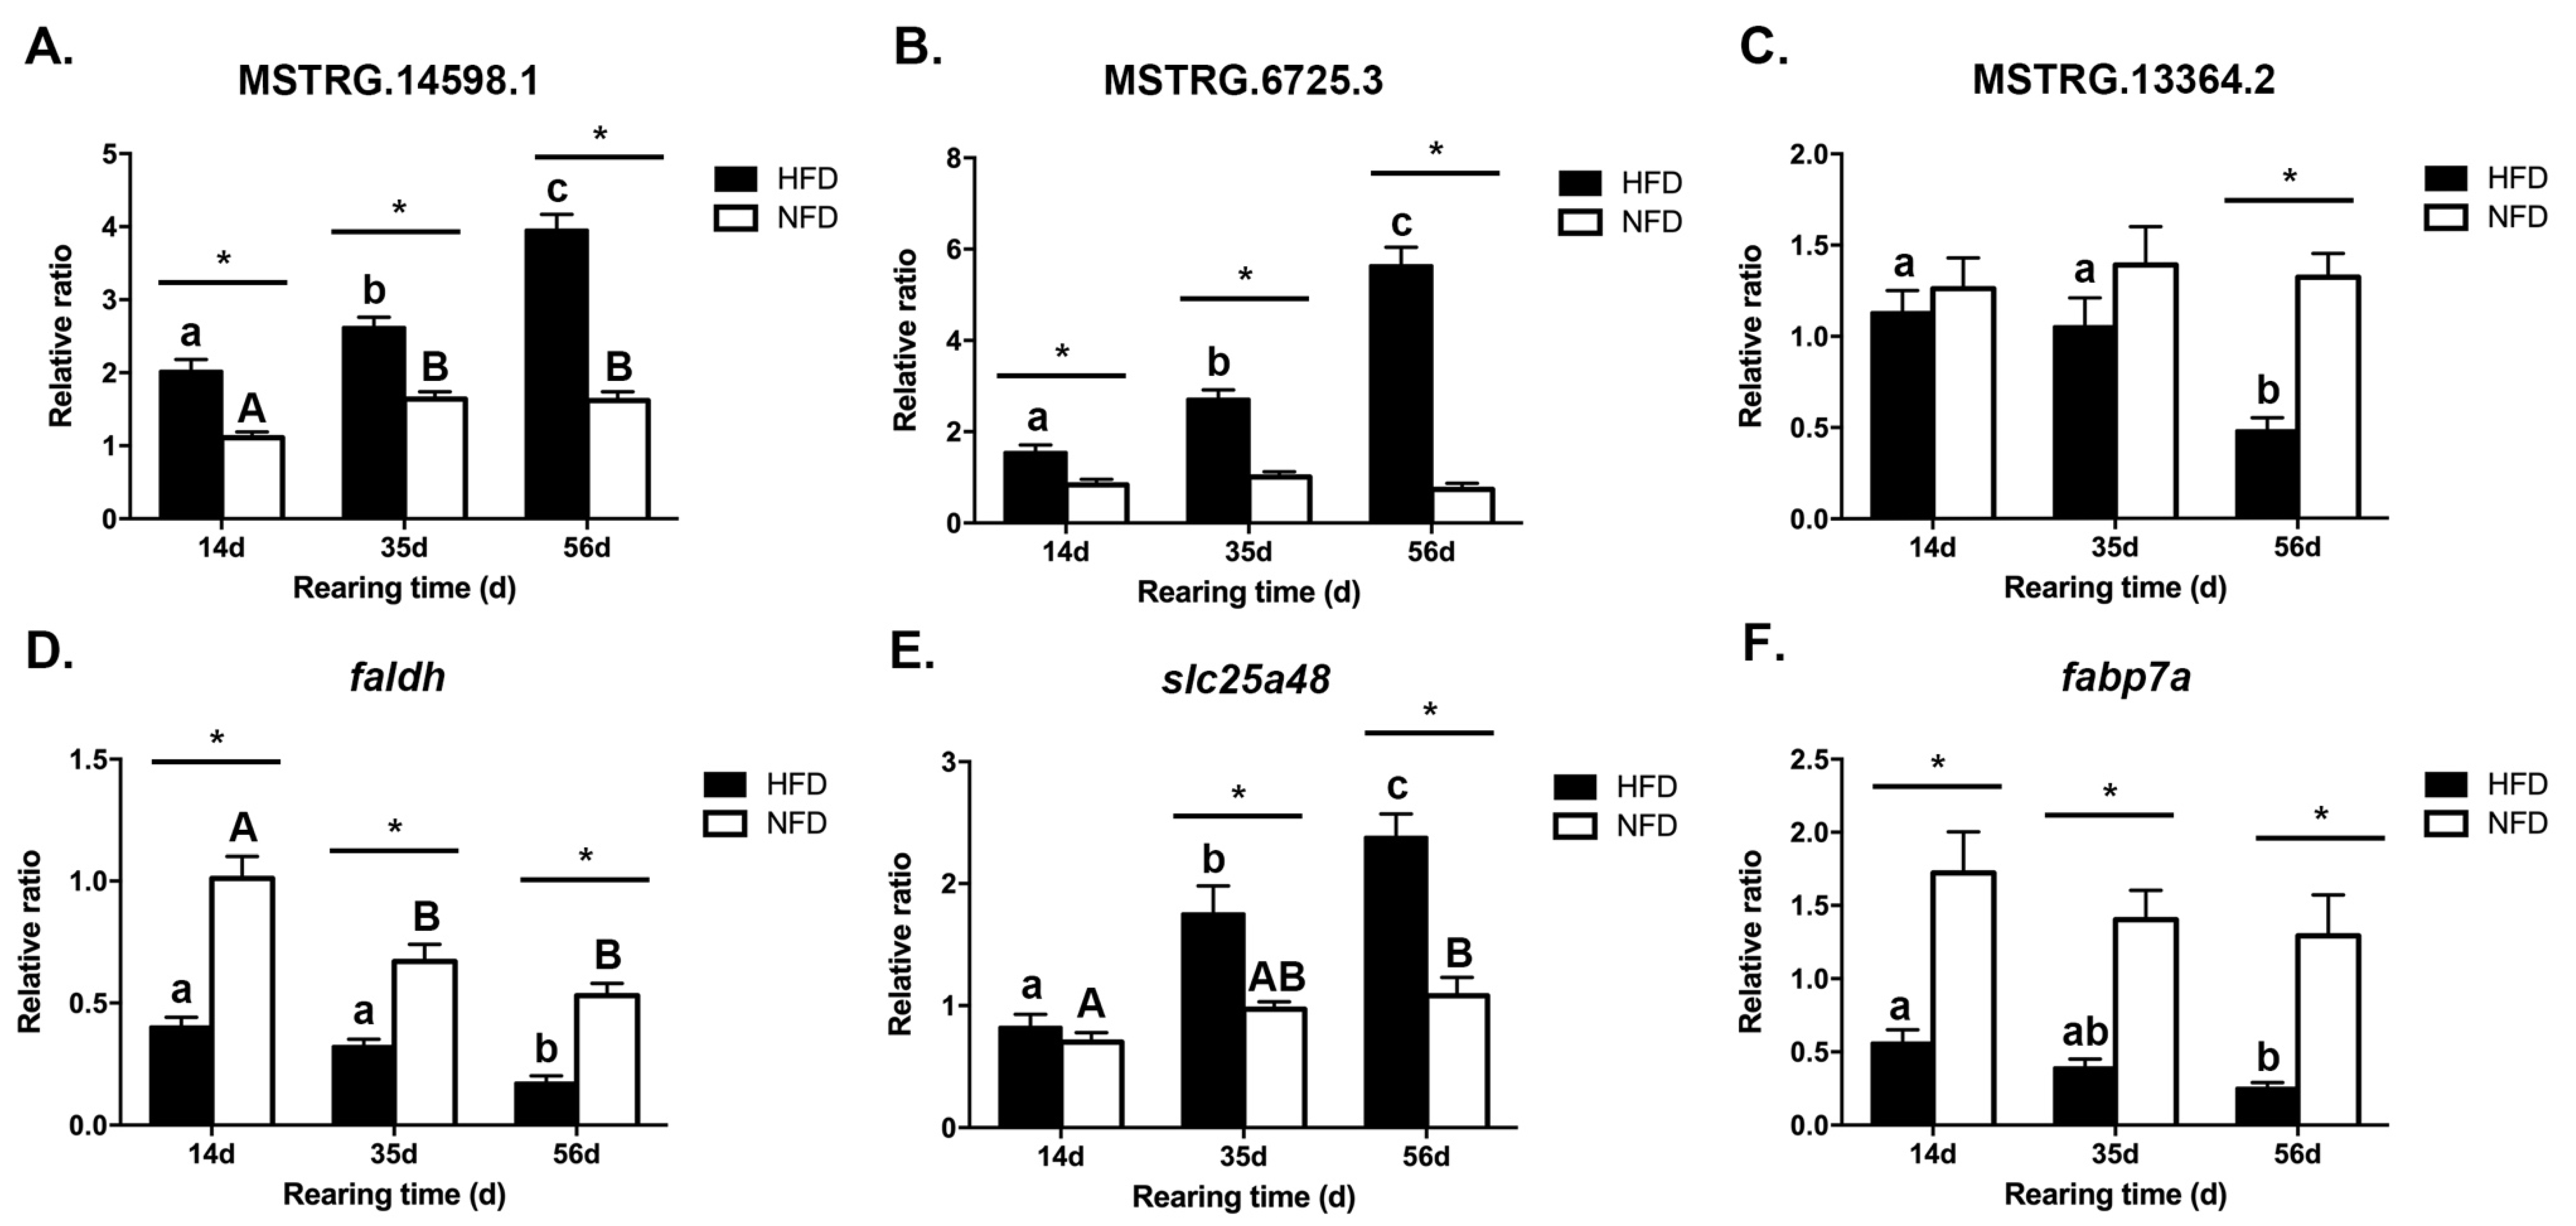
3.8. Expression Patterns of Several DE-lncRNAs and Their Lipid Metabolism-Related Target mRNAs in Response to a High-Fat Diet
4. Discussion
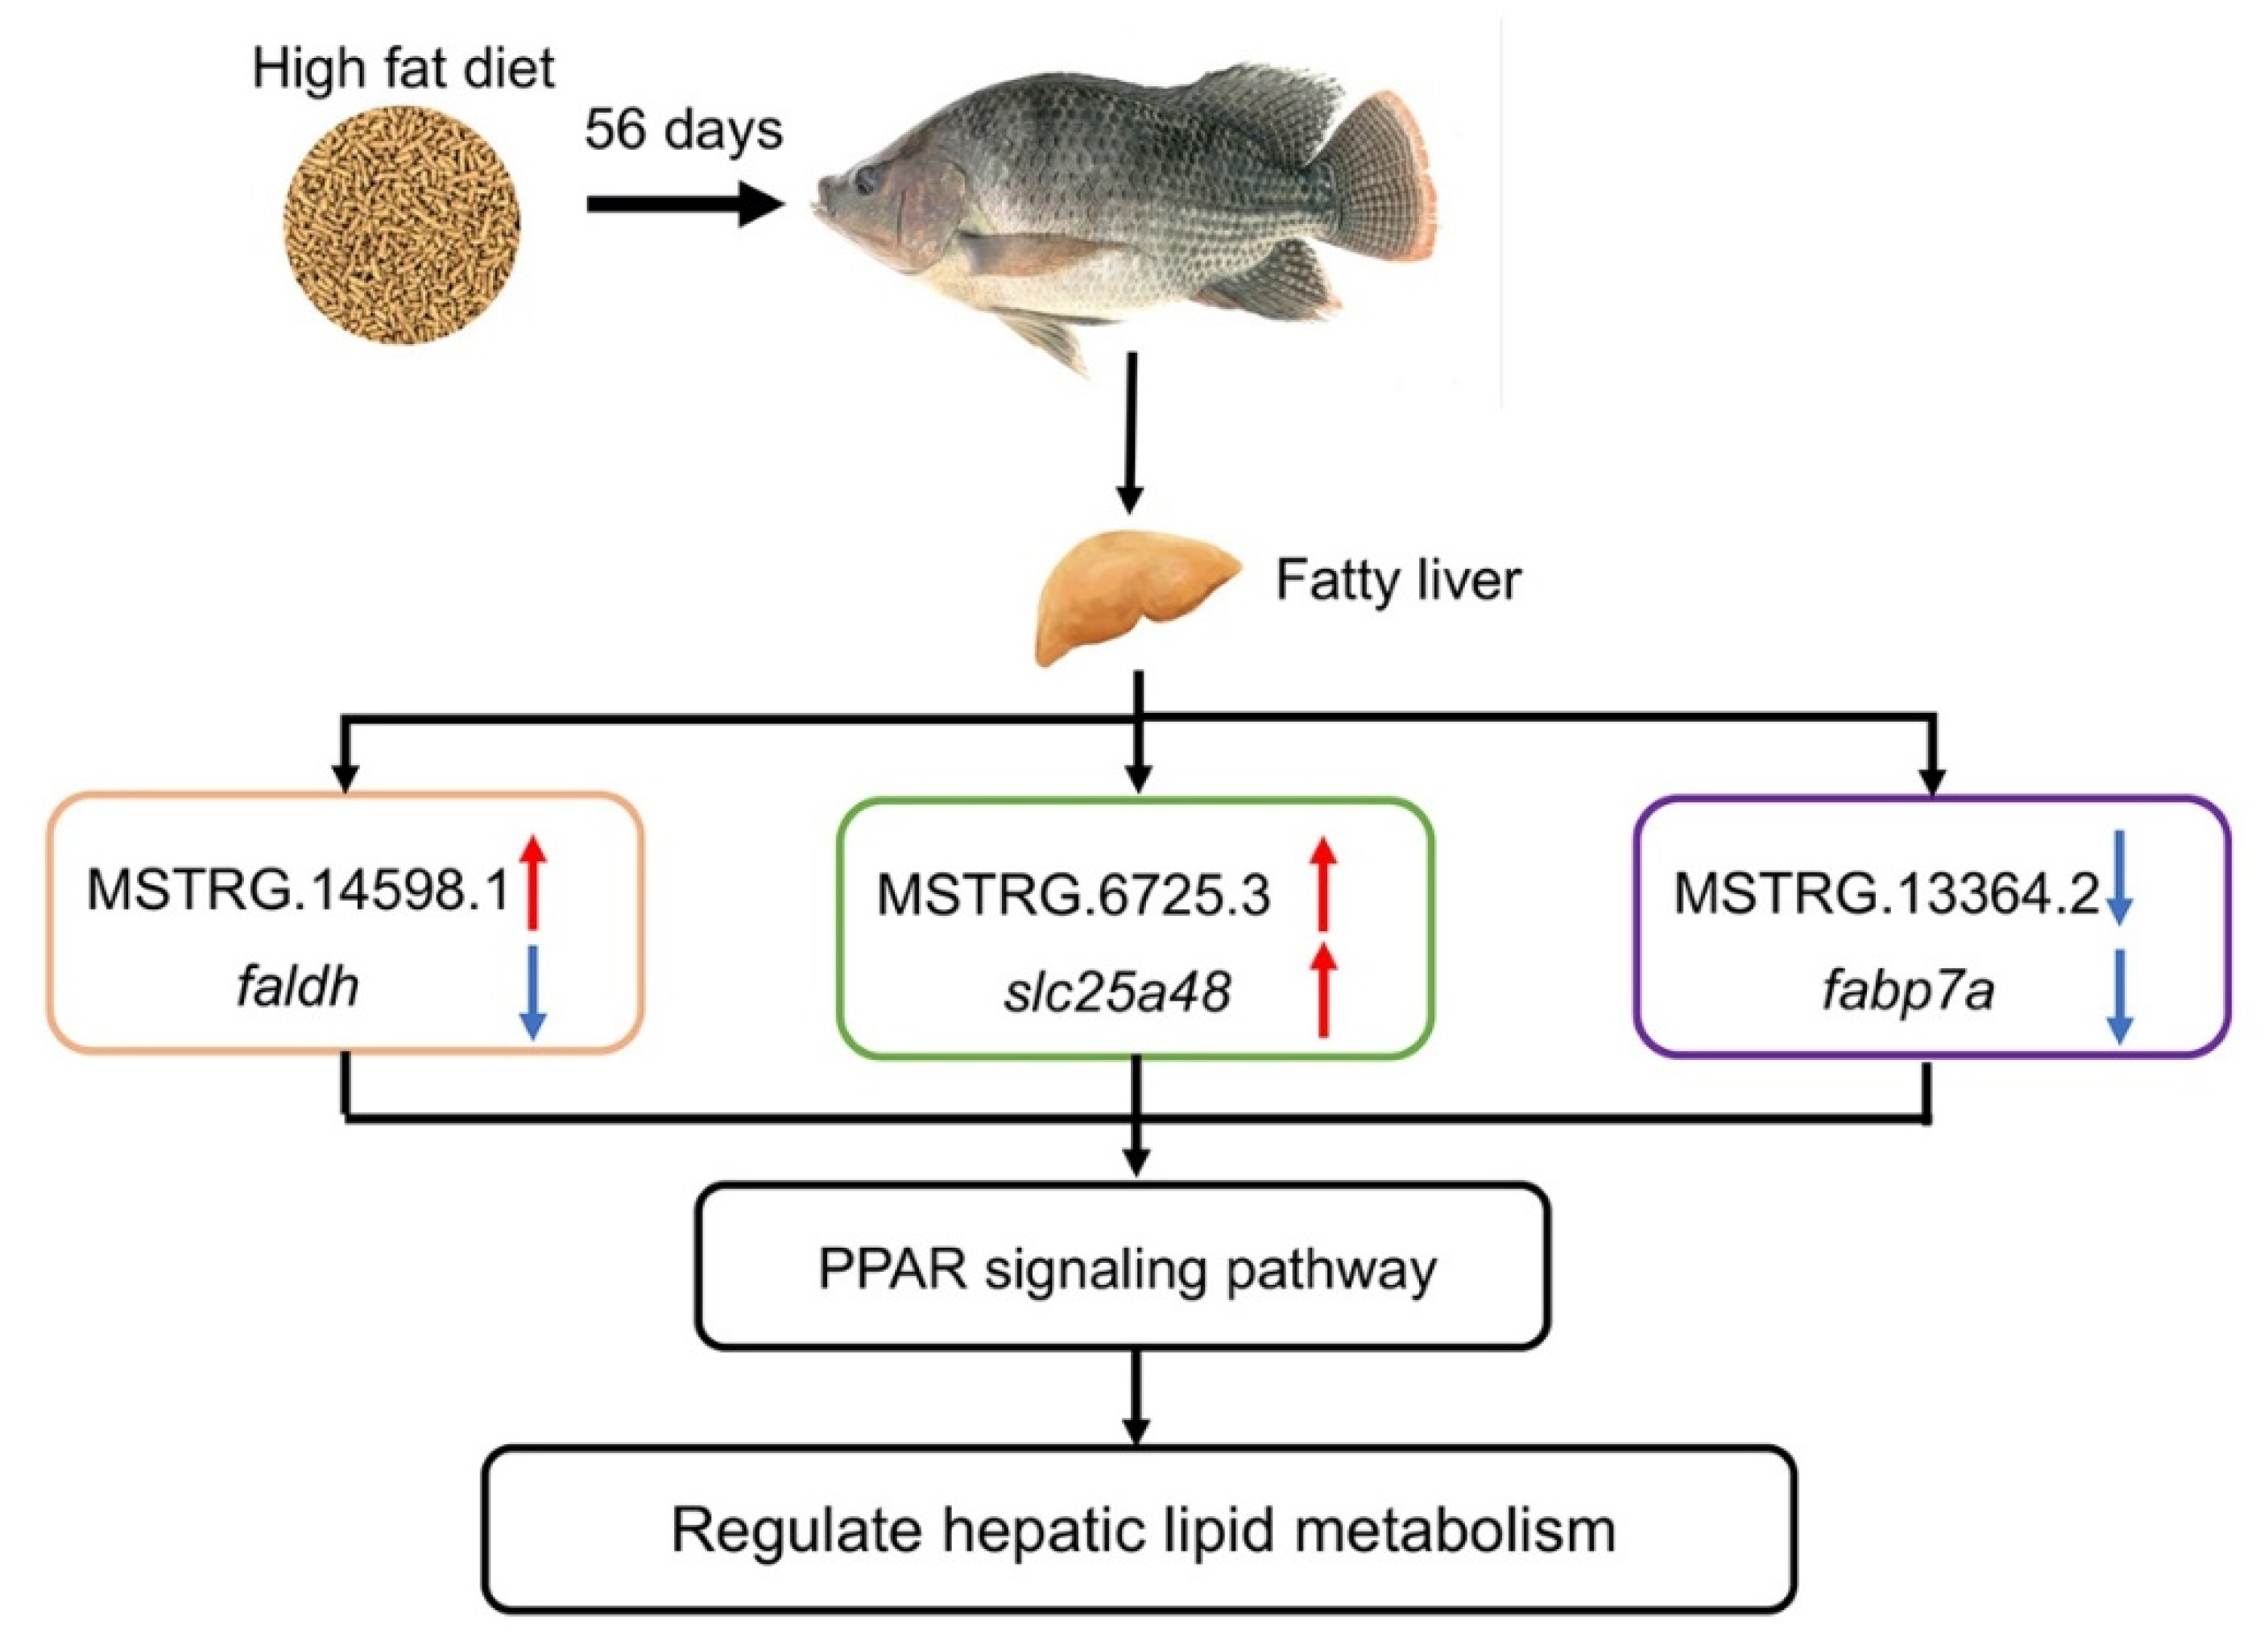
5. Conclusions
Supplementary Materials
Author Contributions
Funding
Institutional Review Board Statement
Data Availability Statement
Acknowledgments
Conflicts of Interest
References
- Xu, H.; Ren, M.C.; Liang, H.L.; Ge, X.P.; Ji, K.; Huang, D.Y.; Yu, H.; Wu, L.H. Interactive effects of water salinity and dietary methionine levels on growth performance, whole-body composition, plasma parameters, and expression of major nutrient metabolism genes in juvenile genetically improved farmed Tilapia (Oreochromis niloticus). Aquaculture 2022, 546, 737381. [Google Scholar] [CrossRef]
- Qiang, J.; Tao, Y.F.; Bao, J.W.; Chen, D.J.; Li, H.X.; He, J.; Xu, P. High Fat Diet-Induced miR-122 Regulates Lipid Metabolism and Fat Deposition in Genetically Improved Farmed Tilapia (GIFT, Oreochromis niloticus) Liver. Front. Physiol. 2018, 9, 1422. [Google Scholar] [CrossRef] [PubMed] [Green Version]
- Du, Z.Y. Causes of fatty liver in farmed fish: A review and new perspectives. J. Fish. China 2014, 38, 1628–1638. [Google Scholar]
- Tao, Y.F.; Qiang, J.; Yin, G.J.; Xu, P.; Shi, Q.; Bao, J.W. Identification and characterization of lipid metabolism-related microRNAs in the liver of genetically improved farmed tilapia (GIFT, Oreochromis niloticus) by deep sequencing. Fish. Shellfish Immun. 2017, 69, 227–235. [Google Scholar] [CrossRef] [PubMed]
- Jia, R.; Cao, L.P.; Du, J.L.; He, Q.; Gu, Z.Y.; Jeney, G.; Xu, P.; Yin, G.J. Effects of High-Fat Diet on Steatosis, Endoplasmic Reticulum Stress and Autophagy in Liver of Tilapia (Oreochromis niloticus). Front. Mar. Sci. 2020, 7, 363. [Google Scholar] [CrossRef]
- Lu, K.L.; Xu, W.N.; Li, J.Y.; Li, X.F.; Huang, G.Q.; Liu, W.B. Alterations of liver histology and blood biochemistry in blunt snout bream Megalobrama amblycephala fed high-fat diets. Fish. Sci. 2013, 79, 661–671. [Google Scholar] [CrossRef]
- Qiang, J.; He, J.; Yang, H.; Sun, Y.L.; Tao, Y.F.; Xu, P.; Zhu, Z.X. Dietary lipid requirements of larval genetically improved farmed tilapia, Oreochromis niloticus (L.), and effects on growth performance, expression of digestive enzyme genes, and immune response. Aquac. Res. 2017, 48, 2827–2840. [Google Scholar] [CrossRef]
- Qiang, J.; Khamis, O.A.M.; Jiang, H.J.; Cao, Z.M.; He, J.; Tao, Y.F.; Xu, P.; Bao, J.W. Effects of dietary supplementation with apple peel powder on the growth, blood and liver parameters, and transcriptome of genetically improved farmed tilapia (GIFT, Oreochromis niloticus). PLoS ONE 2019, 14, e0224995. [Google Scholar] [CrossRef]
- Tian, J.; Wen, H.; Zeng, L.B.; Jiang, M.; Wu, F.; Liu, W.; Yang, C.G. Changes in the activities and mRNA expression levels of lipoprotein lipase (LPL), hormone-sensitive lipase (HSL) and fatty acid synthetase (FAS) of Nile tilapia (Oreochromis niloticus) during fasting and re-feeding. Aquaculture 2013, 400, 29–35. [Google Scholar] [CrossRef]
- He, A.Y.; Ning, L.J.; Chen, L.Q.; Chen, Y.L.; Xing, Q.; Li, J.M.; Qiao, F.; Li, D.L.; Zhang, M.L.; Du, Z.Y. Systemic adaptation of lipid metabolism in response to low- and high-fat diet in Nile tilapia (Oreochromis niloticus). Physiol. Rep. 2015, 3, e12485. [Google Scholar] [CrossRef]
- Ma, X.Y.; Qiang, J.; He, J.; Gabriel, N.N.; Xu, P. Changes in the physiological parameters, fatty acid metabolism, and SCD activity and expression in juvenile GIFT tilapia (Oreochromis niloticus) reared at three different temperatures. Fish Physiol. Biochem. 2015, 41, 937–950. [Google Scholar] [CrossRef] [PubMed]
- Ponting, C.P.; Oliver, P.L.; Reik, W. Evolution and Functions of Long Noncoding RNAs. Cell 2009, 136, 629–641. [Google Scholar] [CrossRef] [PubMed] [Green Version]
- Kretz, M.; Siprashvili, Z.; Chu, C.; Webster, D.E.; Zehnder, A.; Qu, K.; Lee, C.S.; Flockhart, R.J.; Groff, A.F.; Chow, J.; et al. Control of somatic tissue differentiation by the long non-coding RNA TINCR. Nature 2013, 493, 231–245. [Google Scholar] [CrossRef] [PubMed] [Green Version]
- Moran, V.A.; Perera, R.J.; Khalil, A.M. Emerging functional and mechanistic paradigms of mammalian long non-coding RNAs. Nucleic Acids Res. 2012, 40, 6391–6400. [Google Scholar] [CrossRef] [Green Version]
- Kapusta, A.; Feschotte, C. Volatile evolution of long noncoding RNA repertoires: Mechanisms and biological implications. Trends. Genet. 2014, 30, 439–452. [Google Scholar] [CrossRef] [Green Version]
- Wang, X. Down-regulation of lncRNA-NEAT1 alleviated the non-alcoholic fatty liver disease via mTOR/S6K1 signaling pathway. J. Cell. Biochem. 2018, 119, 1567–1574. [Google Scholar] [CrossRef]
- Li, D.; Guo, L.; Deng, B.; Li, M.; Yang, T.; Yang, F.; Yang, Z. Long non-coding RNA HR1 participates in the expression of SREBP-1c through phosphorylation of the PDK1/AKT/FoxO1 pathway. Mol. Med. Rep. 2018, 18, 2850–2856. [Google Scholar] [CrossRef] [Green Version]
- Li, P.; Ruan, X.; Yang, L.; Kiesewetter, K.; Zhao, Y.; Luo, H.; Chen, Y.; Gucek, M.; Zhu, J.; Cao, H. A Liver-Enriched Long Non-Coding RNA, lncLSTR, Regulates Systemic Lipid Metabolism in Mice. Cell Metab. 2015, 21, 455–467. [Google Scholar] [CrossRef] [Green Version]
- Xu, H.G.; Cao, L.; Sun, B.; Wei, Y.L.; Liang, M.Q. Transcriptomic Analysis of Potential “IncRNA-mRNA” Interactions in Liver of the Marine Teleost Cynoglossus semilaevis Fed Diets With Different DHA/EPA Ratios. Front. Physiol. 2019, 10, 331. [Google Scholar] [CrossRef] [Green Version]
- Sehgal, P.; Mathew, S.; Sivadas, A.; Ray, A.; Tanwar, J.; Vishwakarma, S.; Ranjan, G.; Shamsudheen, K.V.; Bhoyar, R.C.; Pateria, A.; et al. LncRNA VEAL2 regulates PRKCB2 to modulate endothelial permeability in diabetic retinopathy. EMBO J. 2021, 40, e107134. [Google Scholar] [CrossRef]
- Tao, Y.F.; Qiang, J.; He, J.; Zhu, H.J.; Bao, J.W.; Xu, P. Untargeted LC-MS metabolomics approach reveals metabolic changes in genetically improved farmed tilapia (Oreochromis niloticus) with fatty liver induced by a high-fat diet. Aquac. Res. 2021, 52, 724–735. [Google Scholar] [CrossRef]
- Li, M.X.; Qiang, J.; Zhu, X.W.; Bao, J.W.; Tao, Y.F.; Zhu, H.J. Effect of Siberian Ginseng Water Extract as a Dietary Additive on Growth Performance, Blood Biochemical Indexes, Lipid Metabolism, and Expression of PPARs Pathway-Related Genes in Genetically Improved Farmed Tilapia (Oreochromis niloticus). Fishes 2022, 7, 149. [Google Scholar] [CrossRef]
- Wang, L.M.; Zhu, W.B.; Dong, Z.J.; Song, F.B.; Dong, J.J.; Fu, J.J. Comparative microRNA-seq Analysis Depicts Candidate miRNAs Involved in Skin Color Differentiation in Red Tilapia. Int. J. Mol. Sci. 2018, 19, 1209. [Google Scholar] [CrossRef] [PubMed] [Green Version]
- Kim, D.; Langmead, B.; Salzberg, S.L. HISAT: A fast spliced aligner with low memory requirements. Nat. Methods 2015, 12, 357–360. [Google Scholar] [CrossRef] [Green Version]
- Kong, L.; Zhang, Y.; Ye, Z.Q.; Liu, X.Q.; Zhao, S.Q.; Wei, L.; Gao, G. CPC: Assess the protein-coding potential of transcripts using sequence features and support vector machine. Nucleic Acids Res. 2007, 35, W345–W349. [Google Scholar] [CrossRef]
- Sun, L.; Luo, H.T.; Bu, D.C.; Zhao, G.G.; Yu, K.; Zhang, C.H.; Liu, Y.N.; Chen, R.S.; Zhao, Y. Utilizing sequence intrinsic composition to classify protein-coding and long non-coding transcripts. Nucleic Acids Res. 2013, 41, e166. [Google Scholar] [CrossRef]
- He, F.; Liu, Q.Q.; Zheng, L.; Cui, Y.Q.; Zheng, L.Q. RNA-Seq Analysis of Rice Roots Reveals the Involvement of Post-Transcriptional Regulation in Response to Cadmium Stress. Front. Plant Sci. 2016, 6, 1136. [Google Scholar] [CrossRef] [Green Version]
- Robinson, M.D.; McCarthy, D.J.; Smyth, G.K. edgeR: A Bioconductor package for differential expression analysis of digital gene expression data. Bioinformatics 2010, 26, 139–140. [Google Scholar] [CrossRef] [Green Version]
- Quan, J.Q.; Kang, Y.J.; Luo, Z.C.; Zhao, G.Y.; Ma, F.; Li, L.L.; Liu, Z. Identification and characterization of long noncoding RNAs provide insight into the regulation of gene expression in response to heat stress in rainbow trout (Oncorhynchus mykiss). Comp. Biochem. Physiol. D 2020, 36, 100707. [Google Scholar] [CrossRef]
- Quinlan, A.R.; Hall, I.M. BEDTools: A flexible suite of utilities for comparing genomic features. Bioinformatics 2010, 26, 841–842. [Google Scholar] [CrossRef] [Green Version]
- Alkan, F.; Wenzel, A.; Palasca, O.; Kerpedjiev, P.; Rudebeck, A.F.; Stadler, P.F.; Hofacker, I.L.; Gorodkin, J. RIsearch2: Suffix array-based large-scale prediction of RNA-RNA interactions and siRNA off-targets. Nucleic Acids Res. 2017, 45, e60. [Google Scholar] [CrossRef] [PubMed]
- Li, D.; Jiang, W.; Jiang, Y.; Wang, S.; Fang, J.; Zhu, L.; Zhu, Y.; Yan, G.; Sun, H.; Chen, L.; et al. Preliminary functional inquiry of lncRNA ENST00000433673 in embryo implantation using bioinformatics analysis. Syst. Biol. Reprod. Med. 2019, 65, 164–173. [Google Scholar] [CrossRef] [PubMed]
- Malik, A.; Abbas, G.; Ghaffar, A.; Ferrando, S.; Gallus, L. Effect of Different Salinity Level on Breeding, Fertilization, Hatching and Survival of Nile Tilapia, Oreochromis niloticus (Linnaeus, 1758) in Captivity. Pak. J. Zool. 2018, 50, 539–547. [Google Scholar] [CrossRef]
- He, A.Y.; Liu, C.Z.; Chen, L.Q.; Ning, L.J.; Qin, J.G.; Li, J.M.; Zhang, M.L.; Du, Z.Y. Molecular characterization, transcriptional activity and nutritional regulation of peroxisome proliferator activated receptor gamma in Nile tilapia (Oreochromis niloticus). Gen. Comp. Endocrinol. 2015, 223, 139–147. [Google Scholar] [CrossRef]
- Ning, L.J.; He, A.Y.; Li, J.M.; Lu, D.L.; Jiao, J.G.; Li, L.Y.; Li, D.L.; Zhang, M.L.; Chen, L.Q.; Du, Z.Y.; et al. Mechanisms and metabolic regulation of PPARα activation in Nile tilapia (Oreochromis niloticus). BBA-Mol. Cell Biol. L. 2016, 1861, 1036–1048. [Google Scholar] [CrossRef]
- Luo, M.K.; Wang, L.M.; Yin, H.R.; Zhu, W.B.; Dong, Z.J. Integrated analysis of long non-coding RNA and mRNA expression in different colored skin of koi carp. BMC Genom. 2019, 20, 515. [Google Scholar] [CrossRef] [Green Version]
- Gan, L.; Wang, Y.Z.; Chen, S.J.; Lin, Z.H.; Sun, J.J.; He, Y.H.; Tang, H.J.; Peng, J.; Guo, H.H. Identification and characterization of long non-coding RNAs in muscle sclerosis of grass carp, Ctenopharyngodon idellus fed with faba bean meal. Aquaculture 2020, 516, 734521. [Google Scholar] [CrossRef]
- Su, Z.; Labaj, P.P.; Li, S.; Thierry Mieg, J.; Thierry Mieg, D.; Shi, W.; Wang, C.; Schroth, G.P.; Setterquist, R.A.; Thompson, J.F.; et al. A comprehensive assessment of RNA-seq accuracy, reproducibility and information content by the Sequencing Quality Control Consortium. Nat. Biotechnol. 2014, 32, 903–914. [Google Scholar]
- Zhu, W.; Wang, L.; Dong, Z.; Chen, X.; Song, F.; Liu, N.; Yang, H.; Fu, J. Comparative Transcriptome Analysis Identifies Candidate Genes Related to Skin Color Differentiation in Red Tilapia. Sci. Rep. 2016, 6, 31347. [Google Scholar] [CrossRef]
- Li, H.; Cui, P.; Fu, X.; Zhang, L.; Yan, W.; Zhai, Y.; Lei, C.; Wang, H.; Yang, X. Identification and analysis of long non-coding RNAs and mRNAs in chicken macrophages infected with avian infectious bronchitis coronavirus. BMC Genomics 2021, 22, 67. [Google Scholar] [CrossRef]
- Sun, X.; Jia, B.; Qiu, X.L.; Chu, H.X.; Zhang, Z.Q.; Wang, Z.P.; Zhao, J.J. Potential functions of long non-coding RNAs in the osteogenic differentiation of human bone marrow mesenchymal stem cells. Mol. Med. Rep. 2019, 19, 103–114. [Google Scholar] [CrossRef] [PubMed] [Green Version]
- Zhang, T.N.; Wang, W.; Yang, N.; Huang, X.M.; Liu, C.F. Regulation of Glucose and Lipid Metabolism by Long Non-coding RNAs: Facts and Research Progress. Front. Endocrinol. 2020, 11, 457. [Google Scholar] [CrossRef] [PubMed]
- Lee, K.H.; Hwang, H.J.; Cho, J.Y. Long Non-Coding RNA Associated with Cholesterol Homeostasis and Its Involvement in Metabolic Diseases. Int. J. Mol. Sci. 2020, 21, 8337. [Google Scholar] [CrossRef] [PubMed]
- Nagel, D.; Vincendeau, M.; Eitelhuber, A.C.; Krappmann, D. Mechanisms and consequences of constitutive NF-kappa B activation in B-cell lymphoid malignancies. Oncogene 2014, 33, 5655–5665. [Google Scholar] [CrossRef] [Green Version]
- Guo, L.J.; Chao, X.H.; Huang, W.L.; Li, Z.H.; Luan, K.; Ye, M.; Zhang, S.Y.; Liu, M.Q.; Li, H.M.; Luo, W.; et al. Whole Transcriptome Analysis Reveals a Potential Regulatory Mechanism of LncRNA-FNIP2/miR-24-3p/FNIP2 Axis in Chicken Adipogenesis. Front. Cell Dev. Biol. 2021, 9, 653798. [Google Scholar] [CrossRef]
- Jia, X.Y.; He, C.; Jiang, W.B.; Wen, C.; Gao, F.; Jiang, G.Z.; Li, X.F.; Chi, C.; Liu, W.B.; Zhang, D.D. Identification of potential pathways whereby dietary L-tryptophan ameliorates the glucose metabolic disorder of blunt snout bream through long non-coding RNAs. Aquaculture 2021, 545, 737256. [Google Scholar] [CrossRef]
- Chen, Y.; Huang, H.-x.; Xu, C.-f.; Yu, C.-h.; Li, Y.-m. Long Non-Coding RNA Profiling in a Non-Alcoholic Fatty Liver Disease Rodent Model: New Insight into Pathogenesis. Int. J. Mol. Sci. 2017, 18, 21. [Google Scholar] [CrossRef] [Green Version]
- Xia, J.H.; Xin, L.L.; Zhu, W.J.; Li, L.; Li, C.X.; Wang, Y.F.; Mu, Y.L.; Yang, S.L.; Li, K. Characterization of long non-coding RNA transcriptome in high-energy diet induced nonalcoholic steatohepatitis minipigs. Sci. Rep. 2016, 6, 30709. [Google Scholar] [CrossRef]
- Hu, N.; Chen, C.Y.; Wang, J.H.; Huang, J.; Yao, D.H.; Li, C.L. Atorvastatin Ester Regulates Lipid Metabolism in Hyperlipidemia Rats via the PPAR-signaling Pathway and HMGCR Expression in the Liver. Int. J. Mol. Sci. 2021, 22, 11107. [Google Scholar] [CrossRef]
- Ma, Y.J.; Xu, L.Y.; Rodriguez-Agudo, D.; Li, X.B.; Heuman, D.M.; Hylemon, P.B.; Pandak, W.M.; Ren, S.L. 25-Hydroxycholesterol-3-sulfate regulates macrophage lipid metabolism via the LXR/SREBP-1 signaling pathway. Am. J. Physiol. Endocrinol. Metab. 2008, 295, E1369–E1379. [Google Scholar] [CrossRef] [Green Version]
- Li, Y.; Ding, H.; Dong, J.; Rahman, S.U.; Feng, S.; Wang, X.; Wu, J.; Wang, Z.; Liu, G.; Li, X.; et al. Glucagon attenuates lipid accumulation in cow hepatocytes through AMPK signaling pathway activation. J. Cell. Physiol. 2019, 234, 6054–6066. [Google Scholar] [CrossRef] [PubMed]
- Yao, C.G.; Pang, D.X.; Lu, C.; Xu, A.; Huang, P.X.; Ouyang, H.S.; Yu, H. Investigation on the Effect of Two Fat Metabolism Related Pathways on Intramuscular Fat Content in Pigs. Pak. J. Zool. 2021, 53, 1353–1366. [Google Scholar] [CrossRef]
- Guttman, M.; Amit, I.; Garber, M.; French, C.; Lin, M.F.; Feldser, D.; Huarte, M.; Zuk, O.; Carey, B.W.; Cassady, J.P.; et al. Chromatin signature reveals over a thousand highly conserved large non-coding RNAs in mammals. Nature 2009, 458, 223–227. [Google Scholar] [CrossRef] [PubMed]
- Ahn, J.; Lee, H.; Jung, C.H.; Ha, T. Lycopene inhibits hepatic steatosis via microRNA-21-induced downregulation of fatty acid-binding protein 7 in mice fed a high-fat diet. Mol. Nutr. Food Res. 2012, 56, 1665–1674. [Google Scholar] [CrossRef] [PubMed]
- Martyniuk, C.J.; Buerger, A.N.; Vespalcova, H.; Rudzanova, B.; Sohag, S.R.; Hanlon, A.T.; Ginn, P.E.; Craft, S.L.; Smetanova, S.; Budinska, E.; et al. Sex-dependent host-microbiome dynamics in zebrafish: Implications for toxicology and gastrointestinal physiology. Comp. Biochem. Physiol. D. 2022, 42, 100993. [Google Scholar] [CrossRef]
- Li, A.X.; Yuan, X.C.; Liang, X.F.; Liu, L.W.; Li, J.; Li, B.; Fang, J.G.; Li, J.; He, S.; Xue, M.; et al. Adaptations of lipid metabolism and food intake in response to low and high fat diets in juvenile grass carp (Ctenopharyngodon idellus). Aquaculture 2016, 457, 43–49. [Google Scholar] [CrossRef]
- Leng, X.J.; Wu, X.F.; Tian, J.; Li, X.Q.; Guan, L.; Weng, D.C. Molecular cloning of fatty acid synthase from grass carp (Ctenopharyngodon idella) and the regulation of its expression by dietary fat level. Aquacult. Nutr. 2012, 18, 551–558. [Google Scholar] [CrossRef]
- Statello, L.; Guo, C.J.; Chen, L.L.; Huarte, M. Gene regulation by long non-coding RNAs and its biological functions. Nat. Rev. Mol. Cell Biol. 2021, 22, 96–118. [Google Scholar] [CrossRef]
- Yuan, J.H.; Liu, X.N.; Wang, T.T.; Pan, W.; Tao, Q.F.; Zhou, W.P.; Wang, F.; Sun, S.H. The MBNL3 splicing factor promotes hepatocellular carcinoma by increasing PXN expression through the alternative splicing of lncRNA-PXN-AS1. Nat. Cell Biol. 2017, 19, 820–832. [Google Scholar] [CrossRef]
- Verhoeven, N.M.; Jakobs, C.; Carney, G.; Somers, M.P.; Wanders, R.J.A.; Rizzo, W.B. Involvement of microsomal fatty aldehyde dehydrogenase in the alpha-oxidation of phytanic acid. FEBS Lett. 1998, 429, 225–228. [Google Scholar] [CrossRef]


| Gene | Primer Sequence (5′-3′) | Amplicon Size | Efficiency% |
|---|---|---|---|
| MSTRG.6725.3 | F: CGTGCTTTAGACGGGCCTAT | 167 | 102.51 |
| R: TGGATGTCACAGAACCACCG | |||
| MSTRG.14598.1 | F: AGCCAATCAGAAGAGAGGTGAC | 196 | 100.97 |
| R: CAGAAACCTTCAGCAACCACTT | |||
| MSTRG.32774.1 | F: TTCACCGAGGAGAGAACCCT | 195 | 101.14 |
| R: TCTCACACAGAGGATGCGTG | |||
| MSTRG.13364.2 | F: ACCTAAAAGGCCAGTCCGTG | 200 | 105.49 |
| R: CCTCTGGGTTTATGGGTAGCAT | |||
| R: GCAACCGTTCAAAAGGAGGAC | |||
| MSTRG.43073.2 | F: CTGGGACTCTCCATCTTTTGGT | 150 | 100.90 |
| R: TACGGGTAAGCTTCTTCCACAC | |||
| MSTRG.24713.1 | F: GTGTCGATCATTCGCCCCAT | 192 | 103.44 |
| R: TCCAGCACAGTCTTCGCTTC | |||
| MSTRG.17221.1 | F: AGCAACCGTGTGTGAAAAGTG | 198 | 96.20 |
| R: AAAAACAAACACCGCTCCCG | |||
| slc25a48 | F: AATGGCACCAACATCCGTCT | 192 | 97.06 |
| R: GCAGAAGATGGCGTAAGGGA | |||
| faldh | F: CAACAGCACGGTGGGAAAAG | 185 | 95.51 |
| R: TGTAGTCTGGGGCAATGCAG | |||
| vlacs | F: GCAGAGTCCAGCAGCCTAC | 157 | 95.90 |
| R: GTGATAAAGCGGGAGGGCAT | |||
| fads2 | F: TATCAACACGCTGGACACCT | 176 | 101.86 |
| R: GCCGGGTTATCATGGTGTG | |||
| pck1 | F: GAACTGACCCGAGGGATGTG | 181 | 101.78 |
| R: GTCCTACCTCTCATGCAGCC | |||
| ehhadh | F: GCTCCGTGGGCTTGATTACT | 167 | 100.74 |
| R: CTTGATGTCTGCTCCCCCAG | |||
| fabp7a | F: TGCAGAAGTGGGATGGCAAA | 113 | 97.62 |
| R: GGCTTTCTCATACGTGCGGA | |||
| ef1α | F: ATCAAGAAGATCGGCTACAACCCT | 109 | 96.55 |
| R: ATCCCTTGAACCAGCTCATCTTGT | |||
| β-actin | F: CCACACAGTGCCCATCTACGA | 111 | 99.27 |
| R: CCACGCTCTGTCAGGATCTTCA |
| HFD Group | NFD Group | |
|---|---|---|
| lipid droplet (object/total, %) | 0.28 ± 0.01 * | 0.10 ± 0.01 |
| qRT-PCR Results (Relative Ratio) | qRT-PCR Results | RNA-Seq Results | ||||
|---|---|---|---|---|---|---|
| Type | Name | HFD Group | NFD Group | Log2 Fold Change | Log2 Fold Change | Up/Down |
| mRNA | slc25a48 | 1.58 ± 0.13 * | 0.71 ± 0.10 | 1.15 | 3.12 | Up |
| mRNA | faldh | 0.29 ± 0.05 * | 0.93 ± 0.08 | −1.68 | −2.75 | Down |
| mRNA | vlacs | 1.17 ± 0.12 * | 2.51 ± 0.30 | −1.10 | −3.18 | Down |
| mRNA | fads2 | 0.29 ± 0.04 * | 0.77 ± 0.07 | −1.41 | −2.30 | Down |
| mRNA | pck1 | 1.33 ± 0.15 * | 0.53 ± 0.13 | 1.33 | 4.29 | Up |
| mRNA | ehhadh | 0.32 ± 0.04 * | 0.90 ± 0.05 | −1.49 | −2.28 | Down |
| mRNA | fabp7a | 0.24 ± 0.04 * | 1.23 ± 0.27 | −2.36 | −5.22 | Down |
| LncRNA | MSTRG.6725.3 | 4.09 ± 0.26 * | 0.53 ± 0.09 | 2.95 | Inf | Up |
| LncRNA | MSTRG.14598.1 | 1.83 ± 0.10 * | 0.74 ± 0.06 | 1.31 | Inf | Up |
| LncRNA | MSTRG.32774.1 | 0.26 ± 0.05 * | 0.89 ± 0.15 | −1.78 | Nam | Down |
| LncRNA | MSTRG.13364.2 | 0.34 ± 0.05 * | 0.92 ± 0.09 | −1.44 | Nam | Down |
| LncRNA | MSTRG.43073.2 | 0.11 ± 0.02 * | 0.93 ± 0.10 | −3.08 | Nam | Down |
| LncRNA | MSTRG.24713.1 | 0.34 ± 0.05 * | 1.39 ± 0.12 | −2.03 | Nam | Down |
| LncRNA | MSTRG.17221.1 | 2.50 ± 0.36 * | 0.94 ± 0.06 | 1.41 | 4.98 | Up |
Publisher’s Note: MDPI stays neutral with regard to jurisdictional claims in published maps and institutional affiliations. |
© 2022 by the authors. Licensee MDPI, Basel, Switzerland. This article is an open access article distributed under the terms and conditions of the Creative Commons Attribution (CC BY) license (https://creativecommons.org/licenses/by/4.0/).
Share and Cite
Tao, Y.; Lu, S.; Zheng, T.; Li, M.; Qiang, J.; Xu, P. RNA-Seq Analysis of the Key Long Noncoding RNAs and mRNAs Related to the Regulation of Hepatic Lipid Metabolism in Oreochromis niloticus. Fishes 2022, 7, 332. https://doi.org/10.3390/fishes7060332
Tao Y, Lu S, Zheng T, Li M, Qiang J, Xu P. RNA-Seq Analysis of the Key Long Noncoding RNAs and mRNAs Related to the Regulation of Hepatic Lipid Metabolism in Oreochromis niloticus. Fishes. 2022; 7(6):332. https://doi.org/10.3390/fishes7060332
Chicago/Turabian StyleTao, Yifan, Siqi Lu, Tao Zheng, Mingxiao Li, Jun Qiang, and Pao Xu. 2022. "RNA-Seq Analysis of the Key Long Noncoding RNAs and mRNAs Related to the Regulation of Hepatic Lipid Metabolism in Oreochromis niloticus" Fishes 7, no. 6: 332. https://doi.org/10.3390/fishes7060332