Article

Multi-Omics Data Reveal Amino Acids Related Genes in the Common Carp Cyprinus carpio

1
Key Laboratory of Aquatic Genomics, Ministry of Agriculture and Rural Affairs, Beijing Key Laboratory of Fishery Biotechnology, Chinese Academy of Fishery Sciences, Beijing 100141, China
2
National Demonstration Center for Experimental Fisheries Science Education, Shanghai Ocean University, Shanghai 201306, China
3
State Key Laboratory of Marine Environmental Science, College of Ocean and Earth Sciences, Xiamen University, Xiamen 361102, China
4
Henan Academy of Fishery Sciences, Zhengzhou 450044, China
5
College of Life Sciences, Henan Normal University, Xinxiang 453007, China
6
Fisheries Engineering Institute, Chinese Academy of Fishery Sciences, Beijing 100141, China
*
Author to whom correspondence should be addressed.
These authors contributed equally to this work.
Fishes 2022, 7(5), 225; https://doi.org/10.3390/fishes7050225
Submission received: 12 July 2022 / Revised: 18 August 2022 / Accepted: 22 August 2022 / Published: 29 August 2022
(This article belongs to the Special Issue Omics in Fish Aquaculture and Fisheries)

Abstract

:
Amino acids have important physiological effects on fish growth and development and are essential nutrition for humans. Flavor-related amino acids, such as glutamic acid and glycine, could have a significant effect on the taste of fish flesh. However, studies on the genetic mechanisms of amino acid metabolism in common carp (Cyprinus carpio) are still limited. This study identified divergent patterns on the genomic, transcriptomic and epigenomic levels in two groups of common carp with different amino acid contents. After genome-wide association analysis, a total of 62 genes was found to be associated with glycine, proline and tyrosine content. Transcriptome analysis of essential amino acids, branched-chain amino acids and flavor-related amino acids were performed using brain, liver and muscle tissues, resulting in 1643 differentially expressed genes (DEGs). Whole-genome bisulfite sequencing identified 3108 genes with differentially methylated promoters (DMPs). After the enrichment analysis, a series of pathways associated with amino acid metabolism, including growth regulation, lipid metabolism and the citrate cycle, was revealed. Integrated studies showed a strong correlation between DEGs and DMPs for amino acid contents in brain and muscle tissues. These multi-omics data revealed candidate genes and pathways related to amino acid metabolism in C. carpio.

1. Introduction

Common carp (Cyprinus carpio) is one of the most widely cultured freshwater fishes all over the world. Most C. carpio are cultured in China, with an annual production of around three million tons [1]. There are numerous variants of carp in China with different genetic characteristics, such as Yellow River carp, Songpu mirror carp, Hebao red carp, Xingguo red carp, Oujiang color carp and other strains [2]. Among these, the Yellow River carp occupies an important position in Chinese aquaculture due to its high nutritional value. The composition and content of amino acids are key factors affecting growth, development and health, as well as the nutritional value and taste of the Yellow River carp [3,4].
Amino acids are traditionally divided into nonessential (NEAAs) and essential amino acids (EAAs), according to whether the organism can or can not synthesize them in vivo from food resources, respectively. Among both mentioned groups, arginine, cysteine, leucine, methionine, tryptophan, tyrosine, aspartate, glutamic acid, glycine, proline and taurine have been defined as functional amino acids (FAAs) in human nutrition [5]. FAAs, which could influence health, survival, growth, development, cell signaling, immune response and reproduction of organisms by modulating key metabolic pathways, have received increasing attention in recent years [6]. Among FAAs, branched-chain amino acids (BCAAs, including leucine, valine and isoleucine) regulate many key signaling pathways, such as the activation of the mTOR signaling pathway, lypolysis and glucose consumption [7]. BCAAs, especially leucine, improve the capacity for muscle protein synthesis through insulin-dependent and insulin-independent pathways [8]. Aspartic acid, glutamic acid, glycine and alanine, which have significant effects on the fish umami taste, are called flavored amino acids (FLAs).
In addition to the effects on meat quality and taste, the composition and content of amino acids are of great biological significance [9]. Fish growth is largely regulated by hormones and nutritional levels of available essential amino acids within a complex regulatory network. Because of major roles of the growth hormone (GH) and insulin-like growth factors (IGFs) in the regulatory pathways of somatic growth, amino acids can directly or indirectly act upon the GH/IGF growth axis, thereby affecting the fish growth rate [10]. Moreover, a-ketoacid, the catabolic product of amino acid metabolism, is regulated by the metabolic pathways of sugars or lipids with different characteristics [11]. Previous studies have found that the protein content of most fishes is 15–25.5% of the total mass, and the content of EAAs accounts for 20–50% of the total amino acid content [9,12]. The quality of food protein is determined by amino acid composition and content. EAAs are obtained from the diet, and each amino acid plays different roles in an organism’s metabolism. A recent study demonstrated that differences in amino acid composition in fish muscle are under genetic control [13]. Unfortunately, due to the complexity of amino acid traits, it is difficult to significantly enhance the nutritional composition of fish by traditional breeding strategies.
Multi-omic studies usually combine two or more types of omics data, such as transcriptomics, genomics, epigenetics, proteomics and metabolomics, enabling for the discovery and exploration of some important biological phenomena in teleosts. To examine the molecular mechanisms of cold tolerance in the pufferfish (Takifugu fasciatus), Wen et al. integrated mRNA-Seq and metabolomics of liver tissue to characterize an mRNA-protein-metabolite interaction network associated with cold tolerance; their study identified differentially expressed metabolites, genes and proteins involved in membrane transport, fatty acid metabolism and signal transduction [14]. These results indicated that nutrient substances could be added to the feed to help the overwintering of T. fasciatus. Wei et al. integrated transcriptomic and metabolomic analyses of flesh quality in the large yellow croaker (Pseudosciaena croce); their results showed that feeding dietary hydroxyproline could improve flesh quality through changes in comprehensive metabolic pathways, including lipid metabolism, collagen synthesis metabolism and glycolysis [15]. A multi-omics analysis of the dynamics of muscular metabolites in the leopard coral grouper (Plectropomus leopardus) that combined transcriptomic and metabolomic methods indicated that branched-chain amino acids played a role in energy production in muscle tissue during the fasting period [16]. Zhang et al. conducted DNA methylation sequencing and comparative transcriptome analyses that uncovered the molecular mechanisms of body color variation in the crucian carp (Carassius carassius) [17]. Integrating the methods of GWAS, transcriptome and methylation analyses, Zhang et al. identified candidate genes and pathways associated with fatty acid metabolism in C. carpio [4]. Despite these results from previous studies, the gene regulatory network of amino acid metabolism remains obscure due to insufficient multi-omic evidence. Here, we conducted a multi-omics analysis of the muscular amino acid content in the common carp, which originated from the Yellow River carp breeding strain and is valuable for Chinese aquaculture, using genomic, transcriptomic and epigenomic data. This study demonstrates the potential metabolic mechanisms of amino acids in C. carpio and provides an experimental foundation for improving the meat quality of C. carpio by genome-assisted breeding.

2. Materials and Methods

2.1. Sample Collection

A total of 199 individuals of C. carpio was randomly collected from broodstock kept in the Henan Academy of Fishery Sciences, Henan, China. All the experimental fish were reared under the same conditions and fed with the same commercial diet (Qingdao Saigelin Aquatic Products Technology Co., Ltd., Qingdao, China). The statistical power calculations by the genome-wide complex trait analysis (GCTA) [18], confirmed that the number of fishes sampled is suitable for GWAS analysis. All fishes were euthanized in MS222 solution before sampling. From each individual, a blood sample was taken for molecular analysis. Dorsal muscle tissue was obtained for amino acid content determination. Moreover, brain, liver and muscle tissues from 20 randomly sampled C. carpio were subjected to RNA extraction.

2.2. The Determination of Amino Acids Content

The hydrochloric acid hydrolysis method was used to determine the amino acid content in the sampled muscle tissues from the examined fish. Briefly, a 0.2-g muscle sample was weighted and put in a hydrolytic tube. Thereafter, 16 mL of 6 M hydrochloric acid was added, and the vacuum was degassed for 30 min, then sealed with nitrogen and hydrolyzed at 110 °C for 24 h. After the hydrolysis process, the samples were cooled down to room temperature, and the lysates were transferred to a 50-millileter volumetric flask. Then, the flasks were filled up to 50 mL by deionized water. The diluted lysates were subsequently filtered through a 0.22-micrometer filter and proceeded to HPLC measurement. The column used was filled with octadecylsilane-bonded silica gel. The flow rate was 1.0 mL per minute, while the column temperature was 40 °C with the detection wavelength at 254 nm. Mobile phase A was 100 mM sodium acetate at pH 6.5; B was 80% acetonitrile and 20% Milli-Q water. The column was suspended in a water bath at 35 °C. Derivatization of the standards and samples has been conducted using the phenyl isothiocyanate (PITC) method [19]. The gradient conditions used are shown in Table 1. All data analyses were performed using STATISTICA Six Sigma [20].

2.3. Single Nucleotide Polymorphism Genotyping

The genomic DNA was extracted from the 199 blood samples using the DNeasy Blood and Tissue kit (Qiagen, Shanghai, China) following the manufacturer’s instructions. The quality and concentration of DNA were examined using 1.2% agarose gel electrophoresis and spectrophotometer (Nanodrop-2000, Hudson, MA, USA). All the qualified DNA samples were normalized to 50 ng/μL for genotyping. Single nucleotide polymorphism (SNP) genotyping was conducted using a previously developed common carp 250 K SNP array based on the Affymetrix Axiom genotyping platform [2]. The genotyping and quality control were conducted following previously reported procedures [4].

2.4. Genome-Wide Association Analysis

TASSEL version 5.0 software [21] was applied for the genome-wide association analysis of amino acid content using the genotyping data. The significant p-value threshold was set to 5.241 × 10⁻⁷ based on the calculation of significance divided by the total number of SNPs identified by genotyping. The SNPs associated with amino acid content were screened out using the threshold p-value. The Manhattan, Q–Q and SNP density plots were produced by the CMplot package (https://github.com/YinLiLin/CMplot, accessed on 14 August 2020).

2.5. Transcriptome Sequencing and Differential Expression Analysis

Brain, liver and muscle tissues of 20 fish were used to perform RNA sequencing focusing on the three respective traits—EAA, BCAA and FLA contents—under RNase-free conditions. Three individuals each were selected for the minimum and maximum values of EAA, BCAA and FLA, separately. Total RNA was isolated from the sampled tissues using the Trizol method. The quantity and purity of extracted RNA were determined by spectrophotometer (Nanodrop-2000, Hudson, MA, USA) and RNA quality was examined by 1.5% agarose gel electrophoresis. A cDNA library was constructed based on the NEBNext Ultra RNA Library Prep Kit for Illumina (NEB, Ipswich, MA, USA) according to the manufacturer’s instructions. Paired-end 150 bp sequencing was performed using an Illumina HiSeq2500 platform (Illumina, San Diego, CA, USA).
Low-quality reads and adaptors were removed using Trimmomatic v.0.32 [22]. A Bowtie index was built using Bowtie2 v.2.3.4.2 [23], and Tophat2 was used to align transcriptome data to a common carp reference genome (PRJNA510861) [24]. Samtools [25] was applied to index the bam files, and Cufflinks [26] was applied to assemble individual transcripts from RNA-Seq data. Individual transcripts were then merged using Cuffmerge to generate an integrated assembly. Based on the Fragments Per Kilobase of exon model per Million mapped fragments (FPKM), differentially expressed transcripts were identified using Cuffdiff. Volcano plots showing the differentially expressed genes were constructed using the ggplot2 package in R [27]. The genes with log2 fold change >1 and q-value < 0.05 were identified as significantly differentially expressed genes. The heatmaps were constructed by the pheatmap package in R. The relationships between Gene Ontology (GO) pathways enriched by differentially expressed genes were demonstrated by the Cytoscape software [28].

2.6. DNA Methylation Sequencing and Differential Methylation Analysis

The genomic DNA was used for whole-genome bisulfite sequencing (WGBS). The genomic DNA was sonicated with sodium sulfite, which first converted unmethylated cytosine to uracil and then to thymine [29]. WGBS was conducted according to a previously reported method [4]. Bismark [30] was applied to align the methylation data to the reference genome, and swDMR [31] was used to analyze the differentially methylated regions (DMR) through a sliding-window method. The process of DMR detection and annotation followed protocols that were previously reported [4,14]. A sliding window with window size of 1 kb and step size of 100 bp was used for statistical analysis. Then, the Benjamini–Hochberg FDR-corrected p-value (q-value) < 0.1 and log2 fold change (FC) value > 1 were considered as potential DMRs. Two potential DMRs were merged if their distance was less than the threshold. The merged DMRs were tested by previous steps, and this extension step was repeated until the p-value > 0.1, resulting in candidate DMRs. Candidate DMRs in promoter regions (DMP) were focused upon for further analysis.
An analysis of the correlation of differentially expressed genes and differentially methylated promoters (DEGs and DMPs) identified by RNA-Seq and WGBS analysis was conducted. According to the Log2(FC) of DEG and the ratio of differentially methylated promoters (Methyl_Ratio_Diff of DMP), negatively correlated and positively correlated genes were identified. The correlation analysis results of DEG and DMP were visualized using the R package ggplot2.

3. Results

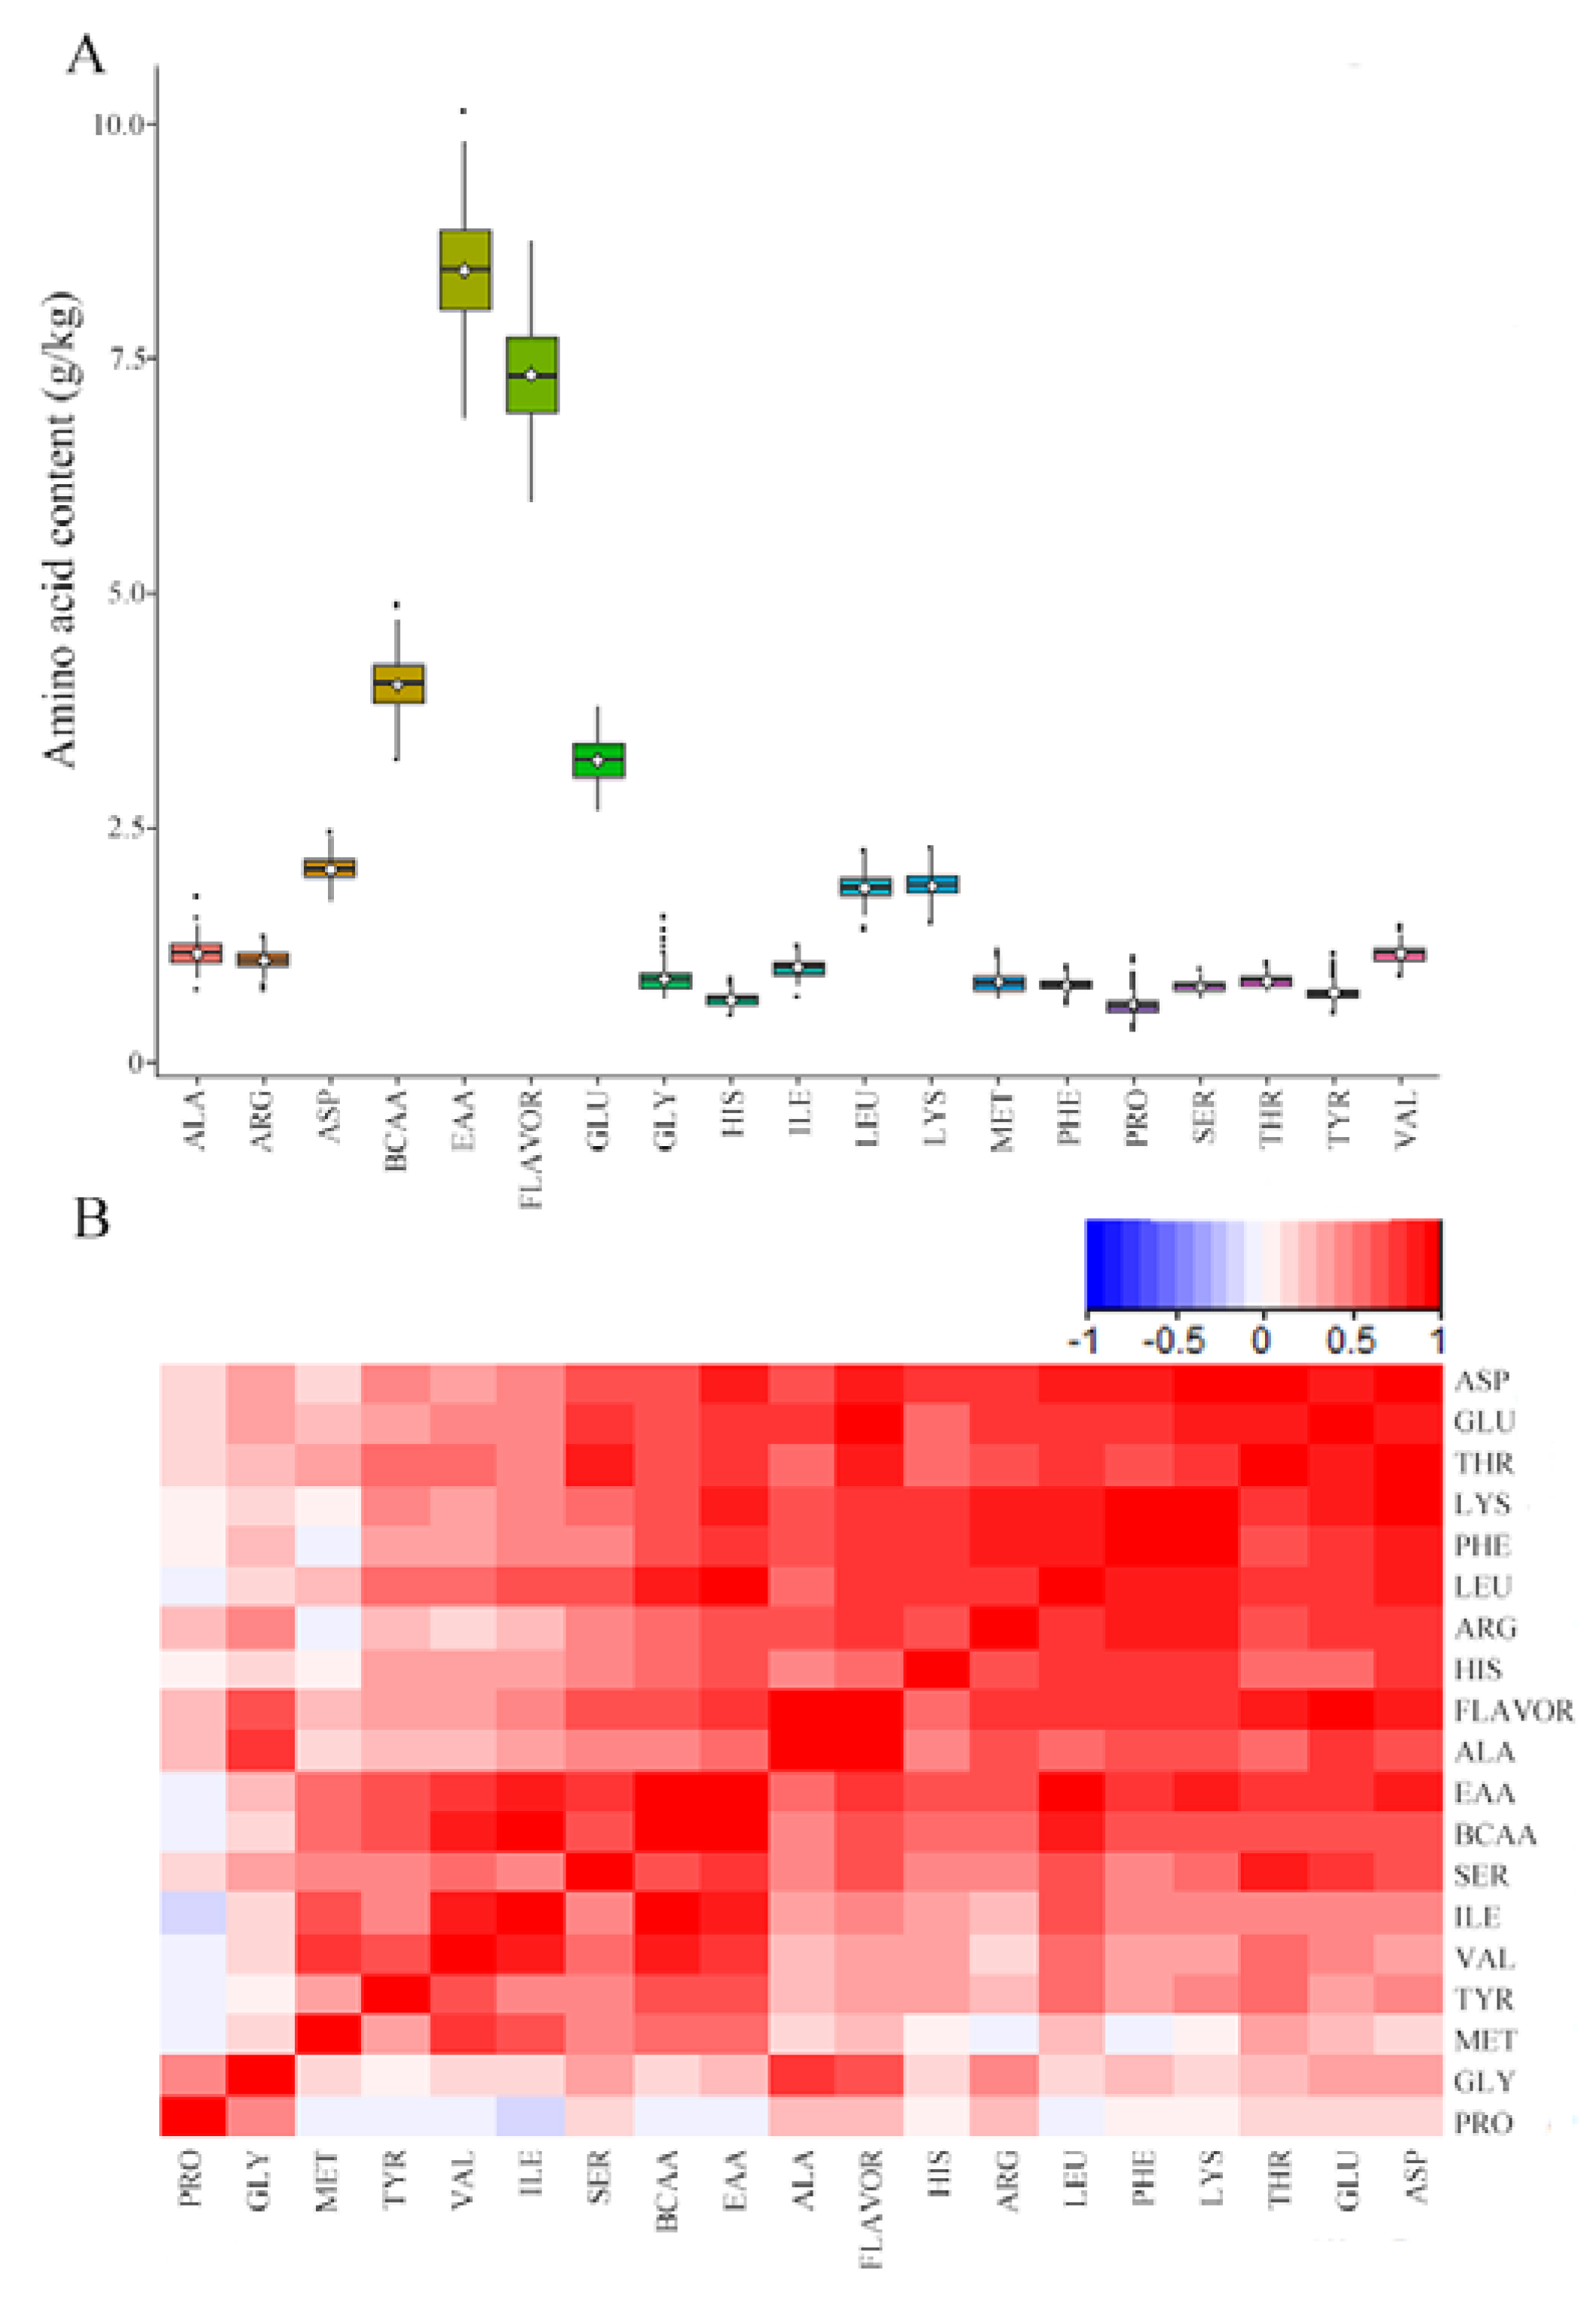
3.1. Genotyping and Phenotyping of C. carpio Samples

Based on previous work [2,4,32], 199 individuals were randomly sampled from a farmed broodstock of C. carpio. The raw genotyping data with 184,978 SNPs for each sampled fish were obtained from SNP genotyping. A total of 95,400 polymorphic SNPs from 195 samples passed the quality control threshold. As shown in Figure 1A and Table S1, the contents of glutamic (GLU), aspartic (ASP), leucine (LEU) and lysine (LYS) accounted for a relatively large proportion of the total amino acid content, and the distribution of the other 16 amino acids was relatively balanced. To discover the potential relationships among multiple traits, the contents of 19 amino acids were visualized using the correlation heatmap shown in Figure 1B. GLU, ASP, THR, LYS and PHE contents were significantly associated with each other, possibly indicating similar functions within the amino acid content regulating mechanism.

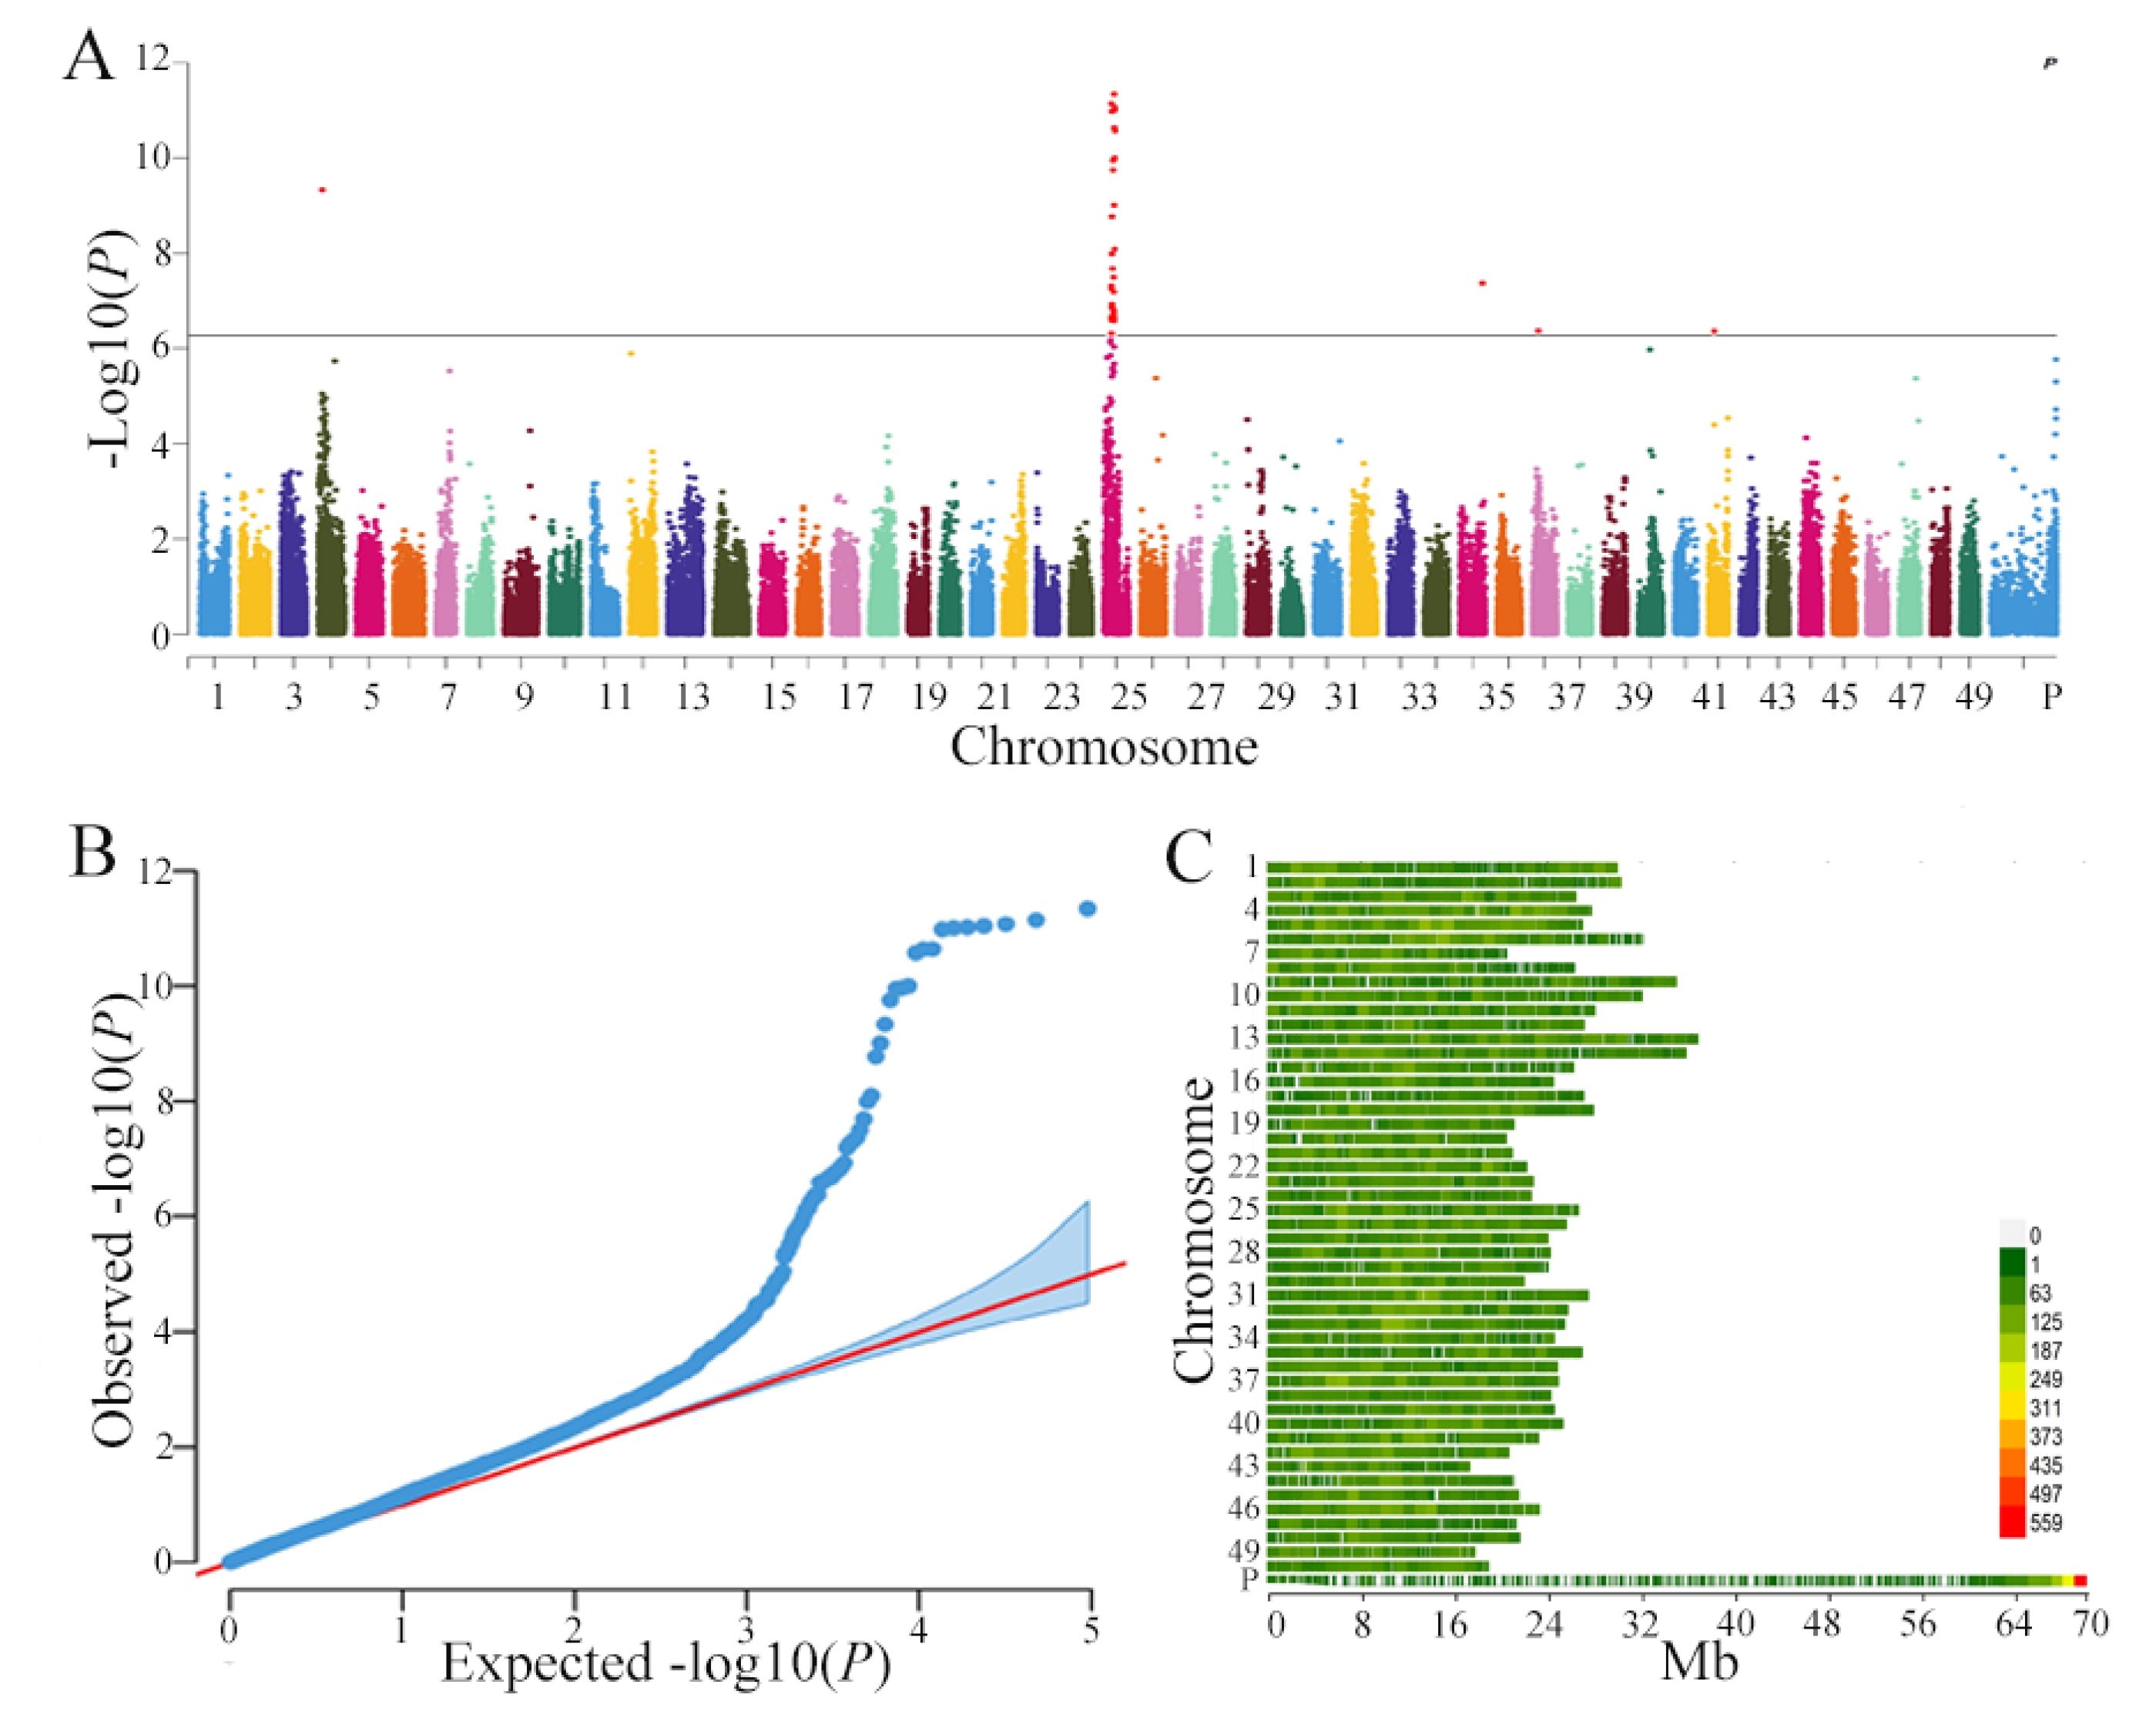
3.2. Genome-Wide Association Analysis

In total, thirty-six, six, and one SNPs were identified for glycine (GLY), proline (PRO) and tyrosine (TYR) content, respectively, with a threshold of p < 5.241 × 10⁻⁷ (Table S2). The Manhattan plot showed the most promising results for GLY content, while the Q–Q plot indicated the reliability of the data analysis (Figure 2A,B). Among the 36 SNPs associated with GLY content in C. carpio, 32 were located on chromosome 25. Two SNPs (carp102954 and carp102953) were located within the intron and exon regions of the glud1 (glutamate dehydrogenase 1) gene. Similar results for PRO and TYR content are shown in Figure S1. The distribution of all the SNPs identified by genotyping on each chromosome is shown in Figure 2C, which shows the relatively even distribution among all the chromosomes. Genes were annotated through the new common carp genome [33], and fifty-four, ten and one genes were identified as critical for the GLY, PRO and TYR traits, respectively.

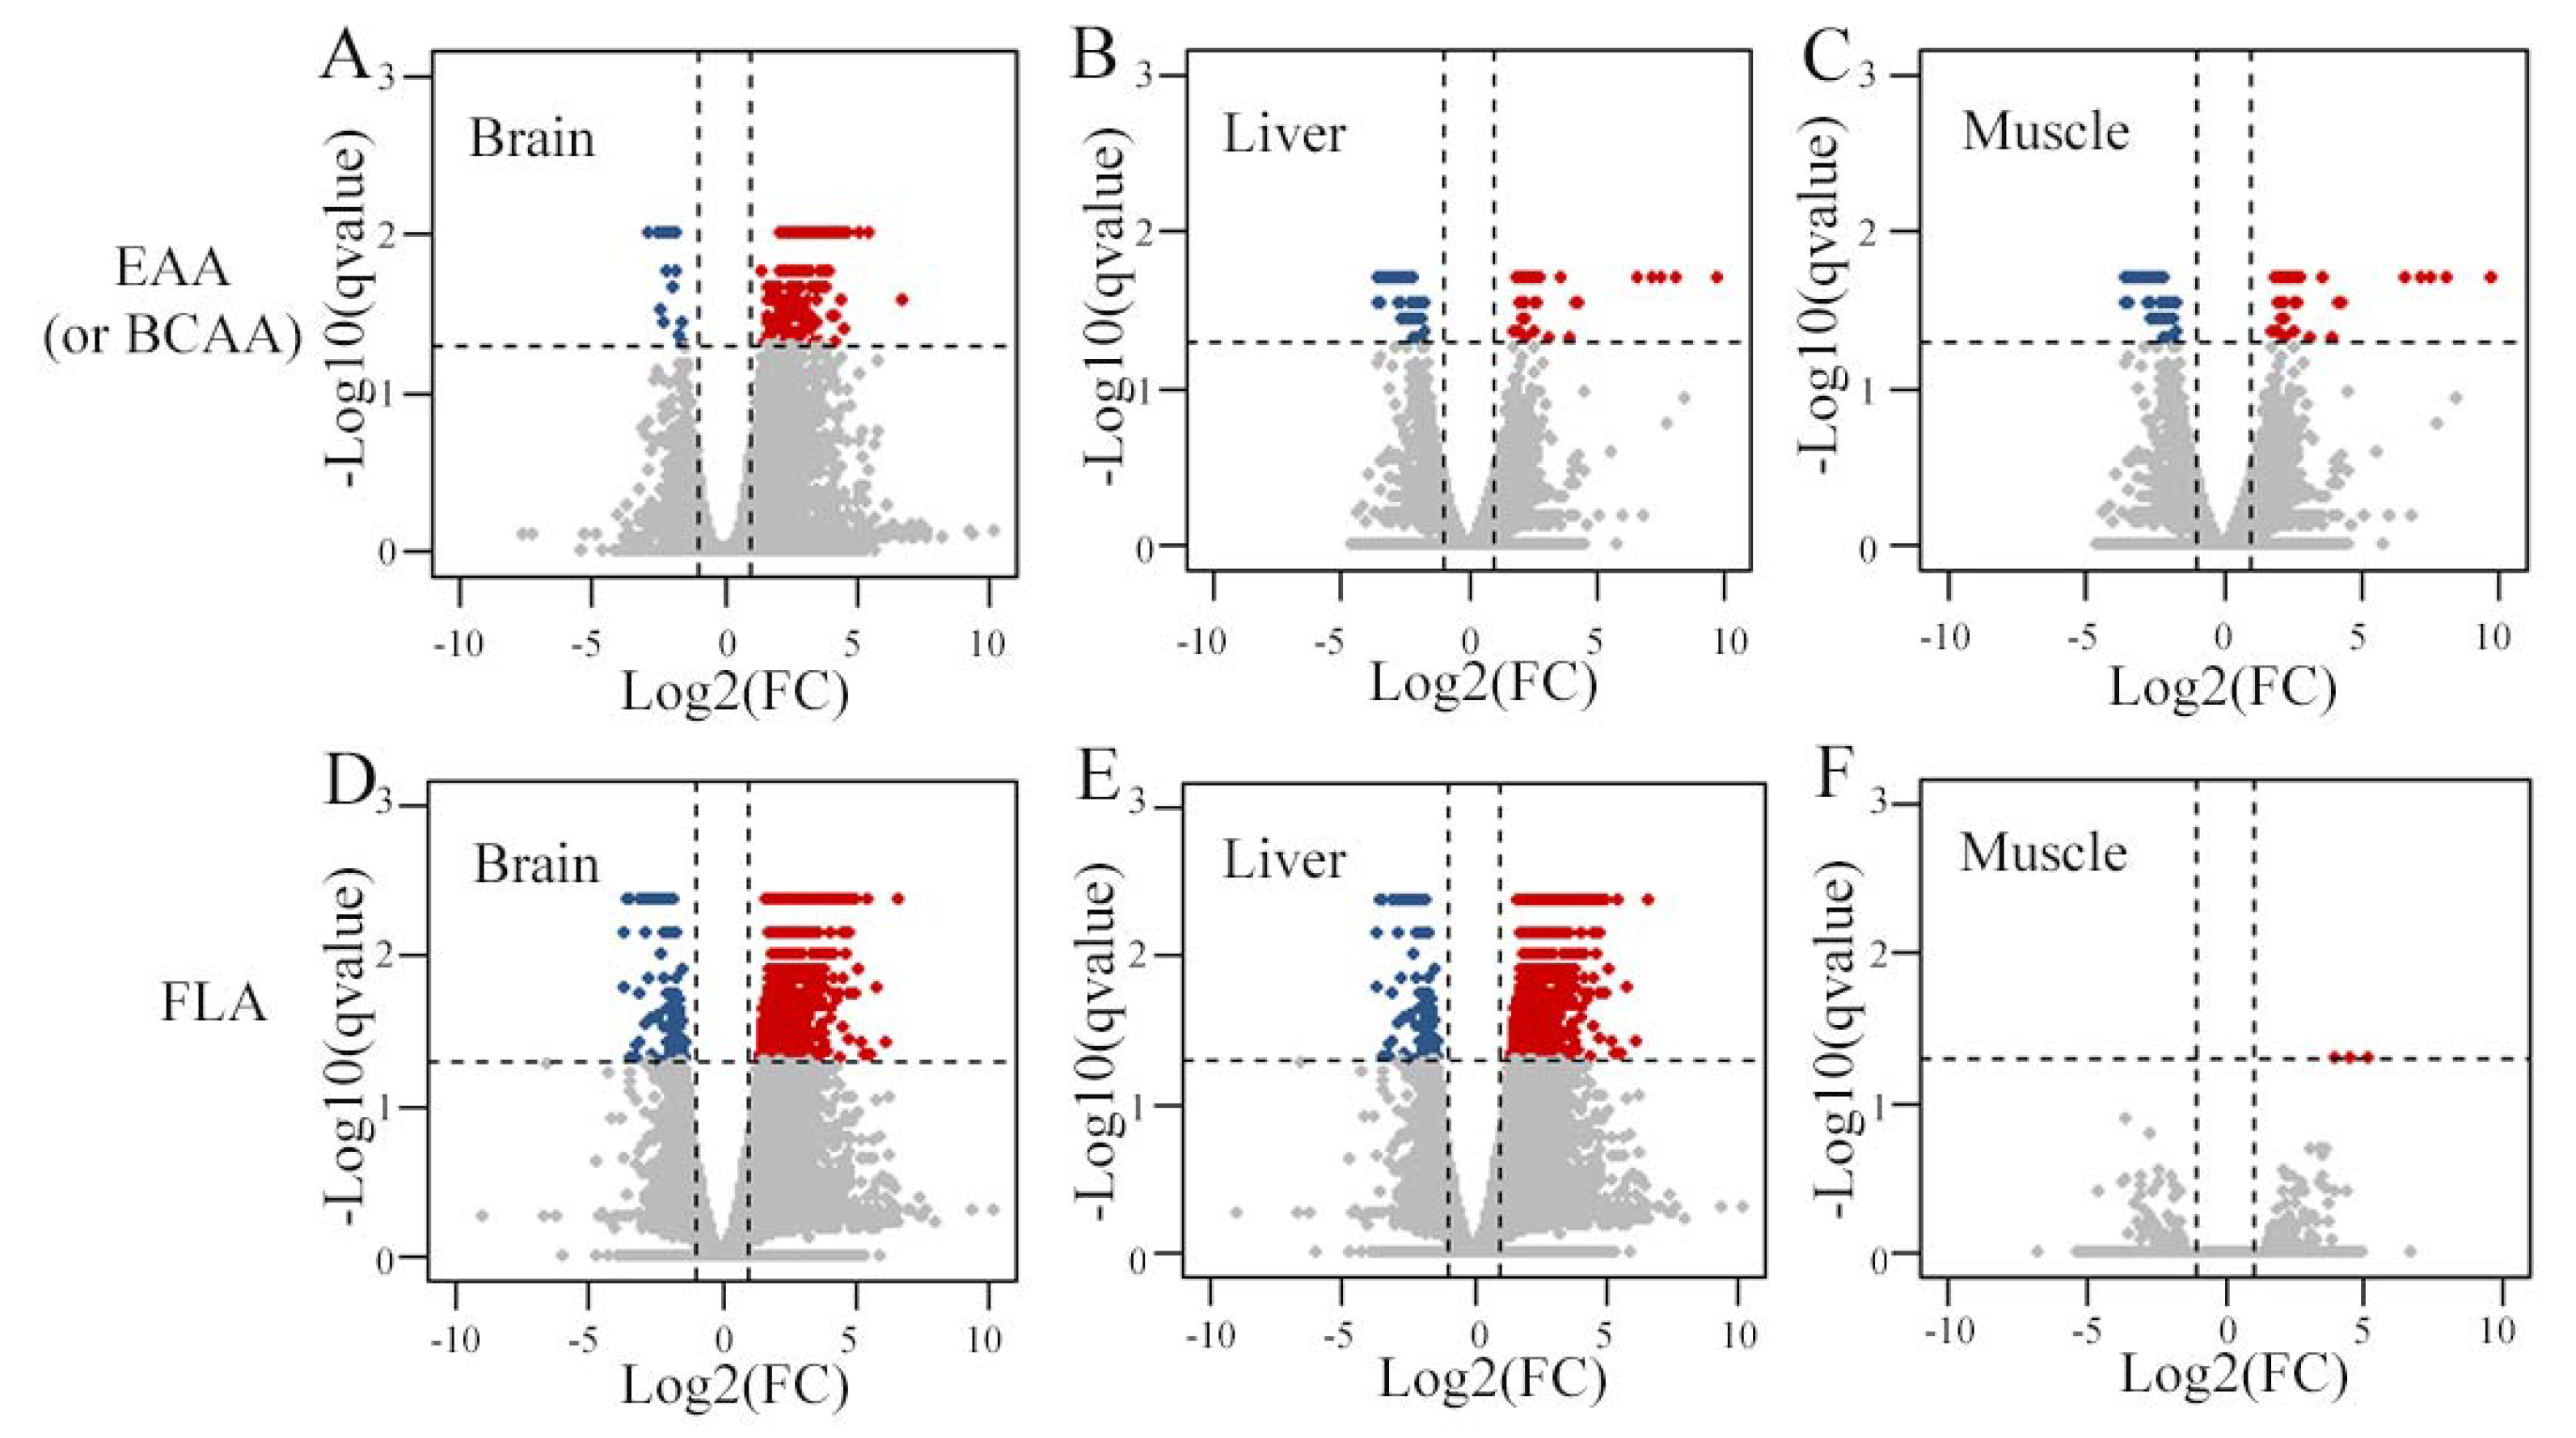
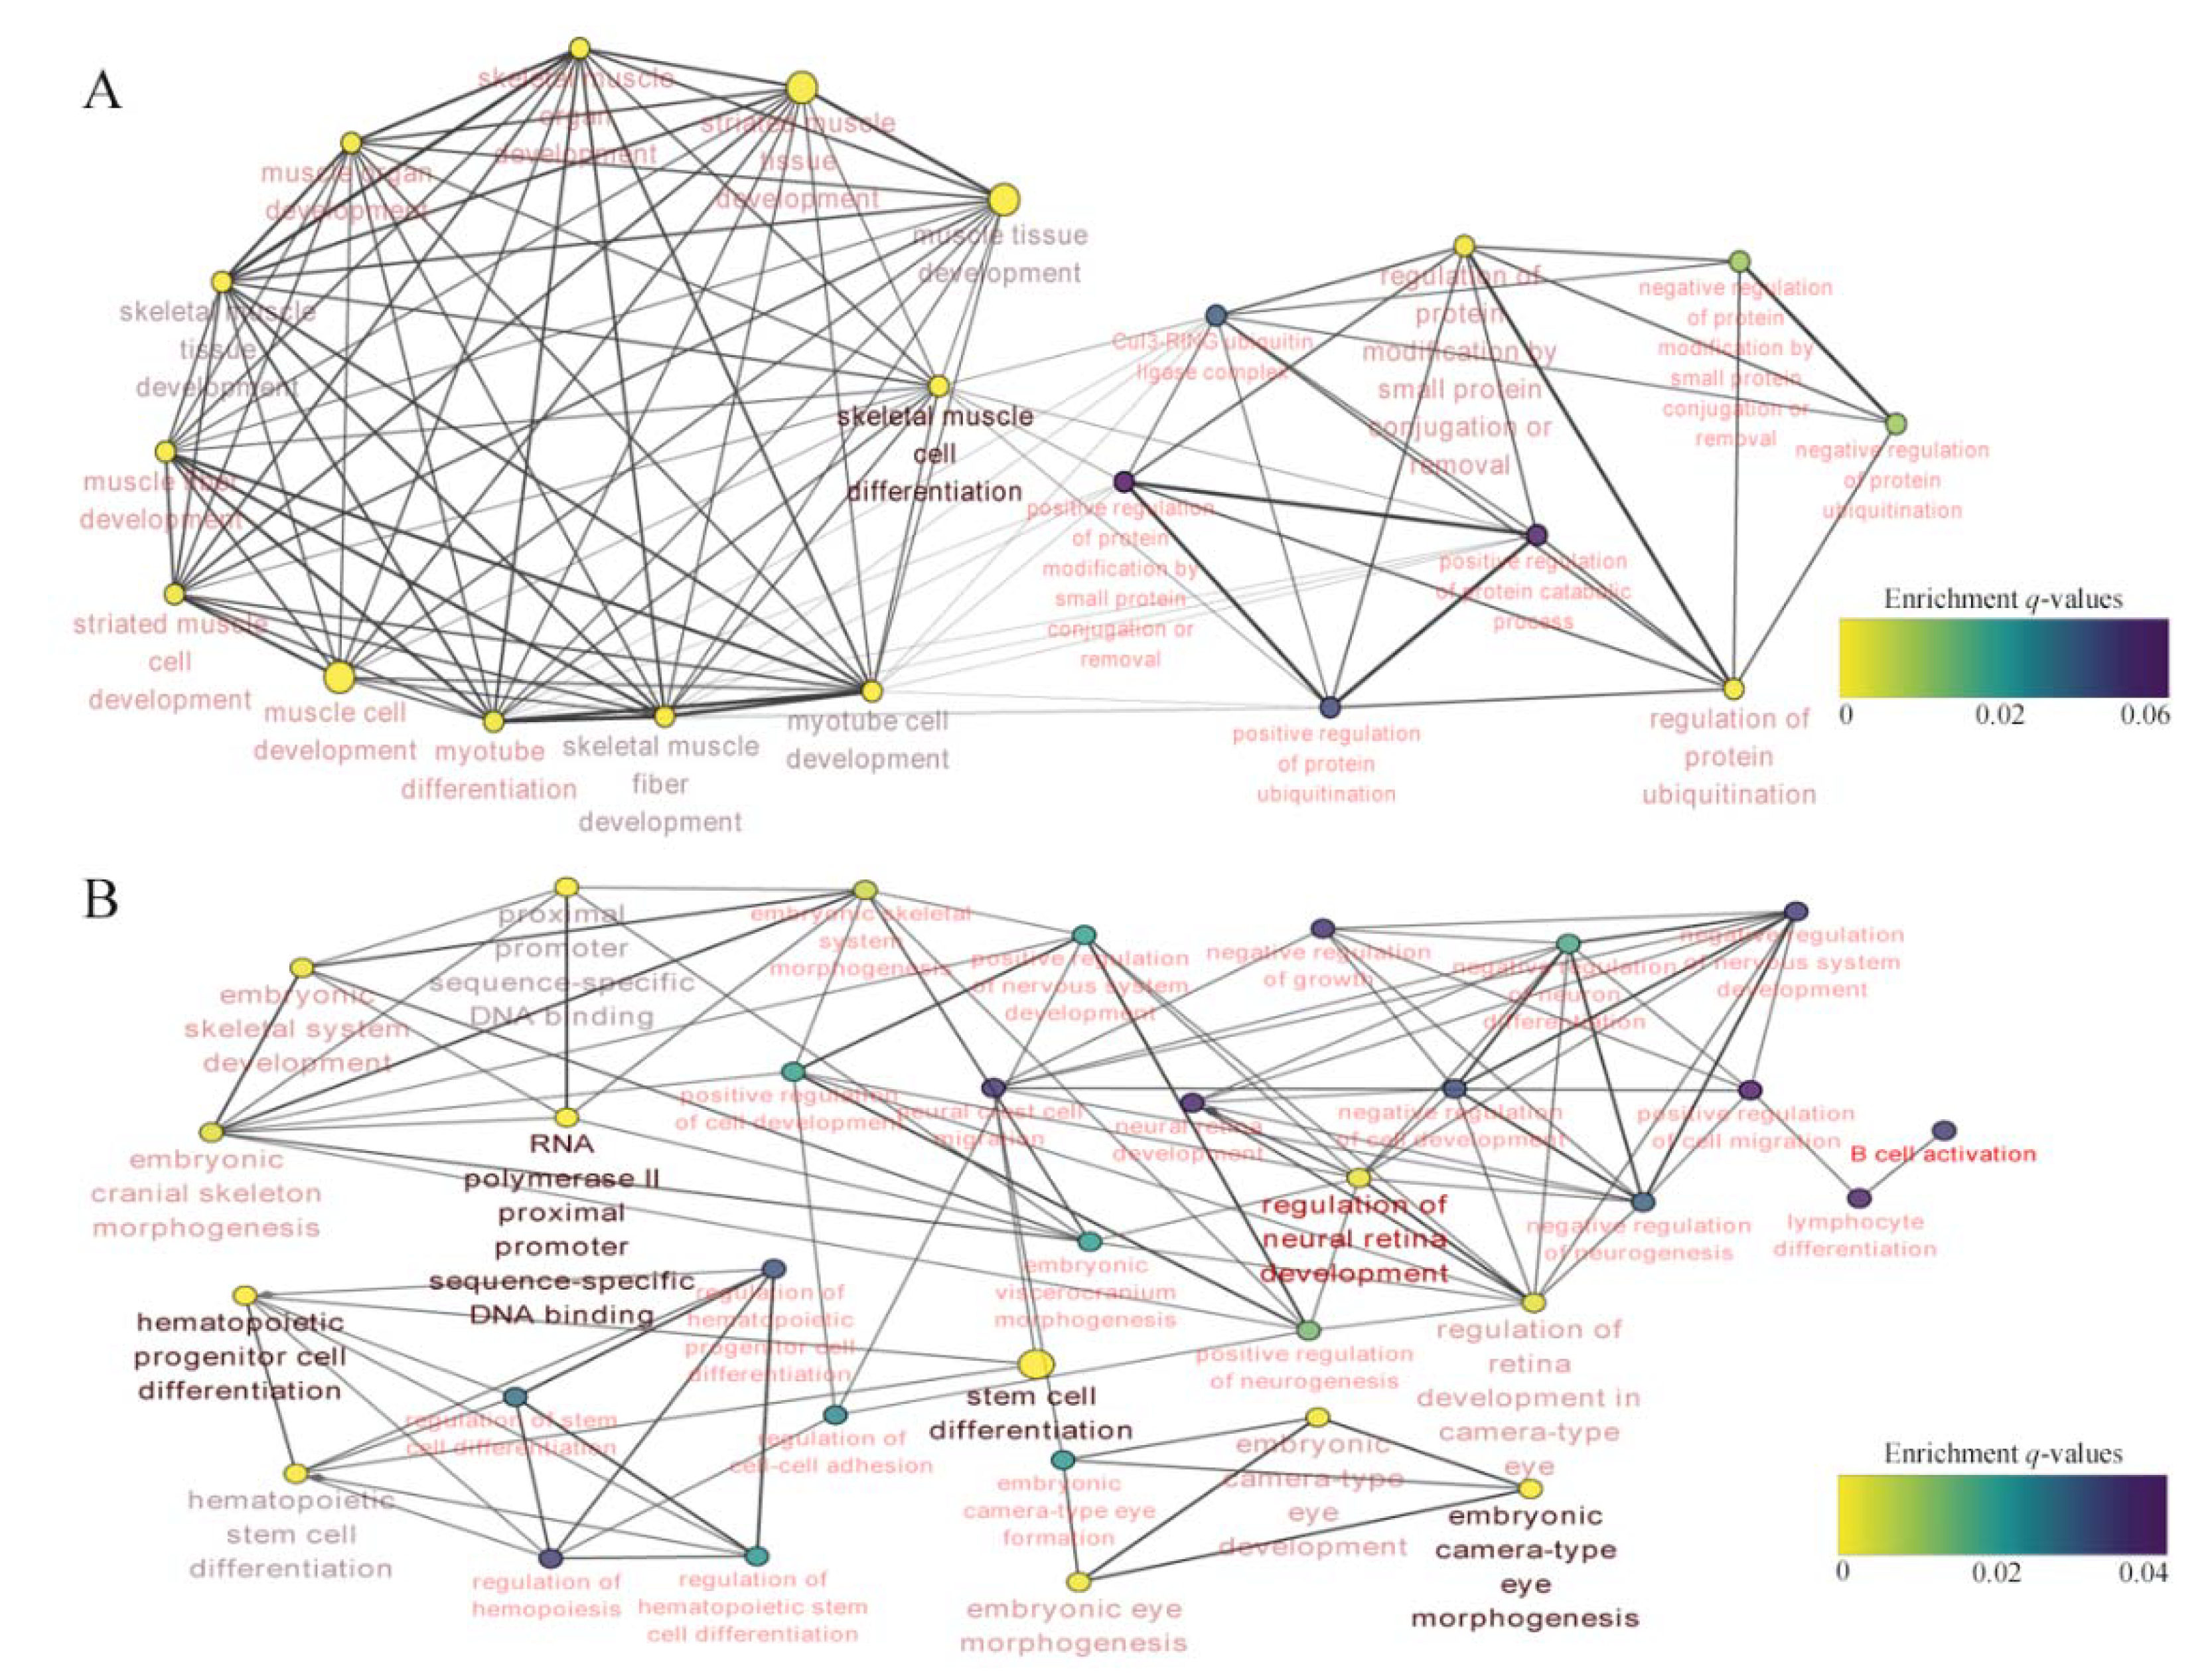
3.3. Transcriptomic Analysis of Divergent Amino Acid Content

The EAA, BCAA and FLA contents of the 20 samples are presented in Table S3. Taken from our previously published data, the quality of RNA sequencing data is shown in Tables S4 and S5. As EAA and BCAA contents were highly correlated, these two traits were integrated as one group in the following analyses. Plenty of differentially expressed genes were found for the trait EAA (or BCAA), with 236, 81 and 960 DEGs in brain, liver and muscle tissues, respectively (Figure 3A–C and Tables S6, S8 and S10). Results of cluster analyses of the differentially expressed genes for EAA (or BCAA) in three tissues are shown in Figure 4A and Figure S2. For the analysis of the FLA trait, 818, 74 and 3 differentially expressed genes were found in the three tissues, respectively (Figure 3D–F; Tables S6, S8 and S10). The cluster studies of the differentially expressed genes for FLA in three tissues are shown in Figure 4B and Figure S2. The network analyses of differentially expressed genes for the three classified amino acids in multiple tissues are shown in Figures S3–S7 and Tables S7, S9 and S11. The network of GO enrichment pathways is illustrated in Figure 5 and Figures S8 and S9 and Tables S12 and S13, while results of the KEGG enrichment analysis are shown in Table S14.

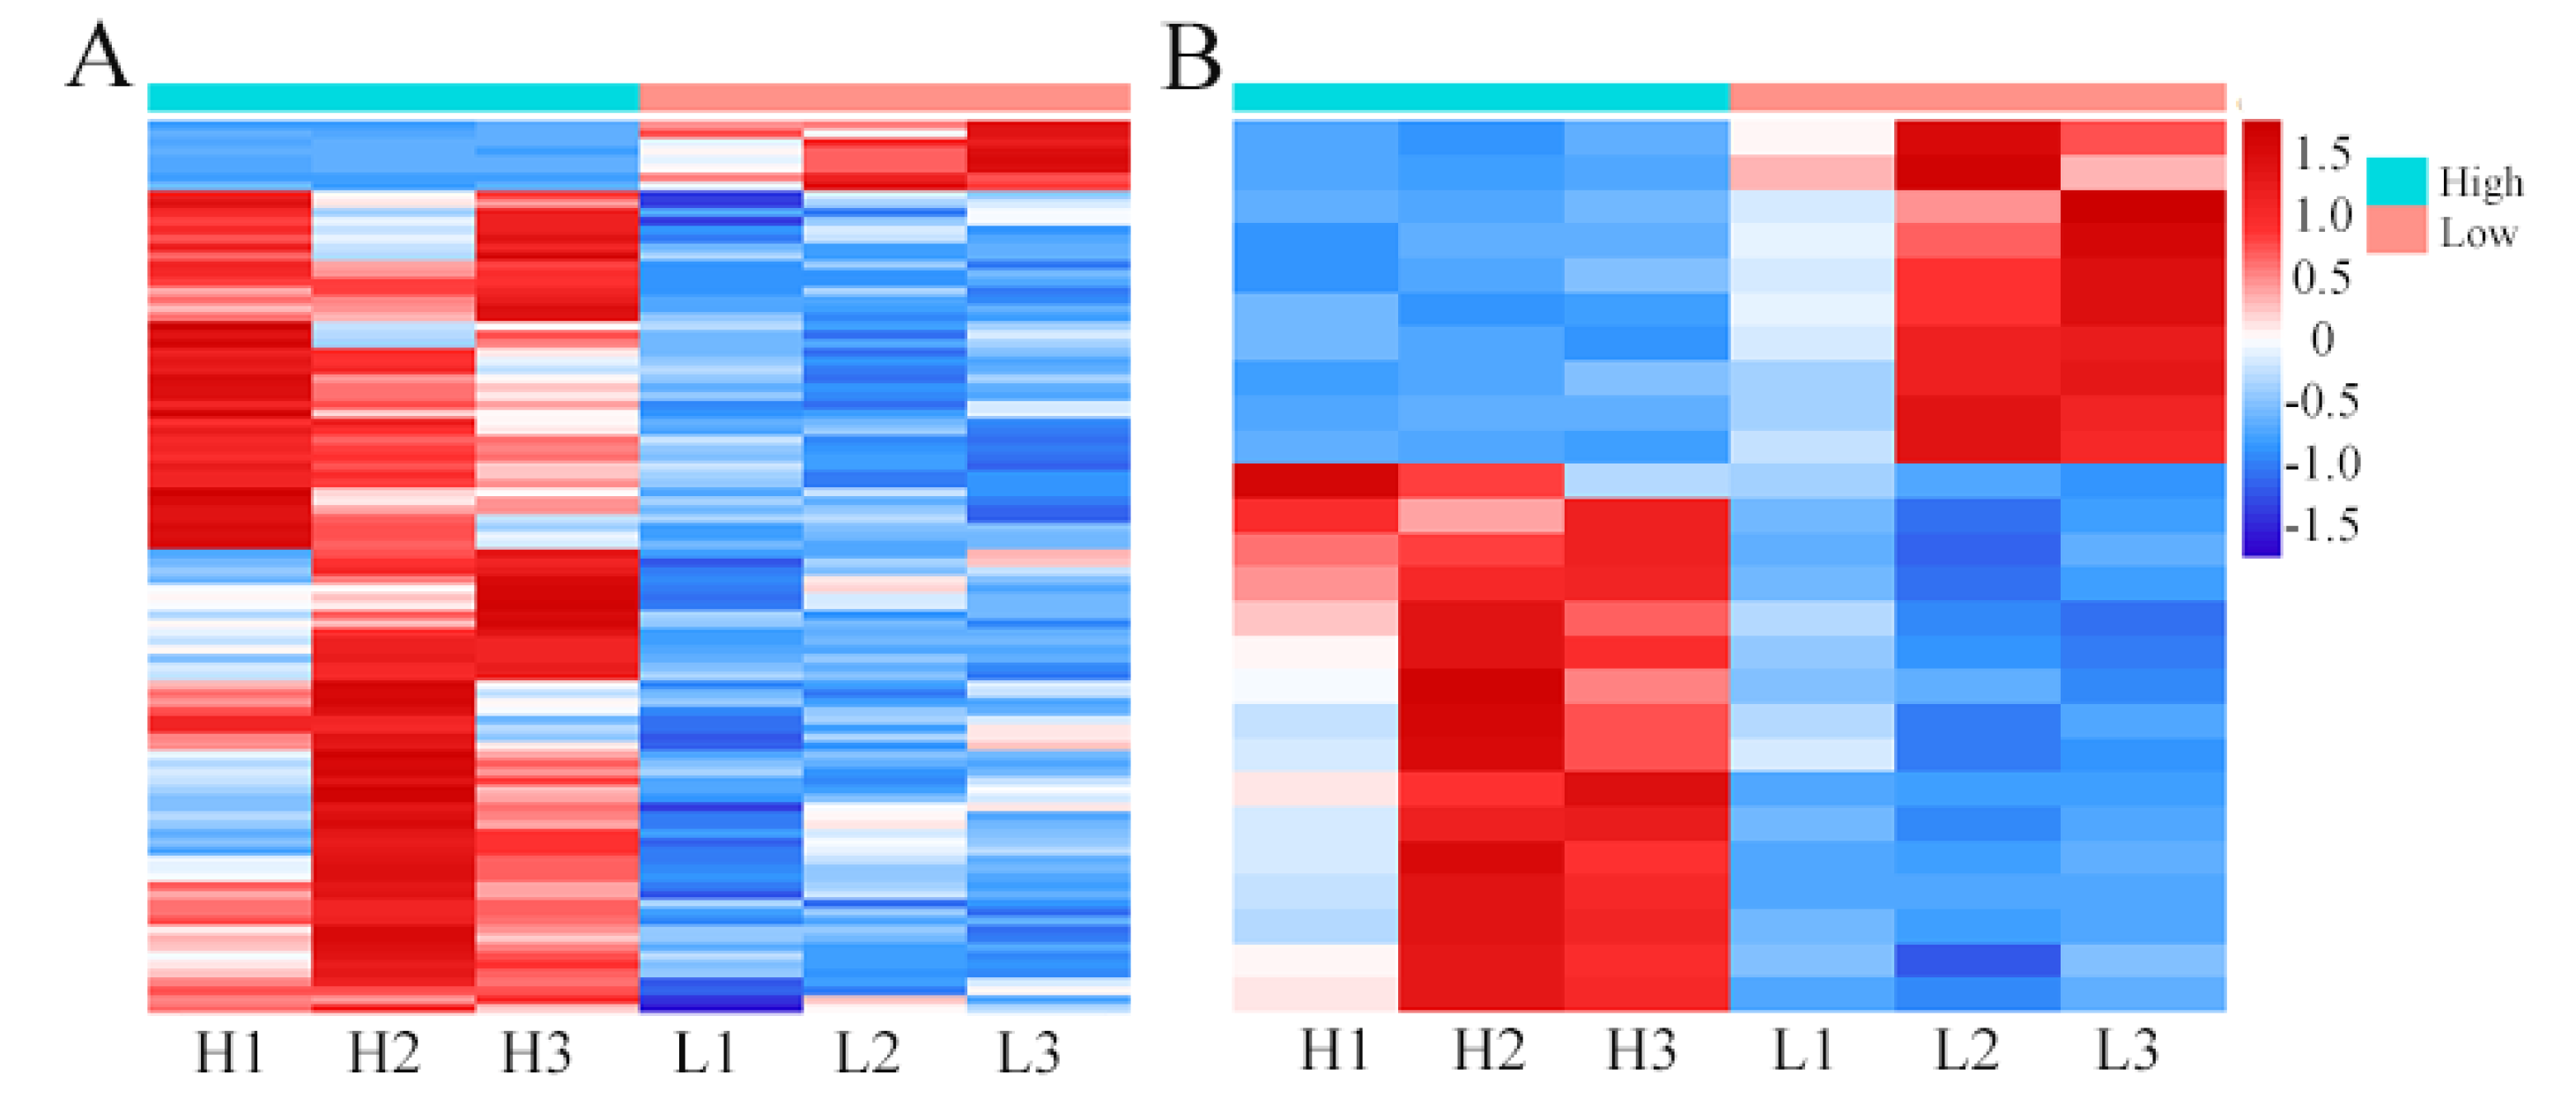
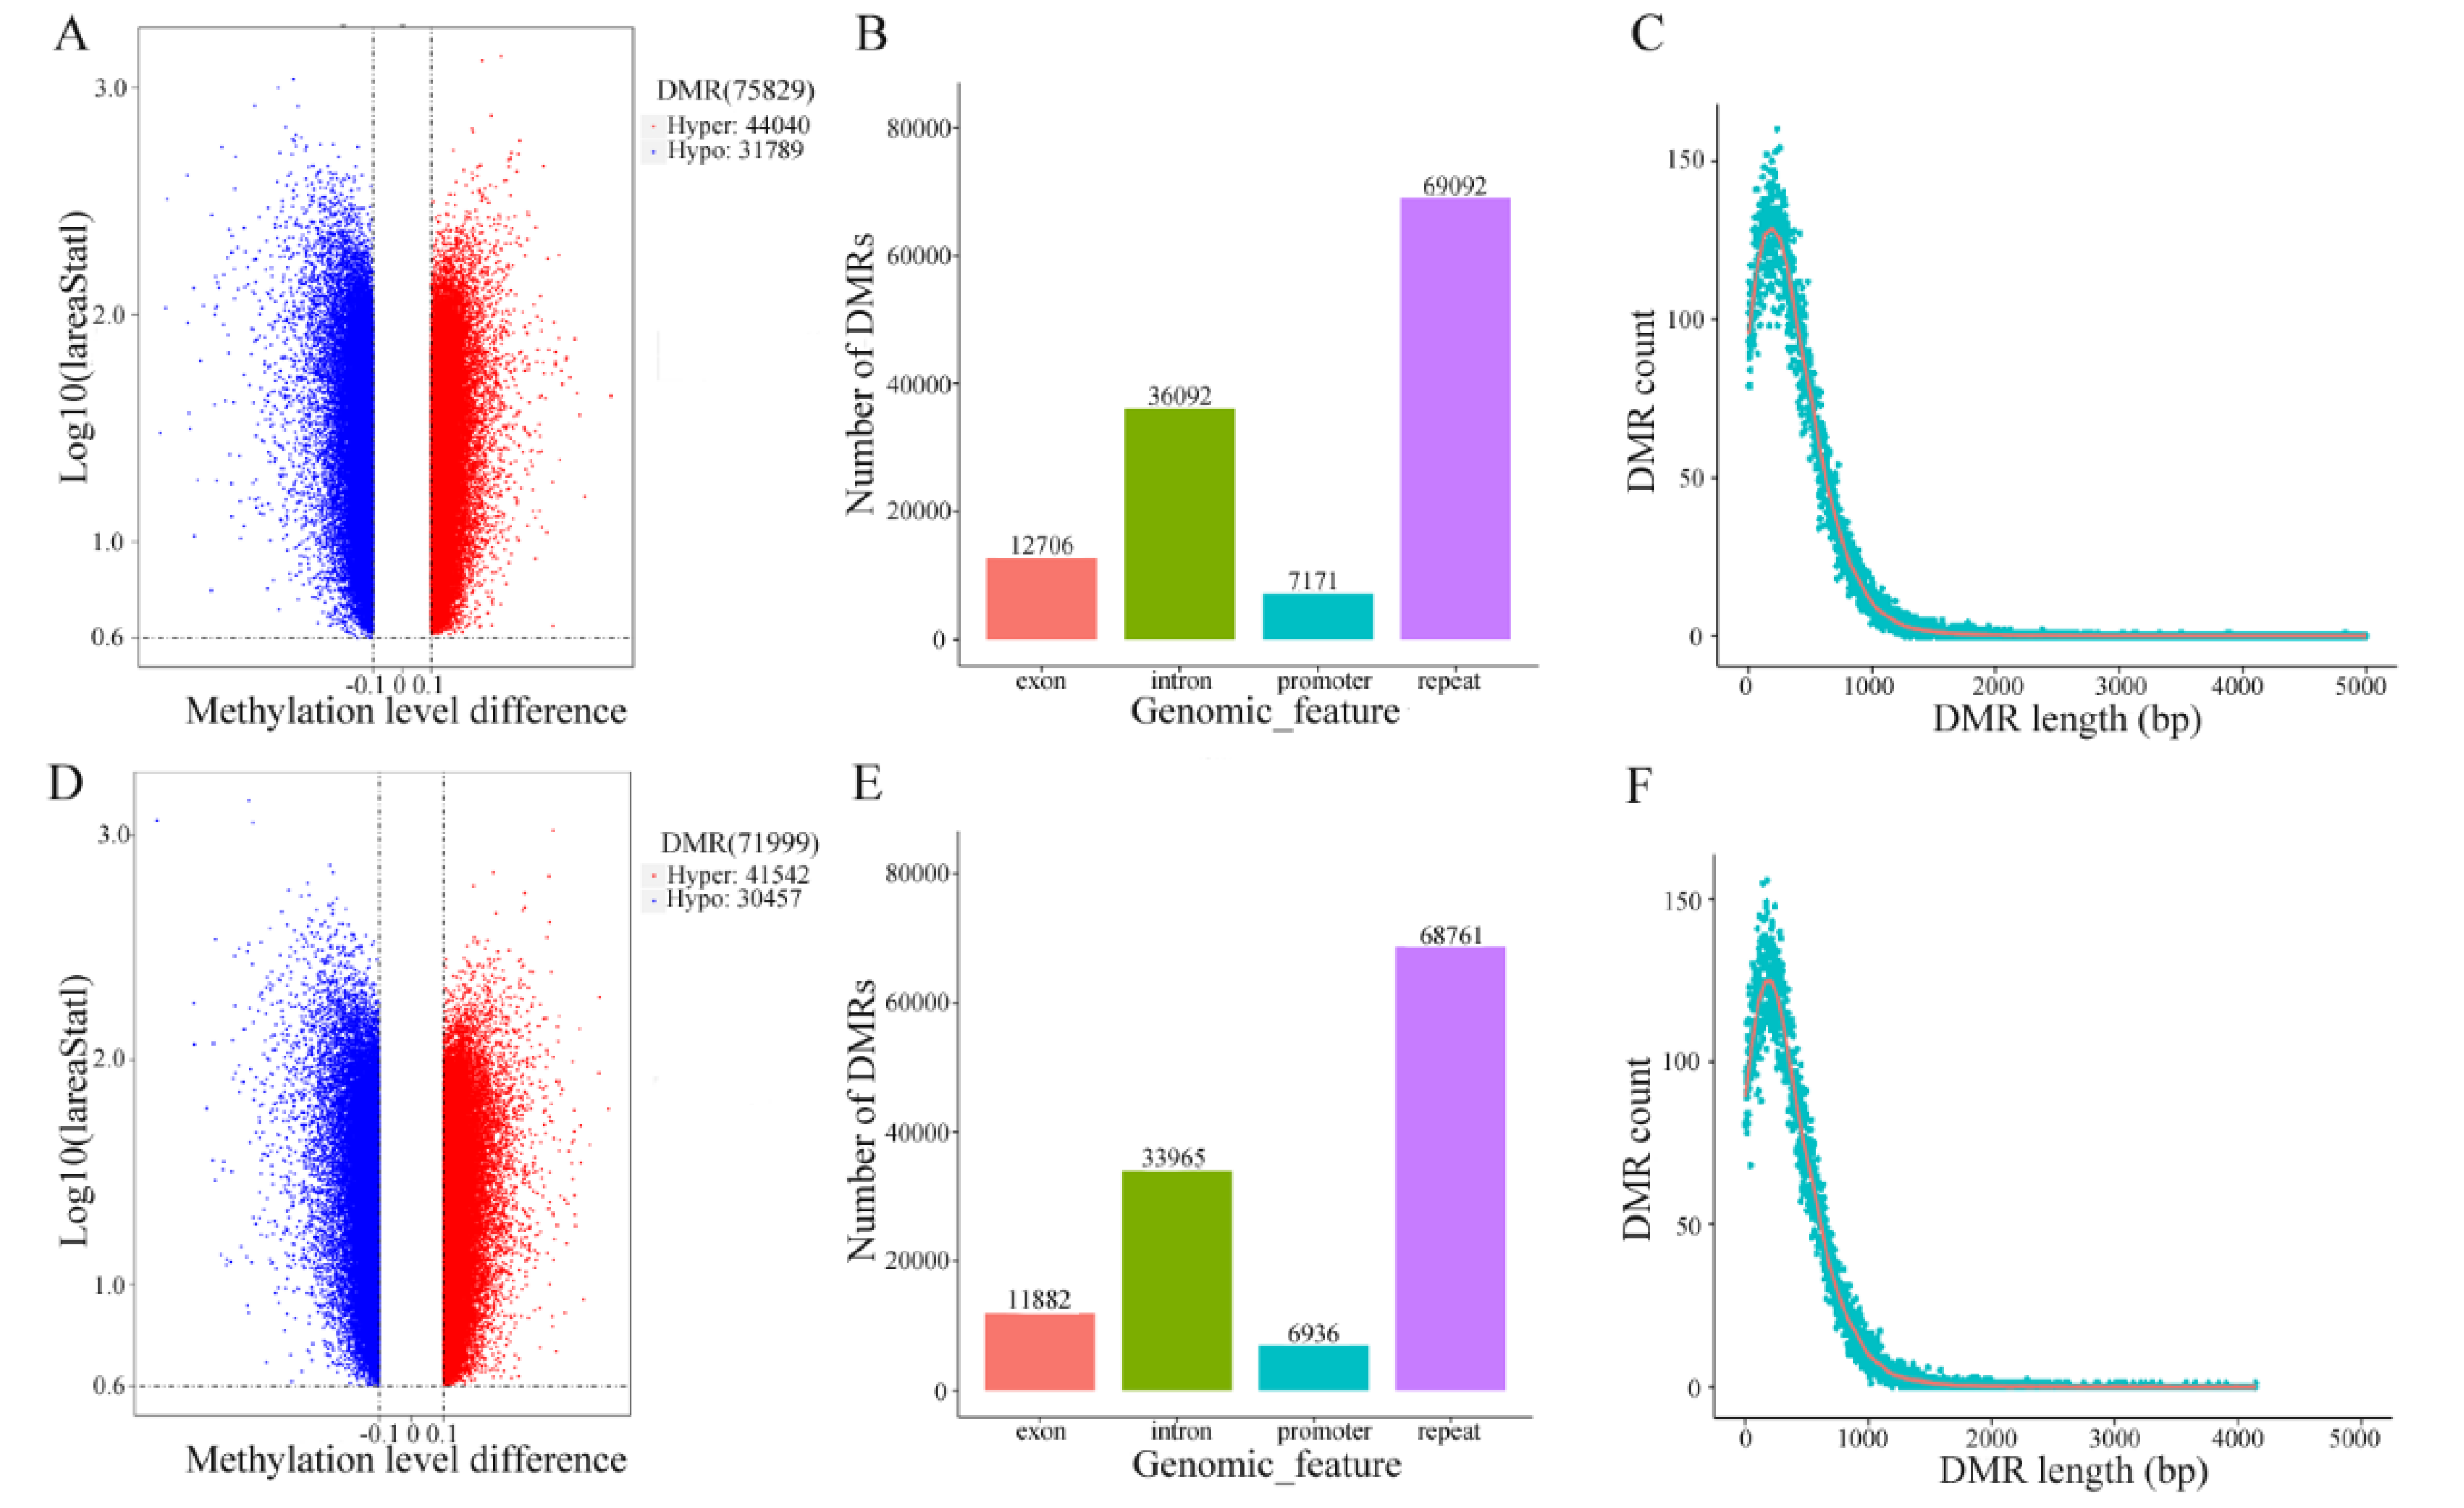
3.4. Differential Methylation Analysis

Taken from our previously reported data, the quality of WBGS data is shown in Table S15. A volcano plot of the EAA (or BCAA) shows the distribution of methylation differences among all the DMRs (Figure 6A). DMRs were classified into several genomic regions including exons, introns, promoters and intergenic repeat regions (Figure 6B). Figure 6C shows that the length distribution of DMRs and most regions was shorter than 1000 bp. Similar results were observed in DMR identification for the FLA trait (Figure 6D–F). The DMRs within the promoter regions (differentially methylated promoters, DMPs) were chosen for further functional enrichment analysis due to the significance of DMPs in the regulation of transcription [34]. The GO and KEGG enrichment results for genes with differentially methylated promoters are shown in Tables S17 and S18, respectively.

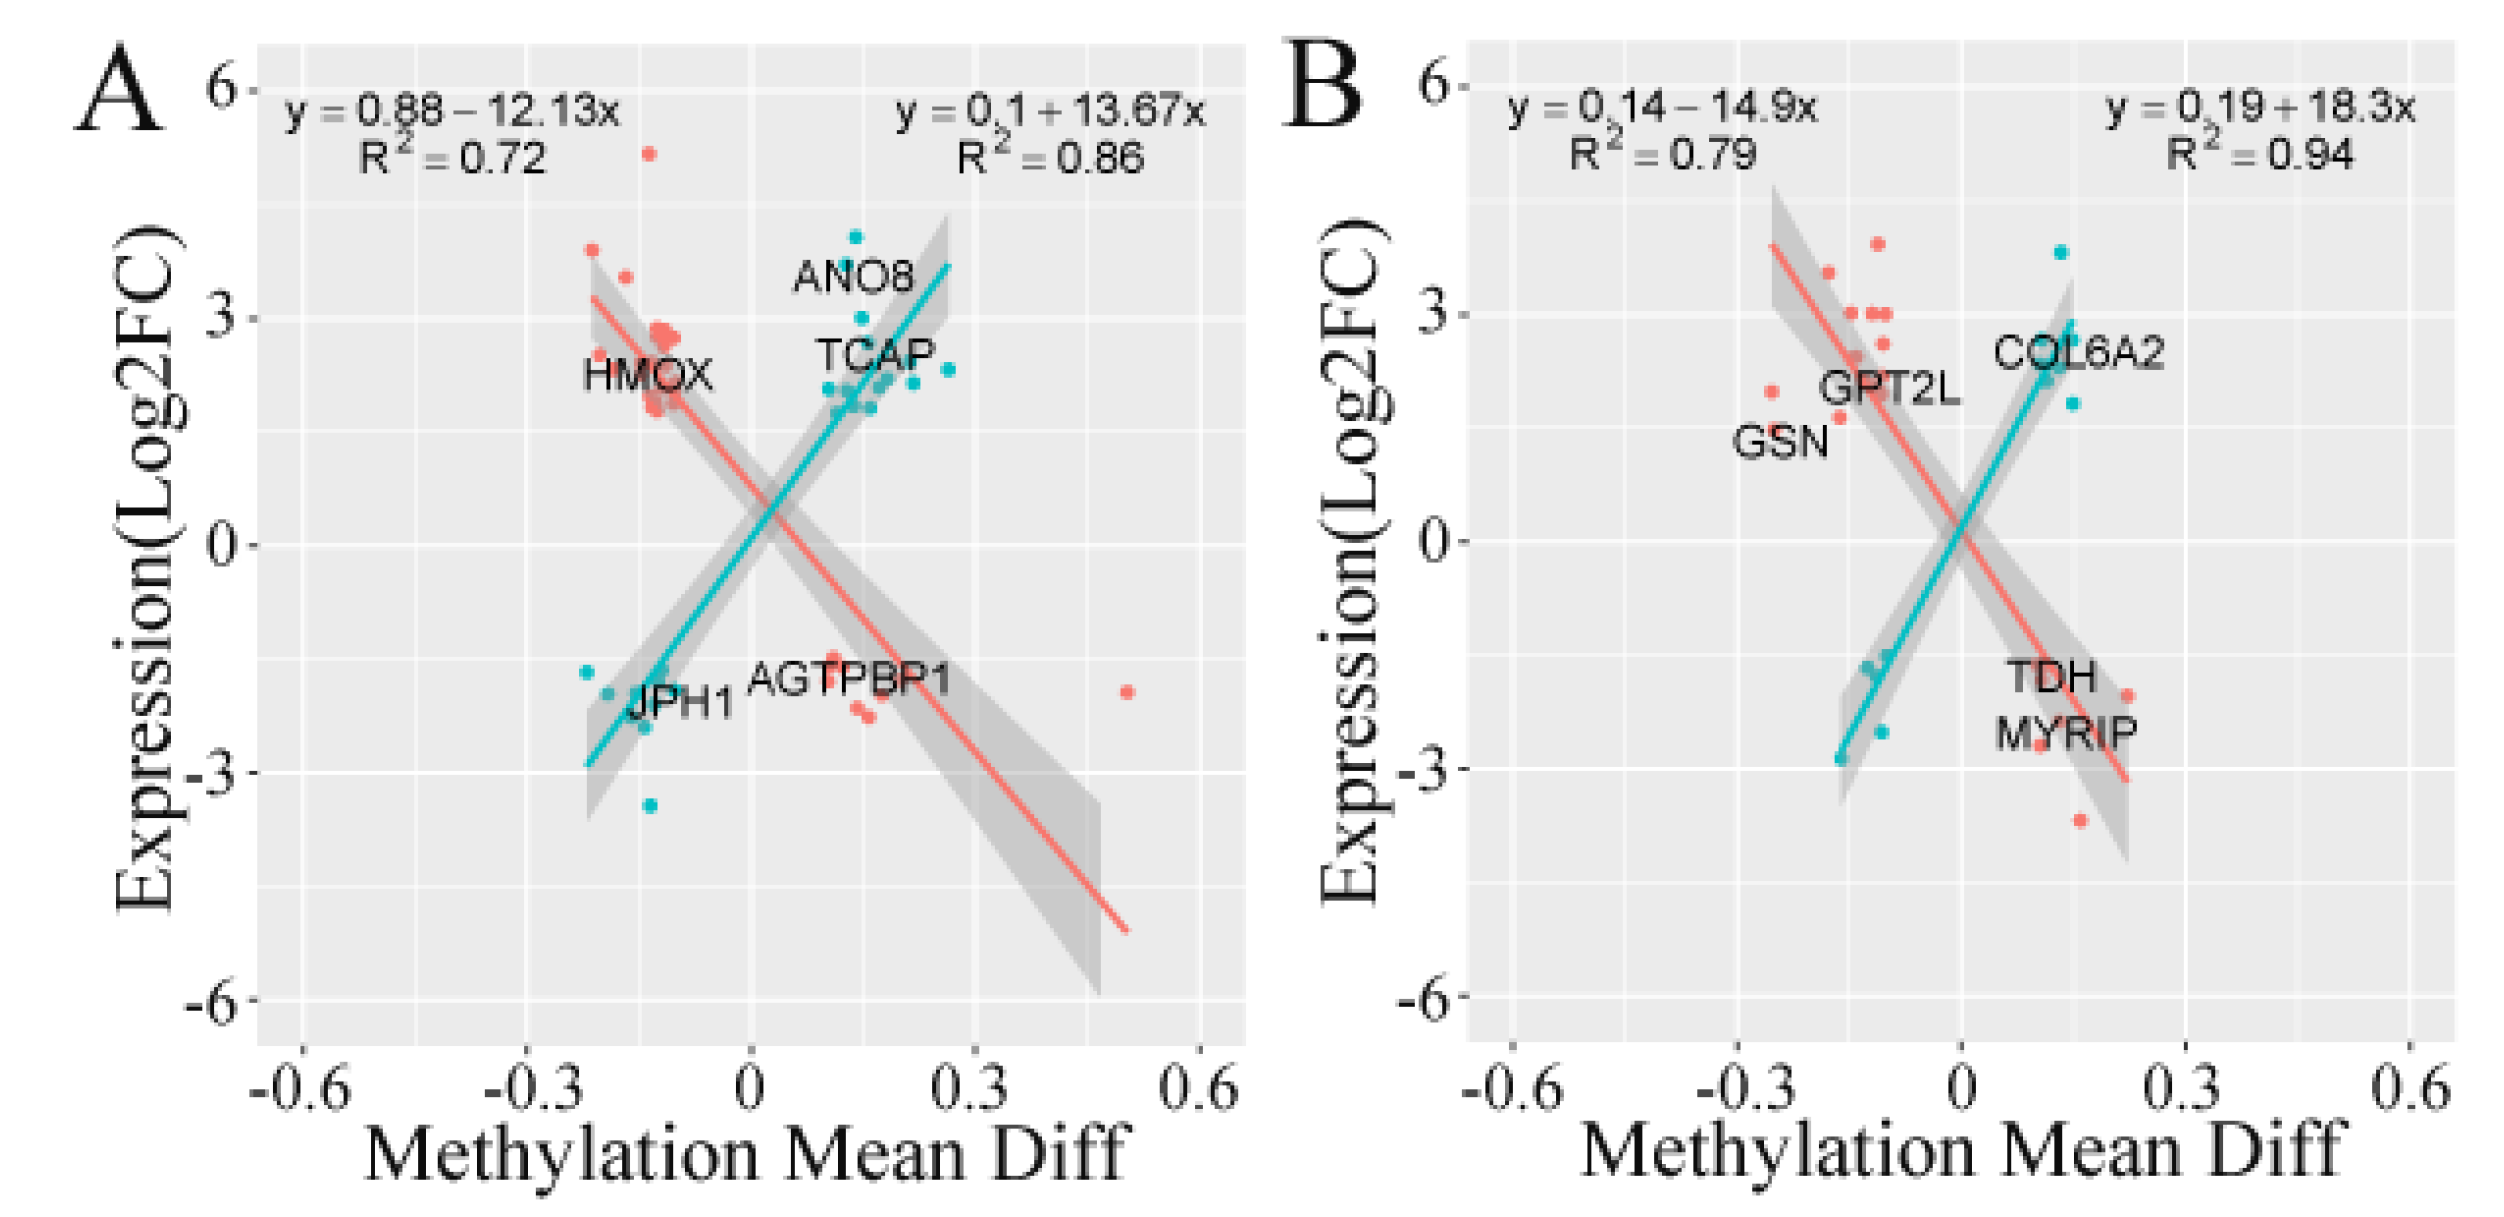
3.5. Correlation Analysis of Transcriptome and Methylation Results

Because very few intersections were observed between the liver DEG and DMP results, we focused on the relatedness between DEG and DMP results in the brain and muscle tissues (Table S19). After Pearson correlation analysis, significant linear correlations (Figure 7) were found for the EAA (or BCAA) traits of muscle tissue and the FLA trait of brain tissue. These genes were divided into two types, positively related and negatively related. For the EAA (or BCAA) trait in muscle, 57 genes were included in the correlation analysis. In turn, 36 genes for the FLA trait in brain tissue were included in the correlation analysis. For the EAA (or BCAA) trait in muscle tissue, 24 positively related genes and 33 negatively related genes are presented in Figure 7A. Totally, 12 positively related genes and 24 negatively related genes for the FLA trait in brain tissue were found (Figure 7B).

4. Discussion

4.1. Genes Associated with Muscular Amino Acid Content by GWAS

Glutamate dehydrogenase is a zinc protein that plays a major role in the amino acid metabolism in multiple tissues, such as liver, heart, muscle and kidney [35]. Glutamate dehydrogenase has been reported as a crucial enzyme, which is involved in bridging amino acid metabolism and carbohydrate metabolism in crayfish [36]. A number of amino acid or peptide transporters was observed in the associated genes list, including abcb10 (ATP-binding cassette sub-family B member 10) and slc1a4 (neutral amino acid transporter A). The gene abcb10 encodes a protein that is involved in heme biosynthesis [37], while slc1a4 encodes a protein that is reported as an important transporter for multiple neutral amino acids such as glycine, serine and threonine [38]. The gene myoz1 (myozenin-1) was identified in the downstream area near the SNP carp022265, which was previously reported to function in myofibrillogenesis, and may affect myofibrillar protein content in muscles [39,40]. Only a few SNPs and genes were identified to be associated with PRO and TYR content, and no significant markers were found to be associated with other amino acid contents, probably due to the limited number of samples. Nevertheless, dozens of SNPs exceeded the suggestive threshold for other traits, indicating that more associated SNPs might be identified with larger samples in the future. As the genes discovered in the GWAS analysis may not be enough to illustrate the underlying mechanism of muscular amino acid metabolism, and no associated SNPs were found related to the classification of amino acids (EAA, BCAA and FLA), we sought to uncover more evidence for the three categories of amino acids by performing gene expression and epigenetic changes analyses.

4.2. Network Analysis Based on RNA-Seq Data

Both BCAAs and EAAs play crucial roles in the physiological functions of organisms, while the FLAs are the main source of the fish umami and other flavors. We focused on these three types of amino acids classification using RNA-Seq data analysis and gene network construction. A large number of genes was found to be differentially expressed in muscle for EAA (or BCAA), corresponding to the fact that most EAAs or BCAAs are metabolized in muscle tissue [41]. As thousands of genes were used for the network analyses (Figures S3–S7), it was not easy to identify the most significant nodal genes from the network map. The functional enrichment of genes generated GO and KEGG pathways that showed genes that played central roles in the regulation of amino acid contents. As shown in Figure 5A, in muscle tissue for the EAA or BCAA traits, various GO pathways were enriched, such as “skeletal muscle cell differentiation”, “skeletal muscle tissue development”, “striated muscle tissue development”, “myotube cell development” and “regulation of protein ubiquitination”. In turn, KEGG enrichment for EAA or BCAA in muscle resulted in the identification of 36 pathways, including “valine, leucine and isoleucine degradation”, “mTOR signaling pathway”, “fatty acid metabolism” and “alanine, aspartate and glutamate metabolism”. GO enrichment results for the FLA trait in brain tissue showed a distinct pattern of functions related to stem cell or hematopoietic stem cell differentiation (Figure 5B), including “embryonic skeletal system development”, “regulation of hemopoiesis” and “stem cell differentiation”. A number of neuro-related pathways (“nerve development”, “neural crest cell migration” and “positive regulation of neurogenesis”) also were observed in the GO enrichment network for FLA traits in brain tissue, partially because some amino acids (e.g., GLY) within the FLA category serve as neurotransmitters [42]. KEGG enrichment for the FLA trait in brain tissue contained 20 pathways comprising “wnt signaling pathway”, “neuroactive ligand-receptor interaction”, “glycine, serine and threonine metabolism” and several signaling pathways. Only one pathway, “glutathione metabolism”, was enriched in KEGG pathways in the liver tissue for the FLA trait, where glutathione is a tripeptide that plays a pivotal role in critical physiological processes affecting amino acid contents [43]. These network results will facilitate further research on the hub genes and pathways that are involved in the regulation of gene expression associated with the relevant traits.

4.3. Gene Identification with DMP and Integration Incorporating DEGs

It is widely accepted that genes regulating amino acid metabolism are closely related to other pathways, as many products are shared among the pathways of fatty acid metabolism, growth regulation and other physiological functions. As shown in Table S18, through KEGG enrichment analysis, 69 pathways were enriched for the EAA or BCAA traits. Interestingly, several amino acid metabolism-related pathways were enriched, such as “lysine degradation”, “valine, leucine and isoleucine degradation”, “beta-alanine metabolism” and “arginine and proline metabolism”. Multiple important biological processes also were shown by KEGG enrichment, indicating wide interactions among these physiological functions, such as “pyrimidine and purine metabolism”, “insulin signaling pathway”, “adipocytokine signaling pathway” and “citrate cycle (TCA cycle)”. Similarly, 66 pathways were enriched for the FLA trait (Table S18), which showed comparable patterns with the above results from EAA or BCAA. The widespread methylation differences in promoter regions of selected genes indicated that epigenomic features were common in the regulation of amino acid metabolism.
The interactive results shared by DMP and DEG showed that genes with more highly methylated promoters and decreased expression levels (or vice versa) were paid more attention due to the multi-omics evidence. Taking the gene agtpbp1 (cytosolic carboxypeptidase 1), for example, the promoter showed a higher methylation ratio in the group with high EAA (or BCAA) content, corresponding to a decreased expression (Figure 7A). Likewise, for an integrated analysis of the FLA trait, the gene gpt2l (alanine aminotransferase 2-like) was noted, with a decreased methylation ratio and an elevated expression in the group with a high FLA content. The protein alanine aminotransferase 2-like catalyzes the reversible transamination between alanine and 2-oxoglutarate to form pyruvate and glutamate, thus engaging in the metabolism of multiple amino acids.

5. Conclusions

In this study, we conducted GWAS, transcriptome and whole-genome methylation analyses based on the differences of amino acids content in the muscle tissue of C. carpio. The GWAS investigation of amino acid content revealed the importance of the glud1, abcb10, slc1a4 and myoz1 genes, which are related to amino acid metabolism or transport. Through studies of the RNA-Seq results and gene profiling with DMPs, we uncovered key genes, such as agtpbp1 and gpt2l, whose expression was enriched in the EAA, BCAA and FLA metabolism pathways. Integrative results of RNA-Seq and DNA methylation indicated significant correlations at two-omics levels in the muscle and brain tissues of C. carpio. The Ano8, tcap, jph1 and col6a2 genes were positively correlated, while hmox, agtpbp1, gsn, gpt2l, tdh and myrip genes were negatively correlated. The comprehensive analysis also identified genes related to amino acid synthesis, transport and utilization. It is desirable to validate these results by extensive sequencing with a larger population. The results will accelerate the application of molecular marker-based selective breeding for well-muscled common carp with a high nutritional value.

Supplementary Materials

The following supporting information can be downloaded at: https://www.mdpi.com/article/10.3390/fishes7050225/s1, Tables S1–S19: Phenotypes, genes and enriched pathways by GWAS, DEG and DMP analyses. Figure S1: GWAS of 195 individuals for PRO and TYR content. (A) Manhattan plot of the PRO content association. (B) Q–Q plot for the association results of PRO content. (C) Manhattan plot of the TYR content association. (D) Q–Q plot for the association results of TYR content. Figure S2: Cluster analysis of DEGs in two tissues. (A) Clustering of DEGs in brain tissue for EAA (or BCAA) trait. (B) Clustering of DEGs in liver tissue for EAA (or BCAA) trait. (C) Clustering of DEGs in liver tissue for FLA trait. The color bars represent the relative expression levels of transcripts. Highly expressed transcripts are marked in red, while low-expressed transcripts are assigned in blue. Figure S3: The network of the differentially expressed genes in brain tissue for EAA (or BCAA) trait. The combined score between the DEGs is indicated by the thickness of the edge between the genes. The color of each node represents the q-value of the genes. The genes with q-value < 0.05 are displayed. Figure S4: The network of the differentially expressed genes in liver tissue for EAA (or BCAA) trait. The combined score between the DEGs is indicated by the thickness of the edge between the genes. The color of each node represents the q-value of the genes. The genes with q-value < 0.05 are displayed. Figure S5: The network of the differentially expressed genes in muscle tissue for EAA (or BCAA) trait. The combined score between the DEGs is indicated by the thickness of the edge between the genes. The color of each node represents the q-value of the genes. The genes with q-value < 0.05 are displayed. Figure S6: The network of the differentially expressed genes in brain tissue for FLA trait. The combined score between the DEGs is indicated by the thickness of the edge between the genes. The color of each node represents the q-value of the genes. The genes with q-value < 0.05 are displayed. Figure S7: The network of the differentially expressed genes in liver tissue for FLA trait. The combined score between the DEGs is indicated by the thickness of the edge between the genes. The color of each node represents the q-value of the genes. The genes with q-value < 0.05 are displayed. Figure S8: The network of enriched GO terms in muscle tissue for EAA (or BCAA) trait. The thickness of the edge between the GO terms represents the Kappa Score between the terms. The q-value of the GO terms is manifested through the color of each node. The size of each node shows the number of enriched genes for every GO term. The GO terms with q-value < 0.05 are displayed. Figure S9: The network of enriched GO terms in brain tissue for FLA trait. The thickness of the edge between the GO terms represents the Kappa Score between the terms. The q-value of the GO terms is manifested through the color of each node. The size of each node shows the number of enriched genes for every GO term. The GO terms with q-value < 0.05 are displayed.

Author Contributions

J.X. initiated and coordinated the research project. H.Z., Y.Z. and J.X. conceived and conducted the analysis and drafted the manuscript. P.X. engaged in sample collection and genotyping analysis. Z.Z., J.F., B.W., C.D. and Y.J. took part in trait measurement, tissue manipulation and enrichment analysis. All authors have read and agreed to the published version of the manuscript.

Funding

This work was supported by the Special Scientific Research Funds for Central Non-Profit Institutes, Chinese Academy of Fishery Sciences (2020B003, 2020TD24, 2015C005) for RNA-Seq and WGBS; the National Key Research and Development Program (2018YFD0900102) for genotyping and phenotyping; the National Infrastructure of Fishery Germplasm Resources of China (2019DKA30470) for sample collection.

Institutional Review Board Statement

This study was approved by the Animal Care and Use Committee (ACUC) of the Centre for Applied Aquatic Genomics at the Chinese Academy of Fishery Sciences (BC2013863, September 2013). All experiments complied with the ARRIVE guidelines and were carried out in accordance with the National Institutes of Health guide for the care and use of laboratory animals (NIH Publications No. 8023, revised 1978).

Data Availability Statement

The sequencing datasets supporting the conclusions of this article were deposited in the NCBI Sequence Read Archive database with accession number PRJNA493161.

Conflicts of Interest

The authors declare no conflict of interest.

Abbreviations

EAAessential amino acid;
NEAAnonessential amino acid;
FAAfunctional amino acid;
FLAflavorous amino acid;
BCAAbranched-chain amino acids;
GWASgenome-wide association study;
WGBSwhole-genome bisulfite sequencing;
GOgene ontology;
KEGGKyoto encyclopedia of genes and genomes;
DEGdifferentially expressed gene;
DMPdifferentially methylated promoter;
DMRdifferentially methylated region

References

  1. FAO. Fishery and Aquaculture Statistics; Food and Agriculture Organization: Rome, Italy, 2017. [Google Scholar]
  2. Xu, J.; Zhao, Z.; Zhang, X.; Zheng, X.; Li, J.; Jiang, Y.; Kuang, Y.; Zhang, Y.; Feng, J.; Li, C.; et al. Development and evaluation of the first high-throughput SNP array for common carp (Cyprinus carpio). BMC Genom. 2014, 15, 307. [Google Scholar]
  3. Peng, W.; Jian, X.; Yan, Z.; Feng, J.; Peng, X. An ultra-high density linkage map and QTL mapping for sex and growth-related traits of common carp (Cyprinus carpio). Sci. Rep. 2016, 6, 26693. [Google Scholar] [CrossRef] [PubMed]
  4. Zhang, H.; Xu, P.; Jiang, Y.; Zhao, Z.; Feng, J.; Tai, R.; Dong, C.; Xu, J. Genomic, transcriptomic, and epigenomic features differentiate genes that are relevant for muscular polyunsaturated fatty acids in the common carp. Front. Genet. 2019, 10, 217. [Google Scholar] [PubMed]
  5. Wu, G. Functional amino acids in nutrition and health. Amino Acids 2013, 45, 407–411. [Google Scholar] [CrossRef]
  6. Wu, G. Functional amino acids in growth, reproduction, and health. Adv. Nutr. 2010, 1, 31–37. [Google Scholar]
  7. Zhang, S.; Zeng, X.; Ren, M.; Mao, X.; Qiao, S. Novel metabolic and physiological functions of branched chain amino acids: A review. J. Anim. Sci. Biotechnol. 2017, 8, 10. [Google Scholar]
  8. Andersen, S.M.; Waagbo, R.; Espe, M. Functional amino acids in fish nutrition, health and welfare. Front. Biosci. 2016, 8, 143–169. [Google Scholar]
  9. Gao, Y.; Tian, L.; Liu, Y. Research progress of amino acids in fish. Guangdong Feed. 2012, 21, 53–57. [Google Scholar]
  10. Wheelhouse, N.M.; Stubbs, A.K.; Lomax, M.A.; MacRae, J.C.; Hazlerigg, D.G. Growth hormone and amino acid supply interact synergistically to control insulin-like growth factor-I production and gene expression in cultured ovine hepatocytes. J. Endocrinol. 1999, 163, 353–361. [Google Scholar] [CrossRef]
  11. Mihalik, S.J.; Michaliszyn, S.F.; de las Heras, J.; Bacha, F.; Lee, S.; Chace, D.H.; DeJesus, V.R.; Vockley, J.; Arslanian, S.A. Metabolomic profiling of fatty acid and amino acid metabolism in youth with obesity and type 2 diabetes: Evidence for enhanced mitochondrial oxidation. Diabetes Care 2012, 35, 605–611. [Google Scholar] [CrossRef]
  12. Chalamaiah, M.; Dinesh Kumar, B.; Hemalatha, R.; Jyothirmayi, T. Fish protein hydrolysates: Proximate composition, amino acid composition, antioxidant activities and applications: A review. Food Chem. 2012, 135, 3020–3038. [Google Scholar] [CrossRef] [PubMed]
  13. Ali, A.; Al-Tobasei, R.; Lourenco, D.; Leeds, T.; Kenney, B.; Salem, M. Genome-wide association study identifies genomic loci affecting filet firmness and protein content in rainbow trout. Front. Genet. 2019, 10, 386. [Google Scholar] [CrossRef] [PubMed]
  14. Wen, X.; Hu, Y.; Zhang, X.; Wei, X.; Wang, T.; Yin, S. Integrated application of multi-omics provides insights into cold stress responses in pufferfish Takifugu fasciatus. BMC Genom. 2019, 20, 563. [Google Scholar] [CrossRef]
  15. Wei, Z.; Zhou, H.; Zhang, Y.; Zhang, Q.; Zhang, W.; Mai, K. Integrative analysis of transcriptomics and metabolomics profiling on flesh quality of large yellow croaker Larimichthys crocea fed a diet with hydroxyproline supplementation. Br. J. Nutr. 2018, 119, 359–367. [Google Scholar] [CrossRef] [PubMed]
  16. Mekuchi, M.; Sakata, K.; Yamaguchi, T.; Koiso, M.; Kikuchi, J. Trans-omics approaches used to characterise fish nutritional biorhythms in leopard coral grouper (Plectropomus leopardus). Sci. Rep. 2017, 7, 9372. [Google Scholar] [CrossRef] [PubMed]
  17. Zhang, Y.; Liu, J.; Fu, W.; Xu, W.; Zhang, H.; Chen, S.; Liu, W.; Peng, L.; Xiao, Y. Comparative transcriptome and DNA methylation analyses of the molecular mechanisms underlying skin color variations in Crucian carp (Carassius carassius L.). BMC Genet. 2017, 18, 95. [Google Scholar] [CrossRef] [PubMed]
  18. Visscher, P.M.; Hemani, G.; Vinkhuyzen, A.A.; Chen, G.B.; Lee, S.H.; Wray, N.R.; Goddard, M.E.; Yang, J. Statistical power to detect genetic (co)variance of complex traits using SNP data in unrelated samples. PLoS Genet. 2014, 10, e1004269. [Google Scholar] [CrossRef]
  19. Zheng, G.; Jin, W.; Fan, P.; Feng, X.; Bai, Y.; Tao, T.; Yu, L. A novel method for detecting amino acids derivatized with phenyl isothiocyanate by high-performance liquid chromatography-electrospray ionization mass spectrometry. Int. J. Mass Spectrom. 2015, 392, 1–6. [Google Scholar] [CrossRef]
  20. Statsoft Inc. Statistica Six Sigma, Release 7; Copyright 1984–2006; Statsoft Inc.: Tulsa, OK, USA, 2004. [Google Scholar]
  21. Bradbury, P.J.; Zhang, Z.; Kroon, D.E.; Casstevens, T.M.; Ramdoss, Y.; Buckler, E.S. TASSEL: Software for association mapping of complex traits in diverse samples. Bioinformatics 2007, 23, 2633–2635. [Google Scholar] [CrossRef]
  22. Bolger, A.M.; Lohse, M.; Usadel, B. Trimmomatic: A flexible trimmer for Illumina sequence data. Bioinformatics 2014, 30, 2114–2120. [Google Scholar] [CrossRef]
  23. Langmead, B.; Salzberg, S.L. Fast gapped-read alignment with Bowtie 2. Nat. Methods 2012, 9, 357–359. [Google Scholar] [CrossRef] [PubMed]
  24. Kim, D.; Pertea, G.; Trapnell, C.; Pimentel, H.; Kelley, R.; Salzberg, S.L. TopHat2: Accurate alignment of transcriptomes in the presence of insertions, deletions and gene fusions. Genome Biol. 2013, 14, R36. [Google Scholar] [CrossRef] [PubMed]
  25. Li, H.; Handsaker, B.; Wysoker, A.; Fennell, T.; Ruan, J.; Homer, N.; Marth, G.; Abecasis, G.; Durbin, R. The Sequence Alignment/Map format and SAMtools. Bioinformatics 2009, 25, 2078–2079. [Google Scholar] [CrossRef] [PubMed]
  26. Trapnell, C.; Roberts, A.; Goff, L.; Pertea, G.; Kim, D.; Kelley, D.R.; Pimentel, H.; Salzberg, S.L.; Rinn, J.L.; Pachter, L. Differential gene and transcript expression analysis of RNA-seq experiments with TopHat and Cufflinks. Nat. Protoc. 2012, 7, 562–578. [Google Scholar] [CrossRef]
  27. Wickham, H. ggplot2. Wiley Interdiscip. Rev. Comput. Stat. 2011, 3, 180–185. [Google Scholar] [CrossRef]
  28. Malinsky, M.; Svardal, H.; Tyers, A.M.; Miska, E.A.; Genner, M.J.; Turner, G.F.; Durbin, R. Whole-genome sequences of Malawi cichlids reveal multiple radiations interconnected by gene flow. Nat. Ecol. Evol. 2018, 2, 1940–1955. [Google Scholar] [CrossRef]
  29. Wang, Y.; Zheng, W.; Luo, J.; Zhang, D.; Zuhong, L. In Situ bisulfite modification of membrane-immobilized DNA for multiple methylation analysis. Anal. Biochem. 2006, 359, 183–188. [Google Scholar] [CrossRef]
  30. Krueger, F.; Andrews, S.R. Bismark: A flexible aligner and methylation caller for bisulfite-Seq applications. Bioinformatics 2011, 27, 1571–1572. [Google Scholar] [CrossRef]
  31. Wang, Z.; Li, X.; Jiang, Y.; Shao, Q.; Liu, Q.; Chen, B.; Huang, D. swDMR: A sliding window approach to identify differentially methylated regions based on whole genome bisulfite sequencing. PLoS ONE 2015, 10, e0132866. [Google Scholar]
  32. Xu, P.; Zhang, X.; Wang, X.; Li, J.; Liu, G.; Kuang, Y.; Xu, J.; Zheng, X.; Ren, L.; Wang, G.; et al. Genome sequence and genetic diversity of the common carp, Cyprinus carpio. Nat. Genet. 2014, 46, 1212–1219. [Google Scholar] [CrossRef]
  33. Xu, P.; Xu, J.; Liu, G.; Chen, L.; Zhou, Z.; Peng, W.; Jiang, Y.; Zhao, Z.; Jia, Z.; Sun, Y.; et al. The allotetraploid origin and asymmetrical genome evolution of the common carp Cyprinus carpio. Nat. Commun. 2019, 10, 4625. [Google Scholar] [PubMed]
  34. Haque, M.M.; Nilsson, E.E.; Holder, L.B.; Skinner, M.K. Genomic clustering of differential DNA methylated regions (epimutations) associated with the epigenetic transgenerational inheritance of disease and phenotypic variation. BMC Genom. 2016, 17, 418. [Google Scholar]
  35. Zhou, Y.; Luczkowska, K.; Maechler, P. In Situ assessment of hepatic glutamate dehydrogenase activity provides novel insights into amino acid metabolism. FASEB J. 2021, 35, S1. [Google Scholar]
  36. Dawson, N.J.; Storey, K.B. An enzymatic bridge between carbohydrate and amino acid metabolism: Regulation of glutamate dehydrogenase by reversible phosphorylation in a severe hypoxia-tolerant crayfish. J. Comp. Physiol. B 2012, 182, 331–340. [Google Scholar]
  37. Seguin, A.; Takahashi-Makise, N.; Yien, Y.Y.; Huston, N.C.; Whitman, J.C.; Musso, G.; Wallace, J.A.; Bradley, T.; Bergonia, H.A.; Kafina, M.D.; et al. Reductions in the mitochondrial ABC transporter Abcb10 affect the transcriptional profile of heme biosynthesis genes. J. Biol. Chem. 2017, 292, 16284–16299. [Google Scholar]
  38. Gibson, C.; de Ruijter-Villani, M.; Rietveld, J.; Stout, T.A.E. Amino acid transporter expression in the endometrium and conceptus membranes during early equine pregnancy. Reprod. Fertil. Dev. 2018, 30, 1675–1688. [Google Scholar]
  39. Roberts, M.D.; Romero, M.A.; Mobley, C.B.; Mumford, P.W.; Roberson, P.A.; Haun, C.T.; Vann, C.G.; Osburn, S.C.; Holmes, H.H.; Greer, R.A.; et al. Skeletal muscle mitochondrial volume and myozenin-1 protein differences exist between high versus low anabolic responders to resistance training. PeerJ 2018, 6, e5338. [Google Scholar]
  40. Ren, R.M.; Liu, H.; Zhao, S.H.; Cao, J.H. Targeting of miR-432 to myozenin1 to regulate myoblast proliferation and differentiation. Genet. Mol. Res. 2016, 15, gmr15049313. [Google Scholar] [CrossRef]
  41. Adeva-Andany, M.M.; Lopez-Maside, L.; Donapetry-Garcia, C.; Fernandez-Fernandez, C.; Sixto-Leal, C. Enzymes involved in branched-chain amino acid metabolism in humans. Amino Acids 2017, 49, 1005–1028. [Google Scholar]
  42. Qin, X.; Akter, F.; Qin, L.; Xie, Q.; Liao, X.; Liu, R.; Wu, X.; Cheng, N.; Shao, L.; Xiong, X.; et al. MicroRNA-26b/PTEN signaling pathway mediates glycine-induced neuroprotection in SAH injury. Neurochem. Res. 2019, 44, 2658–2669. [Google Scholar]
  43. Minich, D.M.; Brown, B.I. A review of dietary (phyto) nutrients for glutathione support. Nutrients 2019, 11, 2073. [Google Scholar]
Figure 1. Phenotypic distribution of amino acid content and correlation clustering analysis. (A) Boxplots for phenotypic distributions of amino acid content. The lines inside the boxes denote the median. The mean is shown as the rhombus in the boxes. (B) Correlation analysis of different amino acid traits. The intensity of color shows the relative coefficient R2 values. The red color indicates a positive correlation, whereas negative correlations are shown in blue.
Fishes 07 00225 g001
Figure 2. Results of GWAS of 195 individuals for GLY content. (A) Manhattan plot displaying the GWAS results for GLY content. A small part of the scaffolds was not integrated into the 50 chromosomes, and these scaffolds were put together into a pseudo chromosome abbreviated as “P” shown on the x-axis. (B) Q–Q plot showing the normal distribution of all the SNPs identified by GWAS; the outliers on the top right correspond to the significant SNPs associated with amino acids content in GWAS. (C) Density distribution of identified SNPs by genotyping on each chromosome.
Fishes 07 00225 g002
Figure 3. Volcano plots of Log2(FC) and –Log10(q–value) of the differentially expressed genes. (A) Volcano plot of DEGs in brain tissue for EAA (or BCAA) trait. (B) Volcano plot of DEGs in liver tissue for EAA (or BCAA) trait. (C) Volcano plot of DEGs in muscle tissue for EAA (or BCAA) trait. (D) Volcano plot of DEGs in brain tissue for FLA trait. (E) Volcano plot of DEGs in liver tissue for FLA trait. (F) Volcano plot of DEGs in muscle tissue for FLA trait. Red dots represent upregulated genes, while blue dots indicate downregulated genes. The dashed horizontal line represents the threshold value of q = 0.05. The vertical dashed line indicates the absolute log2 fold change (FC) value = 1.
Fishes 07 00225 g003
Figure 4. Heatmaps representing cluster analysis of gene expression levels related to the specific amino acid contents in C. carpio. (A) Clustering of DEGs in muscle tissue for the EAA (or BCAA) trait. (B) Clustering of DEGs in muscle tissue for the FLA trait. The intensity of the color bars represents the relative expression levels of transcripts. Highly expressed transcripts are marked in red, while low-expressed transcripts are shown in blue.
Fishes 07 00225 g004
Figure 5. The network of significantly enriched GO terms in (A) the muscle tissue for the EAA (or BCAA) trait and (B) the brain tissue for the FLA trait. The thickness of the line between the GO terms represents the Kappa Score between the terms. The q-value of the GO terms manifested through the color of each node is shown on the scale bars. The size of each node shows the number of enriched genes for every GO term. The GO terms with q-value < 0.05 are displayed.
Fishes 07 00225 g005
Figure 6. Volcano plots of DMRs, DMR distribution in genomic regions and the length distribution of DMRs. (A) Volcano plots of DMRs for the EAA (or BCAA) trait. The x-axis indicates the methylation value difference. The y-axis represents the −log10(p-value). Red dots represent upregulated genes, while blue dots indicate downregulated genes. (B) Numbers for each DMR in different genomic regions for the EAA (or BCAA) traits. (C) Counts for DMRs of different lengths for the EAA (or BCAA) traits. (D) Volcano plots of DMRs for the FLA trait. (E) Numbers for each DMR in different genomic regions for the FLA traits. (F) Counts for DMRs of different lengths for FLA trait.
Fishes 07 00225 g006
Figure 7. Pearson’s correlation of gene expression fold changes and differential methylation rates for DEGs. Scatter plots (A) for the EAA (or BCAA) trait in muscle tissue; (B) for FLA trait in brain tissues. The x-axis means difference in methylation ratio between high and low EAA (or BCAA) and FLA content groups. The y-axis indicates the logarithm of fold changes (log2FC). The red dots indicate the negatively correlated genes, while the blue dots represent positively correlated genes.
Fishes 07 00225 g007
Table 1. Gradient elution program used for the separation of amino acids.
Time (min)Eluent A (%)Eluent B (%)
01000
148515
296634
300100
370100
37.11000
451000
A = 100 mM sodium acetate at pH 6.5; B = 80% acetonitrile and 20% Milli-Q water.
Publisher’s Note: MDPI stays neutral with regard to jurisdictional claims in published maps and institutional affiliations.

