
Studying miRNA–mRNA Interactions: An Optimized CLIP-Protocol for Endogenous Ago2-Protein

Abstract
:1. Introduction
2. Experimental Design
2.1. Materials
2.1.1. Reagents
General Reagents
- HALT protease inhibitors (Thermo Fisher Scientific, Waltham, MA, USA; Cat. no.: 78430);
- RNaseOUT Recombinant Ribonuclease Inhibitor (Thermo Fisher Scientific, Waltham, MA, USA; Cat. no.: 10777019).
Cell Culture, Lysis, and Immunoprecipitation
- TURBO DNase (Thermo Fisher Scientific, Waltham, MA, USA; Cat. no.: AM2239);
- Ambion RNase I (Thermo Fisher Scientific, Waltham, MA, USA; Cat. no.: AM2294);
- α-Ago2 antibody, clone 11A9, rat monoclonal antibody (Merck KGaA, Darmstadt, Germany; Cat. no.: MABE253);
- Antibody for negative control, e. g., α-IgG, unconjugated, or α-FLAG;
- Dynabeads Protein A (Thermo Fisher Scientific, Waltham, MA, USA; Cat. no.: 10002D);
- Protein G (Thermo Fisher Scientific, Waltham, MA, USA; Cat. no.: 10004D);
- Sodium chloride (Carl Roth GmbH + Co. KG, Karlsruhe, Germany; Cat. no.: 3957.4).
Dephosphorylation and Labeling
- Recombinant Shrimp Alkaline Phosphatase (rSAP) (Thermo Fisher Scientific, Waltham, MA, USA; Cat. no.: 783901000UN);
- T4 polynucleotide kinase (PNK) (New England Biolabs, Ipswich, MA, USA; Cat. no.: M0201L);
- T4 RNA-ligase (New England Biolabs, Ipswich, MA, USA; Cat. no.: M204L);
- L3-App 3’ linker (Sequence: /rApp/AGATCGGAAGAGCGGTTCAG/ddC/, DNA adapter is preadenylated at the 5’ end (5′ rApp) to enhance ligation efficiency to crosslinked RNA [1]);
- Poly (ethylene glycol) (PEG400) (Sigma Aldrich Chemie GmbH, Steinheim, Germany; Cat. no.: 202398);
- ATP (New England Biolabs, Ipswich, MA, USA; Cat. no.: N0437A);
- [gamma-32P]-ATP (radioactive concentration: 370 MBq (10 mCi)/mL, specific activity: 29.6 TBq (800 Ci)/mmol) (Hartmann Analytic GmbH, Braunschweig, Germany; Cat. no.: SCP-801).
Protein Gel and Transfer
- Protein marker VI (pre-stained), peqGOLD (VWR Life Science, Leuven, Belgium; Cat. no.: 27-2310);
- 4× NuPAGE LDS-loading buffer (Thermo Fisher Scientific, Waltham, MA, USA; Cat. no.: NP0007);
- 10× NuPAGE sample-reducing agent (Thermo Fisher Scientific, Waltham, MA, USA; Cat. no.: NP0004).
Protein Digestion and RNA Isolation
- Proteinase K (20 mg/mL) (Carl Roth GmbH + Co. KG, Karlsruhe, Germany; Cat. no.: 7528.3);
- RNA-grade phenol/chloroform/isoamyl alcohol (25:24:1) (Carl Roth GmbH + Co. KG, Karlsruhe, Germany; Cat. no.: A156.1);
- Sodium acetate (Carl Roth GmbH + Co. KG, Karlsruhe, Germany; Cat. no.: 6773.2);
- GlycoBlue Coprecipitant (Thermo Fisher Scientific, Waltham, MA, USA; Cat. no.: AM9515);
- 2-Propanol (Carl Roth GmbH + Co. KG, Karlsruhe, Germany; Cat. no.: 6752.4);
- Ethanol (Carl Roth GmbH + Co. KG, Karlsruhe, Germany; Cat. no.: 9065.4).
Reverse Transcription
- dNTP Mix (VWR Life Science, Leuven, Belgium; Cat. no.: 733-1363);
- RT1 oligo (Sequence: GGATCCTGAACCGCT, [1]);
- Superscript III RT (Thermo Fisher Scientific, Waltham, MA, USA; Cat. no.: 56575);
- 0.1 M DTT (Thermo Fisher Scientific, Waltham, MA, USA; Cat. no.: Y00147);
- Sodium hydroxide (Carl Roth GmbH + Co. KG, Karlsruhe, Germany; Cat. no.: 6771.3);
- HEPES (Carl Roth GmbH + Co. KG, Karlsruhe, Germany; Cat. no.: 9105.3).
Adapter Ligation and PCR
- Dynabeads MyONE SILANE (Thermo Fisher Scientific, Waltham, MA, USA; Cat. no.: 37002D);
- Second 3′ cDNA linker L#clip2.0 (example barcode: /5Phos/NNNNXXXXXXNNNNNAGATCGGAAGAGCGTCGTG/3ddC/with N = random nucleotides and X = experimental barcodes [1]);
- DMSO (New England Biolabs, Ipswich, MA, USA; Cat. no.: B0515A);
- High-concentration RNA ligase (New England Biolabs, Ipswich, MA, USA; Cat. no.: M0437);
- 50% PEG8000 (New England Biolabs, Ipswich, MA, USA; Cat. no.: B1004S);
- 2× Phusion HF PCR MasterMix (New England Biolabs, Ipswich, MA, USA; Cat. no.: M0531S);
- P5 Solexa (sequence: AATGATACGGCGACCACCGAGATCTACACTCTTTCCCT ACACGACGCTCTTCCGATCT [1]);
- P3 Solexa (sequence: CAAGCAGAAGACGGCATACGAGATCGGTCTCGGCATT CCTGCTGAACCGCTCTTCCGATCT [1]);
- P5 Solexa_s (sequence: ACACGACGCTCTTCCGATCT [1]);
- P3 Solexa_s (sequence: CTGAACCGCTCTTCCGATCT [1]);
- ProNex Size-Selection Purification System (Promega Corporation, Madison, WI, USA; NG2001);
- Rotiphorese Gel 40 (19:1) (Carl Roth GmbH + Co. KG, Karlsruhe, Germany; Cat. no.: 3030.1);
- DNA loading Gel Loading Dye Purple (6×) (New England Biolabs, Ipswich, MA, USA; Cat. no.: B7024S) or any other 6× TBE DNA loading buffer;
- GeneRuler Low-Range DNA Ladder (Thermo Fisher Scientific, Waltham, MA, USA; Cat. no.: SM1191);
- Ethidium bromide solution 1% (Carl Roth GmbH + Co. KG, Karlsruhe, Germany; Cat. no.: 2218.2).
2.1.2. Buffers
 Store all buffers at 4 °C and ensure all materials are RNase-free prior to use.
General
- RNase-free water;
- Low-salt wash buffer (TBS-T) (50 mM Tris-HCl pH 7.4, 150mM NaCl, 0.05% Tween-20);
- PNK wash buffer (70 mM Tris/HCl pH 7.5, 10 mM MgCl2, 0.05% NP-40).
Cell Culture, Lysis, and Immunoprecipitation
- Lysis buffer for cytoplasmic extract (10 mM Tris/HCl pH 7.4, 150 mM NaCl, 2 mM EDTA, 1% NP-40 substitute, freshly added: protease inhibitor cocktail);
Ensure the addition of protease inhibitor cocktail immediately before use.- RQ1 buffer (40 mM Tris/HCl pH 8, 10 mM MgSO4, 1 mM CaCl2);
- High-salt wash buffer (TBS600/800/1000-T) (50 mM Tris-HCl pH 7.4, 600/800/1000 mM NaCl, 0.05% Tween-20).
Dephosphorylation and Labeling
- Linker wash buffer (TBS400-T) (50 mM Tris-HCl pH 7.4, 400 mM NaCl, 0.05% Tween-20);
- PNK dephosphorylation reaction buffer, pH 6.5 (350 mM Tris/HCl pH 6.5, 50 mM MgCl2, 5 mM DTT).
Protein Gel and Transfer
- 20× NuPAGE MOPS SDS running buffer (50 mM MOPS, 50 mM Tris base, 0.1% SDS, 1 mM EDTA, pH7.7 (do not adjust pH));
- 20× NuPAGE transfer buffer (25 mM Bicine, 25 mM Bis-Tris (free base), 1 mM EDTA, pH 7.2 (do not adjust pH)).
Note: Add 20% Methanol in 1× NuPAGE transfer buffer.Protein Digestion and RNA Isolation
- CLIP-PK buffer (100 mM Tris/HCl pH7.4, 50 mM NaCl, 10 mM EDTA, 1% SDS);
- PK-Urea buffer (100 mM Tris/HCl pH7.4, 50 mM NaCl, 10 mM EDTA, 7 M Urea).
Adapter Ligation and PCR
- Buffer RLT lysis buffer (QIAGEN GmbH, Hilden, Germany; Cat. no.: 79216).
Western Blot
- Powdered milk (Carl Roth GmbH + Co. KG, Karlsruhe, Germany; Cat. no.: T145.3);
- Normal rat IgG-HRP antibody (Santa Cruz Biotechnology Inc., Heidelberg, Germany; sc-2750);
- Lumi-Light Plus Western Blotting Substrate (Roche Diagnostics GmbH, Mannheim, Germany; Cat. no.: 12015196001).
2.2. Equipment
2.2.1. General Devices
- Cooling centrifuge;
- Scales;
- Thermomixer;
- DynaMag-2 Magnet (Thermo Fisher Scientific, Waltham, MA, USA; Cat. no.: 12321D);
- Thermocycler;
- Typhoon FLA 9500 biomolecular imager (GE Healthcare GmbH, Munich, Germany; Cat. no.: FLA 9500);
- Curix 60 Photo Developer (Agfa-Gevaert Group, Mortsel, Belgium; Cat. No.: Curix 60).
2.2.2. Cell Culture, Lysis, and Immunoprecipitation
- Fifteen cm cell culture dishes (Sarstedt AG & Co. KG, Nümbrecht, Germany, Cat. no.: 83.3903.300);
- SafeSeal reaction tube, 1.5 mm, PP, PCR performance-tested, Low protein-binding (Sarstedt, Nümbrecht, Germany; Cat no.: 72.706.600);
- Bio-Link BLX-254 UV-Crosslinker (Vilber Lourmat, Eberhardzell, Germany, Cat. no.: BLX-254);
- Scraper;
- Branson Sonifier 250 analog ultrasonic cell disruptor with a 1/8” catenoidal tip (BRANSON Ultrasonic Corporation, Danbury, CT, USA; Cat. no.: Branson Sonifier 250; tip Cat. no.: 609-002-021).
2.2.3. Protein Gel and Transfer
- XCell SureLock Mini-Cell and XCell II Blot Module (Thermo Fisher Scientific, Waltham, MA, USA; Cat. no.: EI0002);
- Power supply;
- NuPAGE Novex 4–12% Bis-Tris Protein gels, 15-well, 1.0 mm (Thermo Fisher Scientific, Waltham, MA, USA; Cat. no.: NP0323BOX);
- NuPAGE Novex 4–12% Bis-Tris Protein gels, 15-well, 1.5 mm (Thermo Fisher Scientific, Waltham, MA, USA; Cat. no.: NP0336BOX);
- Amersham Protran 0.45 µm NC nitrocellulose blotting membrane (GE Healthcare GmbH, Munich, Germany; Cat. no.: 10600062);
- Whatman paper (Bio-Rad Laboratories, Inc., Feldkirchen, Germany; Cat. no.: 1703960);
- Amersham Hyperfilm MP high-performance autoradiography film (GE Healthcare GmbH, Munich, Germany; Cat. no.: 28906843);
2.2.4. Protein Digestion and RNA Isolation
- Scalpel;
- Two mL tubes (Eppendorf AG, Hamburg, Germany; Cat. no.: 0030123344);
- Phase Lock Gel Heavy 2 mL tubes (QuantaBio; Beverly, MA, USA; Cat. no.: 2302830).
2.2.5. Reverse Transcription
- PCR tubes (Nerbe plus, Winsen/Luhe, Germany; Cat. no.: 04-032-0500)
2.2.6. Western Blot
- Amersham Hyperfilm ECL high-performance chemiluminescence film (GE Healthcare GmbH, Munich, Germany; Cat. no.: 28906837).
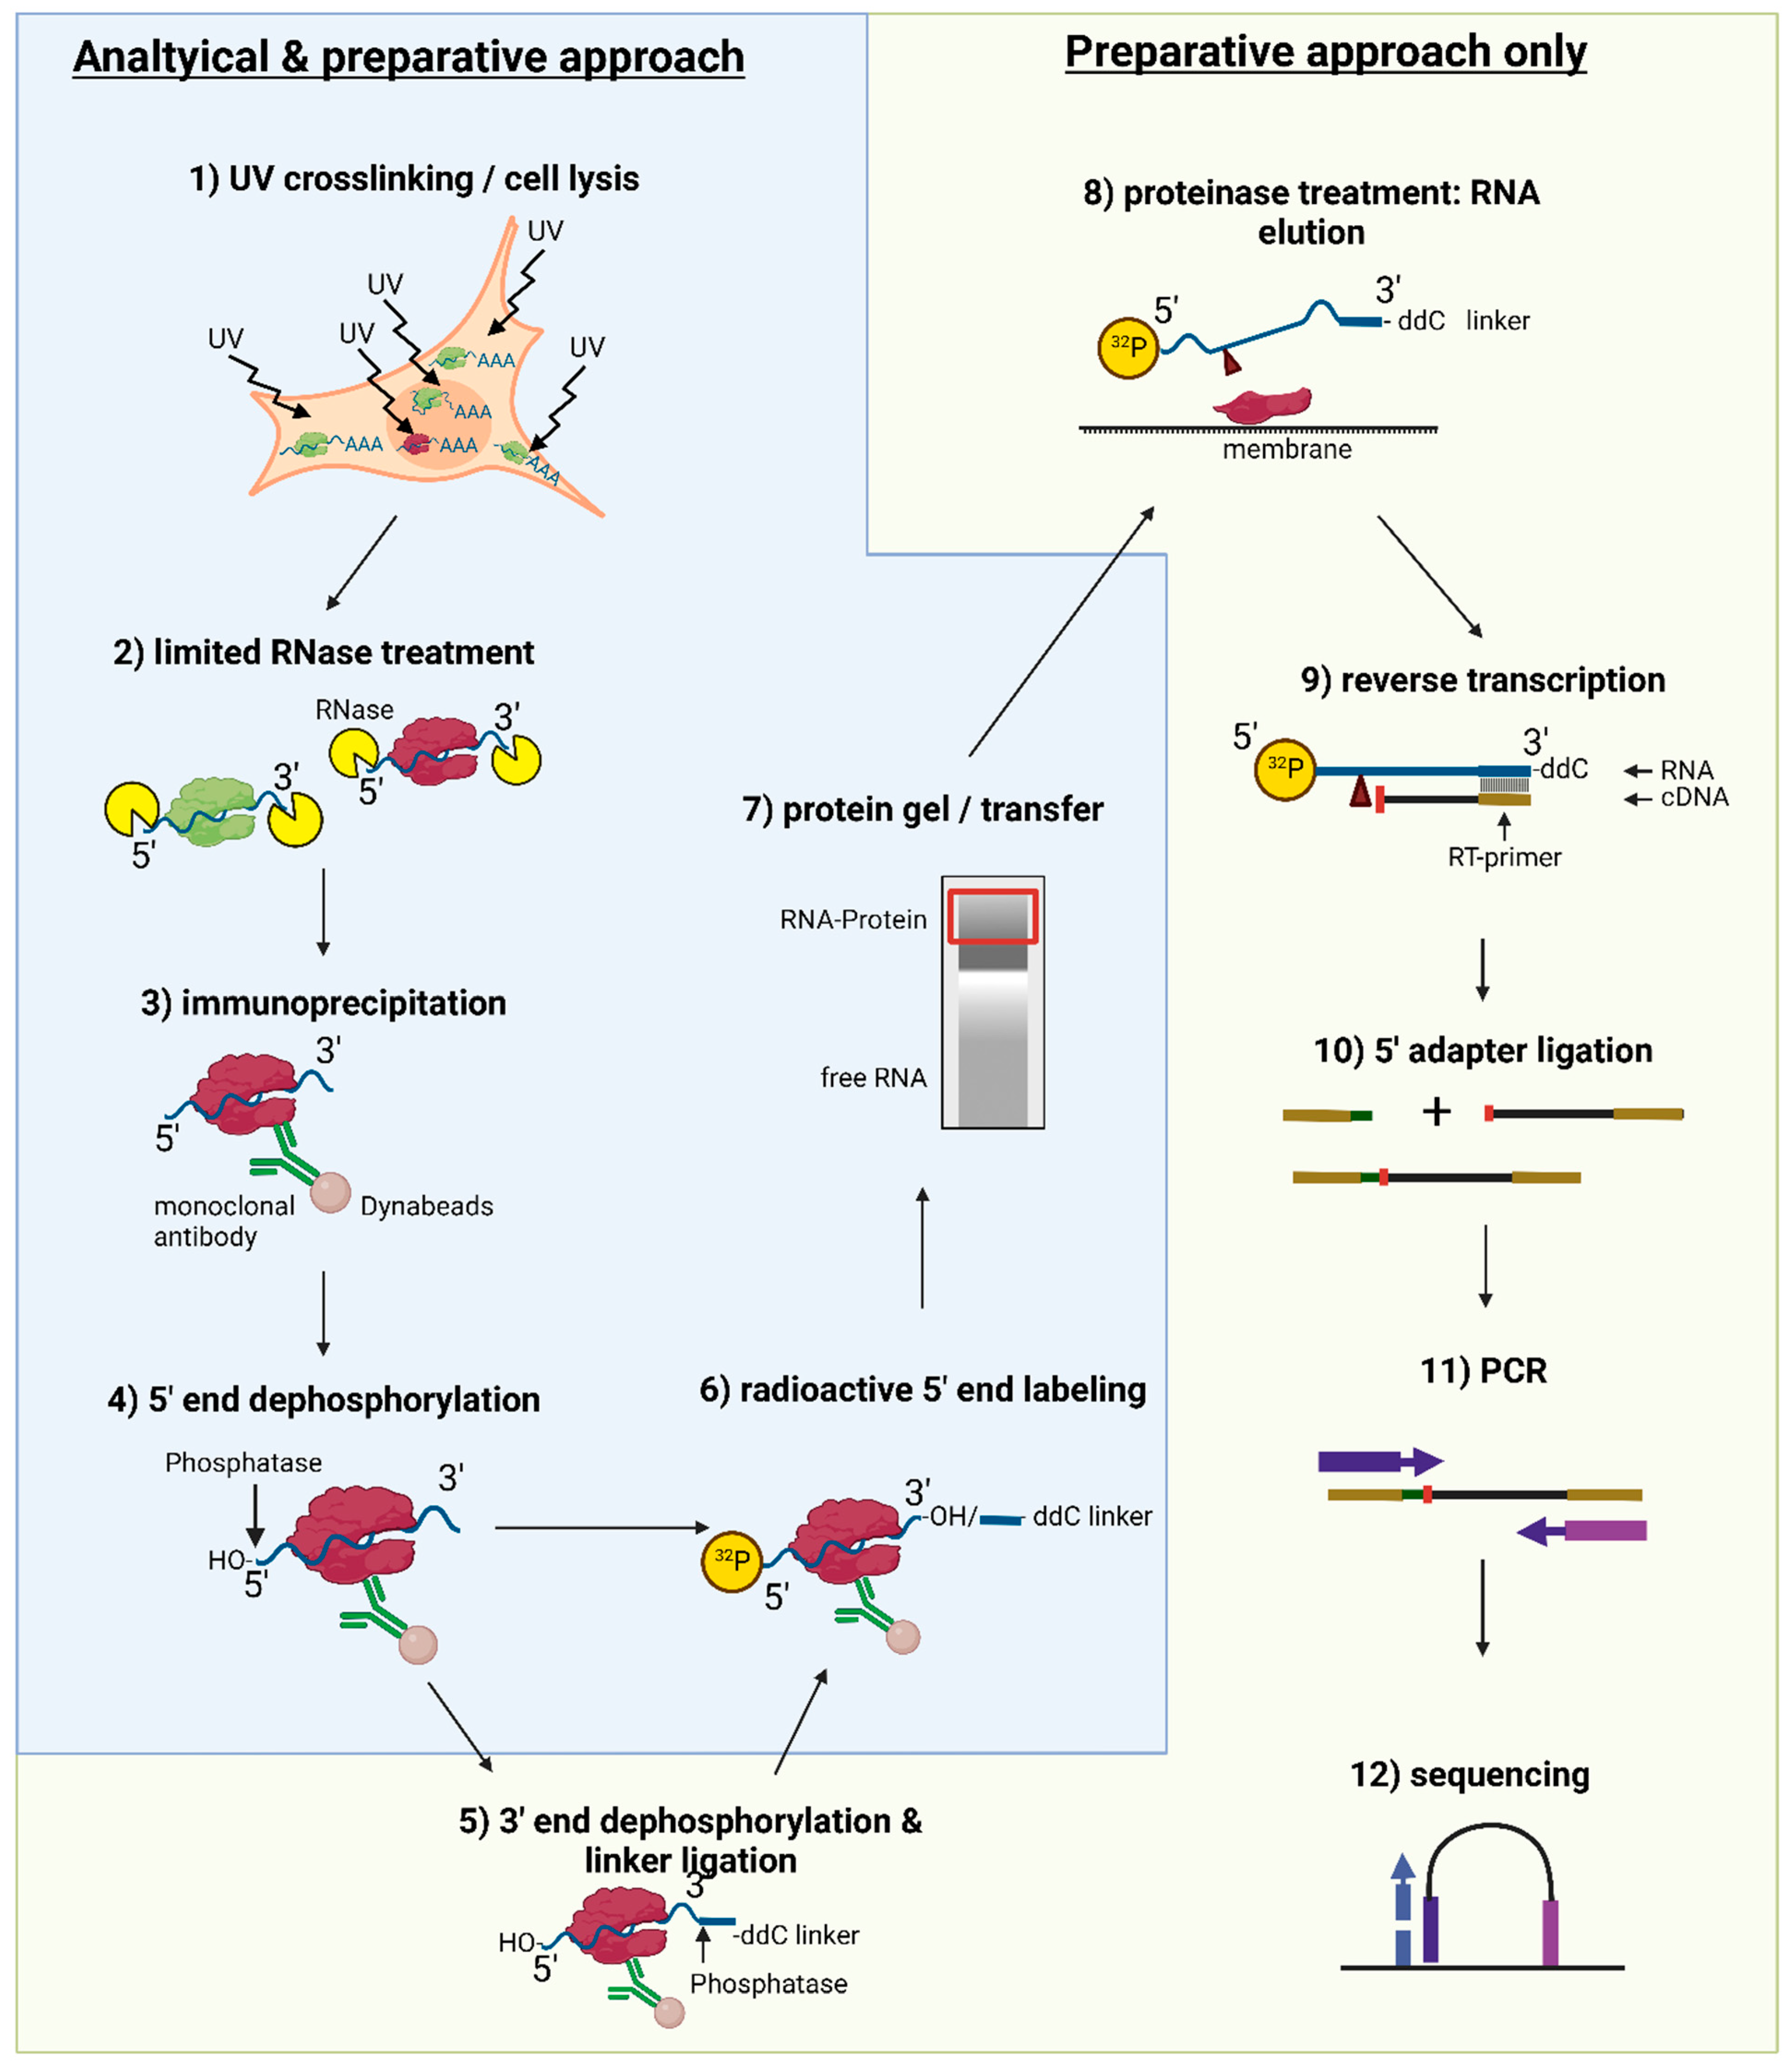
3. Procedure
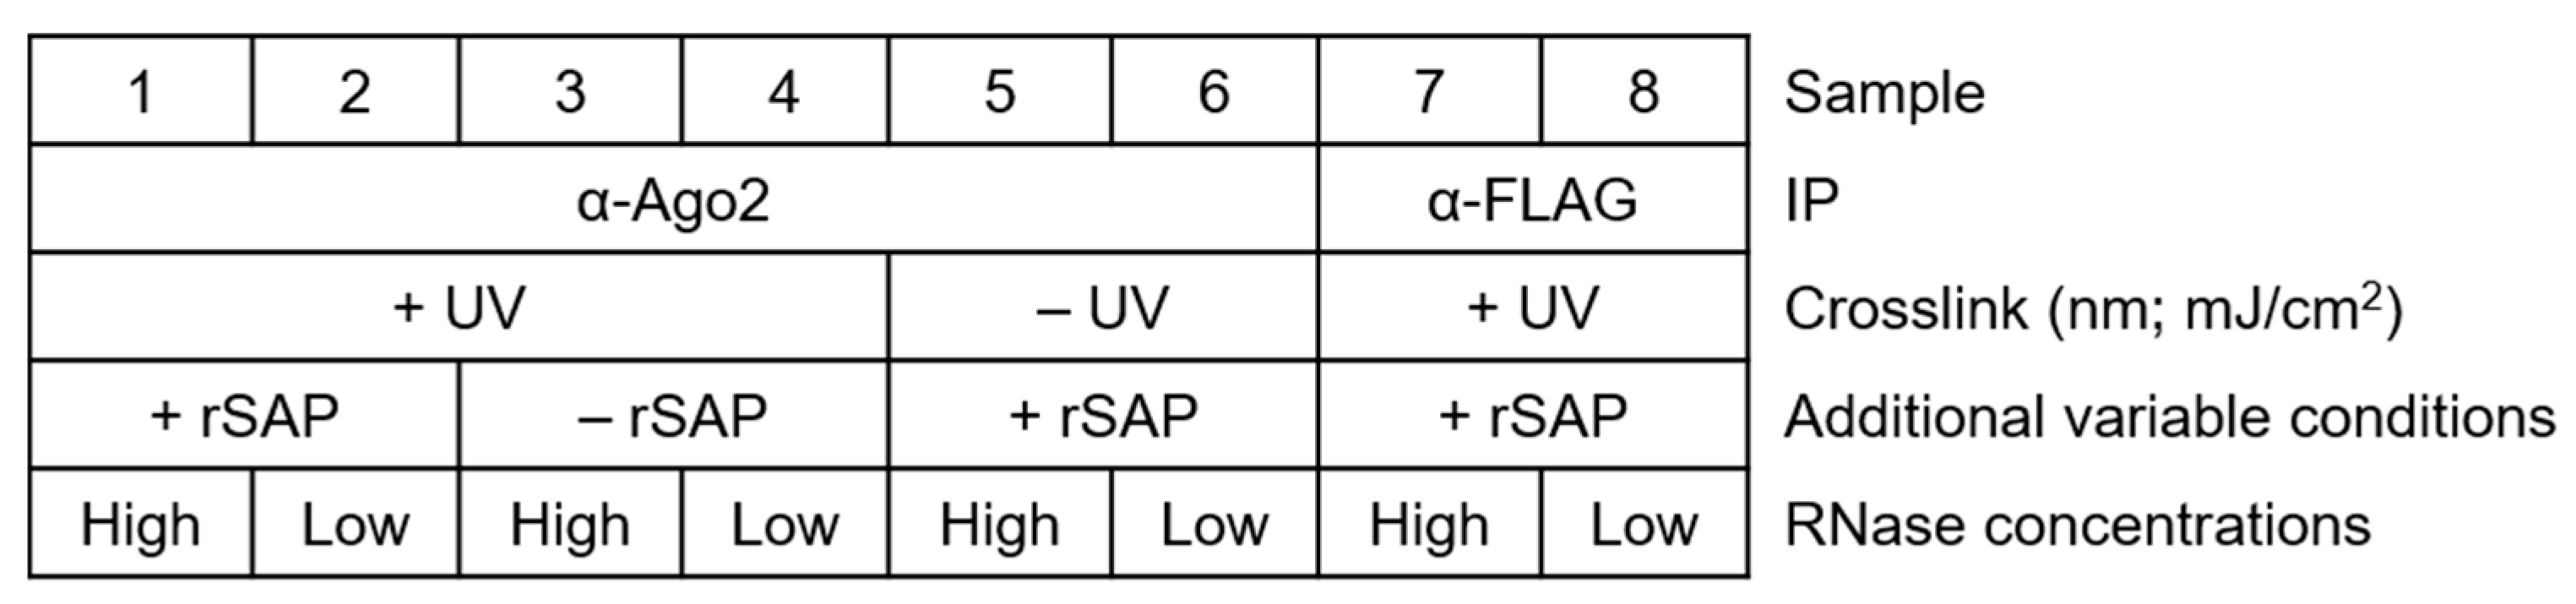
For a general setup of the experiment, make sure to plan several controls appropriately, as shown in Figure 2. Proper labeling minimizes mix-up of samples and simplifies tracking of the samples and treatments.3.1. Bead Preparation for Immunoprecipitation; Time for Completion: 2.5 h
Note: For an analytical approach, up to 50% of the volumes suffice, and recommended volumes differ depending on the approach.- Wash the bead suspension with 2 × 1 mL cold TBS-T.
- Analytical approach: Use 20 µL bead suspension per reaction.
- Preparative approach: Use 50 µL bead suspension per reaction.
- Add monoclonal α-Ago2 antibody to beads.
![Mps 05 00096 i001]() Note: The smaller volumes listed below have been shown to suffice, but increasing the α-Ago2 antibody amounts may increase the pulldown efficiency for some cell lines.
Note: The smaller volumes listed below have been shown to suffice, but increasing the α-Ago2 antibody amounts may increase the pulldown efficiency for some cell lines.- Analytical approach: For every 20 µL of beads, add 0.5–1 µg α-Ago2 antibody or control antibody and 50 µL TBS-T.
- Preparative approach: For every 50 µL of beads, add 1–2 µg of α-Ago2 antibody or control antibody and 200 µL TBS-T.
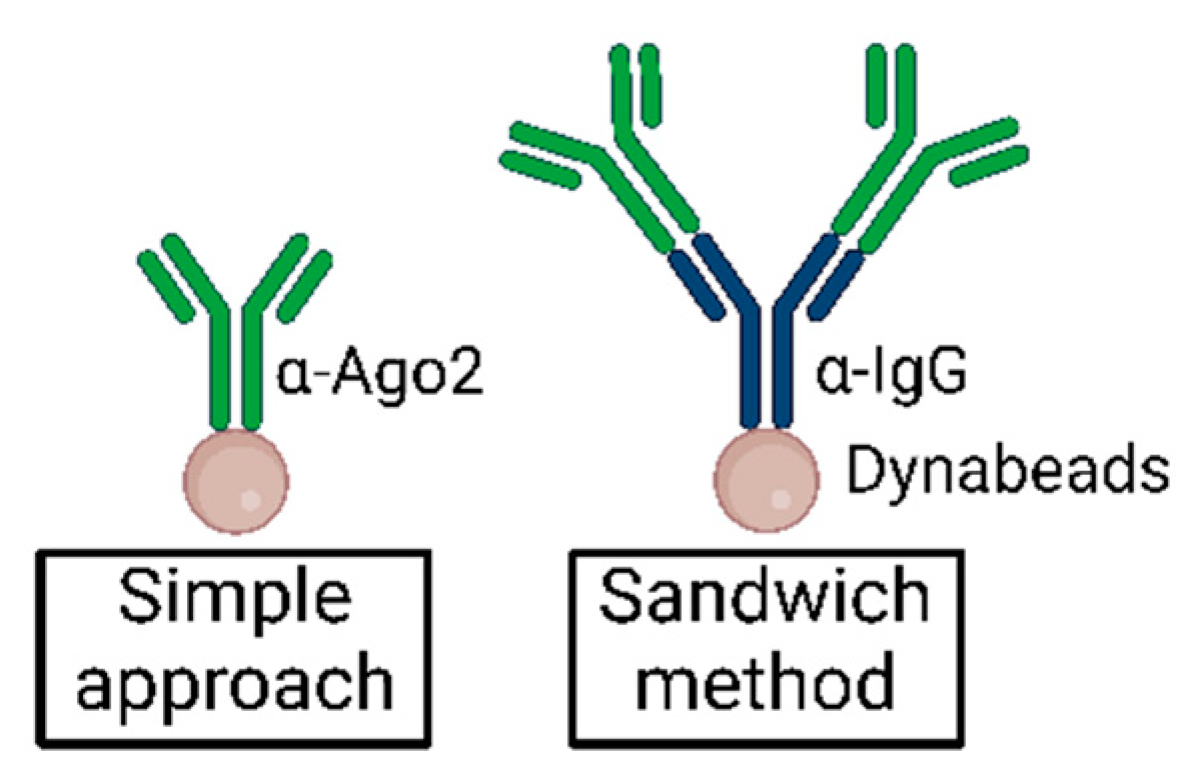
OPTIONAL ADJUSTMENT An antibody sandwich method can be used by incubating beads with ~2 µg unconjugated α-IgG (rat) antibody for 1 h, washing 2× with cold TBS-T, and subsequently incubating with ~0.5–1 µg α-Ago2 antibody for 1 h according to an analytical approach (see Section 5.3) [27]. This may increase Ago2-IP efficiency in some systems. - Incubate on a wheel for 2 h at 4 °C. Continue with Section 3.2 and Section 3.3.
3.2. Lysate Preparation; Time for Completion: Harvesting: 10–15 min Per Plate; Lysis: 1−2 h
3.2.1. Pre-CLIP Cell Treatment
Note: This protocol is designed for adherent cell lines. Thus, a crosslinking procedure needs to be adapted for non-adherent cells.3.2.2. Crosslinking of Cells
- 1.
- Remove the medium by aspiration;
- 2.
- Wash cells 2 times with ice-cold 1× PBS, and aspirate between washes;
- 3.
- Remove all liquid before crosslinking;
- 4.
- Place culture dish in a tray with ice water for cooling and remove lid to crosslink cells under UV light according to Table 1 below.
![Mps 05 00096 i001]() Note: Cells that grow in dense clusters may require increased UV irradiation (we recommend no more than 450 mJ/cm2) (Figure 3).
Note: Cells that grow in dense clusters may require increased UV irradiation (we recommend no more than 450 mJ/cm2) (Figure 3). - 5.
- Add 1 mL 1× PBS to cells, scrape to harvest, and collect in tube.
![Mps 05 00096 i001]() CRITICAL STEP: Keep cells on ice unless stated otherwise;
CRITICAL STEP: Keep cells on ice unless stated otherwise; - 6.
- Centrifuge for 5 min at 2000 rpm at 4 °C;
- 7.
- Remove all liquid.
- 8.
![Mps 05 00096 i002]() PAUSE STEP: Continue directly with Section 3.2.3; otherwise, snap freeze in liquid nitrogen and store at −80 °C until further use.
PAUSE STEP: Continue directly with Section 3.2.3; otherwise, snap freeze in liquid nitrogen and store at −80 °C until further use.
3.2.3. Cell Lysis
- Add 4 packed cell volumes (mg of pellet) of lysis buffer.
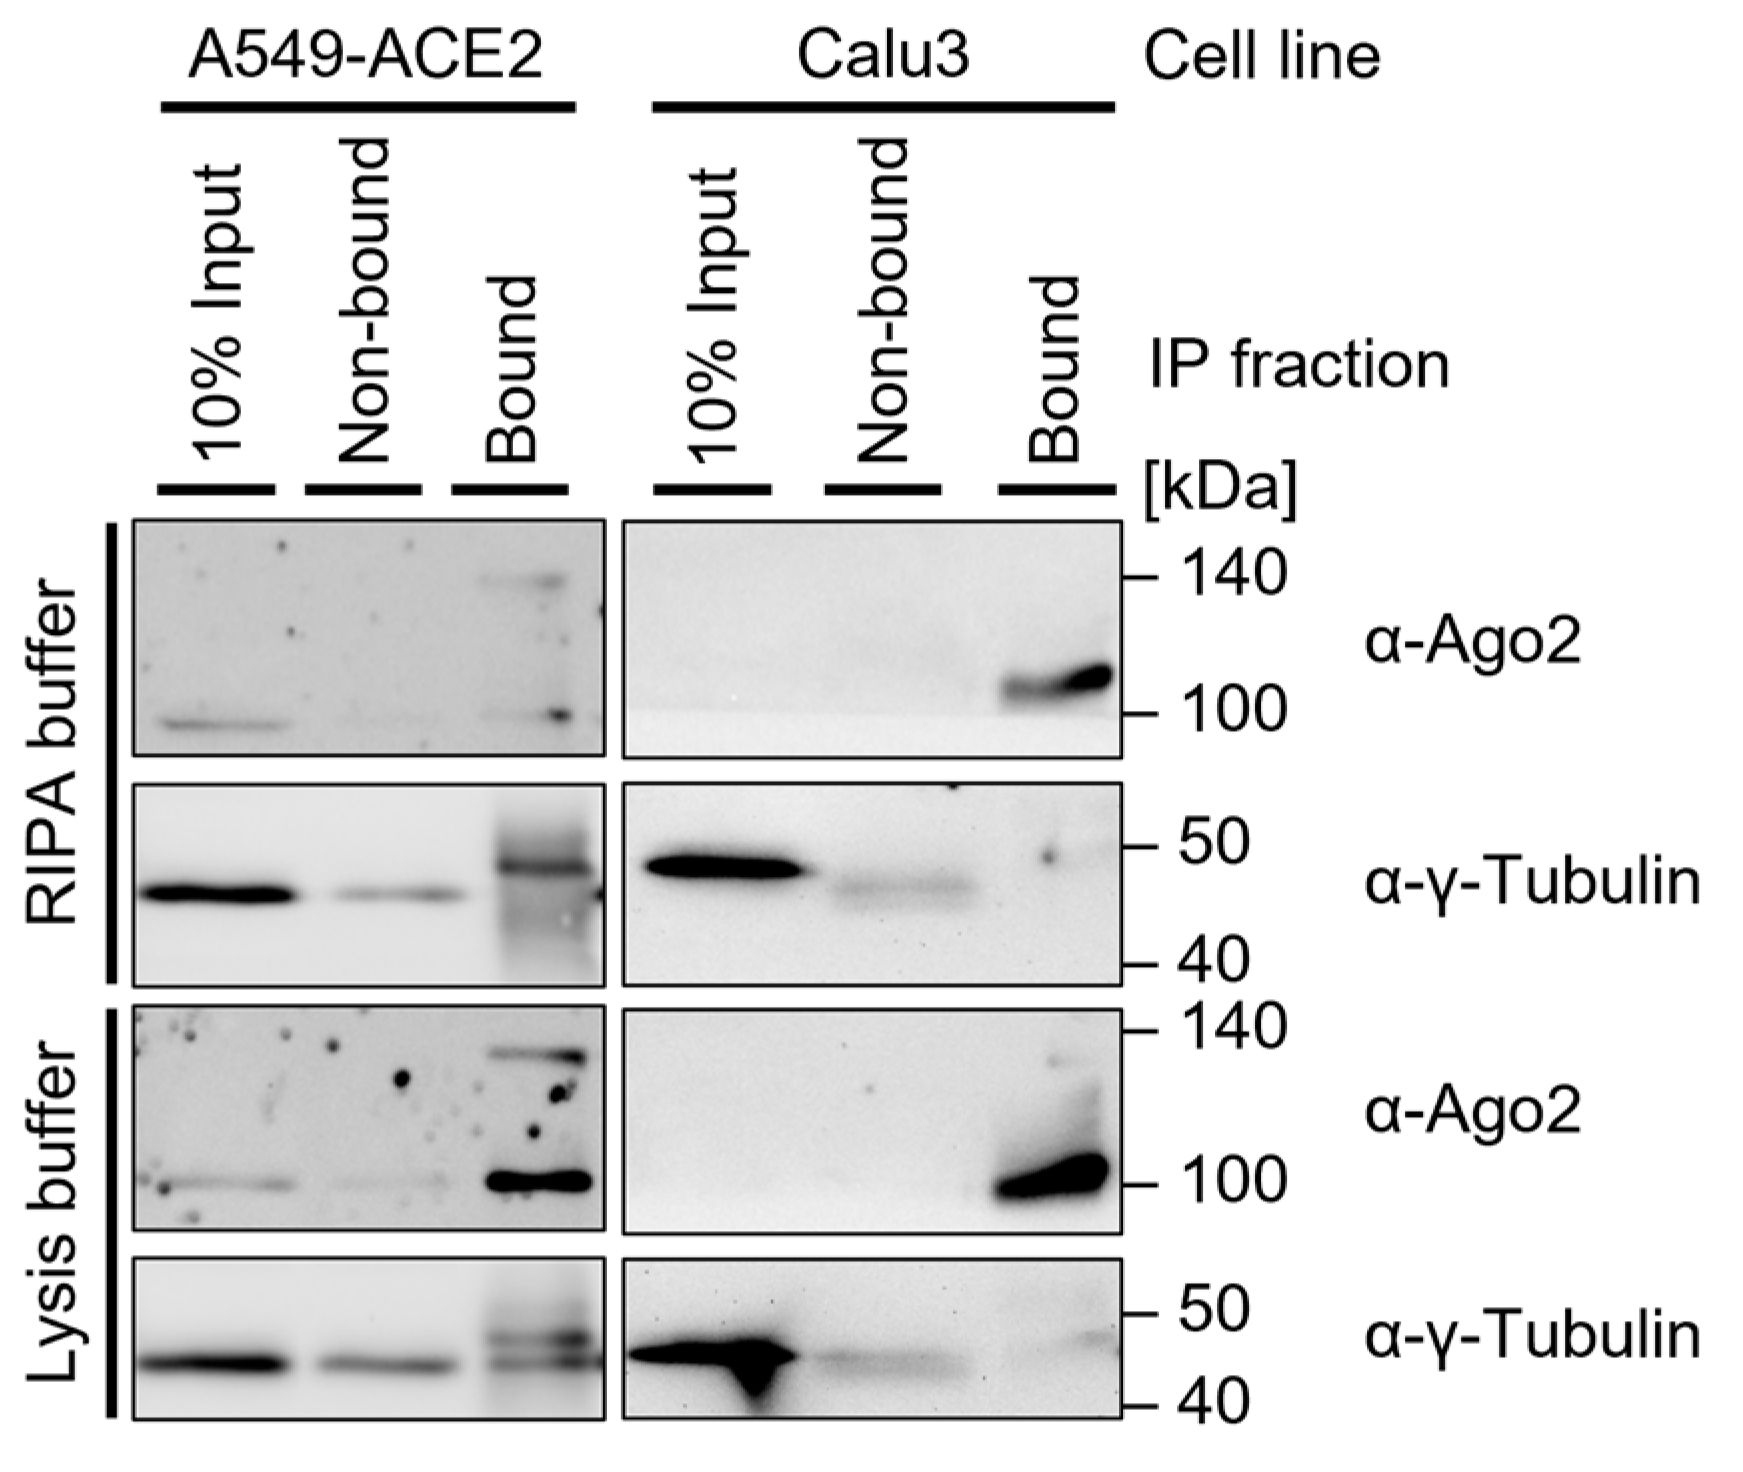
![Mps 05 00096 i001]() Note: When interested in the cytosolic Ago2 fraction, the use of lysis buffer is generally a favorable approach (Figure 4). RIPA buffer may improve the lysis of some cell lines and should be used for cases in which nuclear extracts are relevant. The required lysis conditions may differ depending on the cell type. Lysis buffer modifications include:
Note: When interested in the cytosolic Ago2 fraction, the use of lysis buffer is generally a favorable approach (Figure 4). RIPA buffer may improve the lysis of some cell lines and should be used for cases in which nuclear extracts are relevant. The required lysis conditions may differ depending on the cell type. Lysis buffer modifications include:- The addition of non-ionic SDS detergent (as described for RIPA buffer), which may improve lysis, in particular that of the nuclear fraction). The Addition of 0.5% sodium deoxycholate is a common approach to further dissociate and solubilize membrane-associated proteins [1,30]. For nuclear extracts, the addition of 1% Triton X-100 may be considered, which strongly permeabilizes the cell membrane and thus improves protein release [14];
- Increased salt concentrations of up to 300 mM NaCl in the lysis buffer, which may further support lysis efficiency by increasing the osmotic pressure [31];
- Control for the cell lysis efficiency using 1× PBS instead of Tris-based buffer [9].
- OPTIONAL STEP Sonicate cells in a Falcon tube 2 × 15 s (duty cycle/pulse 40%, output control/amplitude 5) to disrupt large complexes and increase yield.
![Mps 05 00096 i001]() Note: This is generally used for bacterial and plant cells but may support the lysis of more resilient cells. The lysis efficiency should be tested in advance. For these first experiments, pellets and non-bound fractions should be included (Figure 4). If the Ago2 Western blot signal is missing or low in the supernatant after lysis and most Ago2-protein is in the pellet after centrifugation of cell debris, sonication should be considered.
Note: This is generally used for bacterial and plant cells but may support the lysis of more resilient cells. The lysis efficiency should be tested in advance. For these first experiments, pellets and non-bound fractions should be included (Figure 4). If the Ago2 Western blot signal is missing or low in the supernatant after lysis and most Ago2-protein is in the pellet after centrifugation of cell debris, sonication should be considered.- Depending on the sonicator, at least 1 mL of suspension may be required for sonication; thus, the sample size should be adjusted using additional input material or by increasing the lysis buffer volume per weight;
- If the pellet is resuspended in RIPA buffer, the addition of detergents is suggested only after sonication to reduce foam formation.
- Incubate on ice for 10 min and vortex vigorously every 3 min.
- OPTIONAL ADJUSTMENT: Extension of lysis incubation time from 10 min to ≥30 min on ice and vortexing every 10 min may improve protein concentrations for some cell lines (data not shown) [32].
- Centrifuge for ≥20 min at a minimum of 13,000 rpm at 4 °C.
![Mps 05 00096 i001]() Transfer lysate to SafeSeal reaction tubes and continue to work in these low-protein binding tubes.
Transfer lysate to SafeSeal reaction tubes and continue to work in these low-protein binding tubes.![Mps 05 00096 i001]() Note: Ensure that the lysate volume (e.g., between low and high RNase) is distributed equally between all samples. The sample volume for IP should be between 100 and 250 µL for the analytical approach and at least 200 µL for the preparative CLIP approach.
Note: Ensure that the lysate volume (e.g., between low and high RNase) is distributed equally between all samples. The sample volume for IP should be between 100 and 250 µL for the analytical approach and at least 200 µL for the preparative CLIP approach.- Take 5–10% input material for Western control and add 4× LDS-loading buffer, 10× reducing agent, and water. Store at −20 °C until further use.
3.3. DNase and Partial RNase Digestion; Time for Completion: 20 min
- For each IP sample, add 2 volumes of RQ1 buffer to the extracts;
- Add 1:500 volume TURBO DNase and 1:1000 RNaseOUT to each sample;
- Prepare RNase I dilutions in RQ1 buffer (Table 2); RNase I is used because it has no sequence specificity, reducing possible biases in library complexity [3,10];
- If higher concentrations (e.g., 10−2) of RNase are required, the more cost-efficient RNase A can be used instead of RNase I.
![Mps 05 00096 i001]() Note: If the mix is prepared with RNase A instead of RNase I, RNaseOUT cannot be added to the mix because it inhibits RNase A.
Note: If the mix is prepared with RNase A instead of RNase I, RNaseOUT cannot be added to the mix because it inhibits RNase A.![Mps 05 00096 i001]() Note: For Ago2-CLIP with α-Ago2 Clone 11A9 in Calu3 and A549-ACE2 cells, we achieved satisfactory results with high (10−3) to low (10−5) dilutions.
Note: For Ago2-CLIP with α-Ago2 Clone 11A9 in Calu3 and A549-ACE2 cells, we achieved satisfactory results with high (10−3) to low (10−5) dilutions. - Add 1:100 volume of RNase I dilution to each sample and incubate for 3 min at 37 °C, shaking at 800 rpm. Fill the wells of thermomixer with water for more efficient heat conductivity;
- Immediately put on ice for ≥3 min.
3.4. Immunoprecipitation; Time for Completion: 2.5−3.5 h
3.4.1. Continued Bead Preparation
- Wash the bead–antibody suspension 2 times with cold TBS-T;
- Remove all liquid.
3.4.2. Immunoprecipitation
![Mps 05 00096 i001]() Note: TBS800-T was found to be most efficient for stringent washing in these experiments, but the salt concentration can be verified by an IP test or by an analytical approach by comparison with, for example, TBS-600/800/1000-T (600/800/1000 mM NaCl) (Figure 3).
Note: TBS800-T was found to be most efficient for stringent washing in these experiments, but the salt concentration can be verified by an IP test or by an analytical approach by comparison with, for example, TBS-600/800/1000-T (600/800/1000 mM NaCl) (Figure 3).
- Add 1:50 volume of 5 M NaCl (final concentration of 150 mM) to each lysate;
- Add extract to prepared beads and rotate at 4 °C for 2 h;
- OPTIONAL STEP: Transfer the non-bound fraction to a new tube for Western blot controls and store at −20 °C until further use;
- Wash 4 times at 4 °C using TBS800-T; during the 3rd wash, transfer beads to fresh tubes. This prevents the elution of complexes unspecifically bound to the plastic of the tube when incubating with sample loading buffer. This may reduce the background when no SafeSeal reaction tubes are used;
- Wash 2 times with cold PNK wash buffer.
3.5. On-Bead Phosphatase Treatment (5′ End); Time for Completion: 1 h
- Prepare 1× phosphatase mix (Table 3):

| Volume Per Reaction (µL) | Reagent |
|---|---|
| 4.00 | 10× phosphatase buffer |
| 1.50 | rSAP (1 U/µL) |
| 0.50 | RNaseOUT (40 U/µL) |
| 34.00 | RNase-free water |
| Total volume: 40.00 |
- 2.
- Add 40 µL phosphatase mix to beads and incubate at 37 °C for 20 min;
- 3.
- Wash 2 times with TBS400-T and transfer to fresh tube during 2nd wash;
- 4.
- Wash 2 times with PNK wash buffer.
 PAUSE STEP: Analytical approach: Store beads in PNK wash buffer overnight at 4 °C or continue with Section 3.6.
3.6. On-Bead Phosphatase Treatment and 3′-RNA Linker Ligation; Time for Completion: 17 h
Note: The additional washing steps during linker ligation further reduce background signal in radiography, thus simplifying Section 3.8.1, i.e., RNA isolation from the CLIP membrane.3.6.1. Phosphatase Treatment of 3′ Ends
- Prepare phosphatase mix to dephosphorylate the 3′ end. The low pH of PNK dephosphorylation buffer enables dephosphorylation by T4 PNK (Table 4);
| Volume Per Reaction (µL) | Reagent |
|---|---|
| 4.00 | 5× PNK dephosphorylation buffer (pH 6.5) |
| 0.50 | T4 PNK enzyme (NEB, with 3′ phosphate activity) |
| 0.50 | RNaseOUT (40 U/µL) |
| 15.00 | RNase-free water |
| Total volume: 20.00 |
- 2.
- Add to beads and incubate in thermomixer at 37 °C and 1000 rpm for 20 min;
- 3.
- Wash 2 times with TBS400-T; transfer to a fresh tube during the 2nd wash;
- 4.
- Wash 2 times with PNK wash buffer.
3.6.2. On-Bead 3′ Linker Ligation
- Prepare ligase mix (Table 5):
| Volume Per Reaction (µL) | Reagent |
|---|---|
| 1.00 | Preadenylated linker L3-App (20 µM) |
| 2.00 | 10× T4 RNA-ligase buffer |
| 1.00 | T4 RNA-ligase |
| 0.50 | RNaseOUT (40 U/µL) |
| 4.00 | PEG400 |
| 11.50 | RNase-free water |
| Total volume: 20.00 |
- 2.
- Add ligase mix to beads;
PAUSE STEP: Incubate at 16 °C and 1000 rpm overnight;- 3.
- Wash twice with cold PNK wash buffer.
3.7. Radioactive Labeling, SDS-PAGE, and Nitrocellulose Transfer; Time for Completion: Gel and Transfer: 4−7 h; Exposure: 16−72 h
From this point forward, conduct experiments in an isotope laboratory with appropriate protective measures.3.7.1. Radioactive Labeling
- Prepare PNK mix (Table 6):
Note: Our experience shows that Ago2-CLIP can effectively be conducted with a mix of 1 part [gamma-32P]-ATP and 1 part non-radioactive ATP (same concentrations) per sample. Ratios of [gamma-32P]-ATP and ATP can be adjusted further to reduce or increase the radioactive signal. Whereas a stronger signal reduces exposure times of X-ray films, additional radioactivity will be transferred into the RNA isolation.- Analytical approach: Use 1 µL of ATP mix;
- Preparative approach: Use 2.5 µL of ATP mix.
- 2.
- Add to beads and incubate in thermomixer at 37 °C for 20 min at 1000 rpm;
- 3.
- Wash once with cold TBS-T;
- 4.
- Wash once with cold PNK wash buffer;
- 5.
- Resuspend beads in 1× LDS-loading buffer (4× NuPAGE LDS-loading buffer, 10× NuPAGE Reducing agent, RNase-free water);
- Analytical approach: Use 20 µL LDS-loading buffer;
- Preparative approach: Use 30 µL LDS-loading buffer;
- 6.
- Denature for 10 min at 70 °C at 1000 rpm.
3.7.2. SDS-PAGE
CRITICAL STEP: It is crucial to use a protein gel system with a neutral pH to prevent RNA degradation by alkaline hydrolysis [1]. The Invitrogen NuPAGE system meets these requirements. Alternatively, other gel systems that retain neutral pH during the electrophoresis run, e.g., as described by Graham et al., can be used [33].- Use a NuPAGE system and 4–12% Bis-Tris gels in 1× NuPAGE MOPS SDS running buffer;
- Analytical approach: gels with a well size of 1.0 mm are sufficient;
- Preparative approach: use gels with a well size of 1.5 mm to load more volume and yield a higher RNA amount for sequencing.
- Load 6 µL prestained protein marker;
- Load inputs and samples in appropriate volume for well size;
- Run gel for a minimum of 2 h at 200 V.
![Mps 05 00096 i001]() Note: The relevant area is above the band of the protein of interest (above 100 kDa); thus, the gel run can be extensive. For Ago2-CLIP, a 2 to 3 h gel run is optimal.
Note: The relevant area is above the band of the protein of interest (above 100 kDa); thus, the gel run can be extensive. For Ago2-CLIP, a 2 to 3 h gel run is optimal. ![Mps 05 00096 i001]() If analyzing truncated constructs, the duration should be adjusted accordingly.
If analyzing truncated constructs, the duration should be adjusted accordingly.
3.7.3. Transfer
- Incubate the nitrocellulose membrane, sponges, and Whatman paper in 1× NuPAGE transfer buffer (supplemented with 20% Methanol) for >20 min before use;
- Set up the system according to the manufacturer’s protocol;
- Blot at 30 V for 1 h or at 15 V overnight;
- Draw marker bands with a radioactive pen onto a piece of plastic bag and place on/next to membrane;
- Place inside a plastic bag;
- Expose the membrane;
- Analytical approach: Expose the membrane to a BAS-SR2040 imaging plate for 16−72 h at room temperature for subsequent visualization in Typhoon FLA 9500;
- Preparative approach: Expose the membrane one or multiple times to Amersham Hyperfilm MP high-performance autoradiography film for at least 16−72 h at −80 °C and develop in a photo developer.
![Mps 05 00096 i001]() Note: Exposing two films at once is an effortless method to obtain different exposure levels.
Note: Exposing two films at once is an effortless method to obtain different exposure levels.
3.8. RNA Isolation and Clean-Up; Time for Completion: 48−72 h
3.8.1. RNA Isolation from CLIP Membrane
- Use X-ray film as a reference and cut the region of interest from the CLIP membrane (Figure 6);
- Add nitrocellulose pieces to 2 mL reaction tubes containing 400 µL CLIP-PK buffer and 20 µL 20 mg/mL proteinase K;
- Incubate at 37 °C at 1000 rpm for 20 min;
- Add 400 µL of PK-urea buffer and incubate for an additional 20 min at 55 °C while shaking;
- Add 800 µL RNA-grade phenol/chloroform/isoamyl alcohol (25:24:1);
- Incubate for 5 min at 30 °C and 1000 rpm;
- Separate phases by spinning for 5 min at 13,000 rpm at 4 °C using Phase Lock Gel Heavy 2 mL tubes;
- Transfer aqueous layer into a new tube without touching the wax;
- Precipitate by adding 1 µL GlycoBlue and 80 µL 3 M sodium acetate, pH 5.5. Mix and add 0.7 volumes (616 µL) cold isopropanol;
![Mps 05 00096 i002]() PAUSE STEP: Store at −80 °C overnight for precipitation;
PAUSE STEP: Store at −80 °C overnight for precipitation; - Spin at full speed for ≥30 min at 4 °C;
- Remove the supernatant, wash pellets with 1 mL 70% ethanol, and spin for 5 min;
![Mps 05 00096 i002]() PAUSE STEP: Store in 70% ethanol at −80 °C until further processing;
PAUSE STEP: Store in 70% ethanol at −80 °C until further processing; - Dissolve pellets in 12 µL water;OPTIONAL STEP: As a control, perform a Western blot of the remaining nitrocellulose membrane under protective measures in an isotope laboratory.
3.8.2. Reverse Transcription
- Prepare RNA–primer mix (Table 7):
| Volume Per Reaction (µL) | Reagent |
|---|---|
| 12.00 | RNA |
| 1.00 | dNTP mix (10 mM) |
| 1.00 | RT1 oligo (0.5 pmol/µL working solution [stock: 100 µM = 100 pmol/µL]) |
- 2.
- Place in thermocycler: 70 °C 5 min, 25 °C hold until RT mix added. Mix by pipetting;
![Mps 05 00096 i001]() CRITICAL STEP: Never put on ice;
CRITICAL STEP: Never put on ice; - 3.
- Prepare RT mix (Table 8):
| Volume Per Reaction (µL) | Reagent |
|---|---|
| 4.00 | 5× first strand buffer |
| 1.00 | 0.1 M DTT |
| 0.50 | Superscript III RT (200 U/µL) |
| 0.50 | RNaseOUT (40 U/µL) |
| Total volume: 6.00 |
- 4.
- Add to sample (total volume 20 µL) and place in thermocycler at 25 °C for 5 min, 42 °C for 20 min, and 50 °C for 40 min, and hold at 4 °C;
- 5.
- Add 1.65 µL 1 M NaOH and incubate at 98 °C for 20 min to degrade the RNA and remove residual radioactive phosphates from the mixture in the subsequent cleanup step;
- 6.
- Add 20 µL 1 M HEPES-NaOH, pH 7.3;
PAUSE STEP: Store cDNA at −20 °C until further use.3.8.3. MyONE Cleanup
- Mix magnetic MyONE silane bead solution thoroughly and use 10 µL beads per sample;
- Wash beads with 500 µL RLT buffer using a magnetic stand and resuspend in 125 µL RLT buffer; add to sample and mix;
- Add 150 µL 100% ethanol and carefully mix by pipetting; incubate for 5 min at room temperature, mix, and incubate for an additional 5 min;
- Place beads on a magnetic rack and discard the supernatant;
- Resuspend beads in 1 mL 80% ethanol and transfer the mix to a new tube;
- Wash 2 times with 80% ethanol. Incubate 30 sec each time before placing the sample on a magnet;
- Spin down in a microcentrifuge, place on a magnet, and discard the supernatant;
- Air dry beads for 5 min at room temperature and resuspend in 5 µL water;
- Incubate the mix at room temperature for 5 min and
![Mps 05 00096 i001]() proceed without removal of beads;
proceed without removal of beads;
Note: At this point, samples should be free of residual radioactive ATP and RNA fragments. After verifying this, the experiment can be continued outside an of isotope laboratory.3.8.4. Second Linker Ligation to 3′ End of cDNA
- Add 2 µL (10 µM) specific second adapter (L#clip2.0, [1]) and 1 µL 100% DMSO to the cDNA–bead solution;
- Heat the mix for 2 min at 75 °C and immediately put on ice for >1 min;
- Prepare the ligation mix on ice. Mix by vigorously stirring, pipetting, and flicking to ensure homogeneity. Briefly spin down in a microcentrifuge;
- Add 12 µL ligation master mix to 8 µL sample-linker mix and mix thoroughly;
- Add another 1 µL RNA ligase to each sample to a final volume of 21 µL and mix by stirring;
![Mps 05 00096 i002]() PAUSE STEP: Agitate overnight at room temperature and 1100 rpm.
PAUSE STEP: Agitate overnight at room temperature and 1100 rpm.
3.8.5. MyONE Cleanup 2
- Mix magnetic MyONE silane bead solution thoroughly, and use 5 µL beads per sample;
- Wash beads with 500 µL RLT buffer and resuspend them in 60 µL RLT buffer; add to the sample and mix;
- Add 60 µL 100% ethanol and carefully mix by pipetting; incubate for 5 min at room temperature, mix, and incubate for another 5 min;
- Place beads on a magnetic rack and discard the supernatant;
- Resuspend beads in 1 mL 80% ethanol and transfer the mix to a new tube;
- Wash 2 times with 80% ethanol; incubate 30 s each time before putting the sample on the magnet;
- Spin in a microcentrifuge, place on the magnet, and discard supernatant;
- Air dry beads for 5 min at room temperature and resuspend in 23 µL water;
- Incubate the mix for 5 min at room temperature;
- Magnetically attract beads and add eluate to PCR mix of 3.9.
3.9. First PCR; Time for Completion: 4−5 h (Additional 2−3 h per Subsequent PCR Test
3.9.1. cDNA Preamplification
- Prepare the PCR mix (Table 10):
| Volume Per Reaction (µL) | Reagent |
|---|---|
| 22.50 | cDNA |
| 2.50 | Primer mix of P5Solexa_s and P3Solexa_s (10 µM each) |
| 25.00 | 2× Phusion HF PCR MasterMix |
| Total volume: 50.00 |
- 2.
- Run PCR (Table 11):
| Step | Temperature (°C) | Time | Cycles |
|---|---|---|---|
| 1 | 98 | 30 s | |
| 2 | 98 | 10 s | 6 cycles |
| 65 | 30 s | ||
| 72 | 30 s | ||
| 3 | 72 | 3 min | |
| 4 | 16 | Hold |
PAUSE STEP: Store cDNA at −20 °C until further use.3.9.2. First ProNex Size Selection
- Equilibrate ProNex chemistry to room temperature for 30 min;
- Resuspend beads by vortexing vigorously;
- For a 50 µL sample (PCR product), add 147.5 µL beads (1:2.95 v/v ratio of sample to beads);
- Mix by pipetting 10 times up and down;
- Incubate samples at room temperature for 10 min;
- Place samples on a magnetic stand for 2 min, and discard the supernatant;Leave beads on the magnetic stand and add 300 µL ProNex wash buffer to the samples; incubate for 30–60 s before removal;
![Mps 05 00096 i001]() Note: Ensure the wash buffer covers all beads on the magnet;
Note: Ensure the wash buffer covers all beads on the magnet;![Mps 05 00096 i001]() CRITICAL STEP: Do not remove ProNex beads from magnet or resuspend during the wash; this can cause up to 20% sample loss. For large samples, increase the volume of ProNex wash buffer proportionally to the volume of samples and beads [1];
CRITICAL STEP: Do not remove ProNex beads from magnet or resuspend during the wash; this can cause up to 20% sample loss. For large samples, increase the volume of ProNex wash buffer proportionally to the volume of samples and beads [1]; - Repeat the wash and allow sample to air dry for 8–10 min (<60 min) until cracking starts;
- Remove the beads from the magnetic stand and start eluting the samples. Resuspend beads of the samples in 23 µL ProNex elution buffer;
- Resuspend all samples by pipetting; then, let them incubate for 5 min at room temperature;
- Return samples to the magnetic rack for 1 min; then, carefully transfer eluted cDNA to a clean tube.
PAUSE STEP: Freeze at −20 °C until further processing.3.9.3. Second PCR Amplification—PCR Cycle Optimization—Test PCR 1
- Prepare the PCR mix for two/three cycle numbers (Table 12):
| Volume Per Reaction (µL) | Reagent |
|---|---|
| Mastermix 1 | Per sample x cycle number |
| 7.00 | Water |
| 1.00 | Primer mix of P5/P3 Solexa (10 µM each) |
| Volume per cycle number: 8.00 | |
| Mastermix 2 | Per each reaction |
| 8.00 | Mastermix 1 |
| 1.00 | cDNA |
| 5.00 | 2× Phusion HF PCR MasterMix |
| Final volume per reaction: 10.00 |
- 2.
- Run PCR (Table 13):
| Step | Temperature (°C) | Time | Cycles |
|---|---|---|---|
| 1 | 98 | 30 s | |
| 2 | 98 | 10 s | 14, 16, 20 cycles |
| 65 | 30 s | ||
| 72 | 30 s | ||
| 3 | 72 | 3 min | |
| 4 | 16 | Hold |
CRITICAL STEP: At this point, the samples should not be opened in the same working space as before. If possible, switch to a designated post-PCR bench or even room and use different pipettes and equipment. Using the same pipettes as before may contaminate future samples with PCR products of previous experiments, falsifying the sequencing results;- 3.
- Combine 10 µL PCR with 2 µL 6× DNA-loading buffer and load 6 µL;
- 4.
- Use 0.5–1 µL of GeneRuler Low-Range DNA Ladder diluted in a total volume of 6 µL 1× loading buffer as a size marker, and load alongside samples;
- 5.
- Run on 7% PAA-TBE gel for 30 min at 200 V and stain for 10 min with ethidium bromide solution.
3.9.4. Second PCR Amplification—PCR Cycle Optimization—Test PCR 2
- For each cycle number, mix according to the PCR mix in Section 3.9.3.;
- Run PCR according to Section 3.9.3. with adjusted cycle numbers and proceed with the TBE gel protocol accordingly.
3.10. Preparative PCR; Time for Completion: 4−5 h
3.10.1. PCR
- Prepare the PCR mix (Table 14):
Note: We advise using only half of your library (10 µL); keep the other half as a backup;| Volume Per Reaction (µL) | Reagent |
|---|---|
| 8.00 | Water |
| 2.00 | Primer mix of P5/P3 Solexa (10 µM each) |
| 20.00 | 2× Phusion HF PCR MasterMix |
| 30.00 | Each |
| +10.00 | cDNA |
| Total volume: 40.00 |
- 2.
- Run PCR as previously described in Section 3.9.3 and Section 3.9.4, adjusted to the final cycle number;
- 3.
- Combine 5 µL PCR with 1 µL 6× DNA-loading buffer;
- 4.
- Use 0.5–1 µL of GeneRuler Low-Range DNA Ladder diluted in a total volume of 6 µL 1× loading buffer as a size marker, and load alongside samples;
- 5.
- Run on 7% PAA-TBE gel for 30 min at 200 V and stain for 10 min with ethidium bromide.
3.10.2. Second ProNex Size Selection to Remove Residual Primers
- Equilibrate ProNex beads to room temperature for 30 min and resuspend beads by vortexing vigorously;
- Based on the optimal sample-to-ProNex (v/v) ratio of 1:2.4, calculate the required volume of beads for all samples.
![Mps 05 00096 i001]() Note: Keep in mind that sample volume will be reduced as a result of removal of input;
Note: Keep in mind that sample volume will be reduced as a result of removal of input; - Take reagents to a post-PCR lab (e.g., for 34.5 µL volume per sample):
- 4.
- Take input from each sample, and pool in one tube (1% input + water + 1 µL 6× DNA-loading buffer; 6 µL total);
- 5.
- Add the calculated volume of beads to each sample. Mix by pipetting up and down 10 times;
- 6.
- Incubate the samples at room temperature for 10 min. Place the samples on a magnetic rack for 2 min;
- 7.
- Leave beads on magnetic stand and add 300 µL ProNex wash buffer to samples;
Note: Ensure that the wash buffer covers all beads on the magnet; incubate for 30–60 s before removal.- 8.
- Wash samples a second time with 300 µL ProNex wash buffer. Remove the wash buffer after 30–60 s;
- 9.
- Remove the beads from the magnetic rack and start eluting the samples. Be sure to elute beads of the samples in 20 µL ProNex elution buffer;
- 10.
- Resuspend all samples by pipetting and let them stand for 5 min at room temperature;
- 11.
- Return the samples to the magnetic stand for 1 min; then, carefully transfer the eluted cDNA to a clean tube;
- 12.
- Pool half of each sample in one reaction tube;
- 13.
- Use 1% of library to assess primer removal on a 7% PAA-TBE gel;
- Combine 1% library with water and 1 µL 6× DNA-loading buffer;
- 14.
- Analyze on 7% PAA-TBE gel together with previously pooled inputs (step 4) for 25 min to determine primers.
Note: We suggest retaining some of the samples as a backup.- For limited sample and linker numbers, spike in for sequencing is recommended.
4. Expected Results
4.1. DNase and Partial RNase Digestion
4.2. Immunoprecipitation
4.3. Radiography
5. Further Explorations and Troubleshooting
5.1. α-Ago2 Antibody Choice
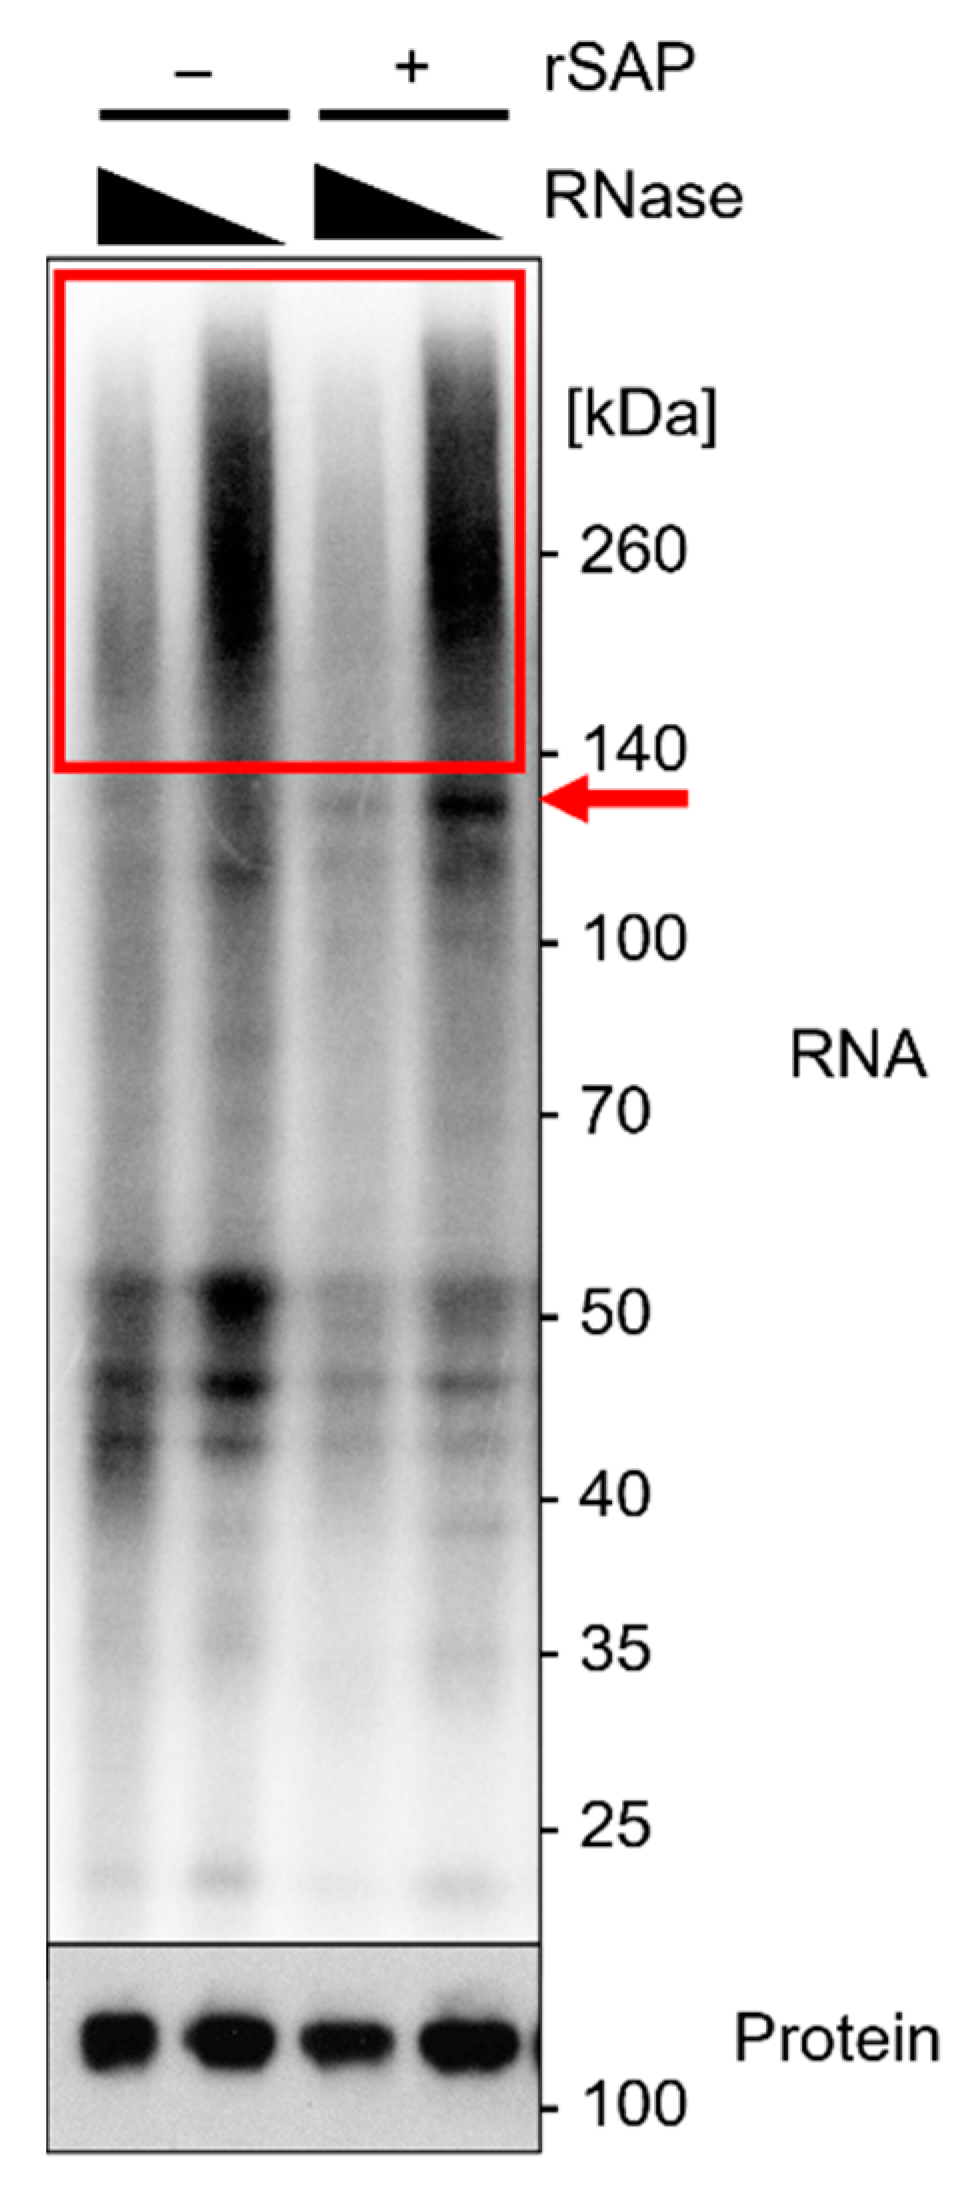
5.2. Depletion of Large Ribonucleoprotein Particles (RNPs)
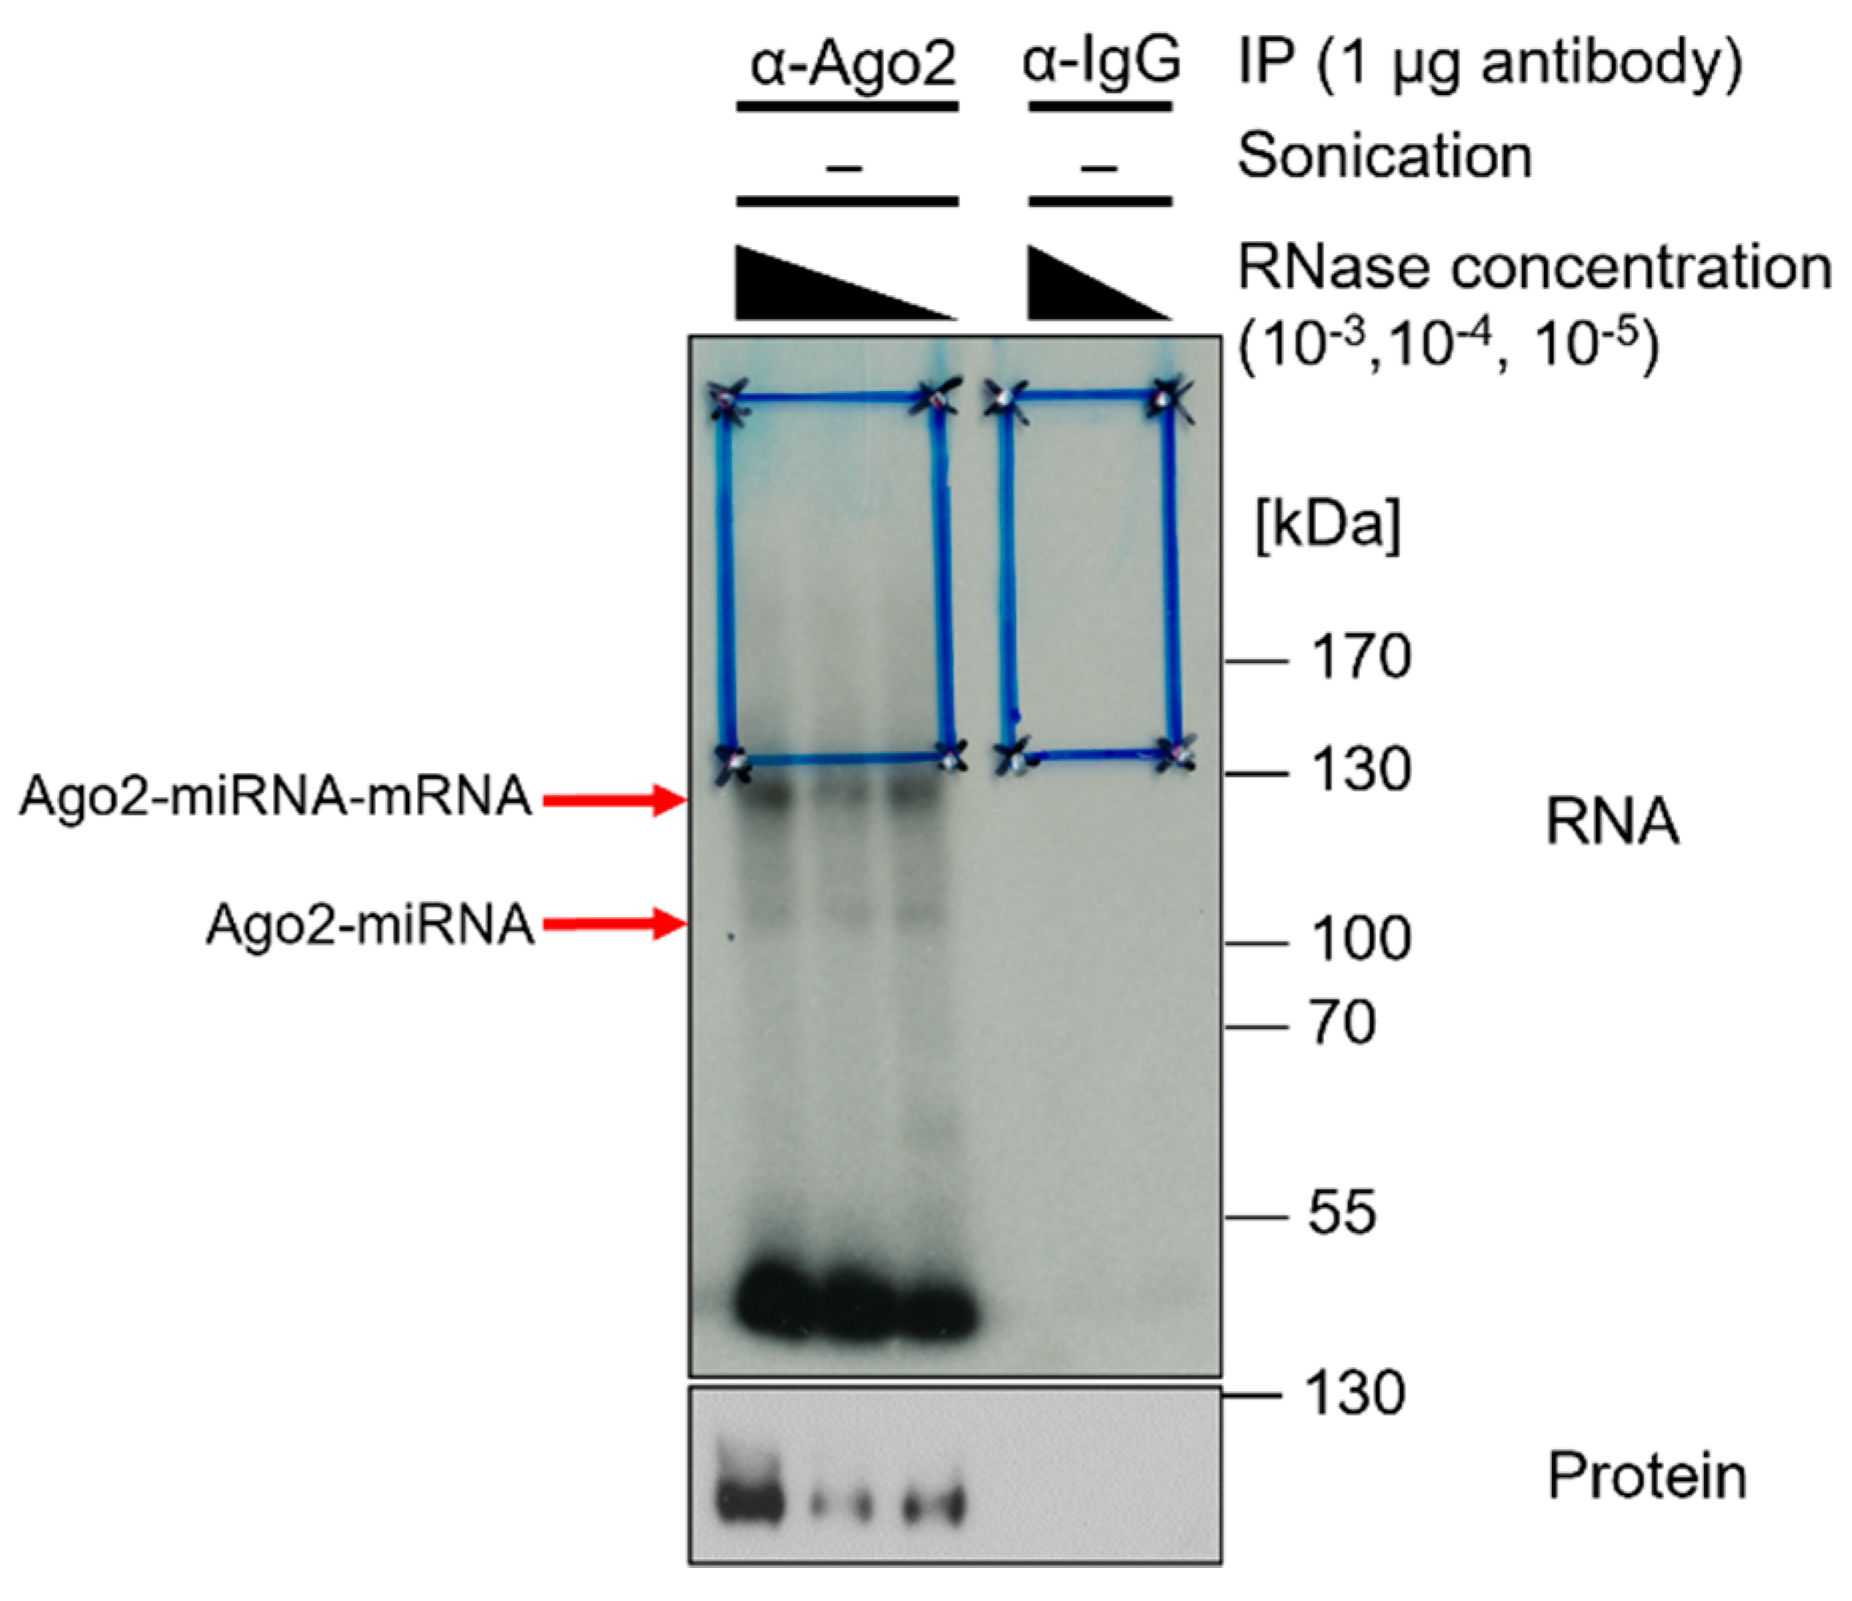
5.3. Antibody Sandwich Method
Note: Choose an appropriate α-IgG antibody for the α-Ago2 antibody depending on the organism of origin (α-rat IgG for α-Ago2 clone 11A9).Note: In our experiments, we did not observe significant improvement using this method. In other cell types or when using different lysis methods, the bridging antibody approach may improve Ago2-IP efficiency [27].5.4. Suggested Explorations
Author Contributions
Funding
Institutional Review Board Statement
Informed Consent Statement
Data Availability Statement
Acknowledgments
Conflicts of Interest
References
- Buchbender, A.; Mutter, H.; Sutandy, F.X.R.; Körtel, N.; Hänel, H.; Busch, A.; Ebersberger, S.; König, J. Improved Library Preparation with the New ICLIP2 Protocol. Methods 2020, 178, 33–48. [Google Scholar] [CrossRef] [PubMed]
- Kishore, S.; Jaskiewicz, L.; Burger, L.; Hausser, J.; Khorshid, M.; Zavolan, M. A Quantitative Analysis of CLIP Methods for Identifying Binding Sites of RNA-Binding Proteins. Nat. Methods 2011, 8, 559–564. [Google Scholar] [CrossRef] [PubMed]
- Lee, F.C.Y.; Ule, J. Advances in CLIP Technologies for Studies of Protein-RNA Interactions. Mol. Cell 2018, 69, 354–369. [Google Scholar] [CrossRef] [PubMed] [Green Version]
- Ule, J.; Jensen, K.B.; Ruggiu, M.; Mele, A.; Ule, A.; Darnell, R.B. CLIP Identifies Nova-Regulated RNA Networks in the Brain. Science 2003, 302, 1212–1215. [Google Scholar] [CrossRef] [PubMed]
- Hafner, M.; Katsantoni, M.; Köster, T.; Marks, J.; Mukherjee, J.; Staiger, D.; Ule, J.; Zavolan, M. CLIP and Complementary Methods. Nat. Rev. Methods Prim. 2021, 1, 20. [Google Scholar] [CrossRef]
- Van Nostrand, E.L.; Pratt, G.A.; Shishkin, A.A.; Gelboin-Burkhart, C.; Fang, M.Y.; Sundararaman, B.; Blue, S.M.; Nguyen, T.B.; Surka, C.; Elkins, K.; et al. Robust Transcriptome-Wide Discovery of RNA-Binding Protein Binding Sites with Enhanced CLIP (ECLIP). Nat. Methods 2016, 13, 508–514. [Google Scholar] [CrossRef]
- Kudla, G.; Granneman, S.; Hahn, D.; Beggs, J.D.; Tollervey, D. Cross-Linking, Ligation, and Sequencing of Hybrids Reveals RNA–RNA Interactions in Yeast. Proc. Natl. Acad. Sci. USA 2011, 108, 10010–10015. [Google Scholar] [CrossRef] [Green Version]
- Chi, S.W.; Zang, J.B.; Mele, A.; Darnell, R.B. Ago HITS-CLIP Decodes MiRNA-MRNA Interaction Maps. Nature 2009, 460, 479–486. [Google Scholar] [CrossRef] [Green Version]
- Moore, M.J.; Scheel, T.K.H.; Luna, J.M.; Park, C.Y.; Fak, J.J.; Nishiuchi, E.; Rice, C.M.; Darnell, R.B. MiRNA-Target Chimeras Reveal MiRNA 3’-End Pairing as a Major Determinant of Argonaute Target Specificity. Nat. Commun. 2015, 6, 8864. [Google Scholar] [CrossRef] [Green Version]
- König, J.; Zarnack, K.; Rot, G.; Curk, T.; Kayikci, M.; Zupan, B.; Turner, D.J.; Luscombe, N.M.; Ule, J. ICLIP Reveals the Function of HnRNP Particles in Splicing at Individual Nucleotide Resolution. Nat. Struct. Mol. Biol. 2010, 17, 909–915. [Google Scholar] [CrossRef]
- Hafner, M.; Landthaler, M.; Burger, L.; Khorshid, M.; Hausser, J.; Berninger, P.; Rothballer, A.; Ascano, M.; Jungkamp, A.-C.; Munschauer, M.; et al. PAR-CliP--a Method to Identify Transcriptome-Wide the Binding Sites of RNA Binding Proteins. J. Vis. Exp. 2010. [Google Scholar] [CrossRef] [PubMed]
- Mittal, N.; Zavolan, M. Seq and CLIP through the MiRNA World. Genome Biol. 2014, 15, 202. [Google Scholar] [CrossRef] [PubMed] [Green Version]
- Danan, C.; Manickavel, S.; Hafner, M. PAR-CLIP: A Method for Transcriptome-Wide Identification of RNA Binding Protein Interaction Sites. In Post-Transcriptional Gene Regulation; Dassi, E., Ed.; Methods in Molecular Biology; Springer: New York, NY, USA, 2022; pp. 167–188. ISBN 978-1-07-161851-6. [Google Scholar]
- Anastasakis, D.G.; Jacob, A.; Konstantinidou, P.; Meguro, K.; Claypool, D.; Cekan, P.; Haase, A.D.; Hafner, M. A Non-Radioactive, Improved PAR-CLIP and Small RNA CDNA Library Preparation Protocol. Nucleic Acids Res. 2021, 49, e45. [Google Scholar] [CrossRef] [PubMed]
- Treiber, T.; Treiber, N.; Meister, G. Regulation of MicroRNA Biogenesis and Function. Thromb. Haemost. 2012, 107, 605–610. [Google Scholar] [CrossRef] [PubMed] [Green Version]
- Conrad, K.D.; Niepmann, M. The Role of MicroRNAs in Hepatitis C Virus RNA Replication. Arch. Virol. 2014, 159, 849–862. [Google Scholar] [CrossRef] [PubMed]
- Hafner, M.; Landthaler, M.; Burger, L.; Khorshid, M.; Hausser, J.; Berninger, P.; Rothballer, A.; Ascano, M.; Jungkamp, A.-C.; Munschauer, M.; et al. Transcriptome-Wide Identification of RNA-Binding Protein and MicroRNA Target Sites by PAR-CLIP. Cell 2010, 141, 129–141. [Google Scholar] [CrossRef] [Green Version]
- Scheel, T.K.H.; Luna, J.M.; Liniger, M.; Nishiuchi, E.; Rozen-Gagnon, K.; Shlomai, A.; Auray, G.; Gerber, M.; Fak, J.; Keller, I.; et al. A Broad RNA Virus Survey Reveals Both MiRNA Dependence and Functional Sequestration. Cell Host Microbe 2016, 19, 409–423. [Google Scholar] [CrossRef] [Green Version]
- Bosson, A.D.; Zamudio, J.R.; Sharp, P.A. Endogenous MiRNA and Target Concentrations Determine Susceptibility to Potential CeRNA Competition. Mol. Cell 2014, 56, 347–359. [Google Scholar] [CrossRef] [Green Version]
- Li, X.; Pritykin, Y.; Concepcion, C.P.; Lu, Y.; La Rocca, G.; Zhang, M.; King, B.; Cook, P.J.; Wah Au, Y.; Popow, O.; et al. High-Resolution in Vivo Identification of MiRNA Targets by Halo-Enhanced Ago2 Pulldown. Mol. Cell 2020, 79, 167–179.e11. [Google Scholar] [CrossRef]
- Ahn, S.H.; Gu, D.; Koh, Y.; Lee, H.-S.; Chi, S.W. AGO CLIP-Based Imputation of Potent SiRNA Sequences Targeting SARS-CoV-2 with Antifibrotic MiRNA-like Activity. Sci. Rep. 2021, 11, 19161. [Google Scholar] [CrossRef]
- Farazi, T.A.; ten Hoeve, J.J.; Brown, M.; Mihailovic, A.; Horlings, H.M.; van de Vijver, M.J.; Tuschl, T.; Wessels, L.F. Identification of Distinct MiRNA Target Regulation between Breast Cancer Molecular Subtypes Using AGO2-PAR-CLIP and Patient Datasets. Genome Biol. 2014, 15, R9. [Google Scholar] [CrossRef] [PubMed] [Green Version]
- Wang, Y.; Soneson, C.; Malinowska, A.L.; Laski, A.; Ghosh, S.; Kanitz, A.; Gebert, L.F.R.; Robinson, M.D.; Hall, J. MiR-CLIP Reveals Iso-MiR Selective Regulation in the MiR-124 Targetome. Nucleic Acids Res. 2020, 49, 25–37. [Google Scholar] [CrossRef] [PubMed]
- Krell, J.; Stebbing, J.; Carissimi, C.; Dabrowska, A.F.; de Giorgio, A.; Frampton, A.E.; Harding, V.; Fulci, V.; Macino, G.; Colombo, T.; et al. TP53 Regulates MiRNA Association with AGO2 to Remodel the MiRNA–MRNA Interaction Network. Genome Res. 2016, 26, 331–341. [Google Scholar] [CrossRef] [PubMed] [Green Version]
- Cleary, M.D. Uncovering Cell Type-Specific Complexities of Gene Expression and RNA Metabolism by TU-Tagging and EC-Tagging. WIREs Dev. Biol. 2018, 7, e315. [Google Scholar] [CrossRef] [PubMed]
- Burger, K.; Mühl, B.; Kellner, M.; Rohrmoser, M.; Gruber-Eber, A.; Windhager, L.; Friedel, C.C.; Dölken, L.; Eick, D. 4-Thiouridine Inhibits RRNA Synthesis and Causes a Nucleolar Stress Response. RNA Biol. 2013, 10, 1623–1630. [Google Scholar] [CrossRef] [Green Version]
- Moore, M.J.; Zhang, C.; Gantman, E.C.; Mele, A.; Darnell, J.C.; Darnell, R.B. Mapping Argonaute and Conventional RNA-Binding Protein Interactions with RNA at Single-Nucleotide Resolution Using HITS-CLIP and CIMS Analysis. Nat. Protoc. 2014, 9, 263–293. [Google Scholar] [CrossRef]
- Conrad, K.D.; Giering, F.; Erfurth, C.; Neumann, A.; Fehr, C.; Meister, G.; Niepmann, M. MicroRNA-122 Dependent Binding of Ago2 Protein to Hepatitis C Virus RNA Is Associated with Enhanced RNA Stability and Translation Stimulation. PLoS ONE 2013, 8, e56272. [Google Scholar] [CrossRef] [Green Version]
- Luna, J.M.; Scheel, T.K.H.; Danino, T.; Shaw, K.S.; Mele, A.; Fak, J.J.; Nishiuchi, E.; Takacs, C.N.; Catanese, M.T.; de Jong, Y.P.; et al. Hepatitis C Virus RNA Functionally Sequesters MiR-122. Cell 2015, 160, 1099–1110. [Google Scholar] [CrossRef] [Green Version]
- Neugebauer, J.M. [18] Detergents: An Overview. In Methods in Enzymology; Deutscher, M.P., Ed.; Guide to Protein Purification; Academic Press: Cambridge, MA, USA, 1990; Volume 182, pp. 239–253. [Google Scholar]
- Helwak, A.; Kudla, G.; Dudnakova, T.; Tollervey, D. Mapping the Human MiRNA Interactome by CLASH Reveals Frequent Noncanonical Binding. Cell 2013, 153, 654–665. [Google Scholar] [CrossRef] [Green Version]
- Saito, Y.; Kanemaki, M.T. Targeted Protein Depletion Using the Auxin-Inducible Degron 2 (AID2) System. Curr. Protoc. 2021, 1, e219. [Google Scholar] [CrossRef]
- Graham, D.R.M.; Garnham, C.P.; Fu, Q.; Robbins, J.; Van Eyk, J.E. Improvements in Two-Dimensional Gel Electrophoresis by Utilizing a Low Cost “in-House” Neutral PH Sodium Dodecyl Sulfate-Polyacrylamide Gel Electrophoresis System. Proteomics 2005, 5, 2309–2314. [Google Scholar] [CrossRef] [PubMed]
- Grosswendt, S.; Filipchyk, A.; Manzano, M.; Klironomos, F.; Schilling, M.; Herzog, M.; Gottwein, E.; Rajewsky, N. Unambiguous Identification of MiRNA:Target Site Interactions by Different Types of Ligation Reactions. Mol. Cell 2014, 54, 1042–1054. [Google Scholar] [CrossRef] [PubMed] [Green Version]
- Berkner, K.L.; Folk, W.R. Polynucleotide Kinase Exchange Reaction: Quantitave Assay for Restriction Endonuclease-Generated 5’-Phosphoroyl Termini in DNA. J. Biol. Chem. 1977, 252, 3176–3184. [Google Scholar] [CrossRef] [PubMed]
- Porecha, R.; Herschlag, D. Chapter Fourteen-RNA Radiolabeling. In Methods in Enzymology; Lorsch, J., Ed.; Laboratory Methods in Enzymology: RNA; Academic Press: Cambridge, MA, USA, 2013; Volume 530, pp. 255–279. [Google Scholar]


| Cell Line/Sample | 4-Thiouridine (4-SU) Treatment | UV Wavelength (nm) 1 | UV Irradiation (mJ/cm2) |
|---|---|---|---|
| Thin cell layer (e.g., A549) | − | 254 | 150–300 |
| + | 365 | ||
| Clustered, dense cell patches (e.g., Calu3) | − | 254 | 300–450 |
| + | 365 |
| RNase Concentration | Mastermix | Final Dilution Factor in Sample |
|---|---|---|
| Highest | No predilution | 10−2 |
| High | 5 µL RNase I (100 U/µL) in 45 µL RQ1 buffer | 10−3 |
| Medium | 1 µL 10−3 dilution in 9 µL RQ1 buffer | 10−4 |
| Low | 1 µL 10−3 dilution in 99 µL RQ1 buffer | 10−5 |
| Lowest | 1 µL 10−3 dilution in 999 µL RQ1 buffer | 10−6 |
| Volume Per Reaction (µL) | Reagent |
|---|---|
| 1.00 | 10× T4 PNK reaction buffer |
| x | [gamma-32P]-ATP + stable ATP |
| 0.50 | T4 PNK |
| 0.25 | RNaseOUT (40 U/µL) |
| y | RNase-free water |
| Total volume: 10.00 |
| Volume Per Reaction (µL) | Reagent |
|---|---|
| 0.30 | Water |
| 2.00 | 10× NEB RNA ligase buffer (with DTT) |
| 0.20 | 100 mM ATP |
| 9.00 | 50% PEG8000 |
| 0.50 | High conc. RNA ligase (NEB M0437) |
| Total volume: 12.00 |
| Volume Per Reaction (µL) | Reagent |
|---|---|
| 82.80 | ProNex beads |
| 300.00 | Wash buffer |
| 22.00 | Elution buffer |
Publisher’s Note: MDPI stays neutral with regard to jurisdictional claims in published maps and institutional affiliations. |
© 2022 by the authors. Licensee MDPI, Basel, Switzerland. This article is an open access article distributed under the terms and conditions of the Creative Commons Attribution (CC BY) license (https://creativecommons.org/licenses/by/4.0/).
Share and Cite
Stebel, S.; Breuer, J.; Rossbach, O. Studying miRNA–mRNA Interactions: An Optimized CLIP-Protocol for Endogenous Ago2-Protein. Methods Protoc. 2022, 5, 96. https://doi.org/10.3390/mps5060096
Stebel S, Breuer J, Rossbach O. Studying miRNA–mRNA Interactions: An Optimized CLIP-Protocol for Endogenous Ago2-Protein. Methods and Protocols. 2022; 5(6):96. https://doi.org/10.3390/mps5060096
Chicago/Turabian StyleStebel, Sophie, Janina Breuer, and Oliver Rossbach. 2022. "Studying miRNA–mRNA Interactions: An Optimized CLIP-Protocol for Endogenous Ago2-Protein" Methods and Protocols 5, no. 6: 96. https://doi.org/10.3390/mps5060096