
A Retrospective Evaluation of the Predictive Value of Newborn Screening for Vitamin B12 Deficiency in Symptomatic Infants Below 1 Year of Age

 , ,
, , 
Abstract
:1. Introduction
2. Materials and Methods
2.1. Study Population
2.2. Newborn Screening Analyses
2.3. Statistics
3. Results
4. Discussion
5. Conclusions
Supplementary Materials
Author Contributions
Funding
Institutional Review Board Statement
Informed Consent Statement
Data Availability Statement
Acknowledgments
Conflicts of Interest
References
- Ljungblad, U.W.; Astrup, H.; Mørkrid, L.; Hager, H.B.; Lindberg, M.; Eklund, E.A.; Bjørke-Monsen, A.-L.; Rootwelt, T.; Tangeraas, T. Breastfed Infants with Spells, Tremor, or Irritability: Rule Out Vitamin B12 Deficiency. Pediatr. Neurol. 2022, 131, 4–12. [Google Scholar] [CrossRef] [PubMed]
- Green, R.; Allen, L.H.; Bjørke-Monsen, A.-L.; Brito, A.; Guéant, J.-L.; Miller, J.W.; Molloy, A.M.; Nexo, E.; Stabler, S.; Toh, B.-H.; et al. Vitamin B12 Deficiency. Nat. Rev. Dis. Prim. 2017, 3, 17040. [Google Scholar] [CrossRef] [PubMed]
- Torsvik, I.; Ueland, P.M.; Markestad, T.; Bjorke-Monsen, A.-L.L. Cobalamin Supplementation Improves Motor Development and Regurgitations in Infants: Results from a Randomized Intervention Study. Am. J. Clin. Nutr. 2013, 98, 1233–1240. [Google Scholar] [CrossRef] [Green Version]
- Graham, S.M.; Arvela, O.M.; Wise, G.A. Long-Term Neurologic Consequences of Nutritional Vitamin B12 Deficiency in Infants. J. Pediatr. 1992, 121, 710–714. [Google Scholar] [CrossRef]
- Gramer, G.; Fang-Hoffmann, J.; Feyh, P.; Klinke, G.; Monostori, P.; Mütze, U.; Posset, R.; Weiss, K.H.; Hoffmann, G.F.; Okun, J.G. Newborn Screening for Vitamin B12 Deficiency in Germany—Strategies, Results, and Public Health Implications. J. Pediatr. 2020, 216, 165–172.e4. [Google Scholar] [CrossRef]
- Rozmarič, T.; Mitulović, G.; Konstantopoulou, V.; Goeschl, B.; Huemer, M.; Plecko, B.; Spenger, J.; Wortmann, S.B.; Scholl-Bürgi, S.; Karall, D.; et al. Elevated Homocysteine after Elevated Propionylcarnitine or Low Methionine in Newborn Screening Is Highly Predictive for Low Vitamin B12 and Holo-Transcobalamin Levels in Newborns. Diagnostics 2020, 10, 626. [Google Scholar] [CrossRef] [PubMed]
- Reinson, K.; Künnapas, K.; Kriisa, A.; Vals, M.A.; Muru, K.; Õunap, K.; Kunnapas, K.; Kriisa, A.; Vals, M.A.; Muru, K.; et al. High Incidence of Low Vitamin B12 Levels in Estonian Newborns. Mol. Genet. Metab. Rep. 2018, 15, 1–5. [Google Scholar] [CrossRef]
- Scolamiero, E.; Villani, G.R.D.; Ingenito, L.; Pecce, R.; Albano, L.; Caterino, M.; di Girolamo, M.G.; di Stefano, C.; Franzese, I.; Gallo, G.; et al. Maternal Vitamin B12 Deficiency Detected in Expanded Newborn Screening. Clin. Biochem. 2014, 47, 312–317. [Google Scholar] [CrossRef]
- Sarafoglou, K. Expanded Newborn Screening for Detection of Vitamin B12 Deficiency. JAMA 2011, 305, 1198. [Google Scholar] [CrossRef] [Green Version]
- MacFarlane, A.J.; Greene-Finestone, L.S.; Shi, Y. Vitamin B-12 and Homocysteine Status in a Folate-Replete Population: Results from the Canadian Health Measures Survey. Am. J. Clin. Nutr. 2011, 94, 1079–1087. [Google Scholar] [CrossRef]
- Marx, G.; Joshi, C.W.; Orkin, L.R. Placental Transmission of Nitrous Oxide. Anesthesiology 1970, 32, 429–432. [Google Scholar] [CrossRef] [PubMed]
- Landon, M.J.; Creagh-Barry, P.; McArthur, S.; Charlett, A. Influence of Vitamin B12 Status on the Inactivation of Methionine Synthase by Nitrous Oxide. Br. J. Anaesth. 1992, 69, 81–86. [Google Scholar] [CrossRef] [PubMed]
- Chanarin, I. Cobalamins and Nitrous Oxide: A Review. J. Clin. Pathol. 1980, 33, 909–916. [Google Scholar] [CrossRef] [Green Version]
- Sanders, R.D.; Weimann, J.; Maze, M. Biologic Effects of Nitrous Oxide: A Mechanistic and Toxicologic Review. Anesthesiology 2008, 109, 707–722. [Google Scholar] [CrossRef] [Green Version]
- Ljungblad, U.W.; Lindberg, M.; Eklund, E.A.; Saeves, I.; Bjørke-Monsen, A.; Tangeraas, T. Nitrous Oxide in Labour Predicted Newborn Screening Total Homocysteine and Is a Potential Risk Factor for Infant Vitamin B12 Deficiency. Acta Paediatr. 2022, 111, 2315–2321. [Google Scholar] [CrossRef] [PubMed]
- Ljungblad, U.W.; Paulsen, H.; Mørkrid, L.; Pettersen, R.D.; Hager, H.B.; Lindberg, M.; Astrup, H.; Eklund, E.A.; Bjørke-Monsen, A.-L.; Rootwelt, T.; et al. The Prevalence and Clinical Relevance of Hyperhomocysteinemia Suggesting Vitamin B12 Deficiency in Presumed Healthy Infants. Eur. J. Paediatr. Neurol. 2021, 35, 137–146. [Google Scholar] [CrossRef] [PubMed]
- Ljungblad, U.W.; Paulsen, H.; Tangeraas, T.; Evensen, K.A.I. Reference Material for Hammersmith Infant Neurologic Examination Scores Based on Healthy, Term Infants Age 3–7 Months. J. Pediatr. 2022, 244, 79–85.e12. [Google Scholar] [CrossRef]
- Ljungblad, U.W.; Tangeraas, T.; Paulsen, H.; Lindberg, M. Lower Iron Stores Were Associated with Suboptimal Gross Motor Scores in Infants at 3–7 Months. Acta Paediatr. 2022, 111, 1941–1949. [Google Scholar] [CrossRef]
- Tangeraas, T.; Sæves, I.; Klingenberg, C.; Jørgensen, J.; Kristensen, E.; Gunnarsdottir, G.; Hansen, E.V.; Strand, J.; Lundman, E.; Ferdinandusse, S.; et al. Performance of Expanded Newborn Screening in Norway Supported by Post-Analytical Bioinformatics Tools and Rapid Second-Tier DNA Analyses. Int. J. Neonatal Screen. 2020, 6, 51. [Google Scholar] [CrossRef]
- Pajares, S.; Arranz, J.A.; Ormazabal, A.; del Toro, M.; García-Cazorla, Á.; Navarro-Sastre, A.; López, R.M.; Meavilla, S.M.; de los Santos, M.M.; García-Volpe, C.; et al. Implementation of Second-Tier Tests in Newborn Screening for the Detection of Vitamin B12 Related Acquired and Genetic Disorders: Results on 258,637 Newborns. Orphanet J. Rare Dis. 2021, 16, 195. [Google Scholar] [CrossRef]
- Wilson, J.; Jungner, G. Principles and Practice of Screening for Disease; World Health Organization: Geneva, Switzerland, 1968. [Google Scholar]
- Honzik, T.; Adamovicova, M.; Smolka, V.; Magner, M.; Hruba, E.; Zeman, J. Clinical Presentation and Metabolic Consequences in 40 Breastfed Infants with Nutritional Vitamin B12 Deficiency—What Have We Learned? Eur. J. Paediatr. Neurol. 2010, 14, 488–495. [Google Scholar] [CrossRef] [PubMed]
- Irevall, T.; Axelsson, I.; Naumburg, E. B12 Deficiency Is Common in Infants and Is Accompanied by Serious Neurological Symptoms. Acta Paediatr. 2016, 106, 101–104. [Google Scholar] [CrossRef] [Green Version]
- Azad, C.; Jat, K.R.; Kaur, J.; Guglani, V.; Palta, A.; Tiwari, A.; Bansal, D. Vitamin B 12 Status and Neurodevelopmental Delay in Indian Infants: A Hospital-Based Cross-Sectional Study. Paediatr. Int. Child Health 2020, 40, 78–84. [Google Scholar] [CrossRef] [PubMed]
- Gramer, G.; Hoffmann, G.F. Vitamin B12 Deficiency in Newborns and Their Mothers—Novel Approaches to Early Detection, Treatment and Prevention of a Global Health Issue. Curr. Med. Sci. 2020, 40, 801–809. [Google Scholar] [CrossRef]
- Bjorke-Monsen, A.L.; Torsvik, I.; Saetran, H.; Markestad, T.; Ueland, P.M. Common Metabolic Profile in Infants Indicating Impaired Cobalamin Status Responds to Cobalamin Supplementation. Pediatrics 2008, 122, 83–91. [Google Scholar] [CrossRef] [PubMed] [Green Version]
- Varsi, K.; Ueland, P.M.; Torsvik, I.K.; Bjørke-Monsen, A.L. Maternal Serum Cobalamin at 18 Weeks of Pregnancy Predicts Infant Cobalamin Status at 6 Months-A Prospective, Observational Study. J. Nutr. 2018, 148, 738–745. [Google Scholar] [CrossRef] [PubMed]


| Positive NBS (n = 5) | Clinical Cases with B12 < 160 or holoTC < 35 pmol/L (n = 30) | Clinical Cases (n = 70) | Clinical Controls (n = 252) | Matched Controls (n = 646) | Unmatched Controls (n = 434) | |
|---|---|---|---|---|---|---|
| Gestational age (weeks) | 38 (4) | 39 (2) | 39 (2) | 39 (2) | 39 (2) | 39 (2) |
| Birthweight (grams) | 3152 (840) | 3327 (554) | 3401 (627) | 3296 (666) | 3427 (588) | 3493 (540) |
| NBS DBS age (hours) | 59 (15) | 59 (10) | 59 (14) | 62 (16) | 62 (15) | 57 (18) |
| DBS storage time (years) | 3.7 (1.5) | 4.0 (1.8) | 4.0 (1.8) | 1.9 (0.2) | 2.6 (1.6) | 0 |
| Female | 2 (40) | 12 (40) | 29 (41) | 125 (50) | 301 (47%) | 216 (50%) |
| Positive NBS (n = 5) | Clinical Cases with B12 < 160 or holoTC < 35 pmol/L (n = 30) | Clinical Cases (n = 70) | Clinical Controls (n = 252) | Difference Compared to Clinical Controls (Fisher’s Exact Test or t-Test, p) | ||
|---|---|---|---|---|---|---|
| Positive NBS | Clinical Cases with B12 < 160 or holoTC < 35 pmol/L | |||||
| Married/cohabitant | 5 (100) | 27 (90) | 63 (90) | 249 (99) | 1.0 | 0.01 |
| Higher education | 4 (80) | 20 (67) | 45 (64) | 169 (69) | 1.0 | 0.84 |
| Origin outside the Nordic countries | 1 (20) | 7 (23) | 11 (16) | 53 (21) | 1.0 | 0.81 |
| Employment last 2 years | 4 (80) | 20 (77) | 50 (76) | 220 (91) | 0.40 | 0.045 |
| Smoking last 2 years | 0 | 5 (17) | 9 (13) | 30 (12) | 1.0 | 0.56 |
| Meat-eater | 5 (100) | 29 (97) | 69 (99) | 241 (97) | 0.13 | 0.60 |
| Known maternal B12 deficiency | 1 (20) | 7 (24) | 17 (25) | 24 (9.7) | 0.41 | 0.03 |
| Celiac disease | 0 | 1 (3.3) | 5 (7.1) | 8 (3.2) | 1.0 | 1.0 |
| Primipara | 4 (80) | 15 (50) | 30 (43 | 138 (55) | 0.38 | 0.70 |
| Diabetes in pregnancy | 0 | 1 (3.3) | 3 (4.3) | 16 (6.3) | 1.0 | 1.0 |
| Metformin use | 0 | 1 (3.6) | 2 (3.4) | 9 (3.6) | 1.0 | 1.0 |
| Hyperemesis (self-reported) | 3 (60) | 14 (47) | 23 (33) | 67 (27) | 0.13 | 0.03 |
| Folate during pregnancy | 5 (100) | 25 (83) | 56 (81) | 219 (88) | 1.0 | 0.56 |
| B12 containing supplement during pregnancy | 3 (60) | 11 (37) | 28 (41) | 163 (65) | 1.0 | 0.005 |
| Preeclampsia | 0 | 2 (6.7) | 4 (5.8) | 14 (5.6) | 1.0 | 0.68 |
| N2O analgesia | 4 (80) | 20 (67) | 43 (62) | 170 (68) | 1.0 | 1.0 |
| Cesarian section | 0 | 5 (17) | 13 (19) | 56 (22) | 0.59 | 0.64 |
| Female | 2 (40) | 12 (40) | 29 (41) | 124 (49) | 1.0 | 0.44 |
| Multiple birth | 0 | 2 (6.7) | 2 (2.9) | 29 (12) | 1.0 | 0.55 |
| Preterm GA 32–36 weeks | 1 (20) | 4 (13) | 6 (8.6) | 43 (17) | 1.0 | 0.80 |
| Small for GA < 10p | 1 (20) | 3 (10) | 10 (14) | 46 (18) | 1.0 | 0.32 |
| Exclusively breastmilk | 4 * (80) | 23 (79) | 49 (72) | 82 (33) | 0.047 | <0.001 |
| Yearly household income (NOK) | 742,800 (375,312) | 860,960 (392,077) | 894,293 (329,007) | 971,884 (341,984) | 0.14 | 0.14 |
| Mother’s BMI before pregnancy | 22.8 (3.7) | 25.1 (6.5) | 24.8 (5.5) | 24.7 (5.0) | 0.39 | 0.74 |
| Mother’s age at birth | 26 (3.9) | 31 (4.1) | 31 (4.3) | 30 (4.7) | 0.06 | 0.43 |
| Dose N2O ** (min × conc) | 85 (83) | 71 (105) | 63 (90) | 62 (81) | 0.54 | 0.58 |
| Gestational age in weeks | 38.3 (3.7) | 39.1 (2.4) | 39.3 (2.5) | 39.1 (2.2) | 0.46 | 0.99 |
| Birthweight z-score | −0.32 (1.31) | −0.40 (1.06) | −0.28 (1.12) | −0.41 (1.20) | 0.86 | 0.96 |
| Infant age in weeks | 14.3 (8.0) | 16.7 (11.8) | 13.5 (10.7) | 20.8 (5.2) | 0.007 | 0.001 |
| Weight z-score | −0.34 (1.25) | −0.51 (1.23) | −0.46 (1.15) | −0.09 (1.06) | 0.6 | 0.06 |
| Positive NBS (n = 5) | Clinical Cases with B12 < 160 or holoTC < 35 pmol/L (n = 30) | Clinical Cases (n = 70) | Clinical Controls (n = 252) | Difference Compared to Clinical Controls (Fisher’s Exact Test, p) | ||
|---|---|---|---|---|---|---|
| Positive NBS | Clinical Cases with B12 < 160 or holoTC < 35 pmol/L | |||||
| Spells (motor seizures, apneas, or absences) | 3/5 (60) | 10/23 (43) | 29/60 (48) | 0/250 (0) | <0.001 | <0.001 |
| Tremor | 1/4 (25) | 8/22 (36) | 20/58 (34) | 13/250 (5.2) | 0.20 | <0.001 |
| Irritability | 1/4 (25) | 4/21 (19) | 10/56 (18) | 19/252 (7.5) | 0.28 | 0.09 |
| Head lag at pull-to-sit | 2/4 (50) | 9/18 (50) | 23/44 (52) | 38/250 (15) | 0.12 | 0.001 |
| Abnormal eye contact | 2/5 (40) | 4/22 (18) | 7/54 (13) | 0/250 (0) | <0.001 | <0.001 |
| Clinical Cases with B12 < 160 pmol/L or holoTC < 35 pmol/L (n = 30) | Clinical Cases (n = 70) | Matched Controls (n = 646) | Un-Matched Controls (n = 434) | |
|---|---|---|---|---|
| Heidelberg 1st tier positive | 9 * (30%) | 13 * (19%) | 93 (14%) | 85 (20%) |
| Heidelberg 1st and 2nd tier positive | 3 ** (10%) | 3 ** (4.3%) | 4 (0.6%) | 3 (0.7%) |
| Austrian 1st tier positive | 3 * (10%) | 4 * (5.7%) | 29 (4.5%) | 38 (8.8%) |
| Austrian 1st tier positive and tHcy > 6.3 | 2 *** (6.7%) | 2 *** (2.9%) | 7 (1.1%) | 1 (0.2%) |
| Austrian 1st tier positive and tHcy > 8.6 | 0 | 0 | 1 (0.2%) | 1 (0.2%) |
| Newborn Screening Parameter | tHcy µmol/L | MMA µmol/L | S-Vitamin B12 pmol/L |
|---|---|---|---|
| tHcy | 0.492 ** | 0.275 ** | −0.208 ** |
| MMA | 0.235 ** | 0.187 ** | −0.100 |
| MET | −0.076 | 0.066 | 0.022 |
| MET/PHE | −0.029 | 0.049 | −0.044 |
| C3 | 0.134 * | 0.085 | −0.117 * |
| C3/C2 | 0.225 ** | 0.165 ** | −0.174 ** |
| C3/C16 | 0.120 * | 0.126 ** | −0.069 |
| C3/MET | 0.178 ** | 0.065 | −0.143 * |
| C3/C0 | 0.094 | 0.001 | −0.106 |
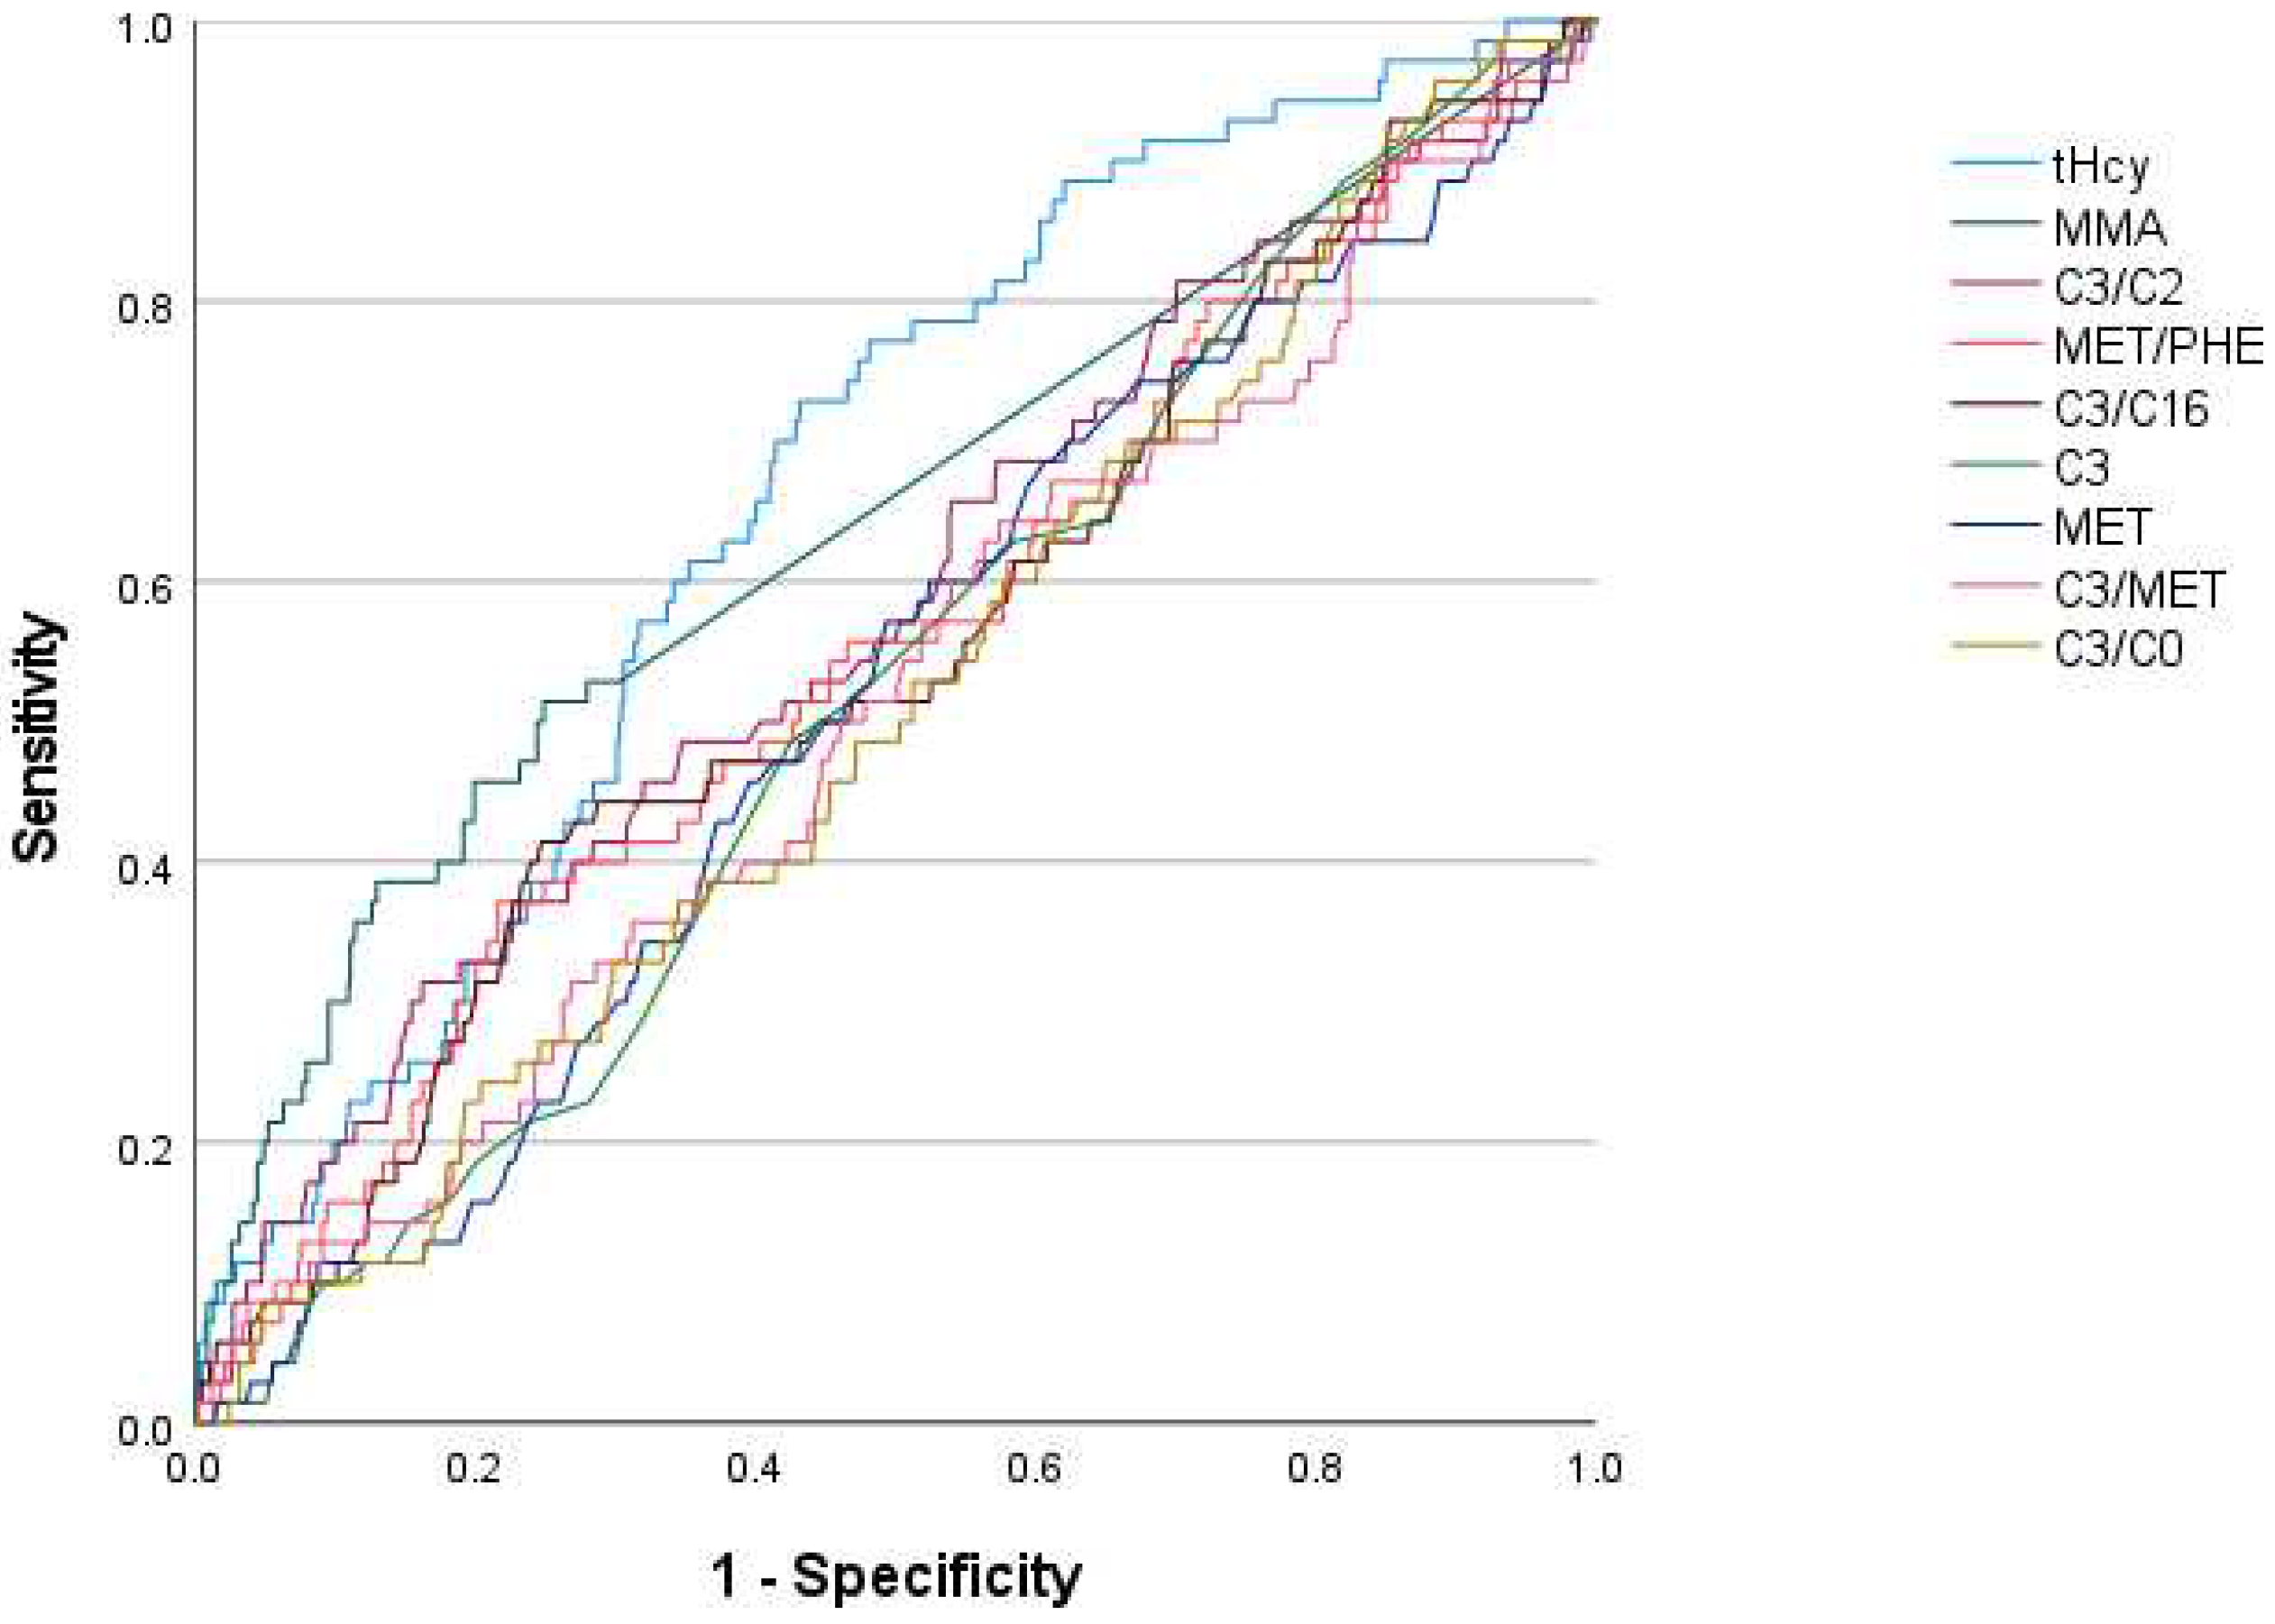
| Newborn Screening Variable | Area under the Curve | |
|---|---|---|
| Clinical Cases | Clinical Cases with B12 < 160 pmol/L or holoTC < 35 pmol/L | |
| tHcy | 0.665 | 0.708 |
| MMA | 0.639 | 0.636 |
| C3/C2 | 0.579 | 0.600 |
| MET/PHE | 0.550 | 0.579 |
| C3/C16 | 0.547 | 0.525 |
| C3 | 0.517 | 0.560 |
| MET | 0.515 | 0.542 |
| C3/MET | 0.512 | 0.544 |
| C3/C0 | 0.510 | 0.515 |
Publisher’s Note: MDPI stays neutral with regard to jurisdictional claims in published maps and institutional affiliations. |
© 2022 by the authors. Licensee MDPI, Basel, Switzerland. This article is an open access article distributed under the terms and conditions of the Creative Commons Attribution (CC BY) license (https://creativecommons.org/licenses/by/4.0/).
Share and Cite
Ljungblad, U.W.; Lindberg, M.; Eklund, E.A.; Sæves, I.; Sagredo, C.; Bjørke-Monsen, A.-L.; Tangeraas, T. A Retrospective Evaluation of the Predictive Value of Newborn Screening for Vitamin B12 Deficiency in Symptomatic Infants Below 1 Year of Age. Int. J. Neonatal Screen. 2022, 8, 66. https://doi.org/10.3390/ijns8040066
Ljungblad UW, Lindberg M, Eklund EA, Sæves I, Sagredo C, Bjørke-Monsen A-L, Tangeraas T. A Retrospective Evaluation of the Predictive Value of Newborn Screening for Vitamin B12 Deficiency in Symptomatic Infants Below 1 Year of Age. International Journal of Neonatal Screening. 2022; 8(4):66. https://doi.org/10.3390/ijns8040066
Chicago/Turabian StyleLjungblad, Ulf Wike, Morten Lindberg, Erik A. Eklund, Ingjerd Sæves, Carlos Sagredo, Anne-Lise Bjørke-Monsen, and Trine Tangeraas. 2022. "A Retrospective Evaluation of the Predictive Value of Newborn Screening for Vitamin B12 Deficiency in Symptomatic Infants Below 1 Year of Age" International Journal of Neonatal Screening 8, no. 4: 66. https://doi.org/10.3390/ijns8040066