
Parametric MRI Detects Aristolochic Acid Induced Acute Kidney Injury
 , ,
, ,
Abstract
:1. Introduction
2. Materials and Methods
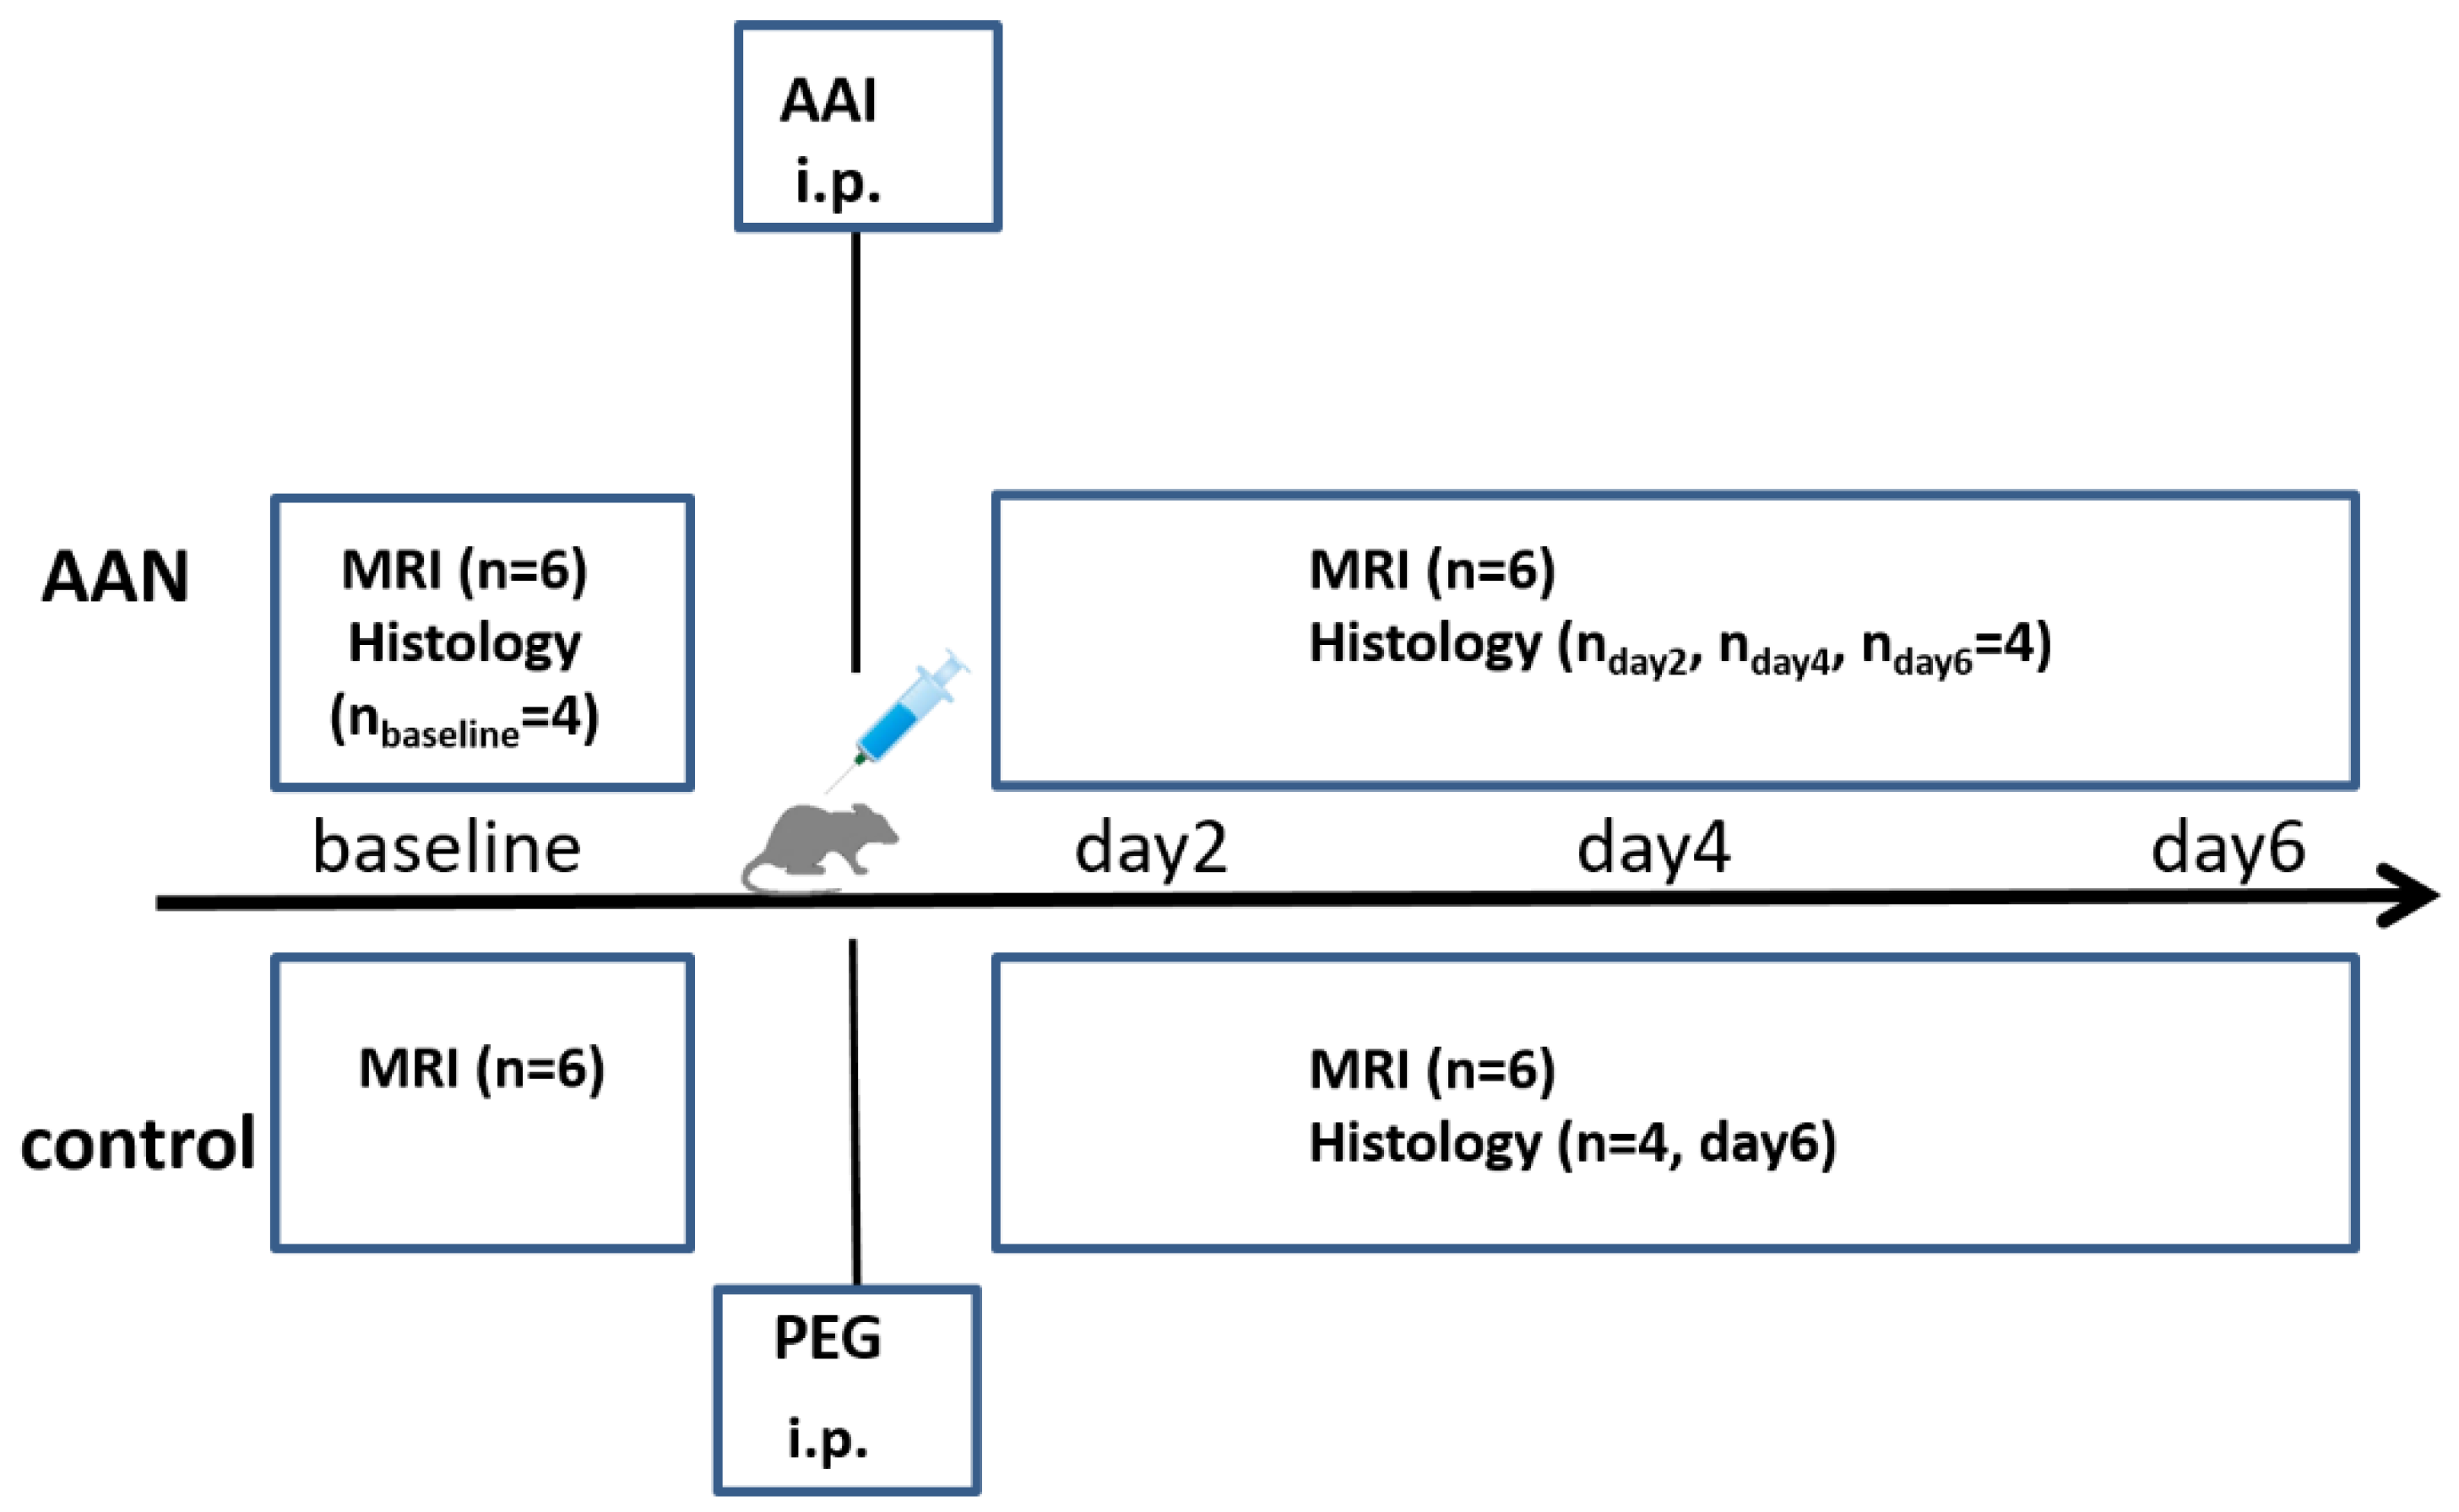
2.1. Experiment Protocols
2.2. Data Acquisition
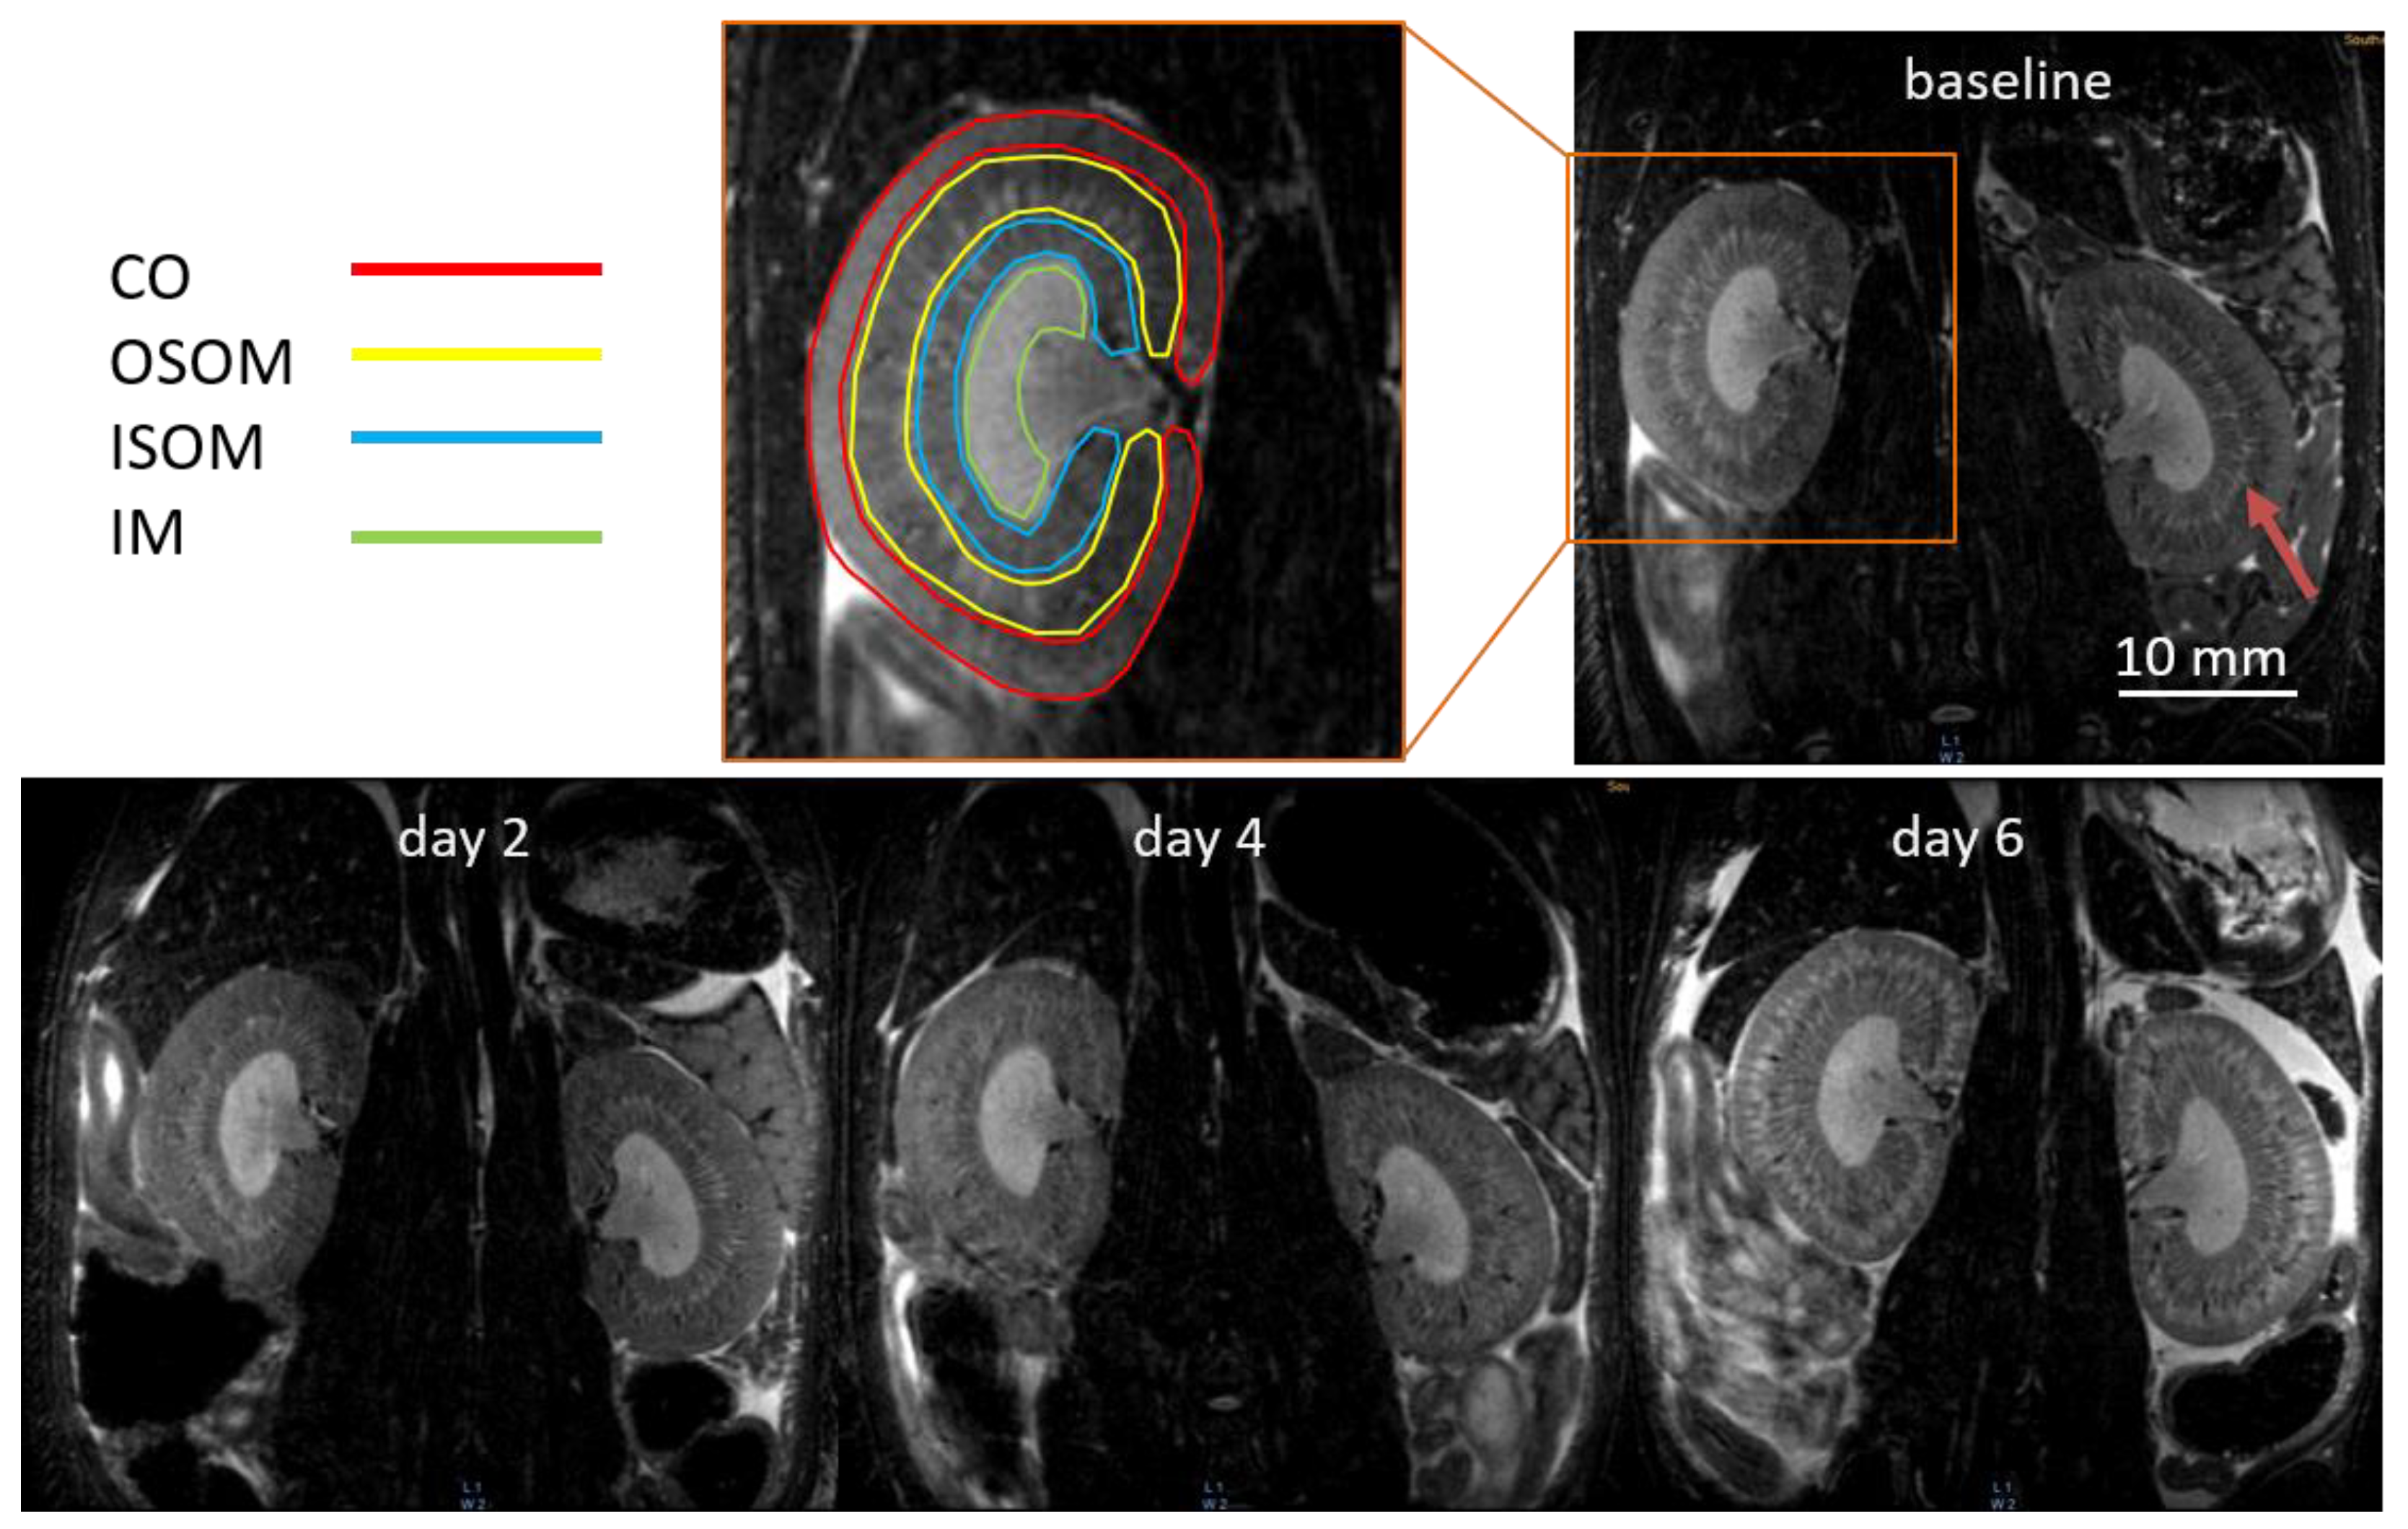
2.3. MR Image Analysis
2.4. Biochemical Measurements and Histologic Evaluations
2.5. Statistical Analysis
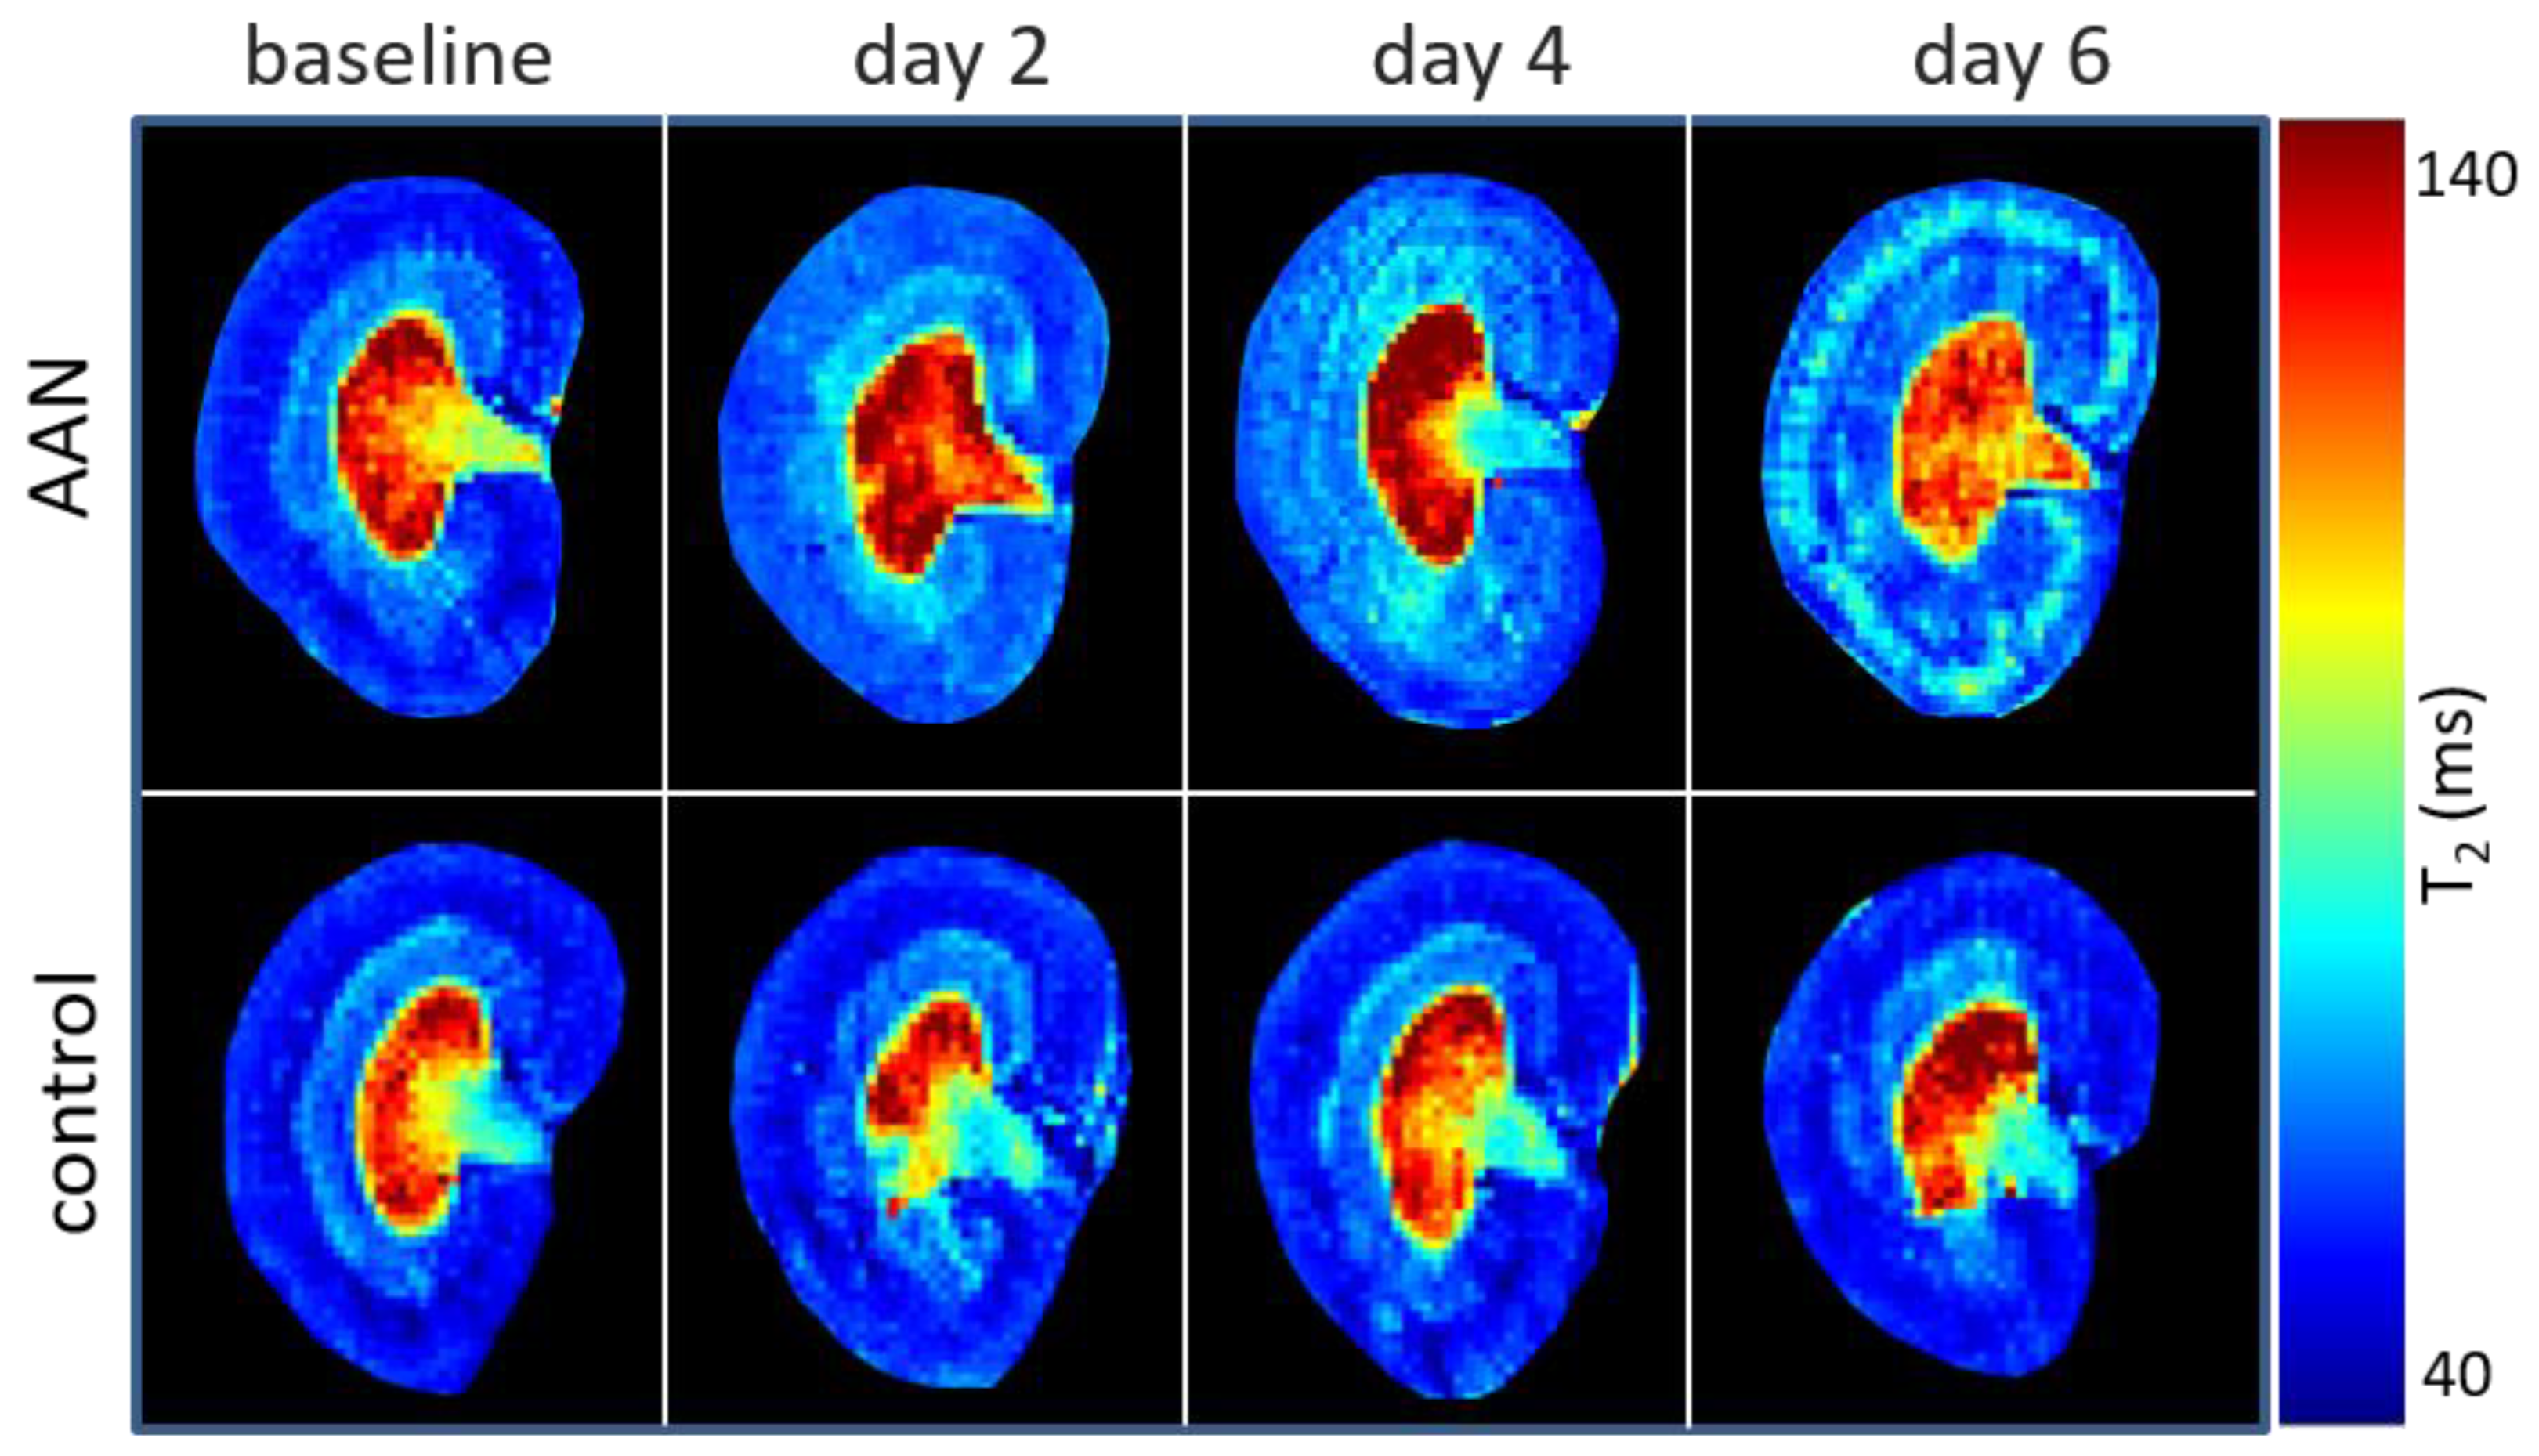
3. Results
4. Discussion
Author Contributions
Funding
Institutional Review Board Statement
Informed Consent Statement
Conflicts of Interest
References
- Ng, A.W.T.; Poon, S.L.; Ni Huang, M.; Lim, J.Q.; Boot, A.; Yu, W.; Suzuki, Y.; Thangaraju, S.; Ng, C.C.Y.; Tan, P.; et al. Aristolochic acids and their derivatives are widely implicated in liver cancers in Taiwan and throughout asia. Sci. Transl. Med. 2017, 9. [Google Scholar] [CrossRef] [PubMed] [Green Version]
- Debelle, F.D.; Vanherweghem, J.L.; Nortier, J.L. Aristolochic acid nephropathy: A worldwide problem. Kidney Int. 2008, 74, 158–169. [Google Scholar] [CrossRef] [PubMed] [Green Version]
- Das, S.; Thakur, S.; Korenjak, M.; Sidorenko, V.S.; Chung, F.F.-L.; Zavadil, J. Aristolochic acid-associated cancers: A public health risk in need of global action. Nat. Rev. Cancer 2022, 22, 576–591. [Google Scholar] [CrossRef] [PubMed]
- Gökmen, M.R.; Cosyns, J.-P.; Arlt, V.M.; Stiborová, M.; Phillips, D.; Schmeiser, H.H.; Simmonds, M.S.; Cook, H.T.; Vanherweghem, J.-L.; Nortier, J.L.; et al. The epidemiology, diagnosis, and management of aristolochic acid nephropathy. Ann. Intern. Med. 2013, 158, 469. [Google Scholar] [CrossRef] [PubMed] [Green Version]
- Jadot, I.; Declèves, A.E.; Nortier, J.; Caron, N. An integrated view of aristolochic acid nephropathy: Update of the literature. Int. J. Mol. Sci. 2017, 18, 297. [Google Scholar] [CrossRef] [Green Version]
- Gökmen, M.R.; Lord, G.M. Aristolochic acid nephropathy. BMJ 2012, 344, 9–10. [Google Scholar] [CrossRef] [Green Version]
- Grollman, A.P. Aristolochic acid nephropathy: Harbinger of a global iatrogenic disease. Environ. Mol. Mutagen. 2013, 54, 1–7. [Google Scholar] [CrossRef]
- Mengs, U. Acute toxicity of aristolochic acid in rodents. Arch. Toxicol. 1987, 59, 328–331. [Google Scholar] [CrossRef]
- Lebeau, C.; Debelle, F.D.; Arlt, V.M.; Pozdzik, A.; De Prez, E.G.; Phillips, D.H.; Deschodt-Lanckman, M.M.; Vanherweghem, J.-L.; Nortier, J.L. Early proximal tubule injury in experimental aristolochic acid nephropathy: Functional and histological studies. Nephrol. Dial. Transplant. 2005, 20, 2321–2332. [Google Scholar] [CrossRef] [Green Version]
- Pozdzik, A.; Salmon, I.; Debelle, F.; Decaestecker, C.; Branden, C.V.D.; Verbeelen, D.; Deschodt-Lanckman, M.; Vanherweghem, J.-L.; Nortier, J. Aristolochic acid induces proximal tubule apoptosis and epithelial to mesenchymal transformation. Kidney Int. 2008, 73, 595–607. [Google Scholar] [CrossRef]
- Pu, X.-Y.; Shen, J.-Y.; Deng, Z.-P.; Zhang, Z.-A. Plasma-specific microRNA response induced by acute exposure to aristolochic acid i in rats. Arch. Toxicol. 2017, 91, 1473–1483. [Google Scholar] [CrossRef] [PubMed]
- Chen, J.; Luo, P.; Wang, C.; Yang, C.; Bai, Y.; He, X.; Zhang, Q.; Zhang, J.; Yang, J.; Wang, S.; et al. Integrated single-cell transcriptomics and proteomics reveal cellular-specific responses and microenvironment remodeling in aristolochic acid nephropathy. JCI Insight 2022, 7. [Google Scholar] [CrossRef] [PubMed]
- Molitoris, B.A.; Melnikov, V.Y.; Okusa, M.D.; Himmelfarb, J. Technology insight: Biomarker development in acute kidney injury —What can we anticipate? Nat. Clin. Pract. Nephrol. 2008, 4, 154–165. [Google Scholar] [CrossRef] [PubMed]
- Lukinich-Gruia, A.T.; Nortier, J.; Pavlović, N.M.; Milovanović, D.; Popović, M.; Drăghia, L.P.; Păunescu, V.; Tatu, C.A. Aristolochic acid I as an emerging biogenic contaminant involved in chronic kidney diseases: A comprehensive review on exposure pathways, environmental health issues and future challenges. Chemosphere 2022, 297, 134111. [Google Scholar] [CrossRef]
- John, A.K.; Norbert, L.; Peter, A.; Rashad, S.B.; Emmanuel, A.; Burdmann, S.L.; Goldstein, C.A.; Herzog, M.J.; Andreas, K.; Andrew, S.L. Kidney disease: Improving global outcomes (KDIGO) acute kidney injury work group. KDIGO clinical practice guideline for acute kidney injury. Kidney Int. Suppl. 2012, 2, 1–138. [Google Scholar]
- Deutschegesellschaftfürnephrologie: Interdisziplinäre S2k-Leitlinie: Rationelle Labordiagnostik zur Abklärung Akuter nierenschädigungen und Progredienter Nierenerkrankungen. Available online: https://register.awmf.org/assets/guidelines/115-001l_S2k_Rationelle_Labordiagnostik_Abkl%C3%A4rung_Nierensch%C3%A4digungen_Nierenerkrankungen_2021-09_01.pdf (accessed on 28 November 2022).
- Caroli, A.; Pruijm, M.; Burnier, M.; Selby, N.M. Functional magnetic resonance imaging of the kidneys: Where do we stand? The perspective of the European COST Action Parenchima. Nephrol. Dial. Transpl. 2018, 33, 3–5. [Google Scholar] [CrossRef]
- Zhang, J.L.; Morrell, G.; Rusinek, H.; Sigmund, E.E.; Chandarana, H.; Lerman, L.O.; Prasad, P.V.; Niles, D.; Artz, N.; Fain, S.; et al. New magnetic resonance imaging methods in nephrology. Kidney Int. 2014, 85, 768–778. [Google Scholar] [CrossRef] [Green Version]
- De Boer, A.; Harteveld, A.A.; Stemkens, B.; Blankestijn, P.J.; Bos, C.; Msc, S.L.F.; Froeling, M.; Joles, J.A.; Verhaar, M.C.; van den Berg, N.; et al. Multiparametric renal MRI: An intrasubject test–retest repeatability study. J. Magn. Reson. Imaging 2021, 53, 859–873. [Google Scholar] [CrossRef] [Green Version]
- Zhao, J.M.; Clingman, C.S.; Närväinen, M.J.; Kauppinen, R.A.; Van Zijl, P.C.M. Oxygenation and hematocrit dependence of transverse relaxation rates of blood at 3T. Magn. Reson. Med. 2007, 58, 592–597. [Google Scholar] [CrossRef]
- Kundel, H.L.; Schlakman, B.; Joseph, P.M.; Fishman, J.E.; Summers, R. Water content and nmr relaxation time gradients in the rabbit kidney. Investig. Radiol. 1986, 21, 12–17. [Google Scholar] [CrossRef]
- Salerno, M.; Kramer, C.M. Advances in parametric mapping with CMR imaging. JACC Cardiovasc. Imaging 2013, 6, 806–822. [Google Scholar] [CrossRef] [PubMed]
- Shah, B.; Anderson, S.W.; Scalera, J.; Jara, H.; Soto, J.A. Quantitative MR imaging: Physical principles and sequence design in abdominal imaging. Radiographics 2011, 31, 867–880. [Google Scholar] [CrossRef] [PubMed]
- Tan, H.; Thacker, J.; Franklin, T.; Prasad, P.V. Sensitivity of arterial spin labeling perfusion MRI to pharmacologically induced perfusion changes in rat kidneys. J. Magn. Reson. Imaging 2015, 41, 1124–1128. [Google Scholar] [CrossRef] [PubMed] [Green Version]
- Bulluck, H.; Rosmini, S.; Abdel-Gadir, A.; Bhuva, A.N.; Treibel, T.A.; Fontana, M.; Gonzalez-Lopez, E.; Ramlall, M.; Hamarneh, A.; Sirker, A.; et al. Diagnostic performance of T1 and T2 mapping to detect intramyocardial hemorrhage in reperfused ST-segment elevation myocardial infarction (STEMI) patients. J. Magn. Reson. Imaging 2017, 46, 877–886. [Google Scholar] [CrossRef] [Green Version]
- Dekkers, I.A.; Lamb, H.J. Clinical application and technical considerations of T1 and T2(∗) mapping in cardiac, liver, and renal imaging. Br. J. Radiol. 2018, 91, 20180825. [Google Scholar] [CrossRef] [Green Version]
- Niendorf, T.; Pohlmann, A.; Arakelyan, K.; Flemming, B.; Cantow, K.; Hentschel, J.; Grosenick, D.; Ladwig, M.; Reimann, H.; Klix, S.; et al. How bold is blood oxygenation level-dependent (BOLD) magnetic resonance imaging of the kidney? Opportunities, challenges and future directions. Acta Physiol. 2015, 213, 19–38. [Google Scholar] [CrossRef] [Green Version]
- Prasad, P.V. Update on renal blood oxygenation level–dependent MRI to assess intrarenal oxygenation in chronic kidney disease. Kidney Int. 2018, 93, 778–780. [Google Scholar] [CrossRef]
- Cantow, K.; Gladytz, T.; Millward, J.M.; Waiczies, S.; Niendorf, T.; Seeliger, E. Monitoring kidney size to interpret MRI-based assessment of renal oxygenation in acute pathophysiological scenarios. Acta Physiol. 2022, vol., e13868. [Google Scholar] [CrossRef]
- Thoeny, H.C.; Binser, T.; Roth, B.; Kessler, T.M.; Vermathen, P. Noninvasive assessment of acute ureteral obstruction with diffusion-weighted MR imaging: A prospective study. Radiology 2009, 252, 721–728. [Google Scholar] [CrossRef] [Green Version]
- Inoue, T.; Kozawa, E.; Okada, H.; Inukai, K.; Watanabe, S.; Kikuta, T.; Watanabe, Y.; Takenaka, T.; Katayama, S.; Tanaka, J.; et al. Noninvasive evaluation of kidney hypoxia and fibrosis using magnetic resonance imaging. J. Am. Soc. Nephrol. 2011, 22, 1429–1434. [Google Scholar] [CrossRef] [Green Version]
- Hueper, K.; Rong, S.; Gutberlet, M.; Hartung, D.; Mengel, M.; Lu, X.; Haller, H.; Wacker, F.; Meier, M.; Gueler, F. T2 relaxation time and apparent diffusion coefficient for noninvasive assessment of renal pathology after acute kidney injury in mice: Comparison with histopathology. Investig. Radiol. 2013, 48, 834–842. [Google Scholar] [CrossRef] [PubMed]
- Woo, S.; Cho, J.Y.; Kim, S.Y.; Kim, S.H. Intravoxel incoherent motion MRI-derived parameters and T2* relaxation time for noninvasive assessment of renal fibrosis: An experimental study in a rabbit model of unilateral ureter obstruction. Magn. Reson. Imaging 2018, 51, 104–112. [Google Scholar] [CrossRef] [PubMed]
- Yusa, Y.; Kundel, H.L. Magnetic resonance imaging following unilateral occlusion of the renal circulation in rabbits. Radiology 1985, 154, 151–156. [Google Scholar] [CrossRef] [PubMed]
- Ko, S.-F.; Yip, H.-K.; Zhen, Y.-Y.; Lee, C.-C.; Lee, C.-C.; Huang, S.-J.; Huang, C.-C.; Ng, S.-H.; Lin, J.-W. Severe bilateral ischemic-reperfusion renal injury: Hyperacute and acute changes in apparent diffusion coefficient, T1, and T2 mapping with immunohistochemical correlations. Sci. Rep. 2017, 7, 1725. [Google Scholar] [CrossRef] [PubMed] [Green Version]
- Hueper, K.; Gutberlet, M.; Bräsen, J.H.; Jang, M.-S.; Thorenz, A.; Chen, R.; Hertel, B.; Barrmeyer, A.; Schmidbauer, M.; Meier, M.; et al. Multiparametric functional MRI: Non- invasive imaging of inflammation and edema formation after kidney transplantation in mice. PLoS ONE 2016, 11, e0162705. [Google Scholar] [CrossRef] [Green Version]
- Caroli, A.; Schneider, M.; Friedli, I.; Ljimani, A.; De Seigneux, S.; Boor, P.; Gullapudi, L.; Kazmi, I.; A Mendichovszky, I.; Notohamiprodjo, M.; et al. Diffusion-weighted magnetic resonance imaging to assess diffuse renal pathology: A systematic review and statement paper. Nephrol. Dial. Transplant 2018, 33, ii29–ii40. [Google Scholar] [CrossRef] [Green Version]
- Zhou, J.-Y.; Wang, Y.-C.; Zeng, C.-H.; Ju, S.-H. Renal functional MRI and its application. J. Magn. Reson. Imaging 2018, 48, 863–881. [Google Scholar] [CrossRef]
- Caroli, A.; Remuzzi, A.; Lerman, L.O. Basic principles and new advances in kidney imaging. Kidney Int. 2021, 100, 1001–1011. [Google Scholar] [CrossRef]
- Pei, M.; Nguyen, T.D.; Thimmappa, N.D.; Salustri, C.; Dong, F.; Cooper, M.A.; Li, J.; Prince, M.R.; Wang, Y. Algorithm for fast monoexponential fitting based on auto-regression on linear operations (ARLO) of data. Magn. Reson. Med. 2015, 73, 843–850. [Google Scholar] [CrossRef] [Green Version]
- Manjón, J.V.; Coupé, P.; Buades, A. MRI noise estimation and denoising using non-local PCA. Med. Image Anal. 2015, 22, 35–47. [Google Scholar] [CrossRef]
- Paller, M.S.; Hoidal, J.R.; Ferris, T.F. Oxygen free radicals in ischemic acute renal failure in the rat. J. Clin. Investig. 1984, 74, 1156–1164. [Google Scholar] [CrossRef] [PubMed]
- Guo, Y.; Ni, J.; Chen, S.; Bai, M.; Lin, J.; Ding, G.; Zhang, Y.; Sun, P.; Jia, Z.; Huang, S.; et al. MicroRNA-709 mediates acute tubular injury through effects on mitochondrial function. J. Am. Soc. Nephrol. 2018, 29, 449–461. [Google Scholar] [CrossRef] [PubMed] [Green Version]
- Cruces, P.; Lillo, P.; Salas, C.; Salomon, T.; Lillo, F.; Gonzalez, C.; Pacheco, A.; Hurtado, D.E. Renal decapsulation prevents intrinsic renal compartment syndrome in ischemia-reperfusion–induced acute kidney injury. Crit. Care Med. 2018, 46, 216–222. [Google Scholar] [CrossRef] [PubMed]
- Evans, R.G. Renal decapsulation to treat ischemic acute kidney injury. Crit. Care Med. 2018, 46, 332–333. [Google Scholar] [CrossRef] [PubMed]
- Herrler, T.; Tischer, A.; Meyer, A.; Feiler, S.; Guba, M.; Nowak, S.; Rentsch, M.; Bartenstein, P.; Hacker, M.; Jauch, K.-W. The intrinsic renal compartment syndrome: New perspectives in kidney transplantation. Transplantation 2010, 89, 40–46. [Google Scholar] [CrossRef] [PubMed]
- Declèves, A.; Jadot, I.; Colombaro, V.; Martin, B.; Voisin, V.; Nortier, J.; Caron, N. Protective effect of nitric oxide in aristolochic acid-induced toxic acute kidney injury: An old friend with new assets. Exp. Physiol. 2016, 101, 193–206. [Google Scholar] [CrossRef] [PubMed]
- Brezis, M.; Rosen, S. Hypoxia of the renal medulla—Its implications for disease epstein fh, editor. N. Engl. J. Med. 1995, 332, 647–655. [Google Scholar] [CrossRef] [PubMed]
- Evans, R.G.; Ince, C.; Joles, J.A.; Smith, D.W.; May, C.N.; O’Connor, P.M.; Gardiner, B. Haemodynamic influences on kidney oxygenation: Clinical implications of integrative physiology. Clin. Exp. Pharmacol. Physiol. 2013, 40, 106–122. [Google Scholar] [CrossRef]
- Seeliger, E.; Sendeski, M.; Rihal, C.S.; Persson, P.B. Contrast-induced kidney injury: Mechanisms, risk factors, and prevention. Eur. Heart J. 2012, 33, 2007–2015. [Google Scholar] [CrossRef]
- Hultström, M.; Becirovic-Agic, M.; Jönsson, S. Comparison of acute kidney injury of different etiology reveals in-common mechanisms of tissue damage. Physiol. Genomics 2018, 50, 127–141. [Google Scholar] [CrossRef] [PubMed]
- Ma, S.; Evans, R.; Iguchi, N.; Tare, M.; Parkington, H.C.; Bellomo, R.; May, C.N.; Lankadeva, Y.R. Sepsis-induced acute kidney injury: A disease of the microcirculation. Microcirculation 2019, 26, e12483. [Google Scholar] [CrossRef] [PubMed]
- Scholz, H.; Boivin, F.J.; Schmidt-Ott, K.M.; Bachmann, S.; Eckardt, K.-U.; Scholl, U.I.; Persson, P.B. Kidney physiology and susceptibility to acute kidney injury: Implications for renoprotection. Nat. Rev. Nephrol. 2021, 17, 335–349. [Google Scholar] [CrossRef] [PubMed]
- Han, J.; Xian, Z.; Zhang, Y.; Liu, J.; Liang, A. Systematic overview of aristolochic acids: Nephrotoxicity, carcinogenicity, and underlying mechanisms. Front. Pharmacol. 2019, 10, 648. [Google Scholar] [CrossRef] [Green Version]
- Greite, R.; Derlin, K.; Hartung, D.; Chen, R.; Meier, M.; Gutberlet, M.; Hensen, B.; Wacker, F.; Gueler, F.; Hellms, S. Diffusion weighted imaging and t2 mapping detect inflammatory response in the renal tissue during ischemia induced acute kidney injury in different mouse strains and predict renal outcome. Biomedicines 2021, 9, 1071. [Google Scholar] [CrossRef] [PubMed]
- Hashim, E.; Yuen, D.A.; Kirpalani, A. Reduced flow in delayed graft function as assessed by IVIM is associated with time to recovery following kidney transplantation. J. Magn. Reson. Imaging 2021, 53, 108–117. [Google Scholar] [CrossRef]
- Van Baalen, S.; Leemans, A.; Dik, P.; Lilien, M.R.; ten Haken, B.; Froeling, M. Intravoxel incoherent motion modeling in the kidneys: Comparison of mono-, bi-, and triexponential fit. J. Magn. Reson. Imaging 2017, 46, 228–239. [Google Scholar] [CrossRef] [Green Version]
- Van der Bel, R.; Gurney-Champion, O.J.; Froeling, M.; Stroes, E.S.G.; Nederveen, A.J.; Krediet, C.T.P. A tri-exponential model for intravoxel incoherent motion analysis of the human kidney: In silico and during pharmacological renal perfusion modulation. Eur. J. Radiol. 2017, 91, 168–174. [Google Scholar] [CrossRef]
- Periquito, J.S.; Gladytz, T.; Millward, J.M.; Delgado, P.R.; Cantow, K.; Grosenick, D.; Hummel, L.; Anger, A.; Zhao, K.; Seeliger, E.; et al. Continuous diffusion spectrum computation for diffusion-weighted magnetic resonance imaging of the kidney tubule system. Quant. Imaging Med. Surg. 2021, 11, 3098–3119. [Google Scholar] [CrossRef]
- Okada, H.; Watanabe, Y.; Inoue, T.; Kobayashi, T.; Kanno, Y.; Shiota, G.; Nakamura, T.; Sugaya, T.; Fukamizu, A.; Suzuki, H. Transgene-derived hepatocyte growth factor attenuates reactive renal fibrosis in aristolochic acid nephrotoxicity. Nephrol. Dial. Transpl. 2003, 18, 2515–2523. [Google Scholar] [CrossRef] [Green Version]
- Kirtane, A.J.; Leder, D.M.; Waikar, S.S.; Chertow, G.M.; Ray, K.K.; Pinto, D.S.; Karmpaliotis, D.; Burger, A.J.; Murphy, S.A.; Cannon, C.P.; et al. Serum blood urea nitrogen as an independent marker of subsequent mortality among patients with acute coronary syndromes and normal to mildly reduced glomerular filtration rates. J. Am. Coll. Cardiol. 2005, 45, 1781–1786. [Google Scholar] [CrossRef] [Green Version]
- Rached, E.; Hoffmann, D.; Blumbach, K.; Weber, K.; Dekant, W.; Mally, A. Evaluation of putative biomarkers of nephrotoxicity after exposure to ochratoxin a in vivo and in vitro. Toxicol. Sci. 2008, 103, 371–381. [Google Scholar] [CrossRef] [PubMed]
- Kim, S.Y.; Moon, A. Drug-induced nephrotoxicity and its biomarkers. Biomol. Ther. 2012, 20, 268–272. [Google Scholar] [CrossRef] [PubMed] [Green Version]
- Fähling, M.; Seeliger, E.; Patzak, A.; Persson, P.B. Understanding and preventing contrast-induced acute kidney injury. Nat. Rev. Nephrol. 2017, 13, 169–180. [Google Scholar] [CrossRef] [PubMed]
- Porrini, E.; Ruggenenti, P.; Luis-Lima, S.; Carrara, F.; Jiménez, A.; de Vries, A.; Torres, A.; Gaspari, F.; Remuzzi, G. Estimated GFR: Time for a critical appraisal. Nat. Rev. Nephrol. 2019, 15, 177–190. [Google Scholar] [CrossRef] [PubMed]


| T2 (ms) | Group | Baseline | Day 2 | Day 4 | Day 6 |
|---|---|---|---|---|---|
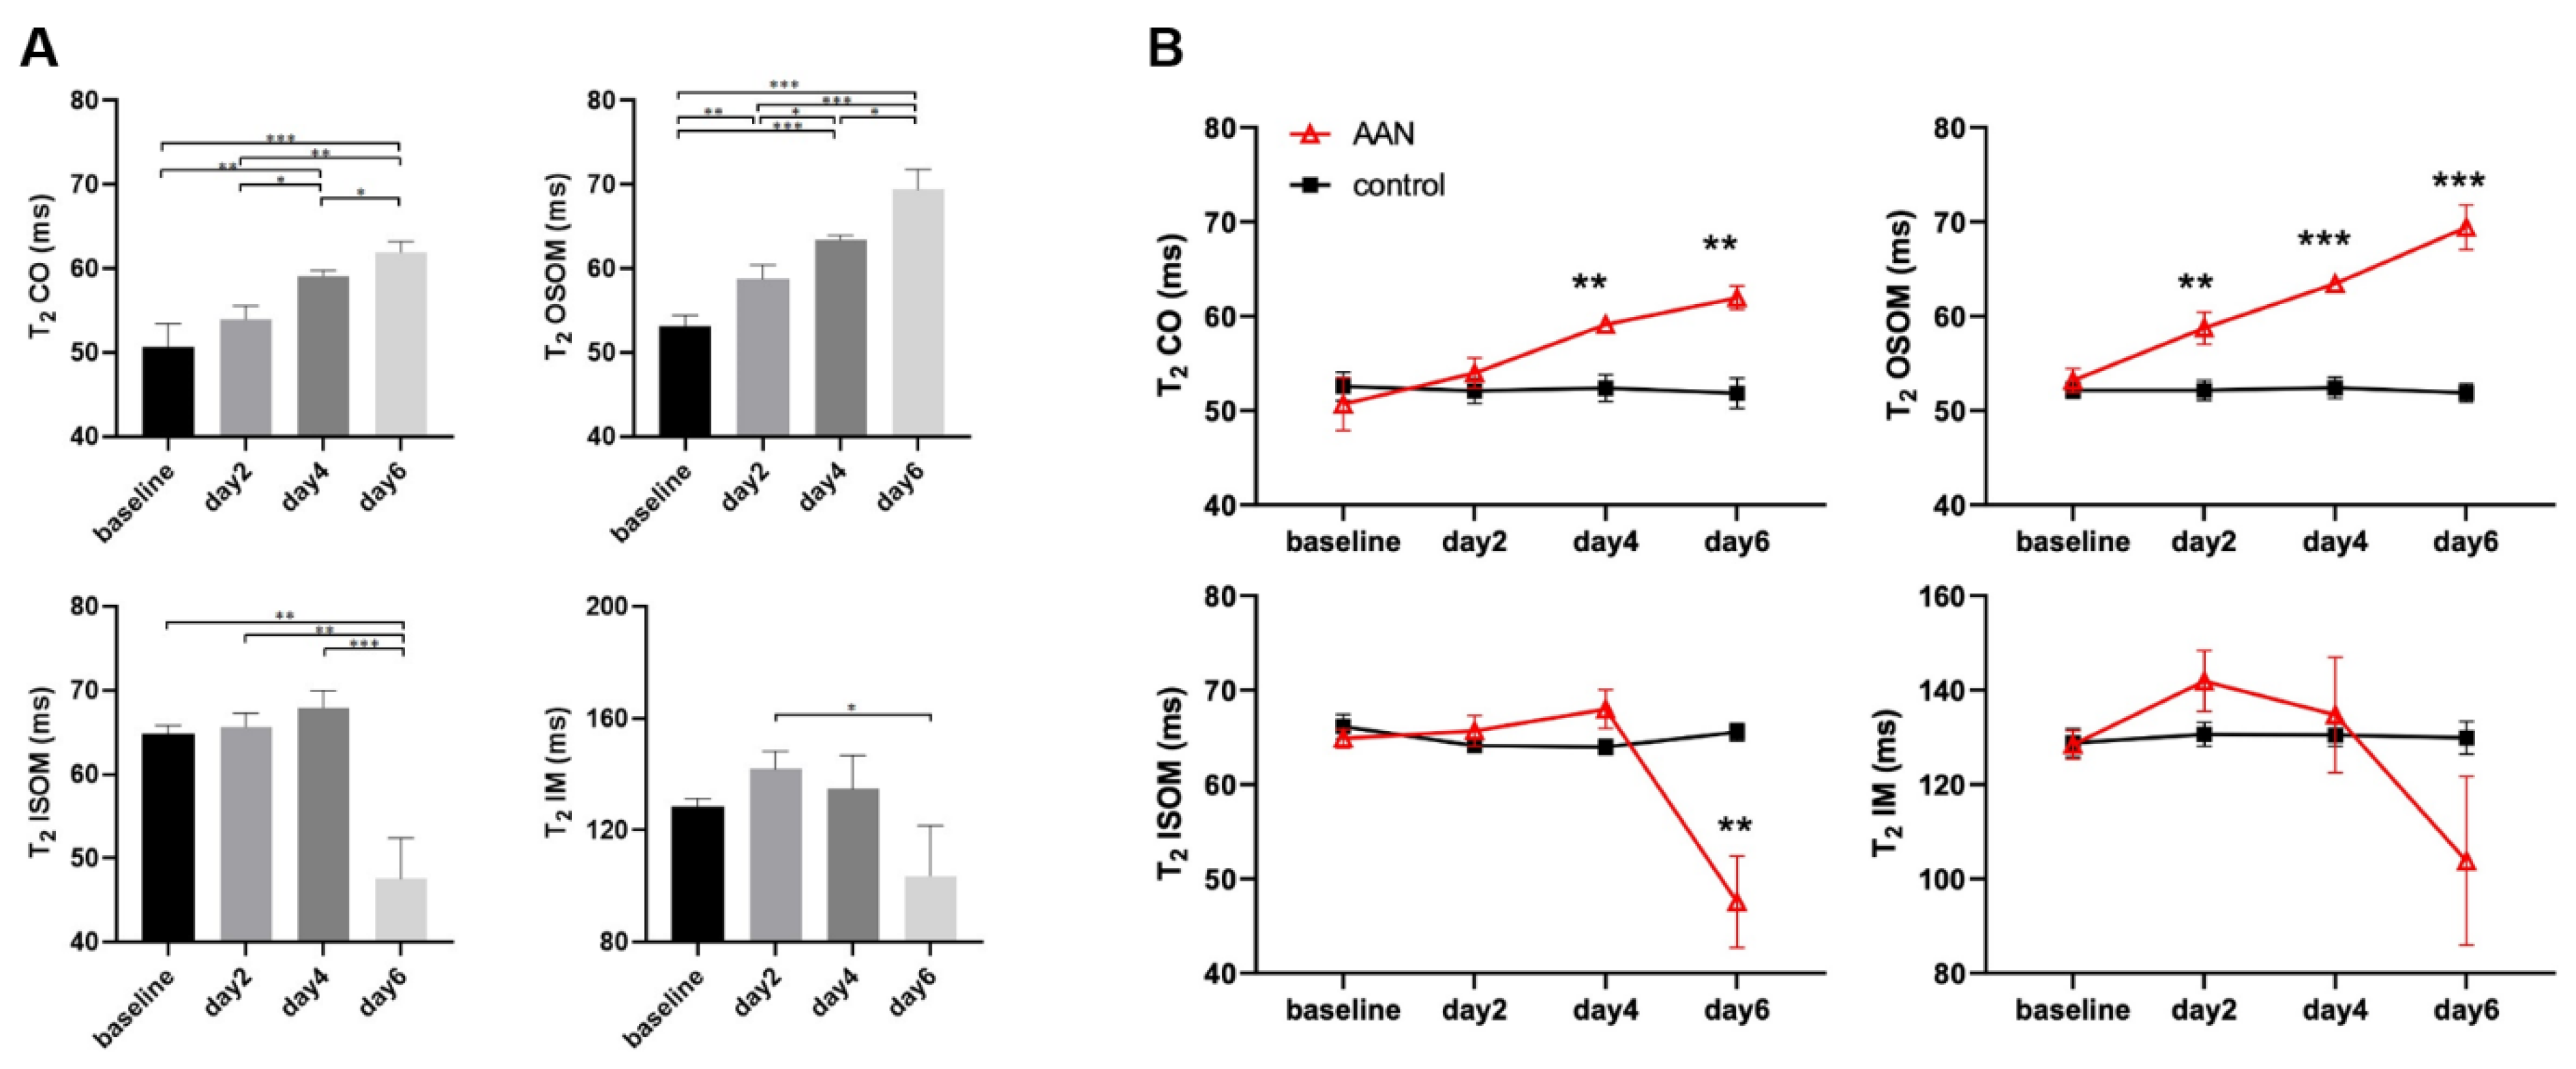
| CO | AAN | 50.69 ± 2.79 | 53.98 ± 1.59 | 59.11 ± 0.68 ** | 61.96 ± 1.25 *** |
| control | 52.57 ± 1.51 | 52.07 ± 1.33 | 52.39 ± 1.39 | 51.85 ± 1.59 | |
| OSOM | AAN | 53.19 ± 1.26 | 58.74 ± 1.71 * | 63.44 ± 0.49 *** | 69.43 ± 2.37 *** |
| control | 52.16 ± 0.85 | 52.15 ± 1.07 | 52.42 ± 1.13 | 51.88 ± 0.98 | |
| ISOM | AAN | 64.87 ± 0.97 | 65.66 ± 1.63 | 67.99 ± 2.04 | 47.55 ± 4.84 * |
| control | 66.14 ± 1.31 | 64.10 ± 0.46 | 63.99 ± 0.79 | 65.53 ± 0.90 | |
| IM | AAN | 128.41 ± 3.01 | 141.91 ± 6.44 | 134.73 ± 12.21 | 103.79 ± 17.89 |
| control | 128.85 ± 2.96 | 130.65 ± 2.52 | 130.52 ± 2.40 | 129.89 ± 3.47 |
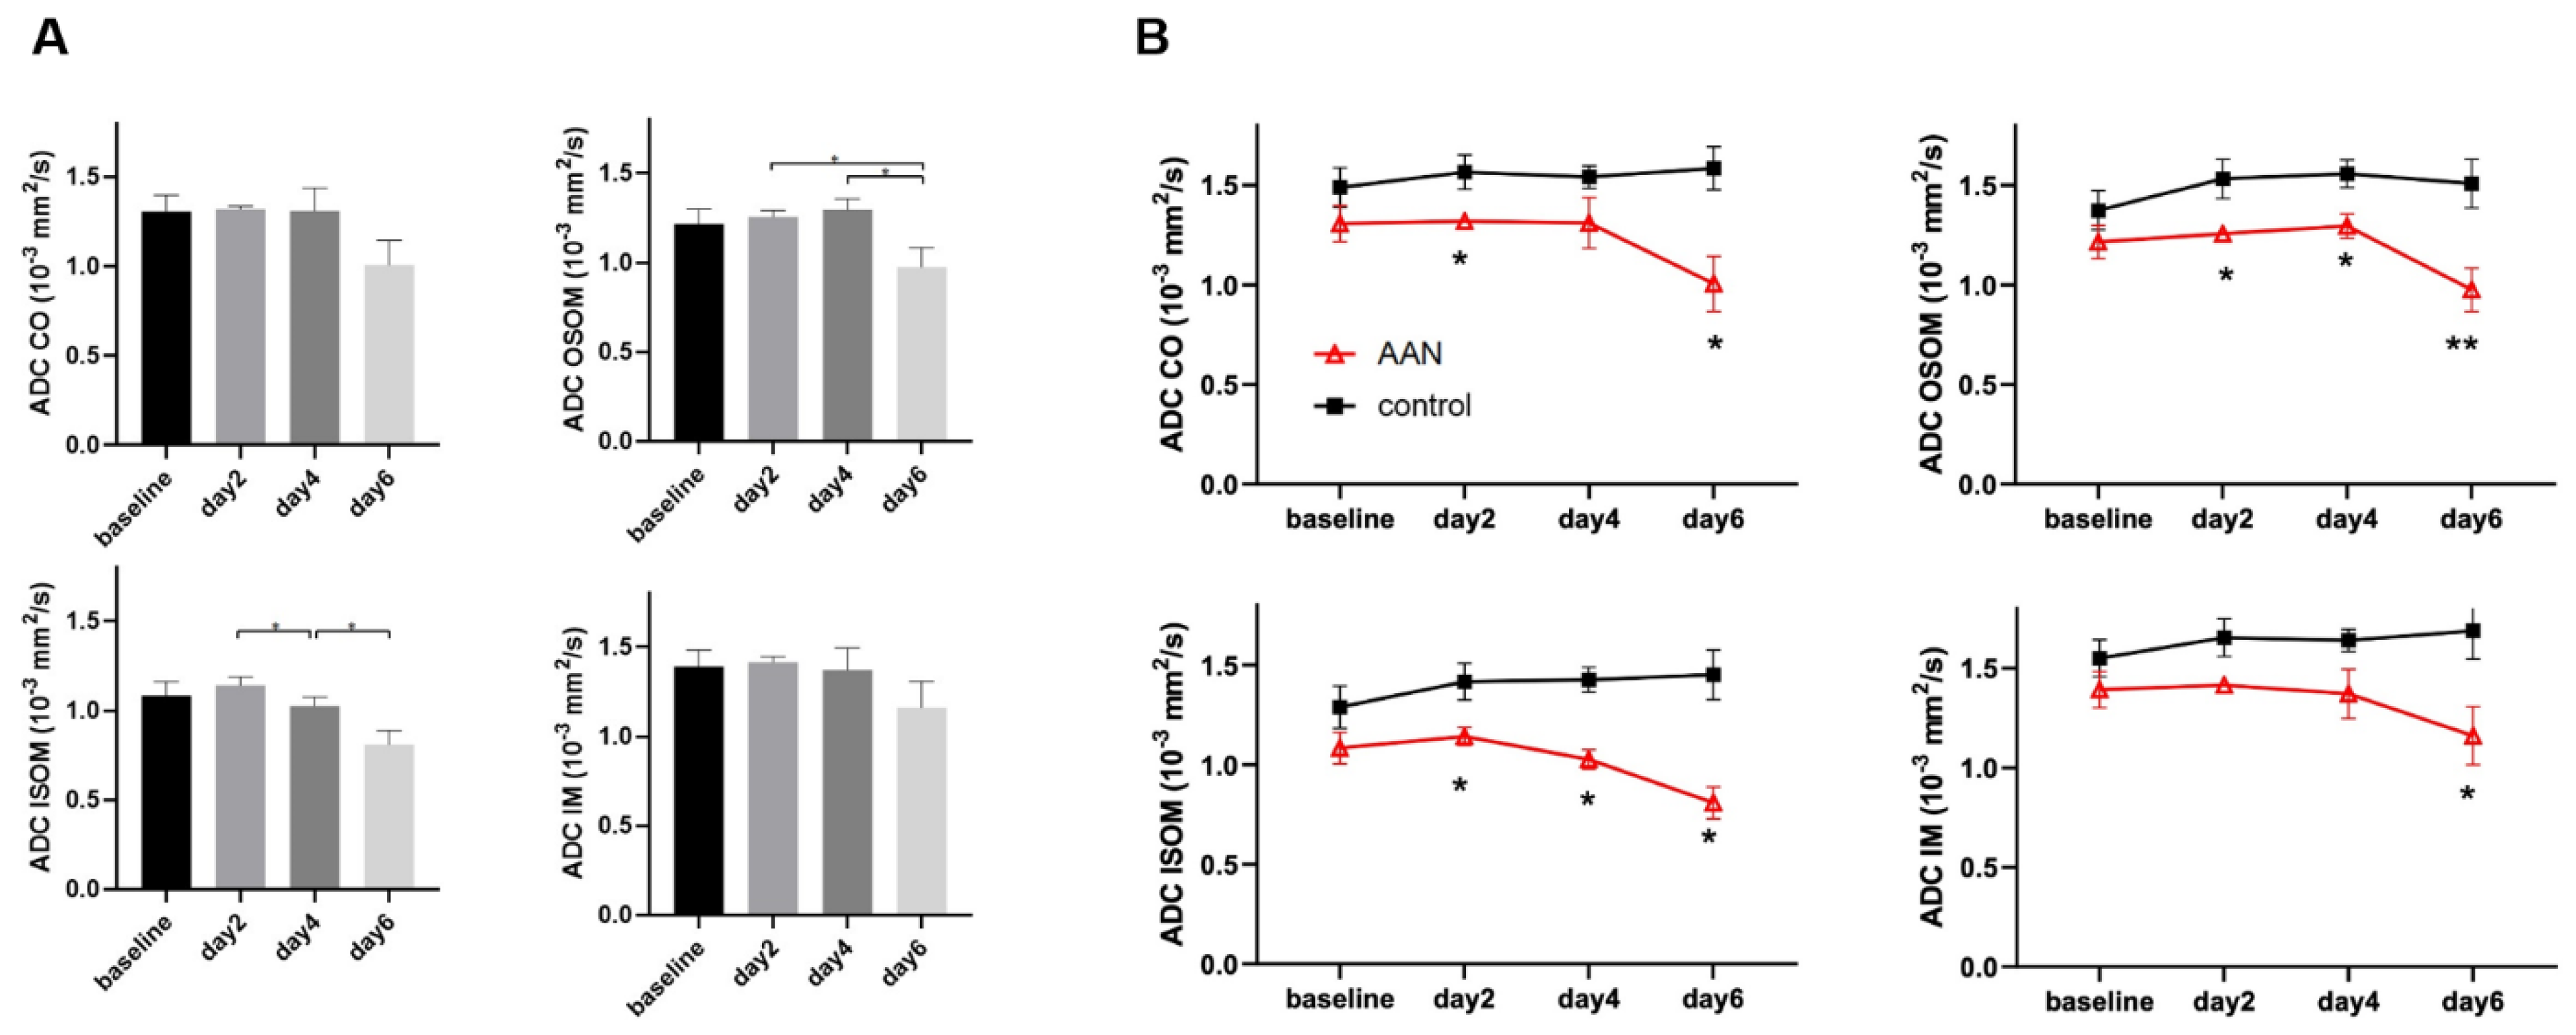
| ADC (10−3 mm2/s) | Group | Baseline | Day 2 | Day 4 | Day 6 |
|---|---|---|---|---|---|
| CO | AAN | 1.307 ± 0.09 | 1.319 ± 0.018 * | 1.311 ± 0.127 | 1.006 ± 0.139 * |
| control | 1.489 ± 0.099 | 1.566 ± 0.086 | 1.541 ± 0.056 | 1.585 ± 0.108 | |
| OSOM | AAN | 1.215 ± 0.083 | 1.256 ± 0.035 * | 1.295 ± 0.061 * | 0.975 ± 0.109 ** |
| control | 1.374 ± 0.098 | 1.532 ± 0.098 | 1.557 ± 0.069 | 1.508 ± 0.121 | |
| ISOM | AAN | 1.083 ± 0.079 | 1.142 ± 0.045 * | 1.027 ± 0.048 * | 0.809 ± 0.08 * |
| control | 1.289 ± 0.106 | 1.417 ± 0.092 | 1.426 ± 0.062 | 1.451 ± 0.124 | |
| IM | AAN | 1.393 ± 0.091 | 1.416 ± 0.03 | 1.372 ± 0.124 | 1.161 ± 0.146 * |
| control | 1.55 ± 0.094 | 1.654 ± 0.095 | 1.64 ± 0.055 | 1.688 ± 0.141 |
Publisher’s Note: MDPI stays neutral with regard to jurisdictional claims in published maps and institutional affiliations. |
© 2022 by the authors. Licensee MDPI, Basel, Switzerland. This article is an open access article distributed under the terms and conditions of the Creative Commons Attribution (CC BY) license (https://creativecommons.org/licenses/by/4.0/).
Share and Cite
Mei, Y.; Yang, G.; Guo, Y.; Zhao, K.; Wu, S.; Xu, Z.; Zhou, S.; Yan, C.; Seeliger, E.; Niendorf, T.; et al. Parametric MRI Detects Aristolochic Acid Induced Acute Kidney Injury. Tomography 2022, 8, 2902-2914. https://doi.org/10.3390/tomography8060243
Mei Y, Yang G, Guo Y, Zhao K, Wu S, Xu Z, Zhou S, Yan C, Seeliger E, Niendorf T, et al. Parametric MRI Detects Aristolochic Acid Induced Acute Kidney Injury. Tomography. 2022; 8(6):2902-2914. https://doi.org/10.3390/tomography8060243
Chicago/Turabian StyleMei, Yingjie, Guixiang Yang, Yihao Guo, Kaixuan Zhao, Shuyu Wu, Zhongbiao Xu, Shan Zhou, Chenggong Yan, Erdmann Seeliger, Thoralf Niendorf, and et al. 2022. "Parametric MRI Detects Aristolochic Acid Induced Acute Kidney Injury" Tomography 8, no. 6: 2902-2914. https://doi.org/10.3390/tomography8060243