
Giant Armadillo Optimization: A New Bio-Inspired Metaheuristic Algorithm for Solving Optimization Problems

 ,
,  ,
,  , and
, and 
Abstract
:1. Introduction
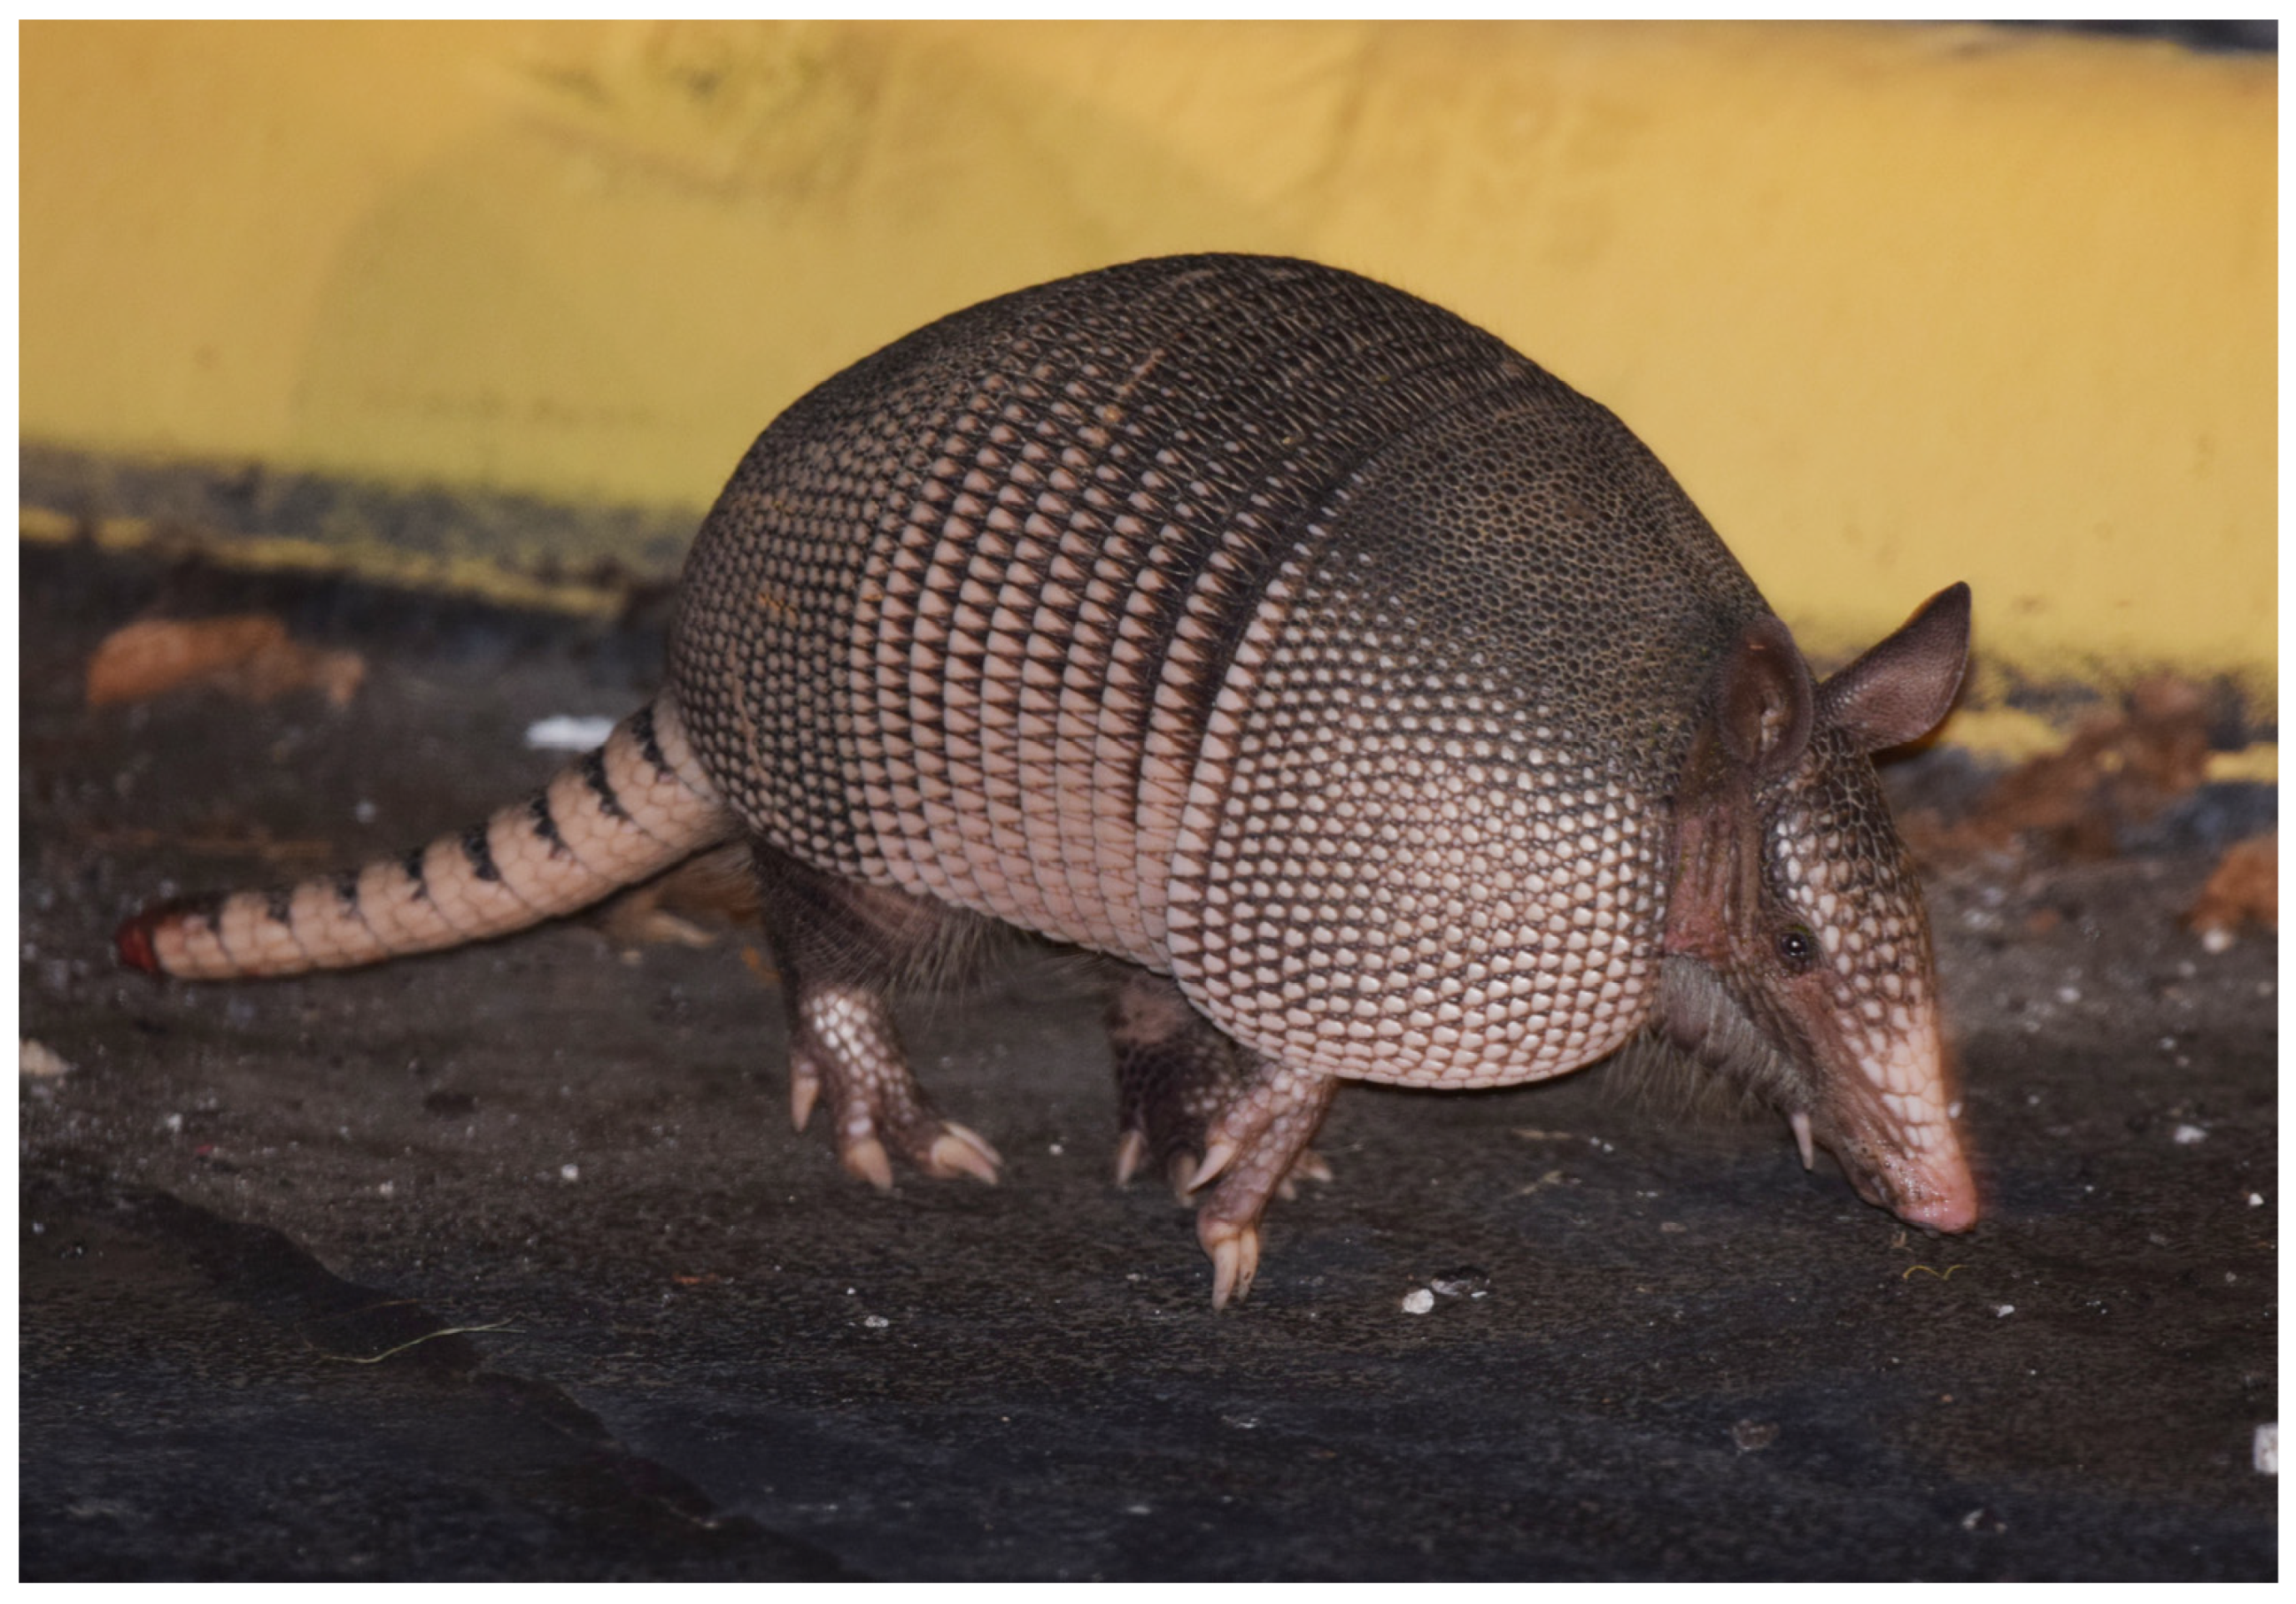
- GAO is designed based on simulating the natural behavior of giant armadillos in the wild.
- The fundamental inspiration for GAO is taken from the strategy of giant armadillos when attacking termite mounds.
- The GAO theory has been described and mathematically modeled in two phases: (i) exploration based on simulating the movement of giant armadillos towards termite mounds, and (ii) exploitation based on simulating giant armadillos’ digging skills in order to prey on and rip open termite mounds.
- The performance of GAO is evaluated on the CEC 2017 test suite for problem dimensions of 10, 30, 50, and 100.
- The performance of GAO in handling real-world applications is evaluated in handling twenty-two constrained optimization problems from the CEC 2011 test suite and four engineering design problems.
- The results obtained from GAO are compared with the performance of twelve well-known metaheuristic algorithms.
2. Literature Review
3. Giant Armadillo Optimization
3.1. Inspiration for GAO
3.2. Solution Process of the GAO
| Algorithm 1: Solution process of GAO |
Start.
|
3.3. Mathematical Modeling of GAO
3.3.1. Algorithm Initialization
3.3.2. Phase 1: Attack on Termite Mounds (Exploration Phase)
3.3.3. Phase 2: Digging in Termite Mounds (Exploitation Phase)
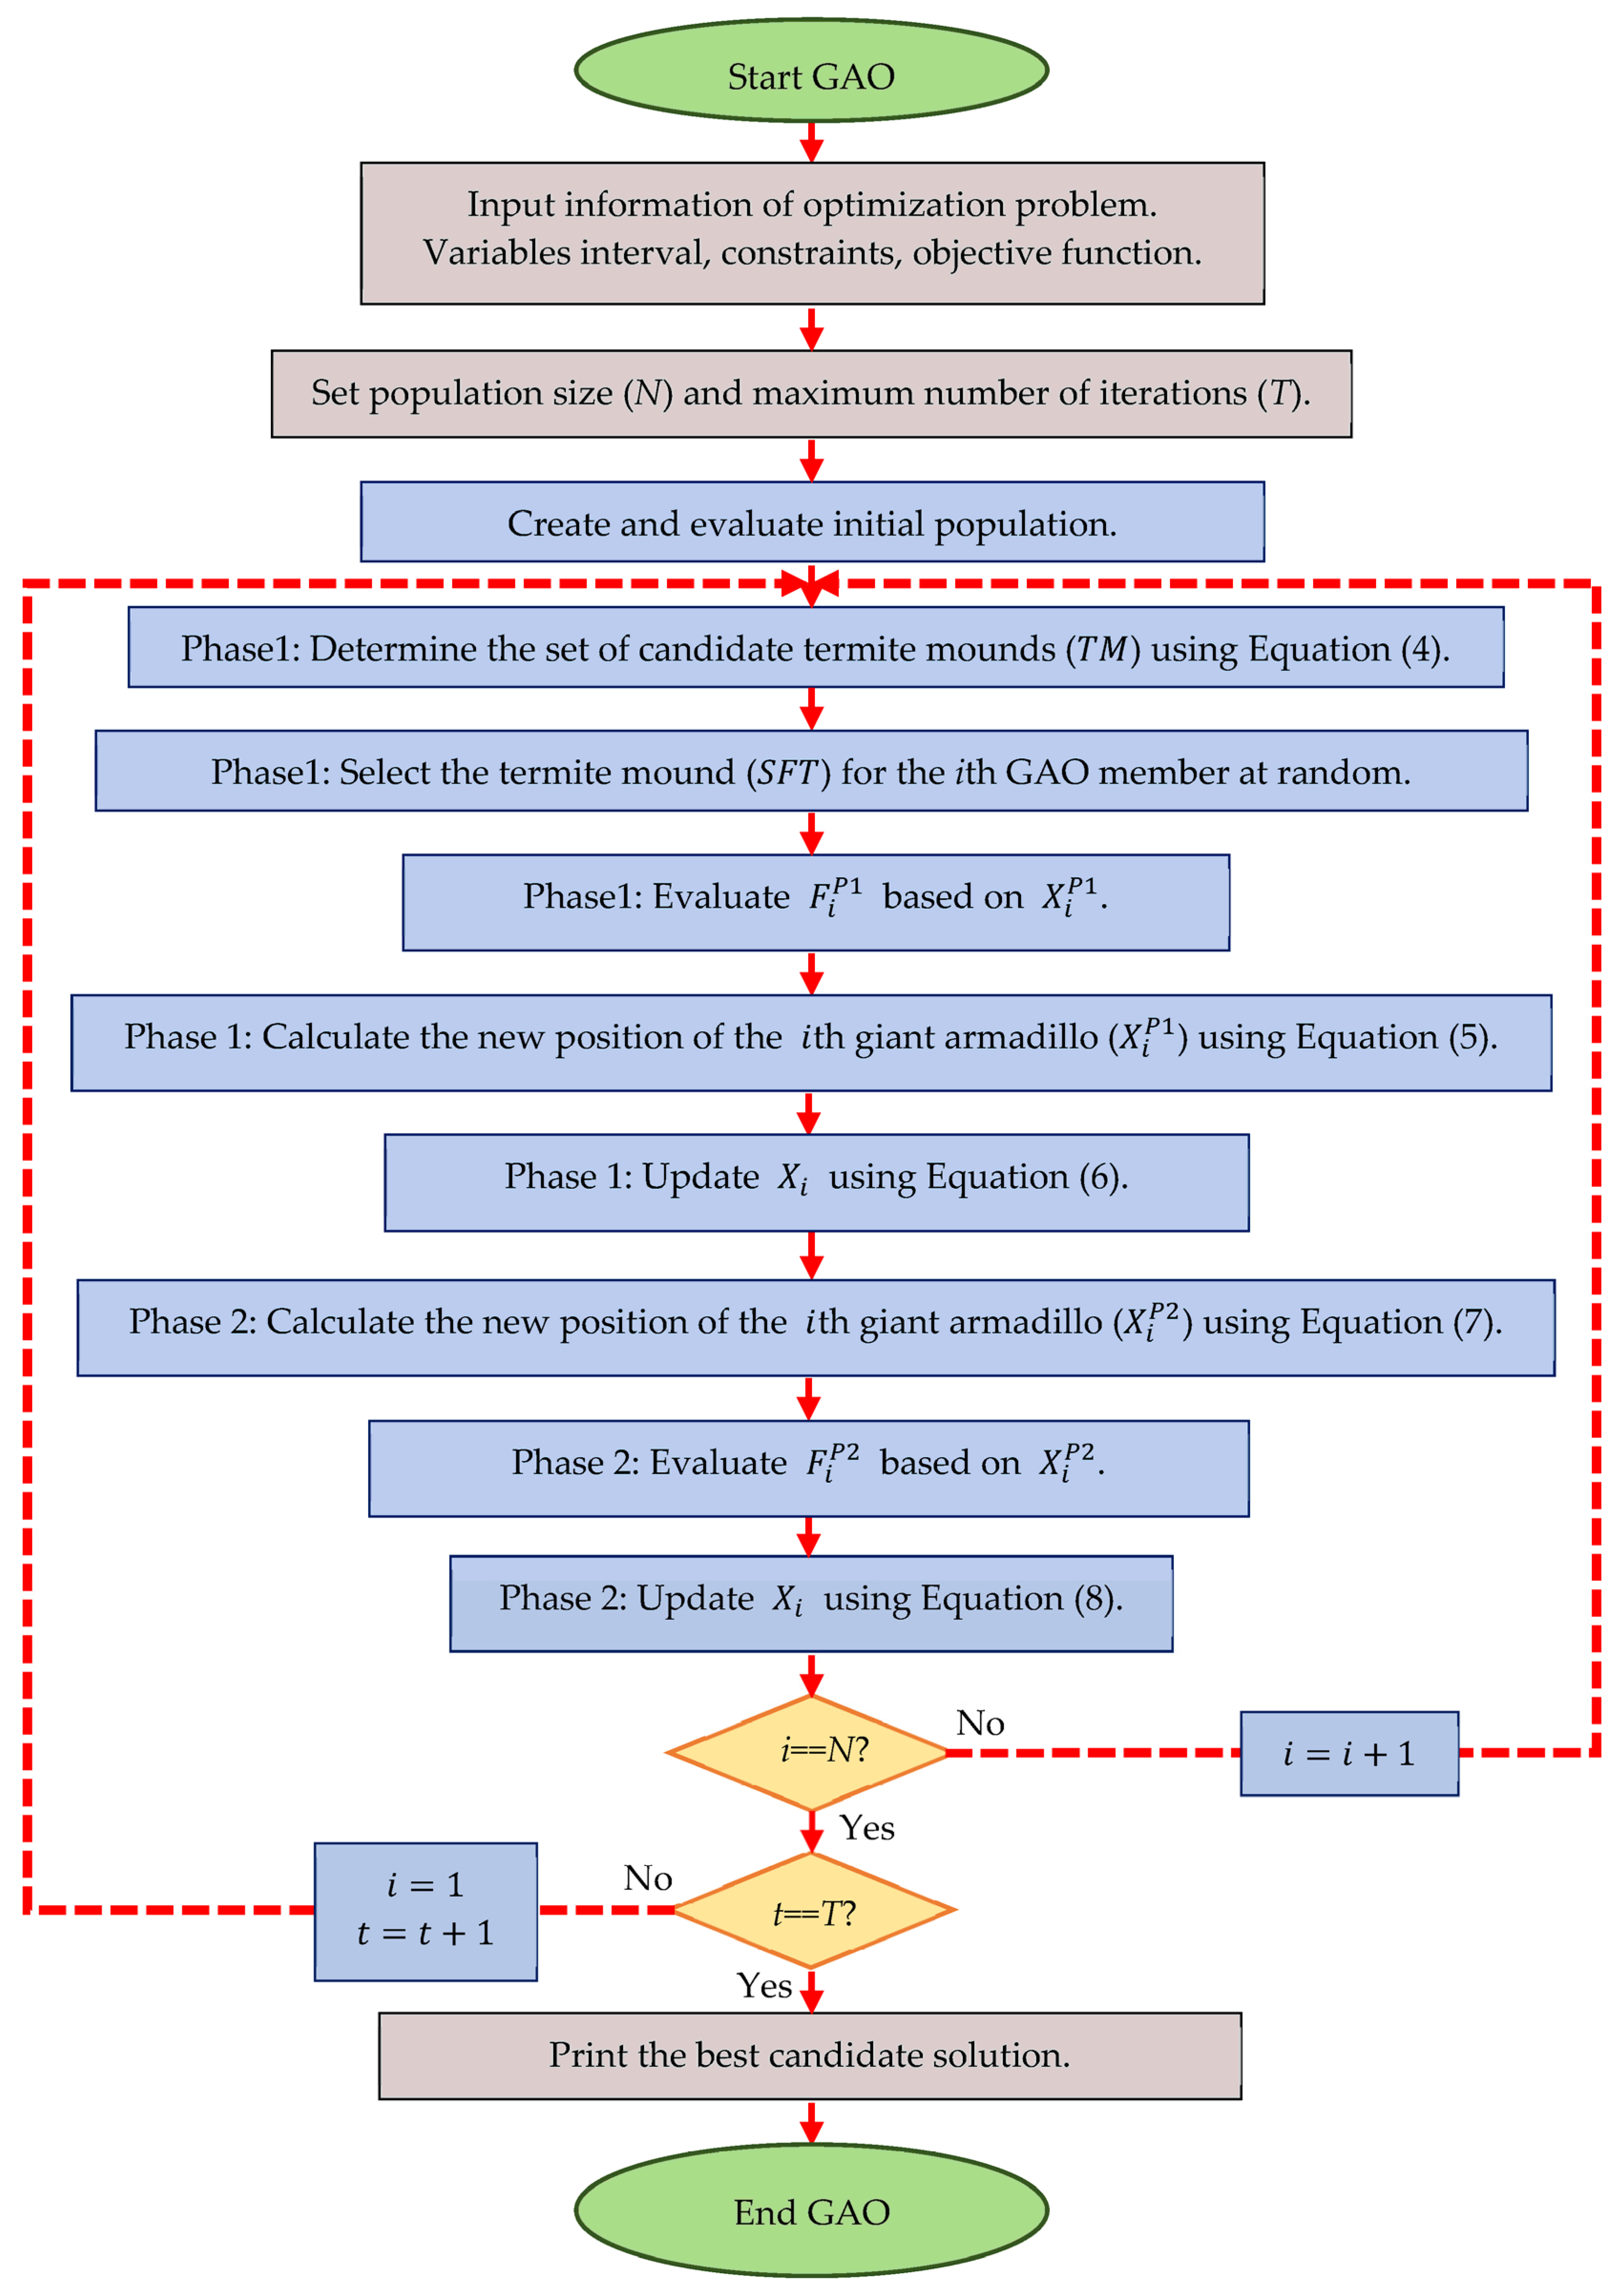
3.4. Repetition Process, Pseudocode, and Flowchart of GAO
| Algorithm 2: Pseudocode of GAO | ||||
| Start GAO. | ||||
| 1. | Input problem information: variables, objective function, and constraints. | |||
| 2. | Set GAO population size (N) and iterations (T). | |||
| 3. | Generate the initial population matrix at random using Equation (2). | |||
| 4. | Evaluate the objective function. | |||
| 5. | For to T | |||
| 6. | For to | |||
| 7. | Phase 1: Attack on termite mounds (exploration phase) | |||
| 8. | Determine the termite mounds set for the ith GAO member using Equation (4). | |||
| 9. | Select the termite mounds for the ith GAO member at random. | |||
| 10. | Calculate new position of ith GAO member using Equation (5). | |||
| 11. | Update ith GAO member using Equation (6). | |||
| 12. | Phase 2: Digging in termite mounds (exploitation phase) | |||
| 13. | Calculate new position of ith GAO member using Equation (7). | |||
| 14. | Update ith GAO member using Equation (8). | |||
| 15. | end | |||
| 16. | Save the best candidate solution so far. | |||
| 17. | end | |||
| 18. | Output the best quasi-optimal solution obtained with the GAO. | |||
| End GAO. | ||||
3.5. Computational Complexity of GAO
3.6. Comparing GAO vs. PSO
4. Simulation Studies and Results
4.1. Performance Comparison
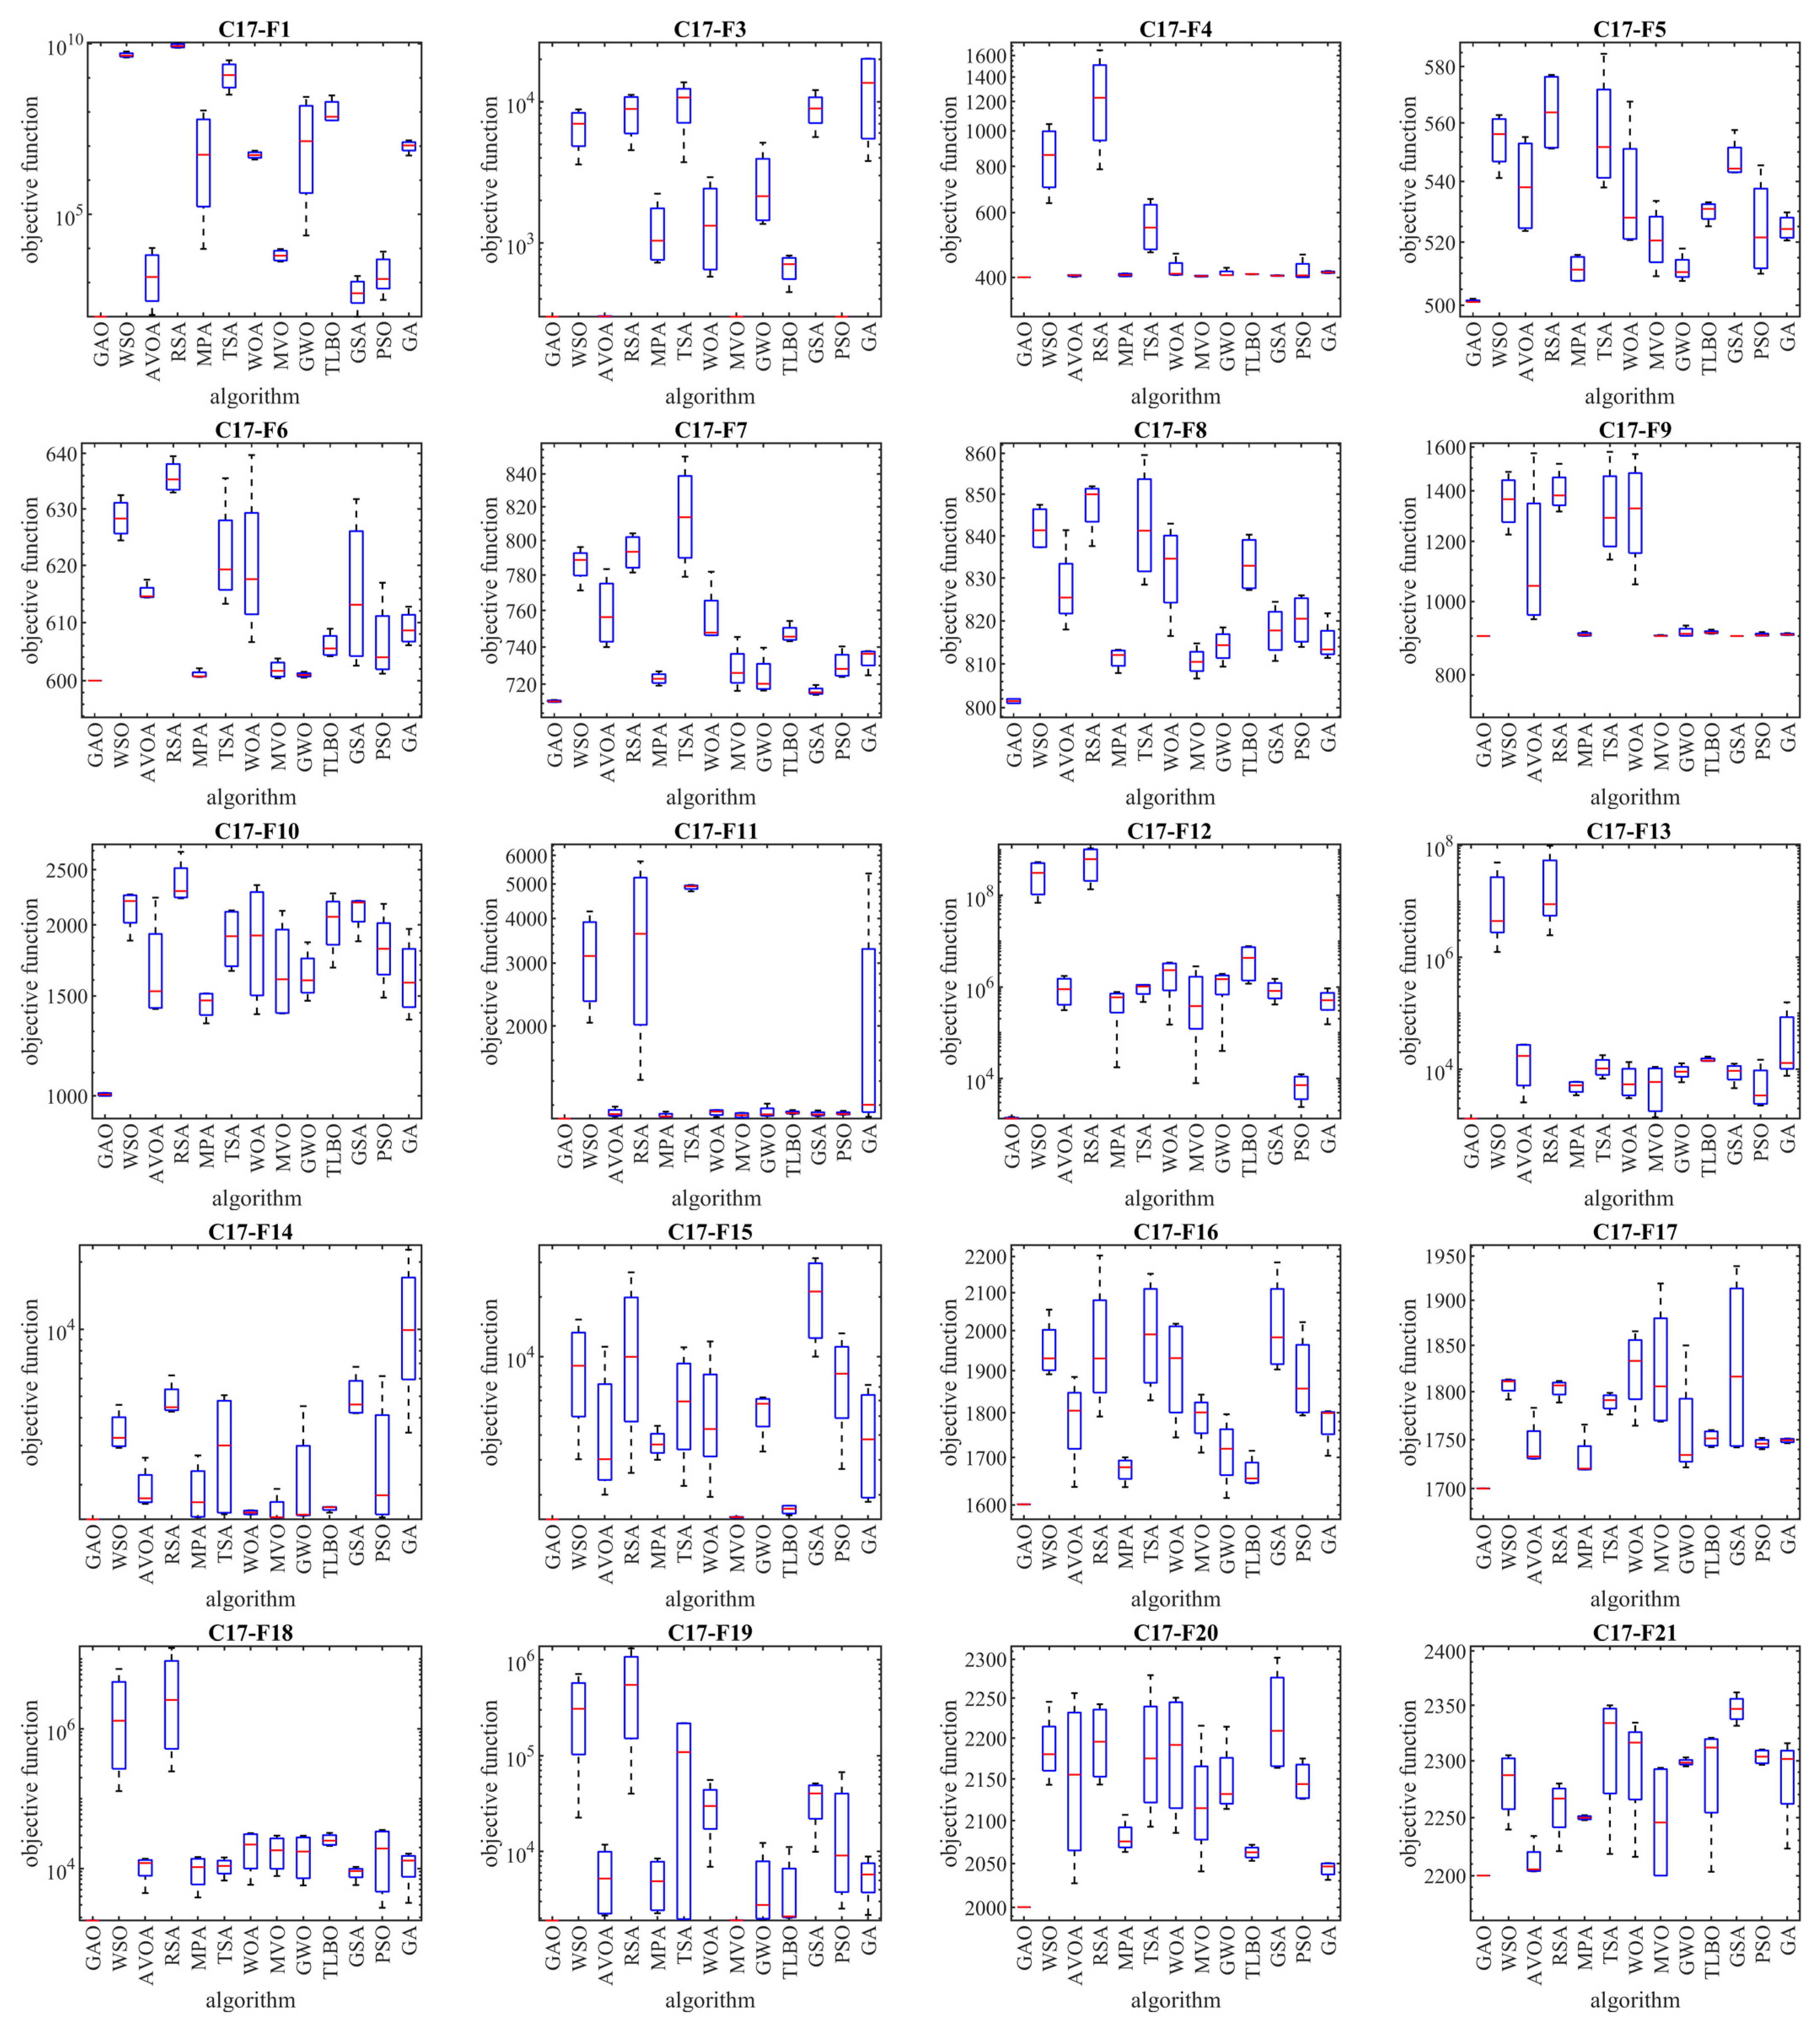
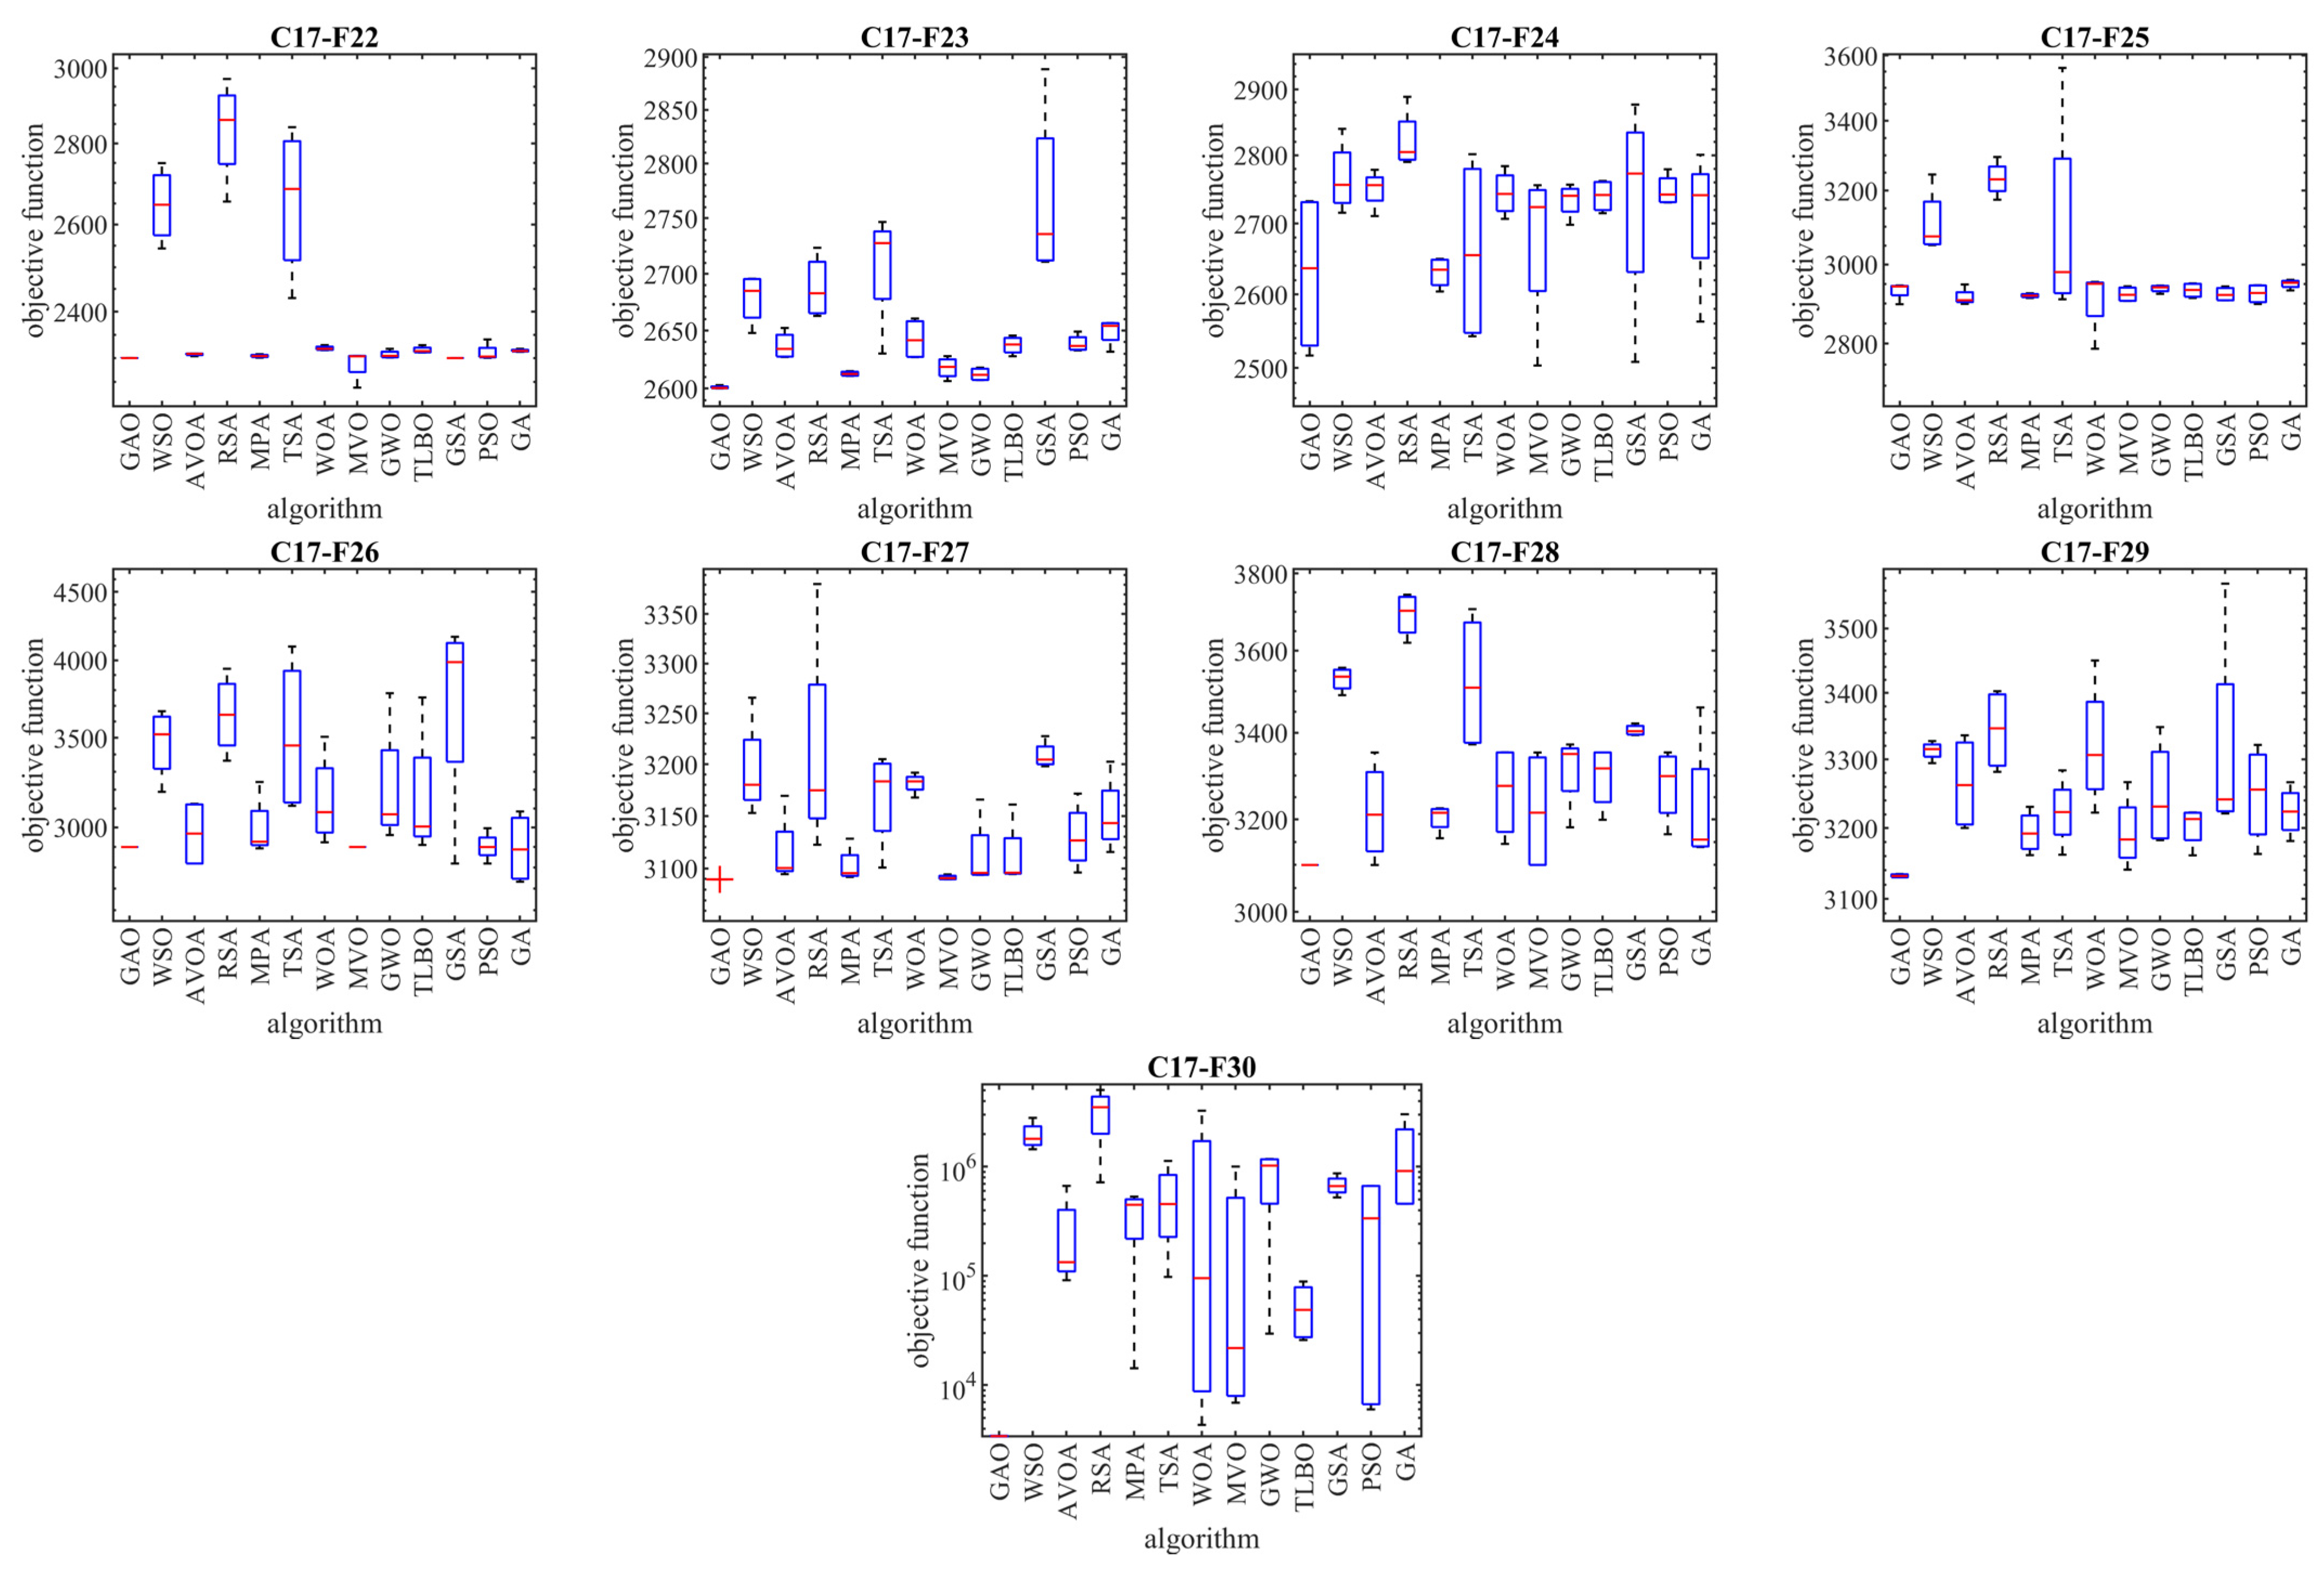
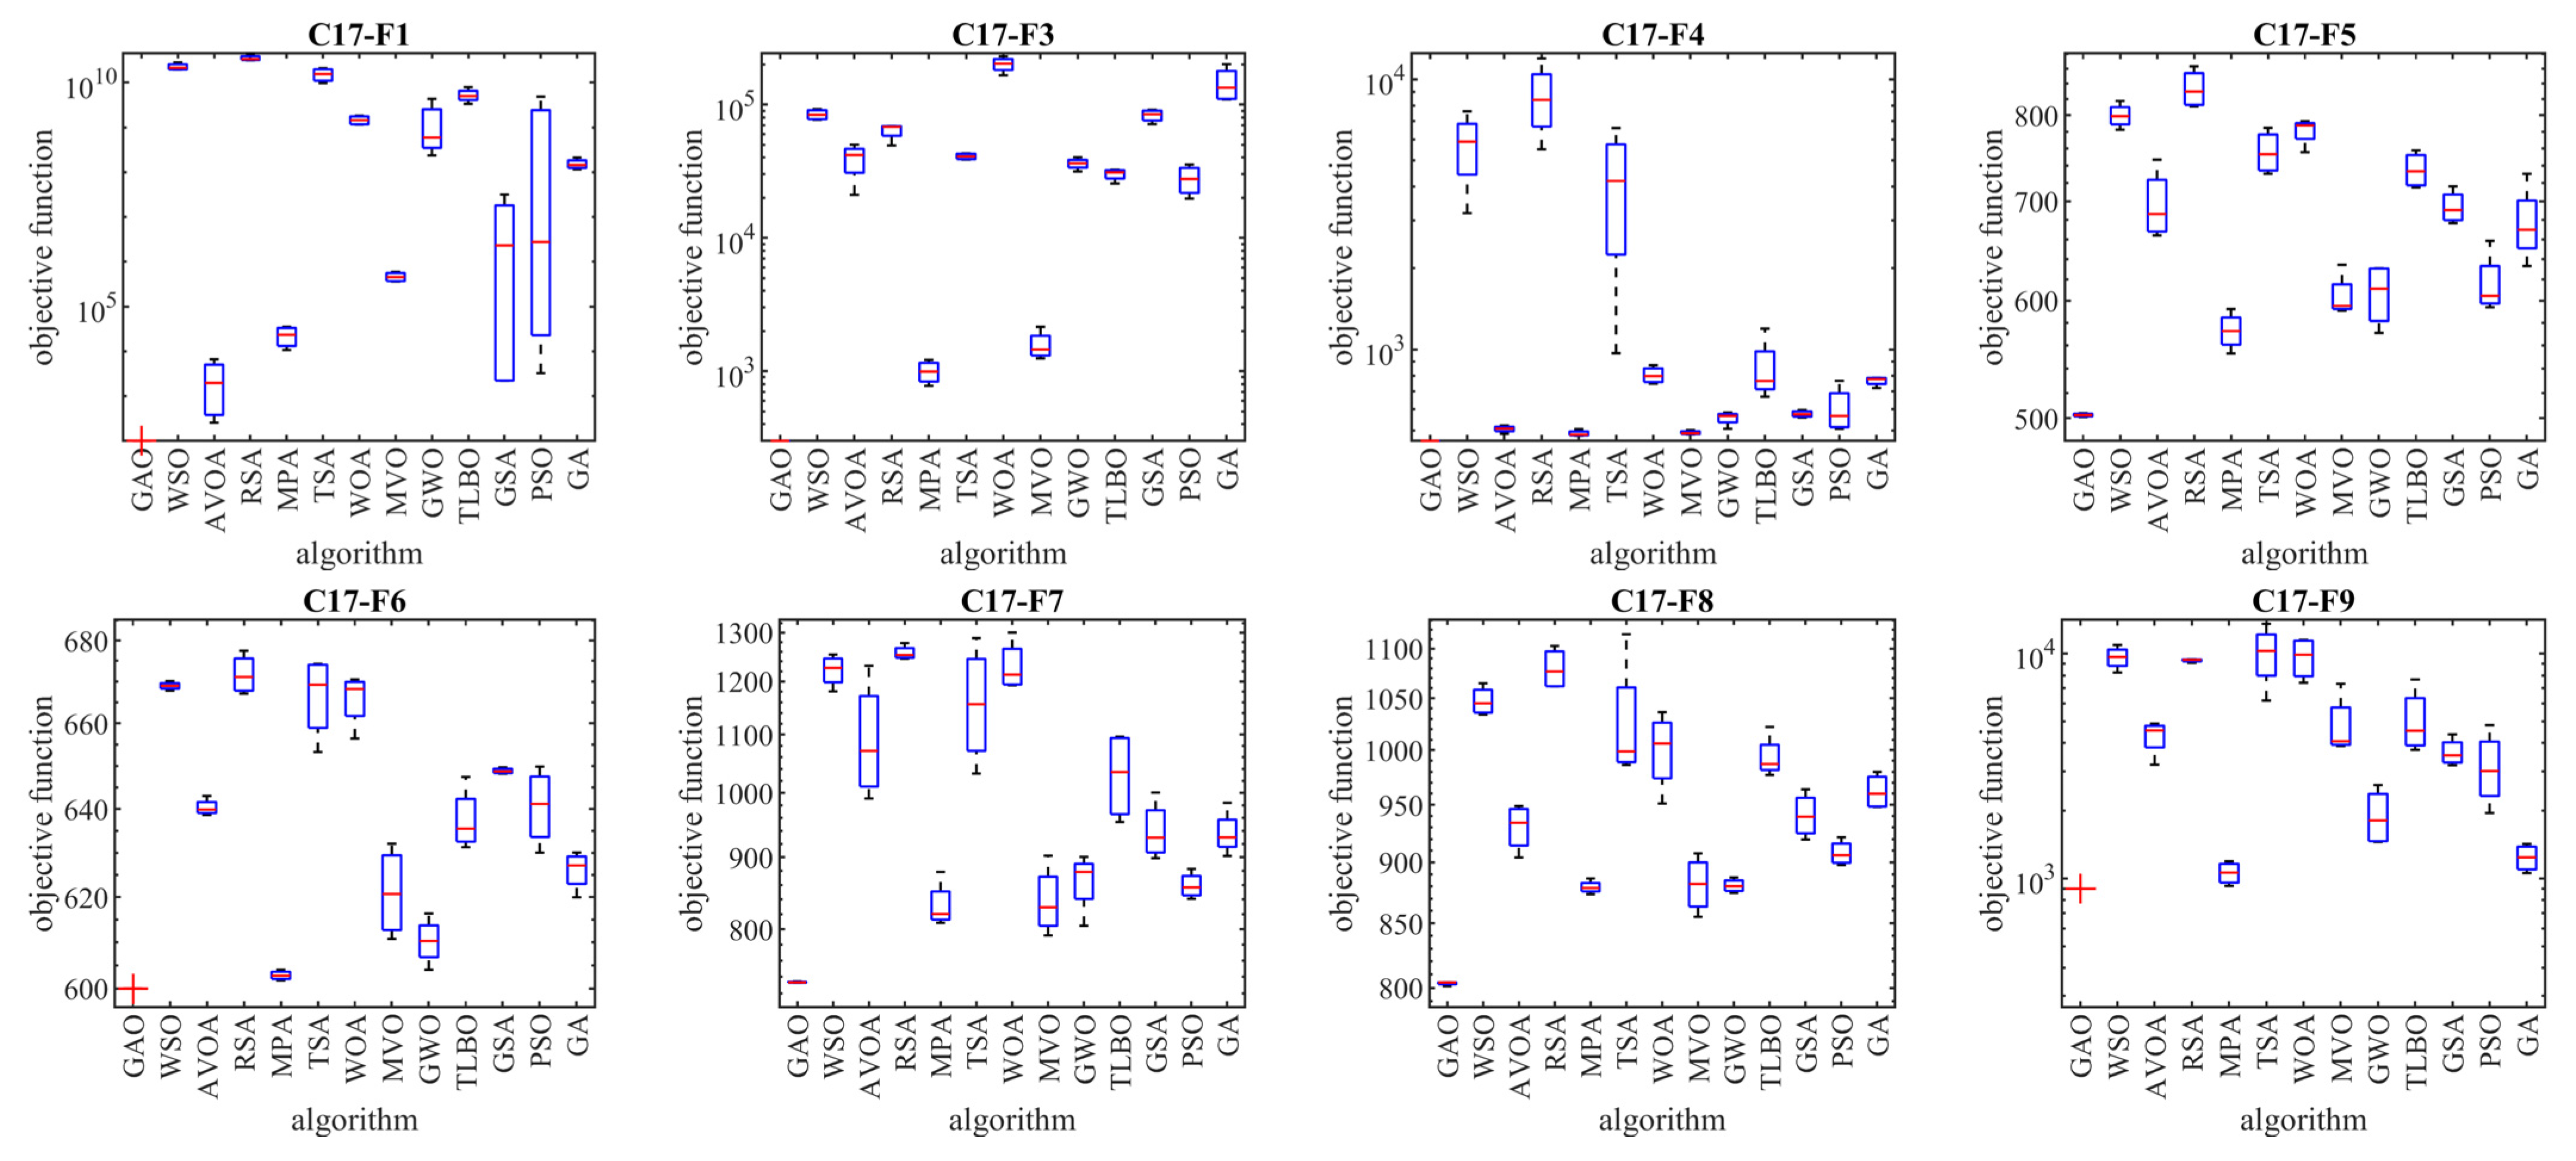
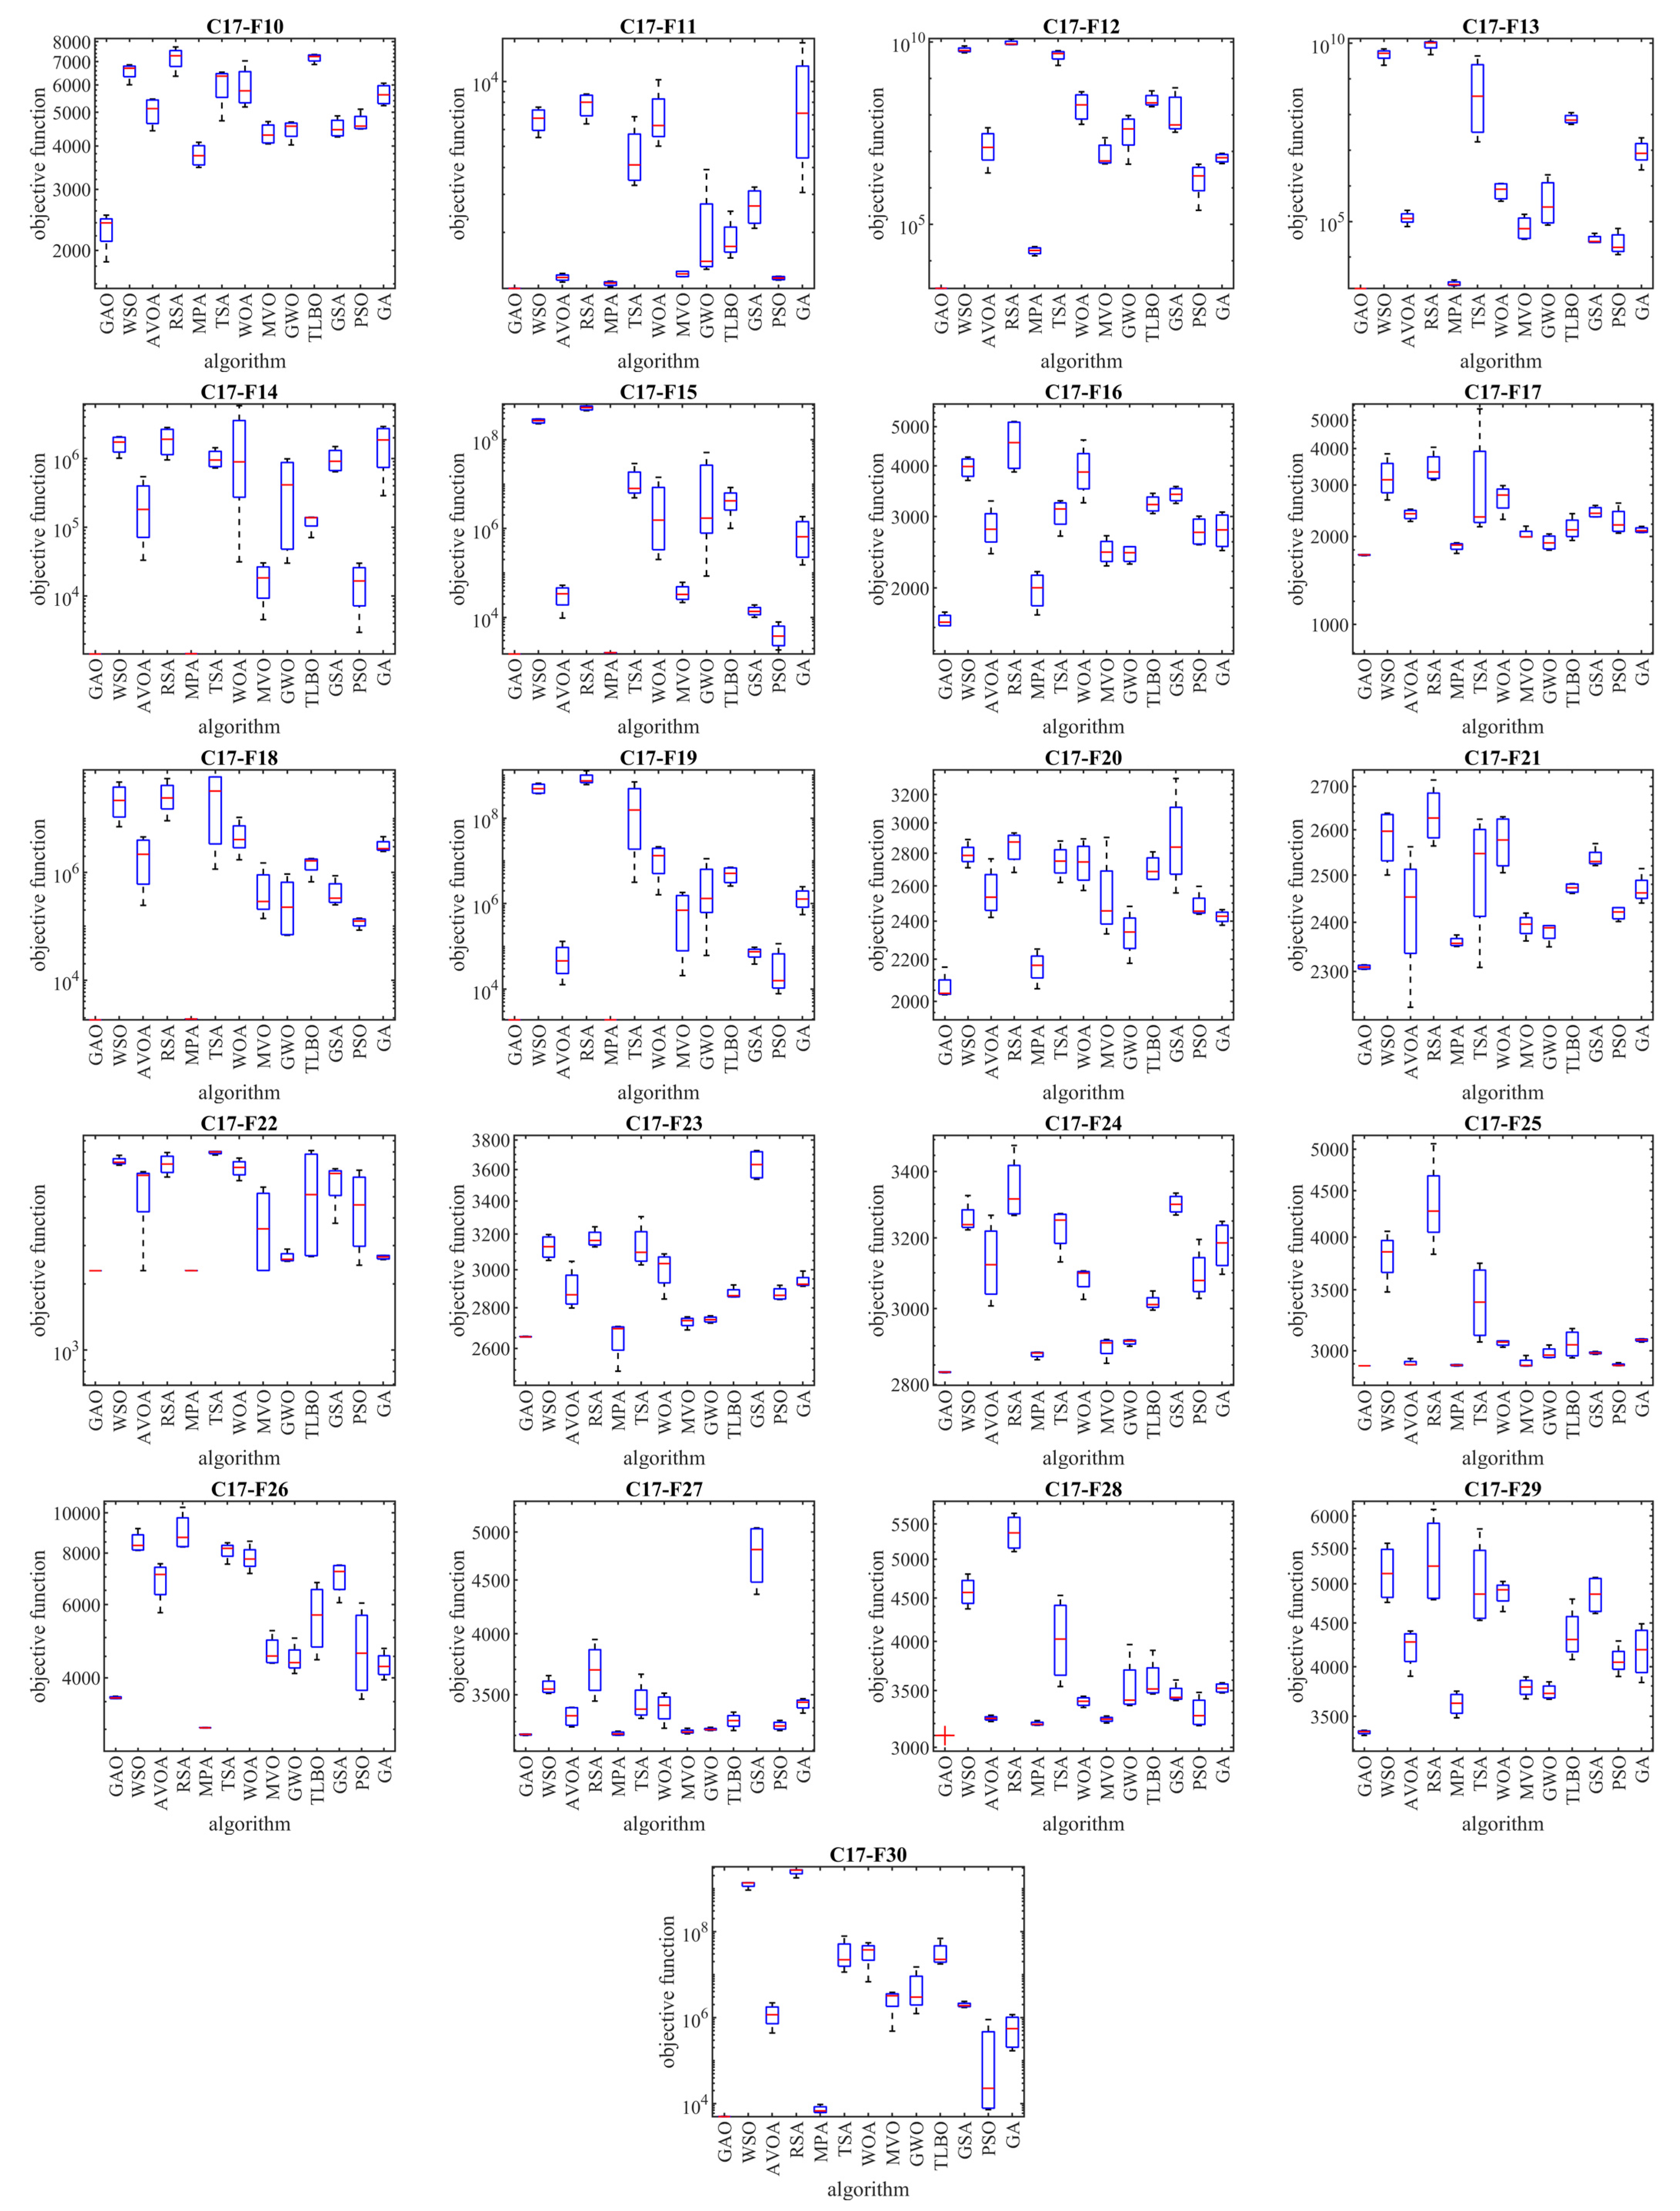
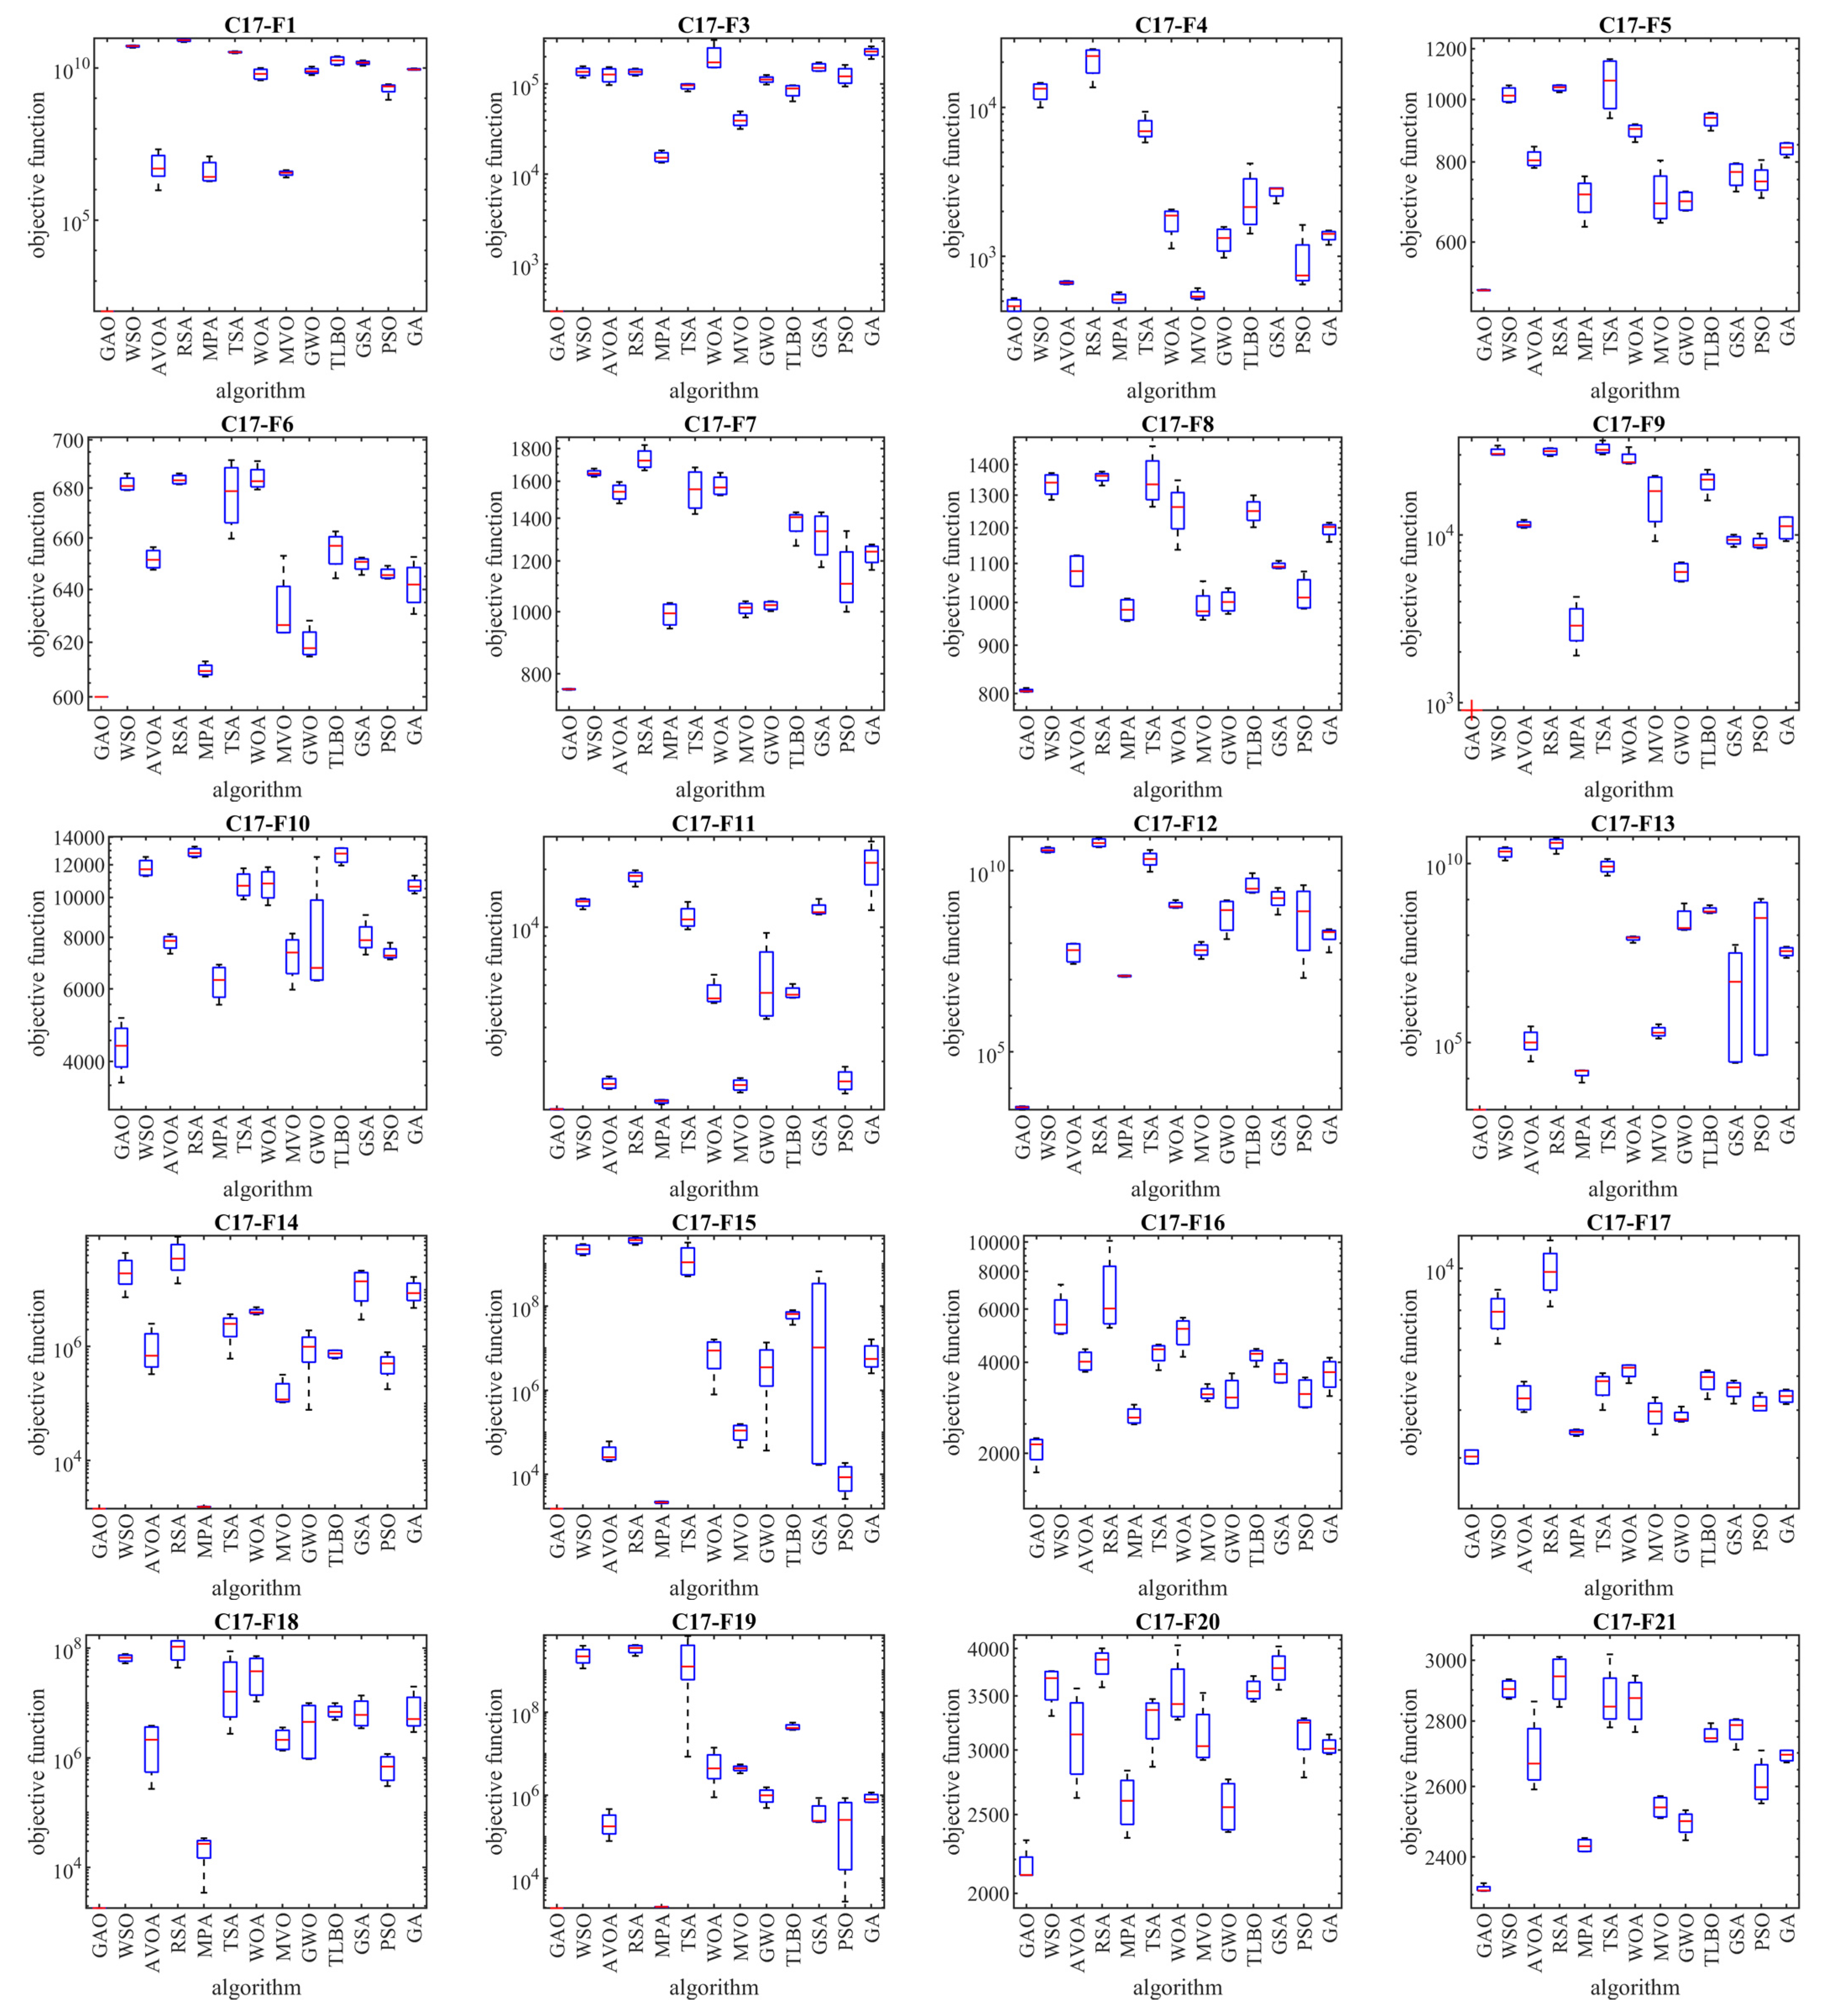
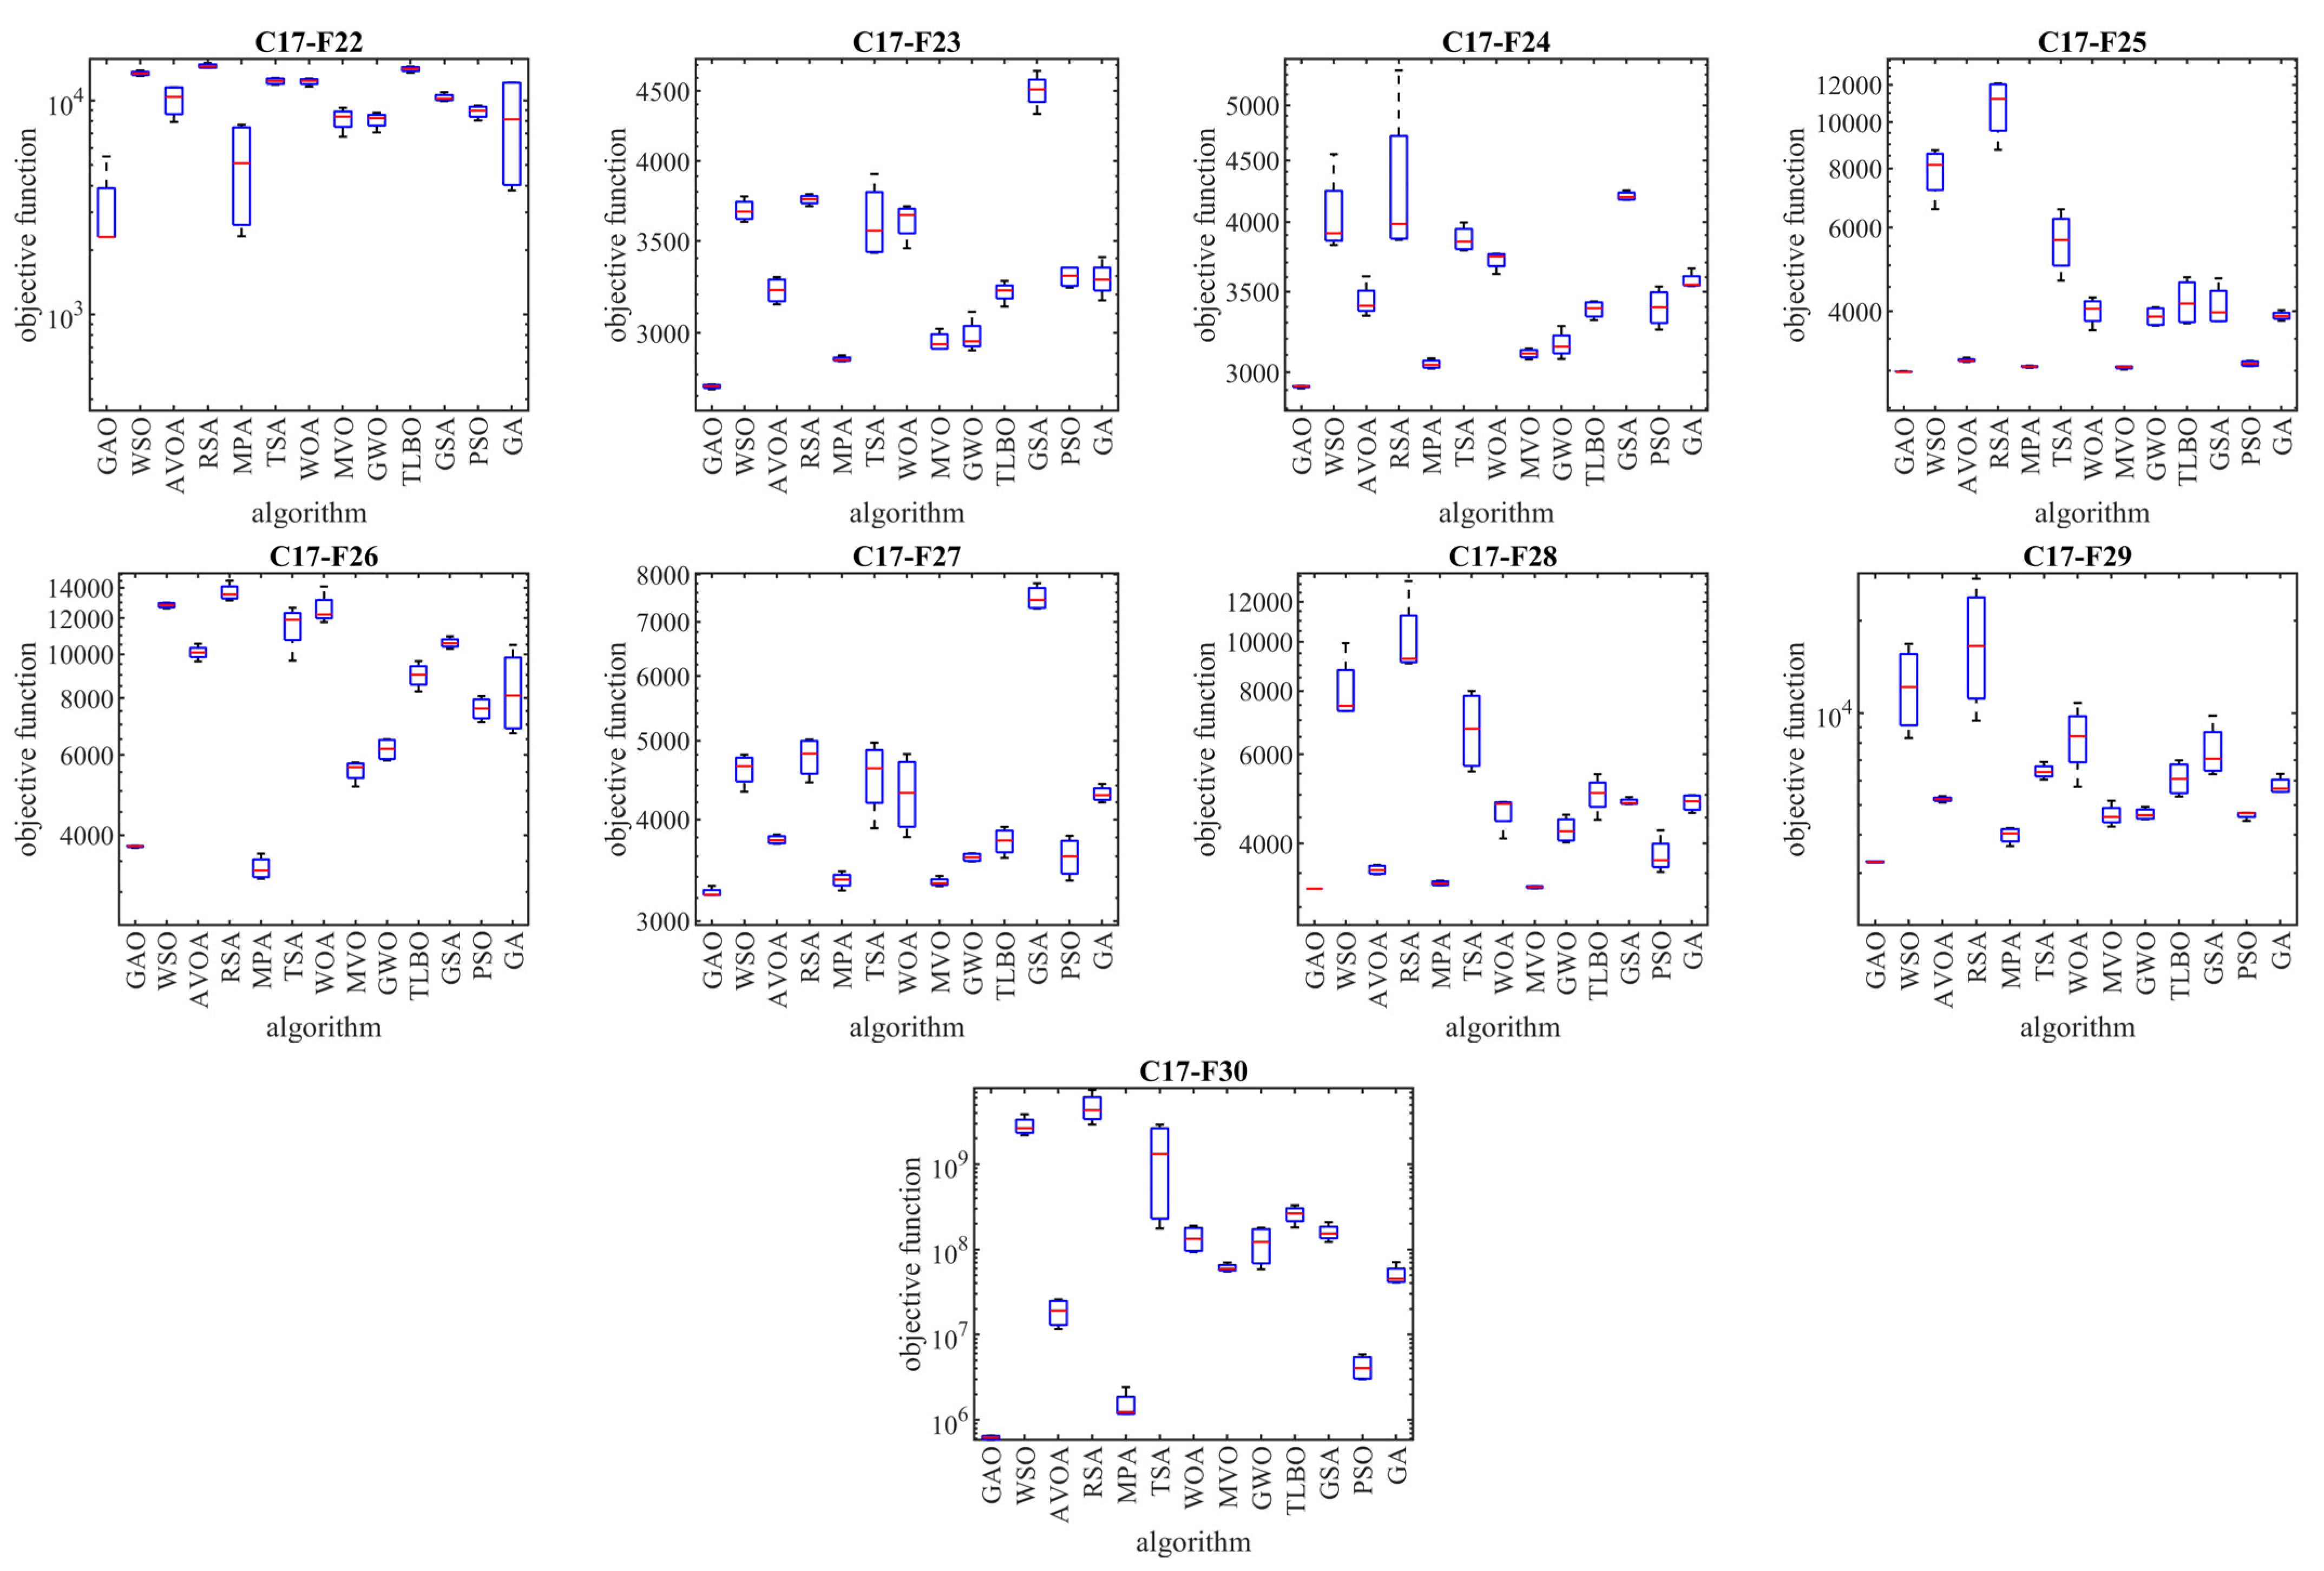
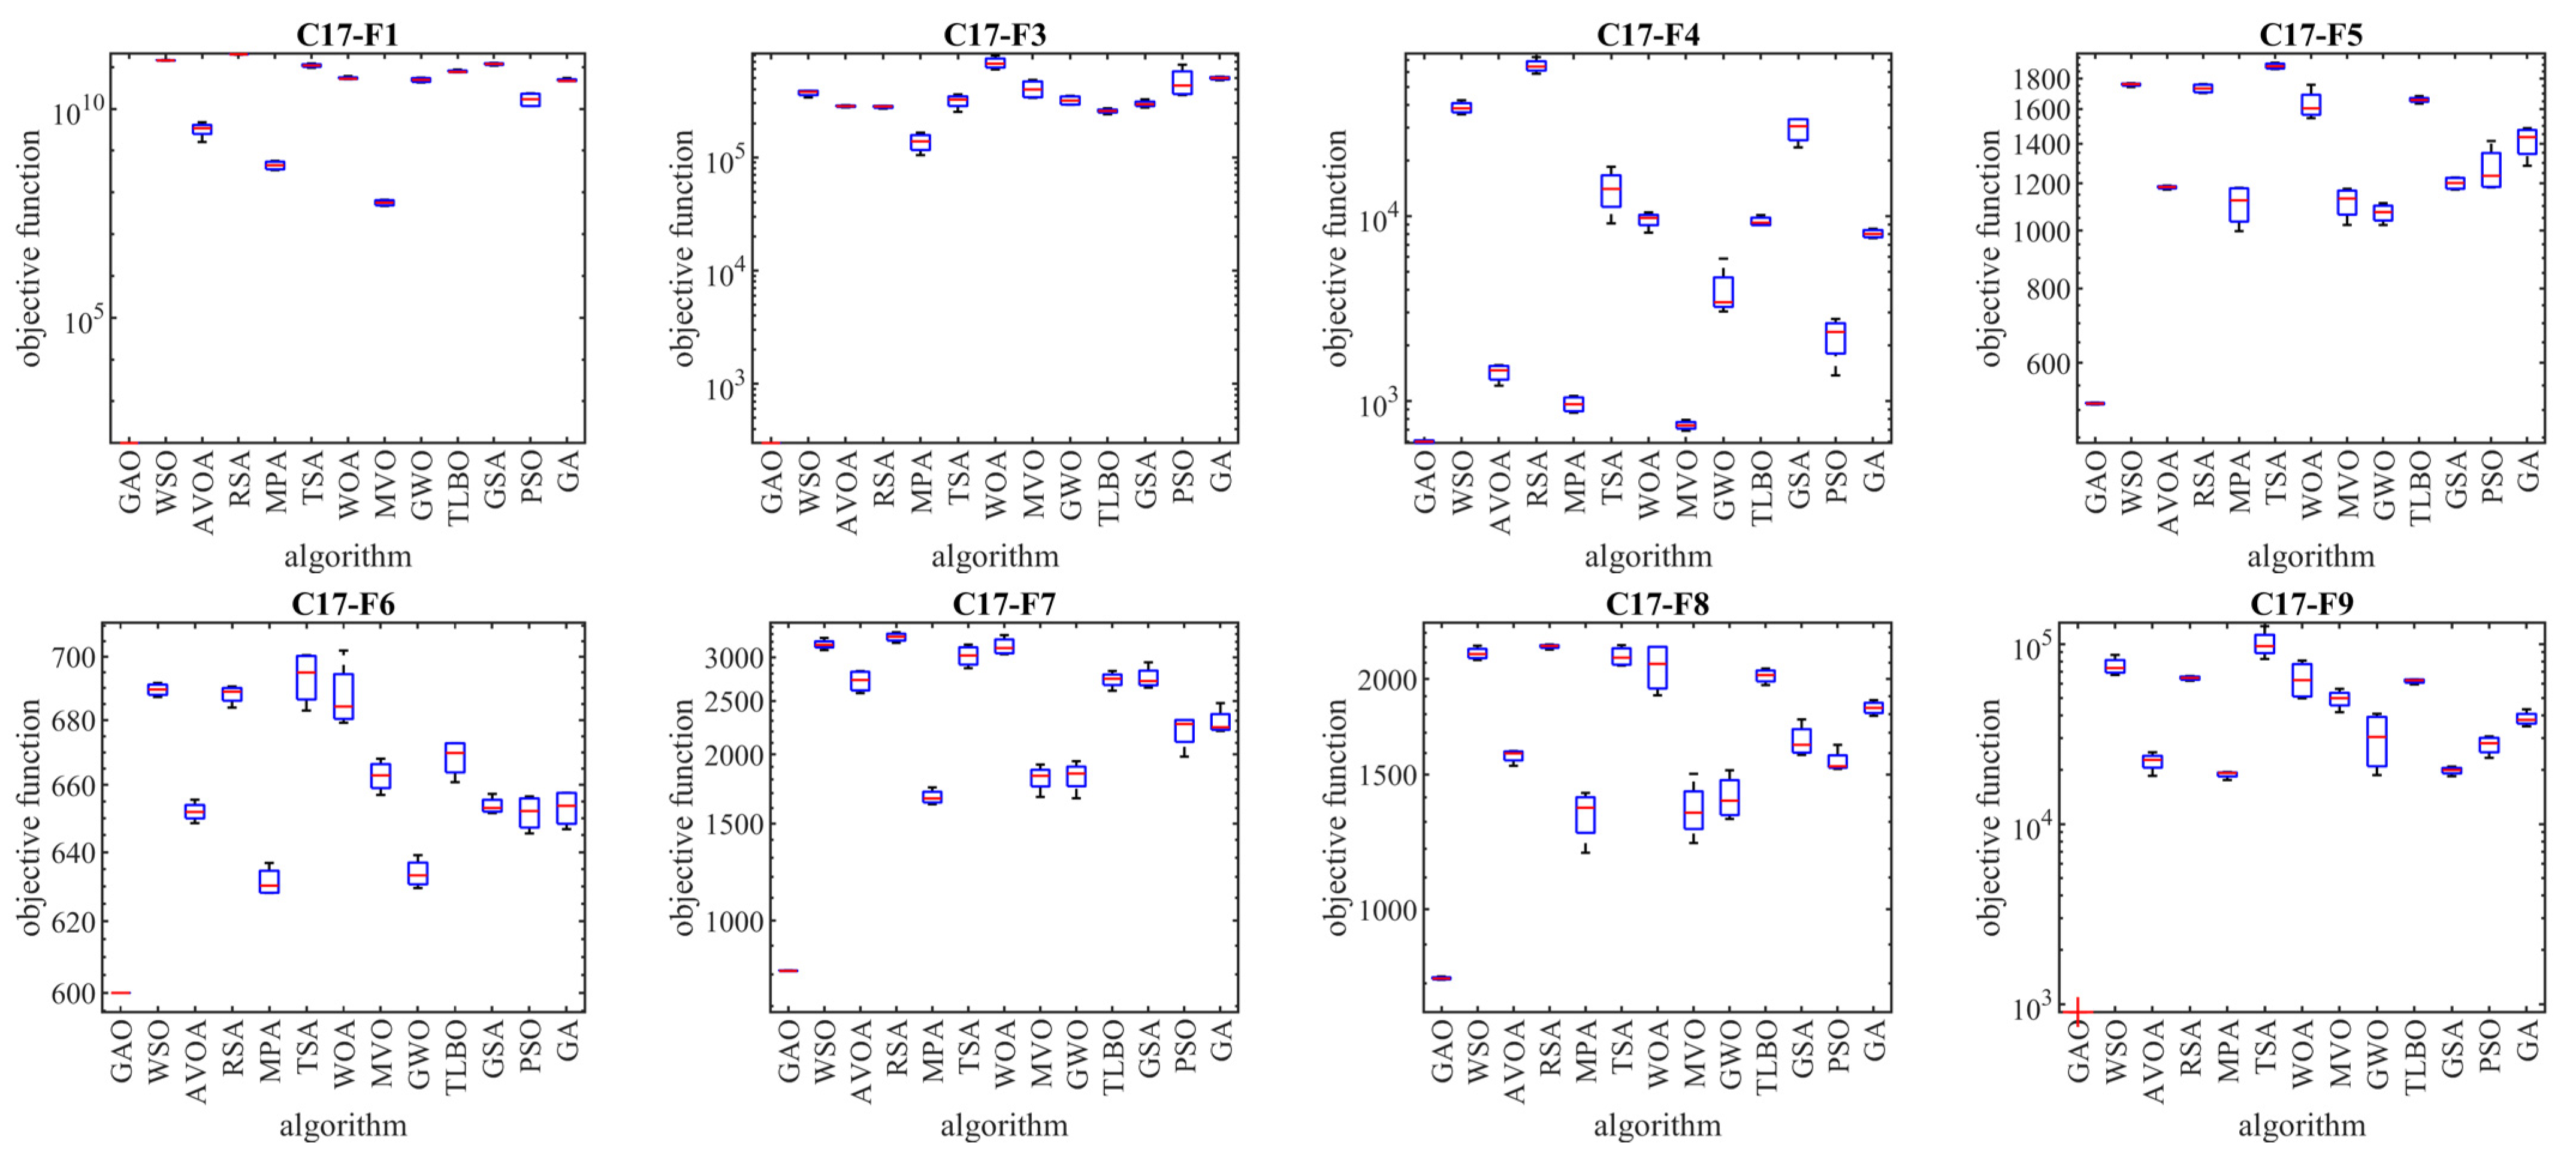
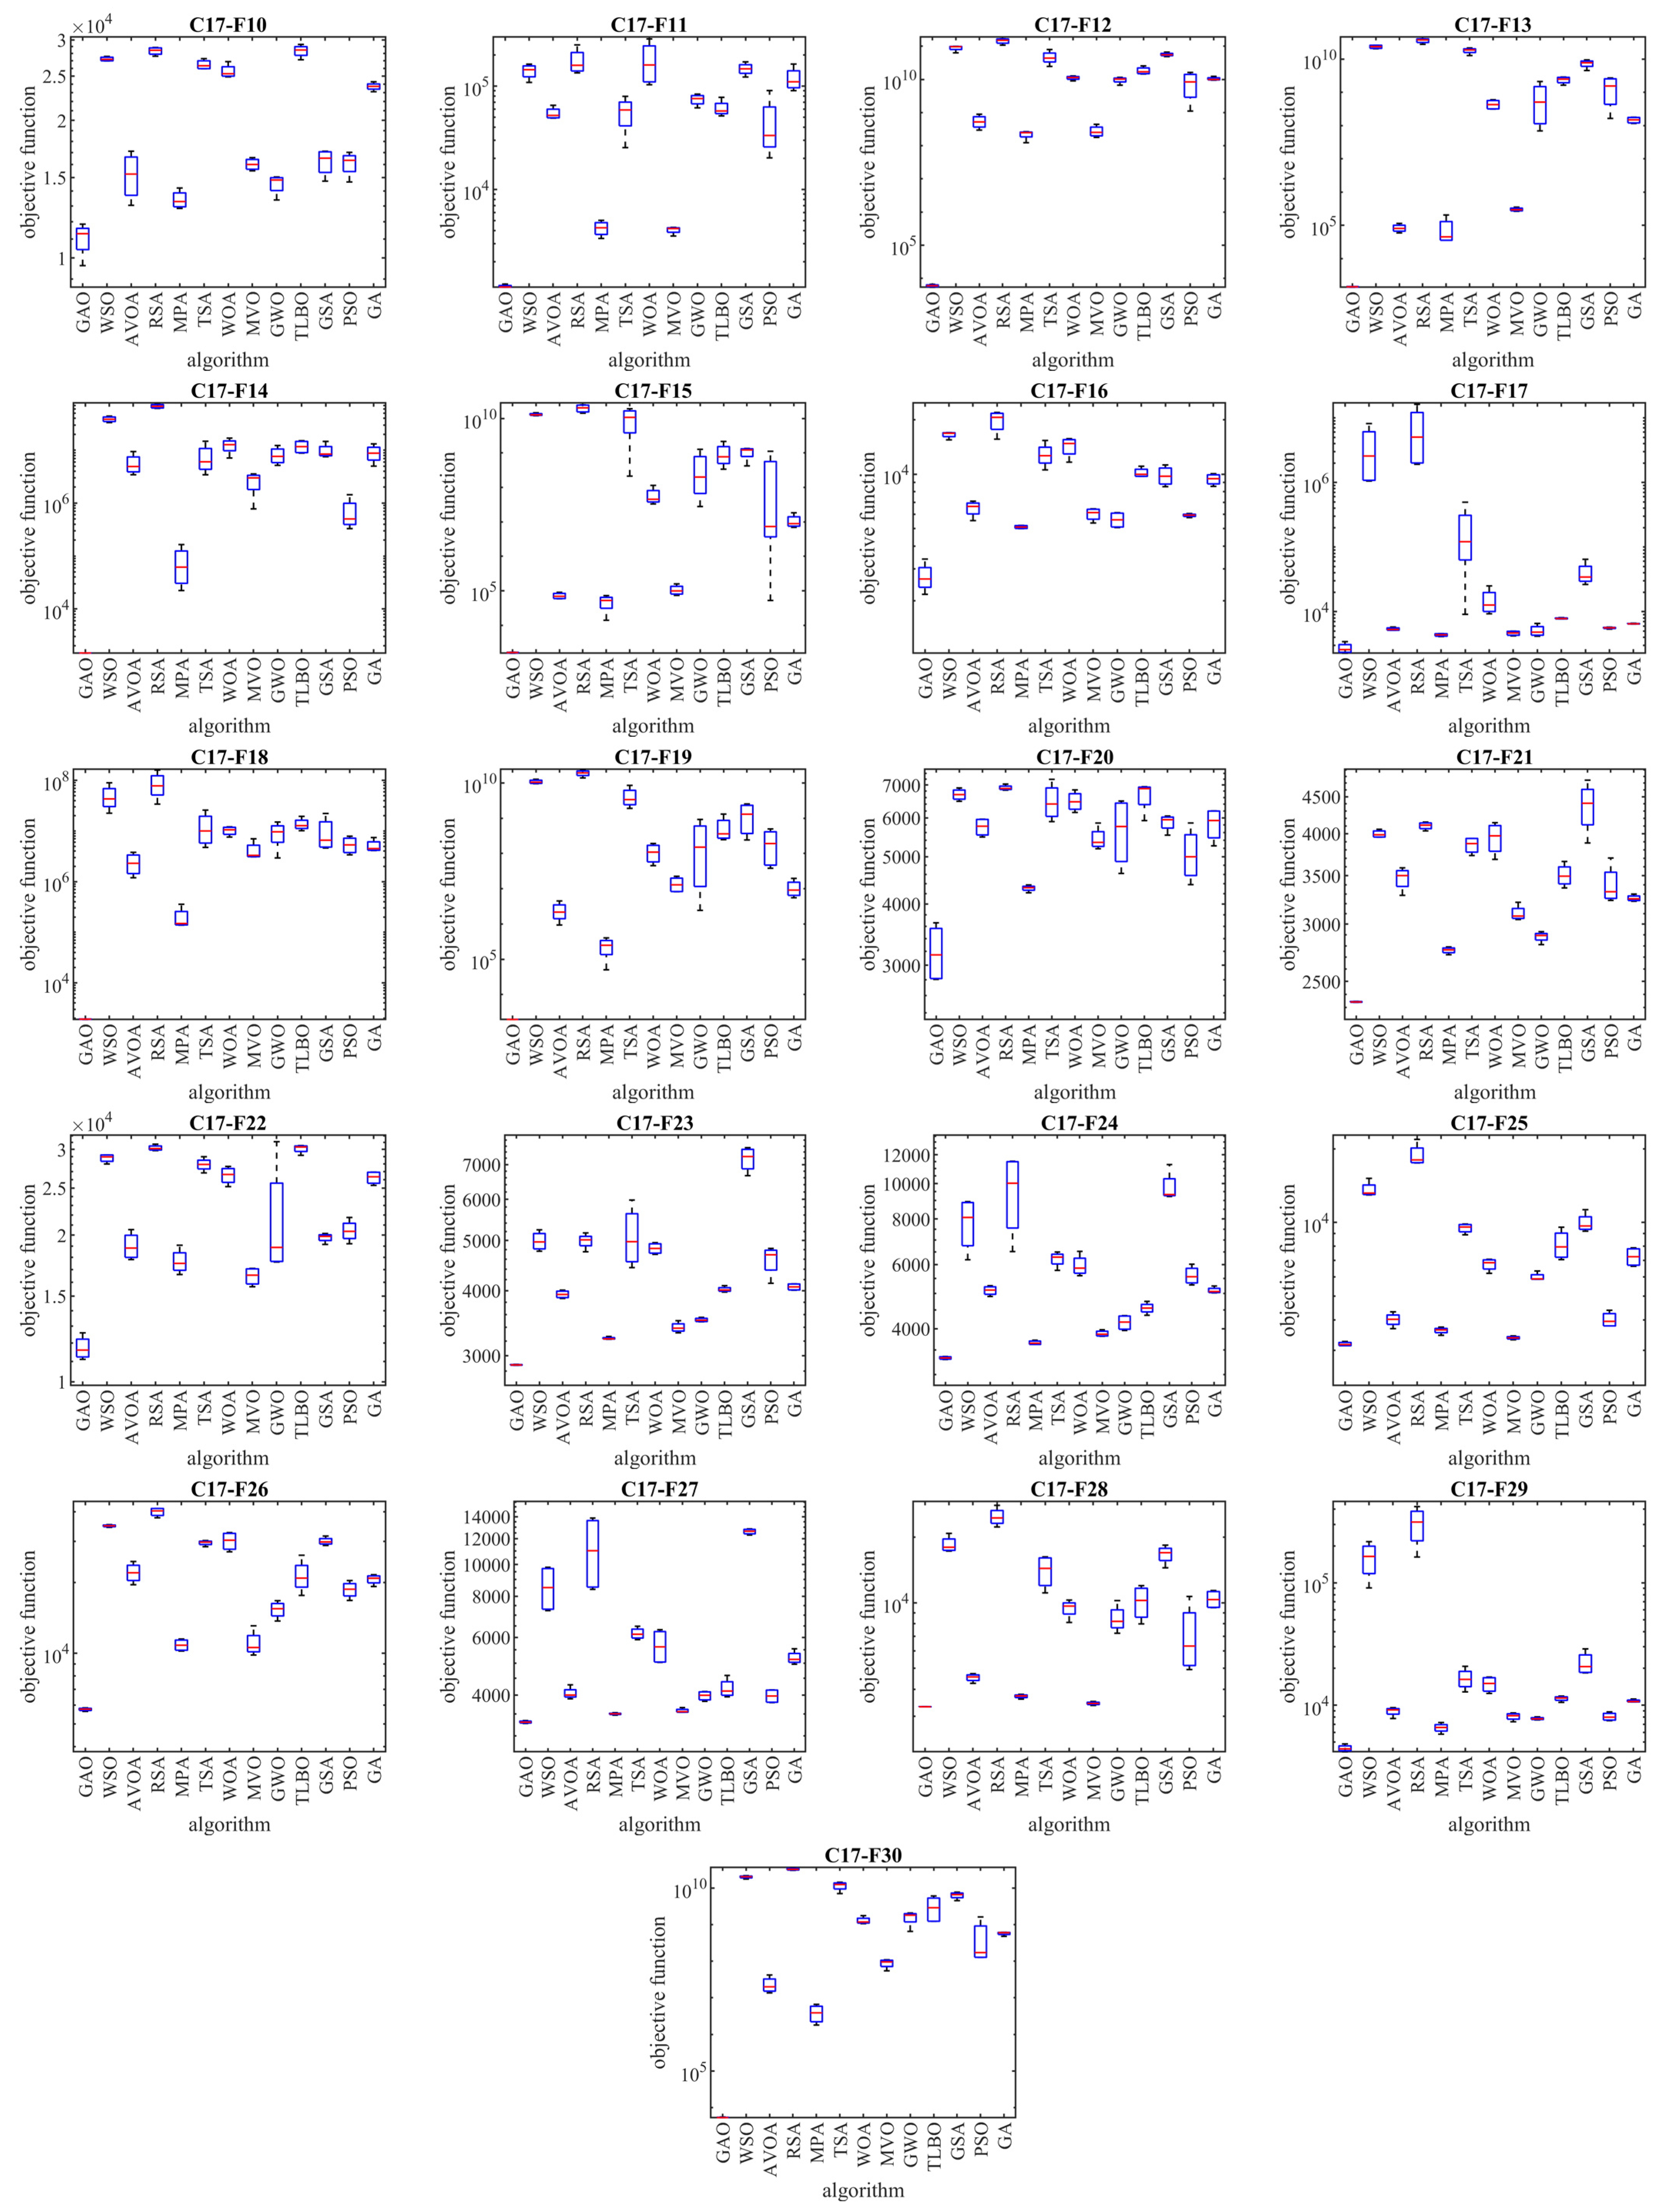
4.2. Evaluation of the CEC 2017 Test Suite
4.3. Statistical Analysis
5. GAO for Real-World Applications
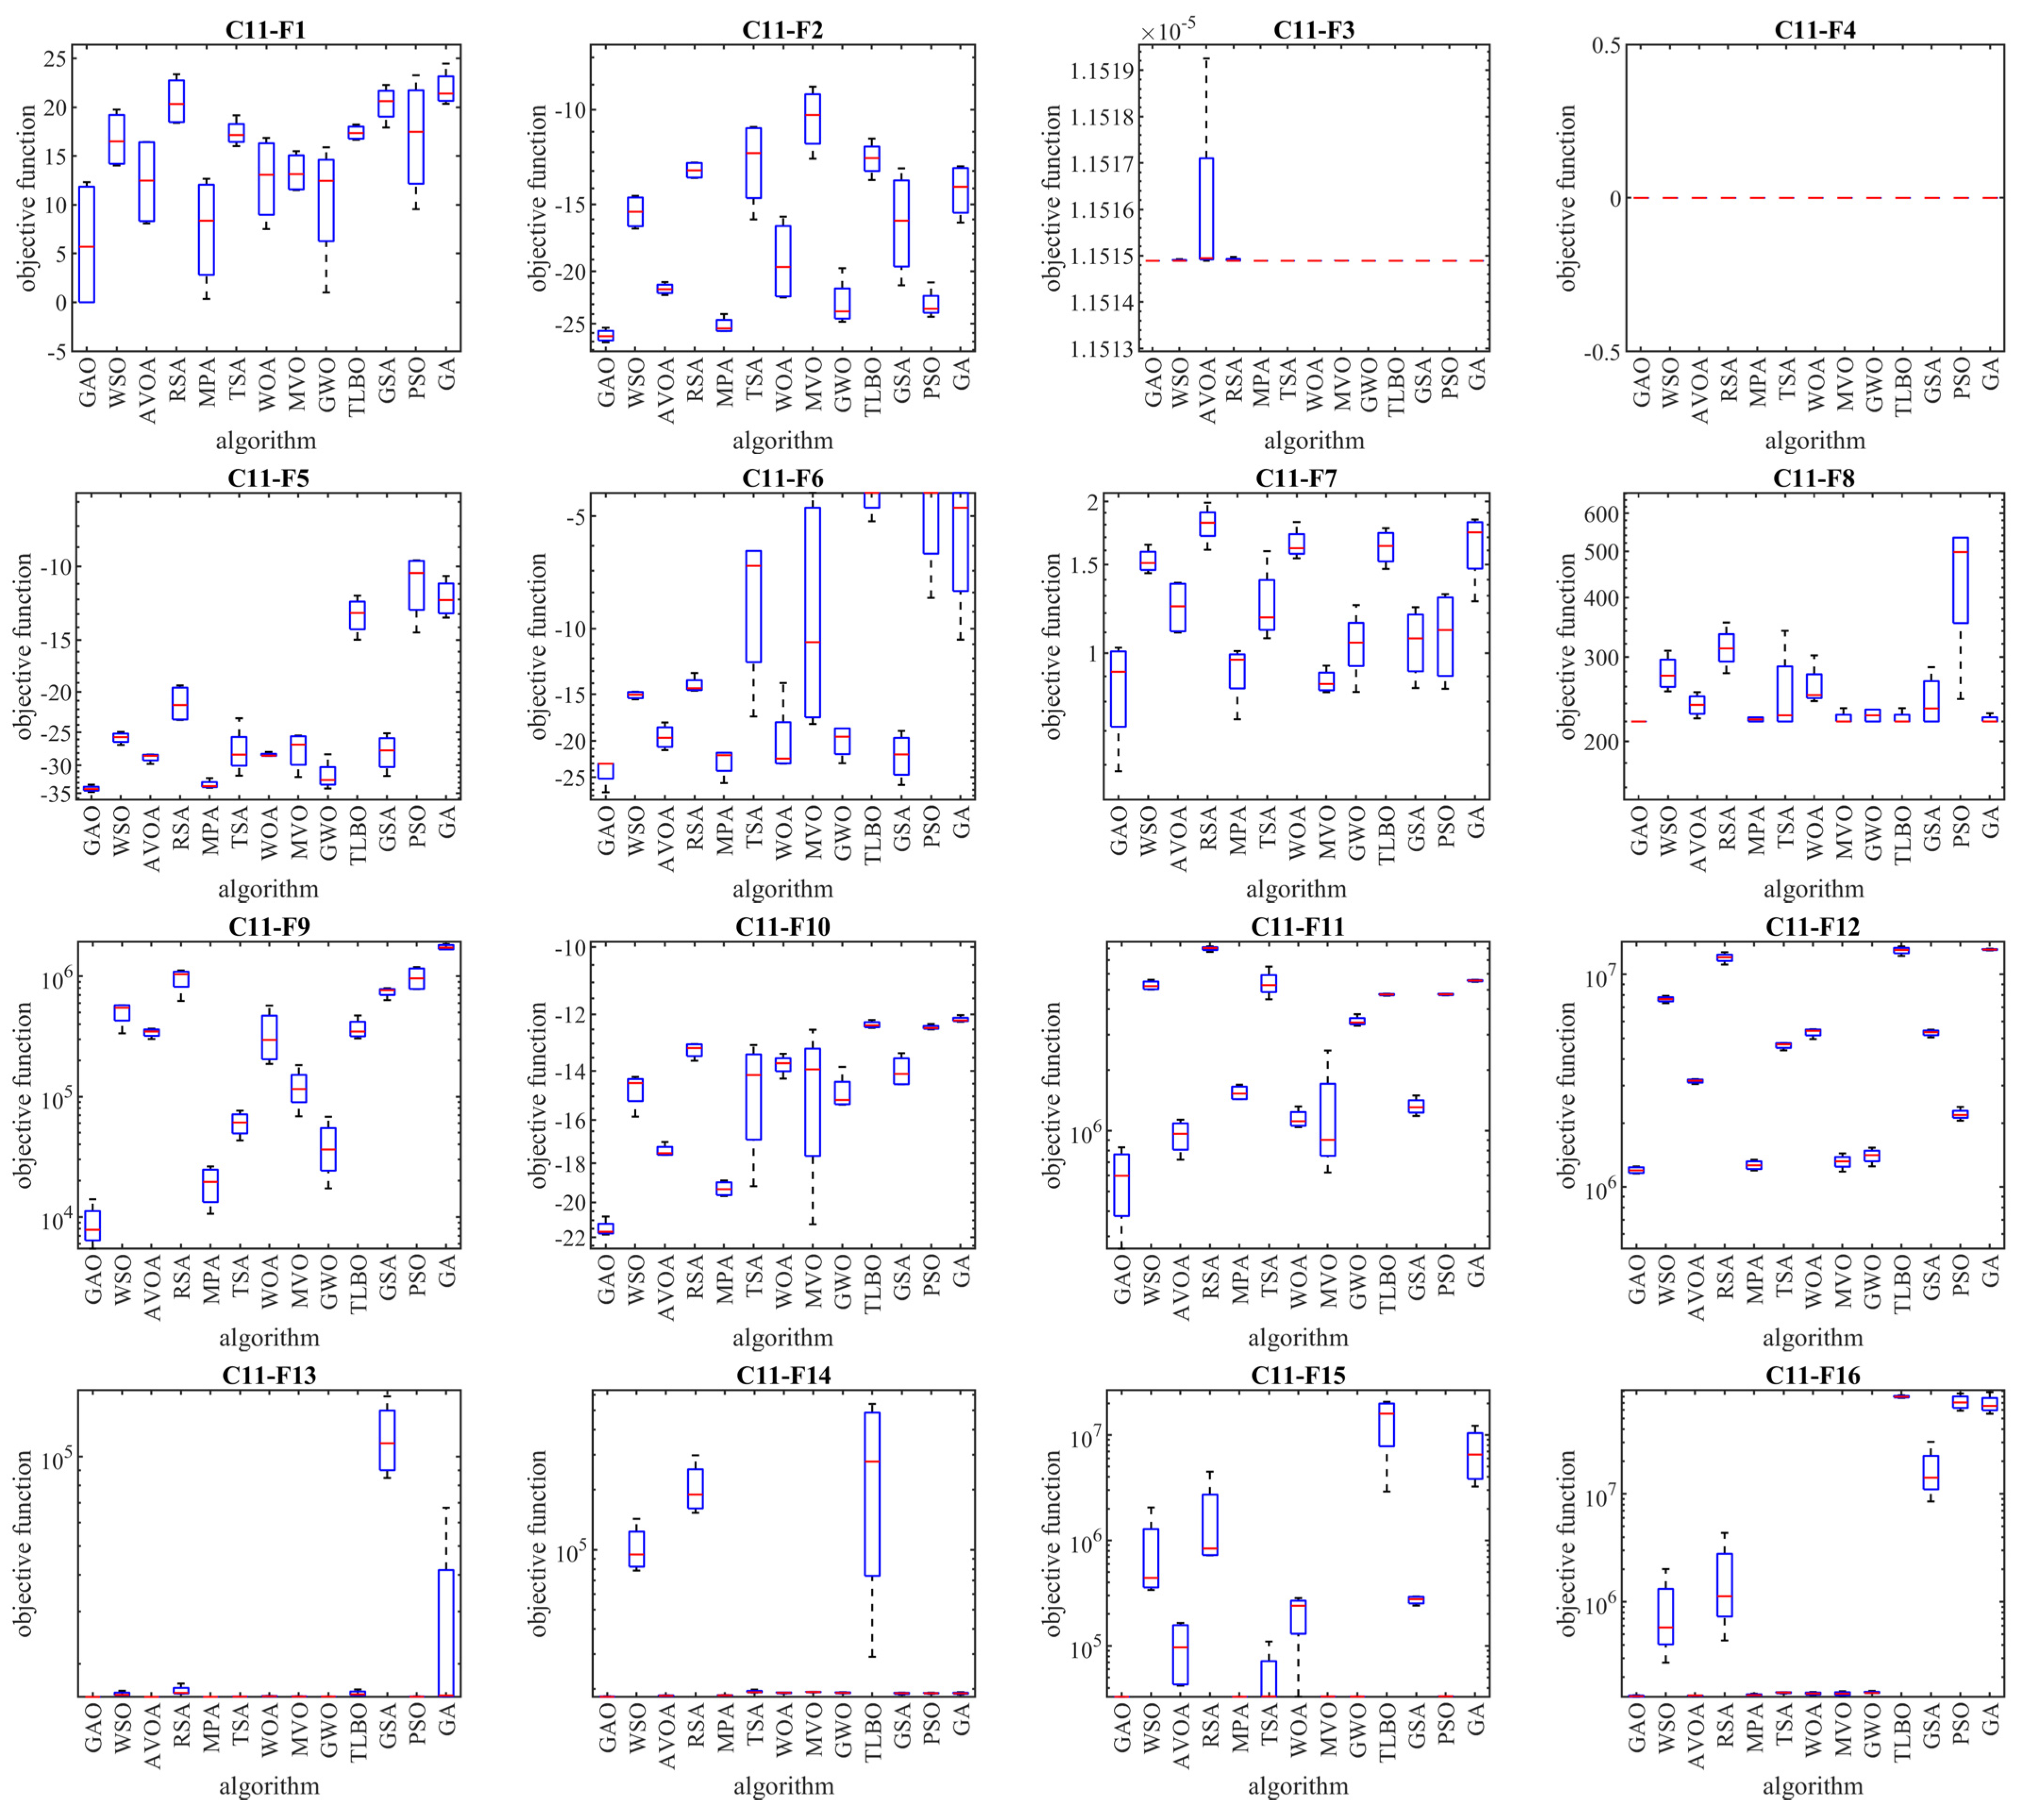
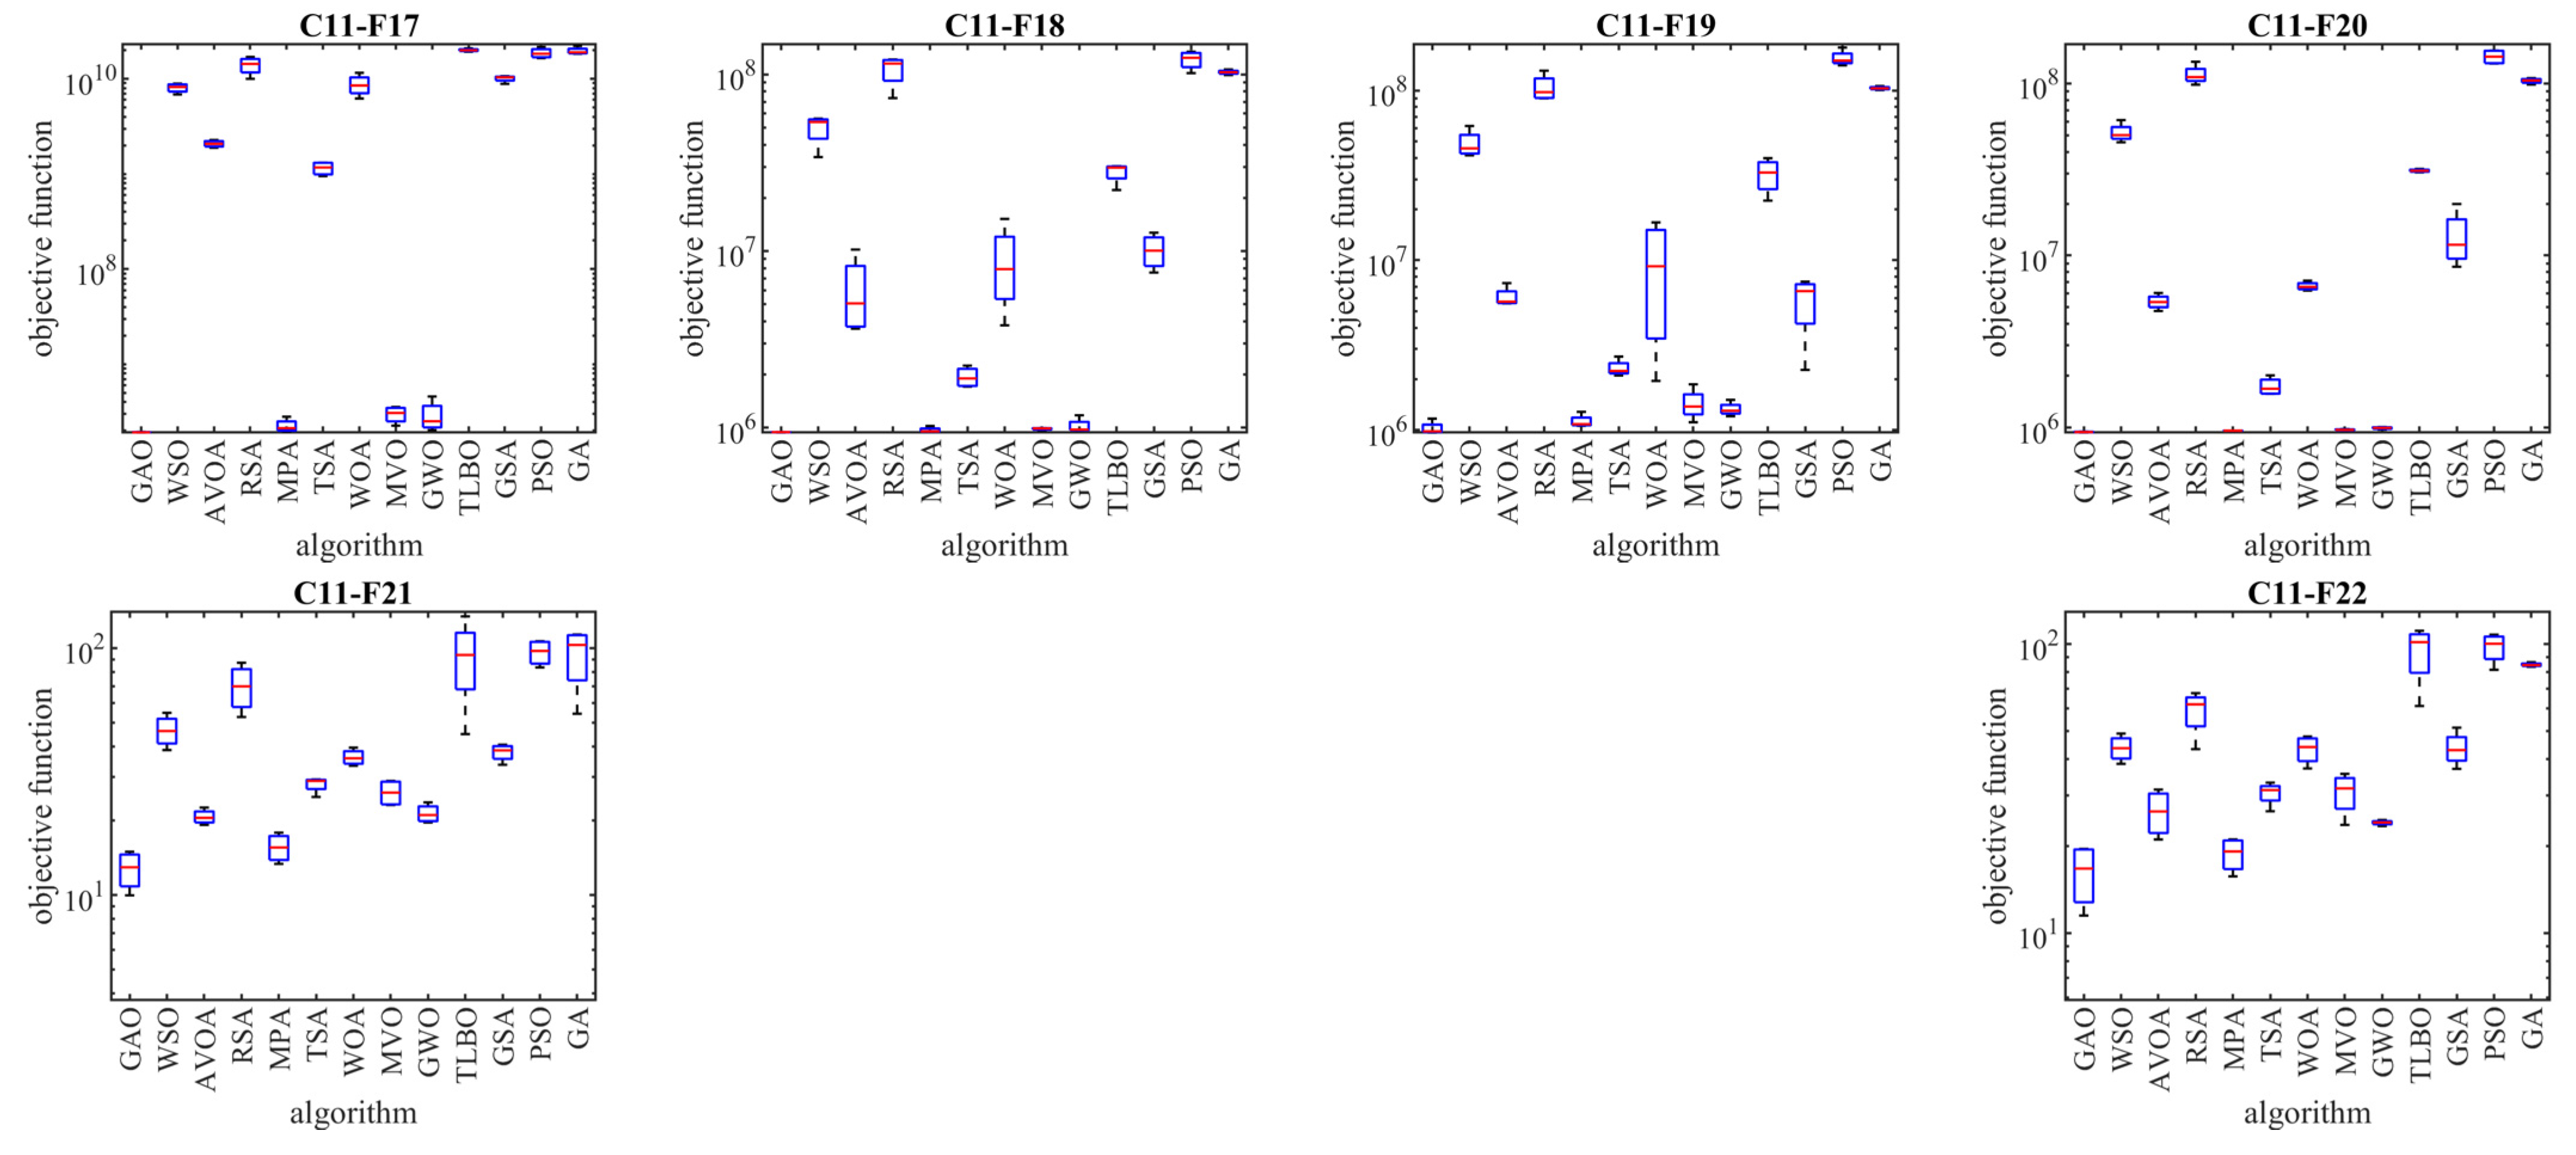
5.1. Evaluation of the CEC 2011 Test Suite
5.2. Pressure Vessel Design Problem
5.3. Speed Reducer Design Problem
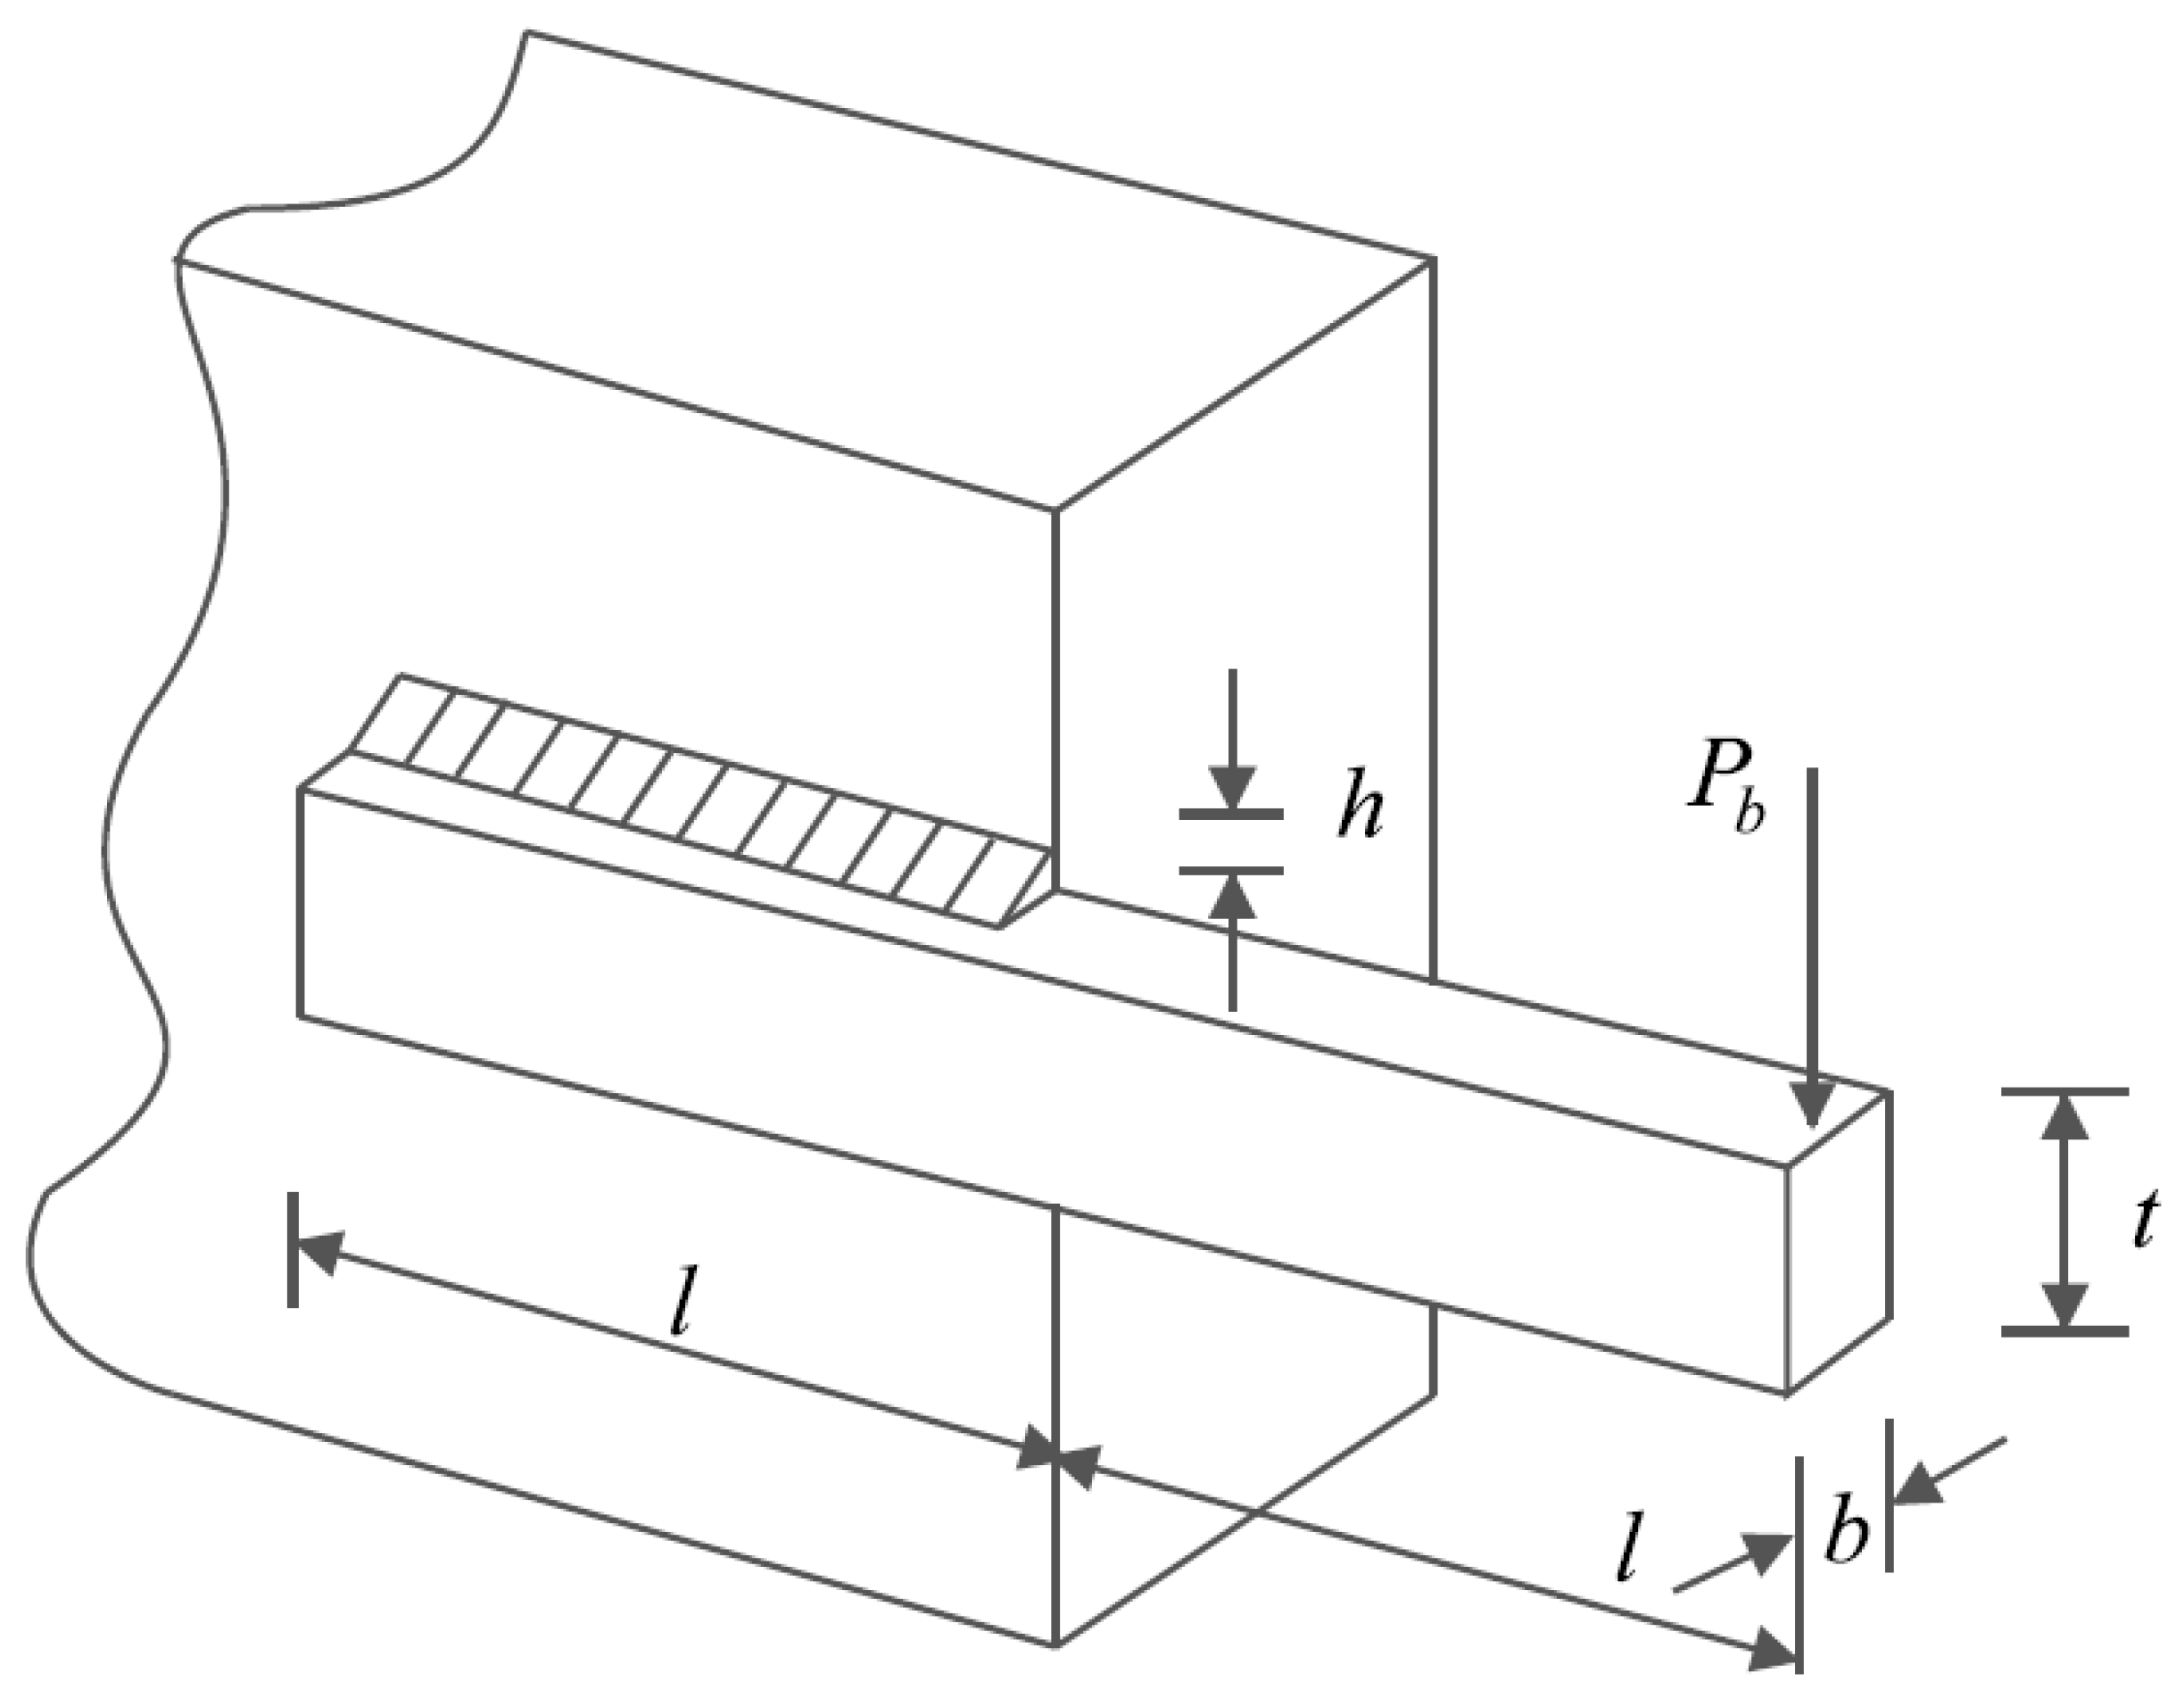
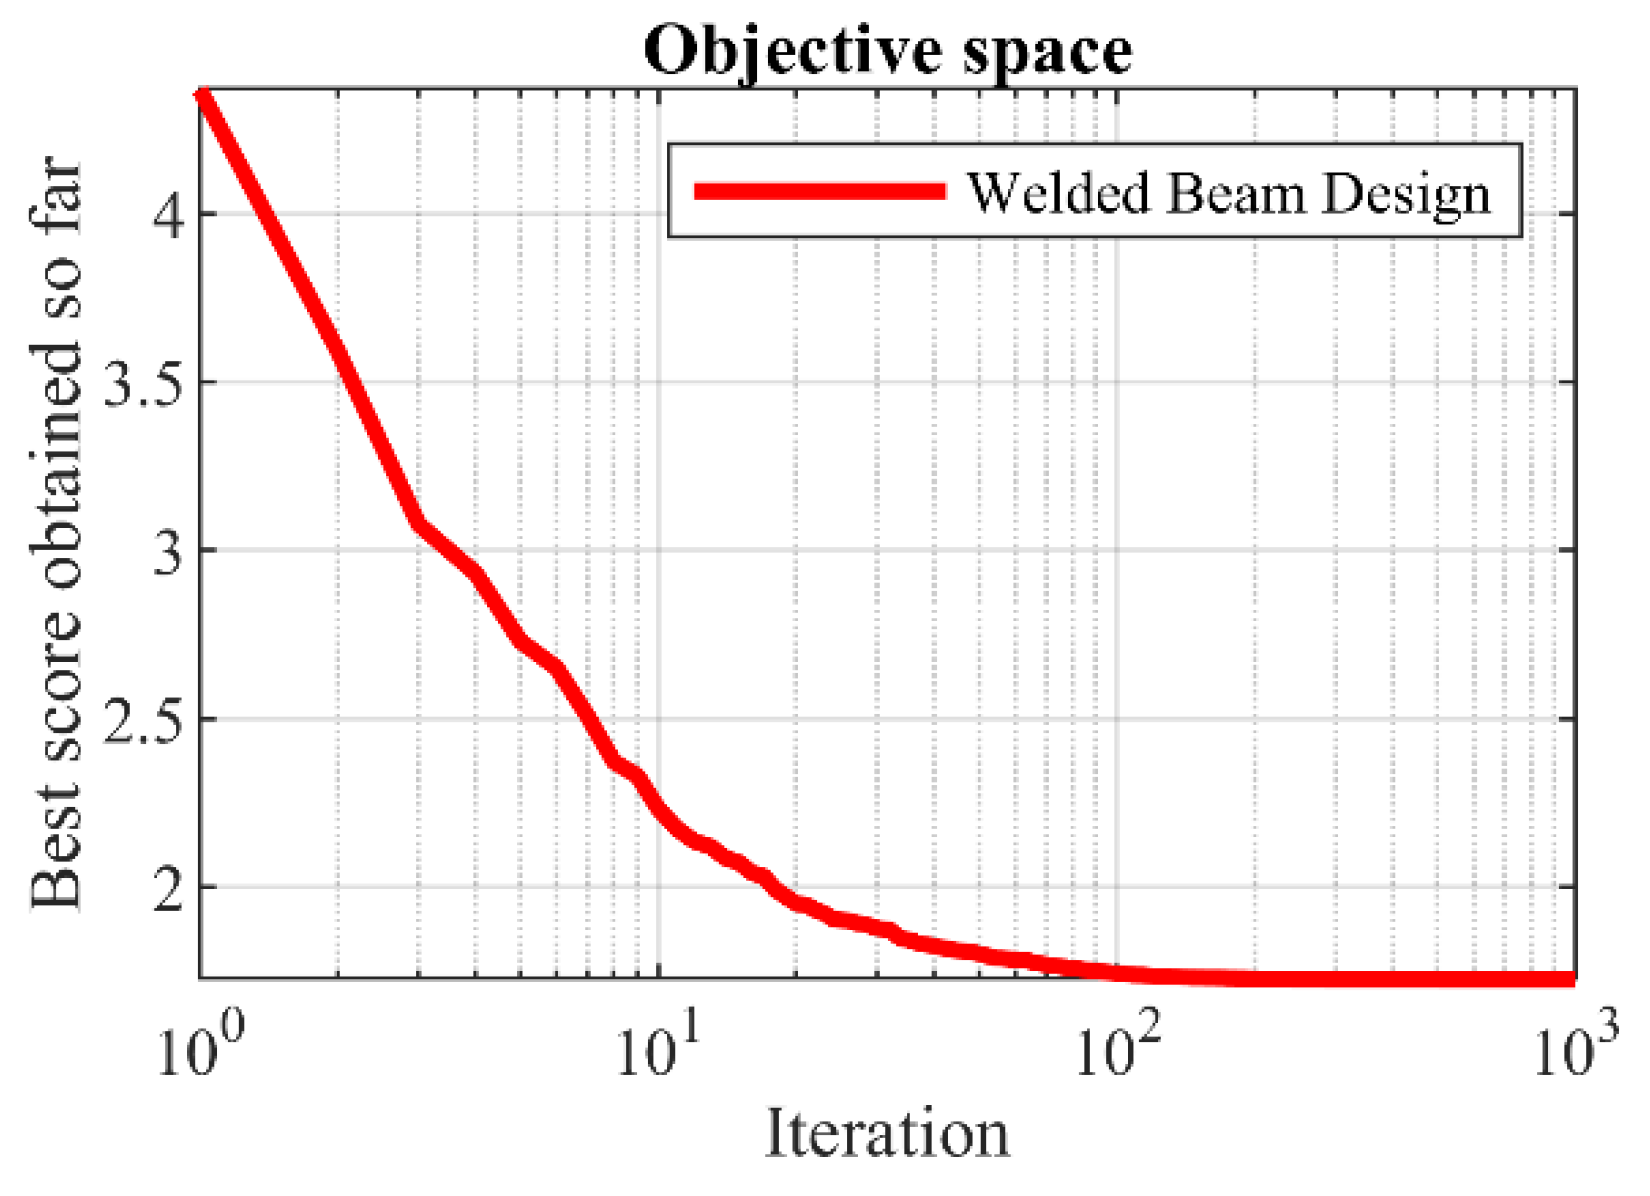
5.4. Welded Beam Design
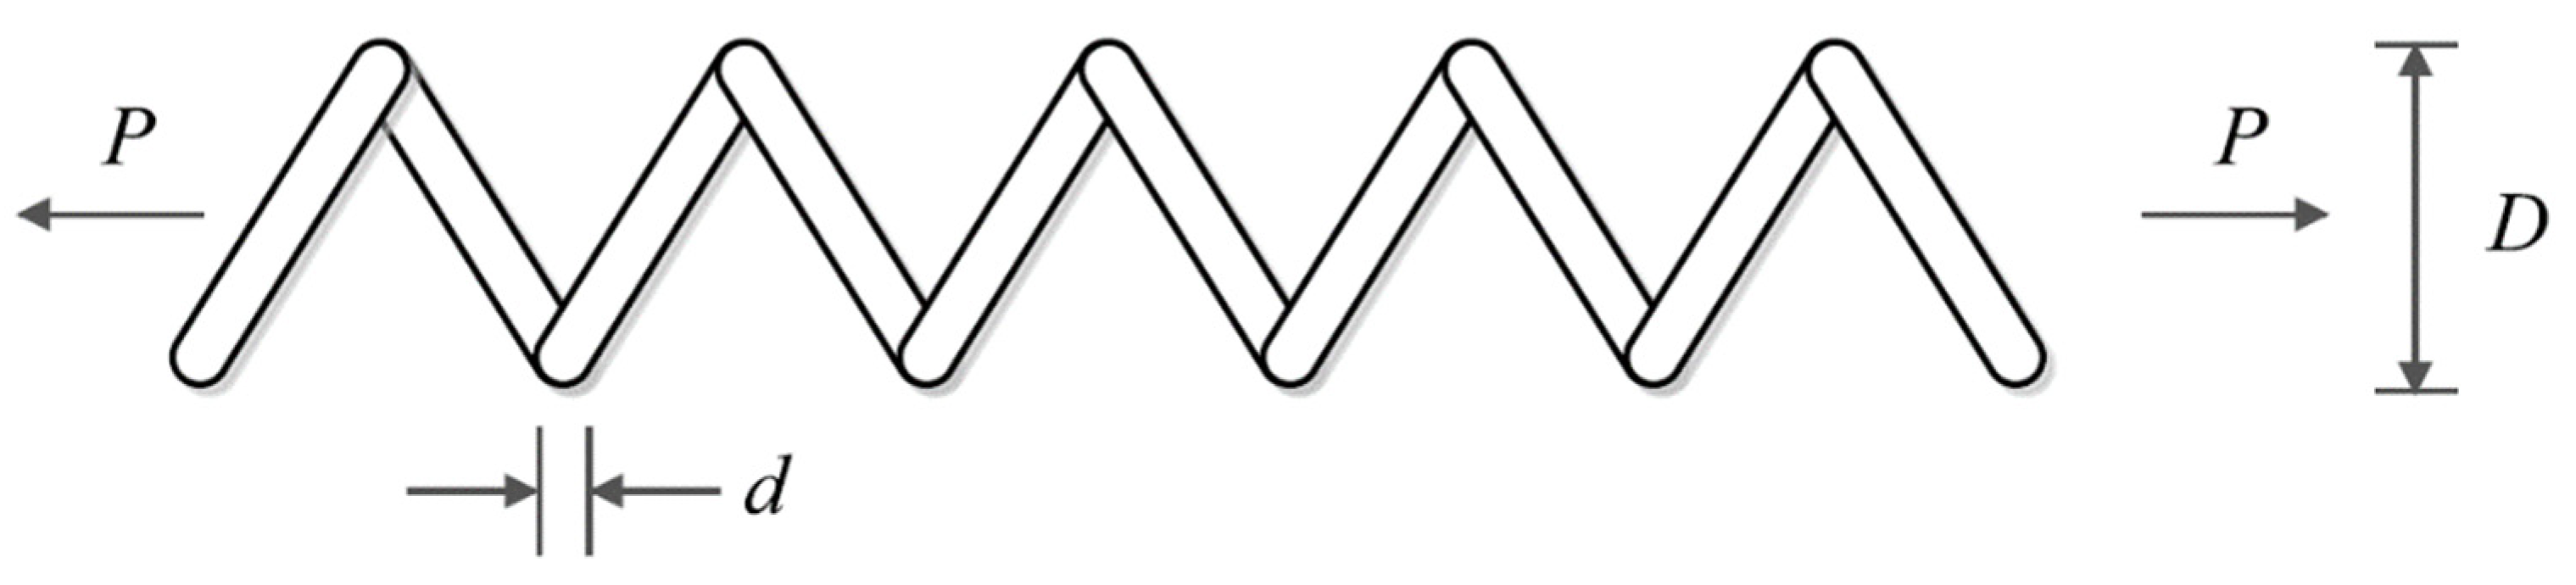
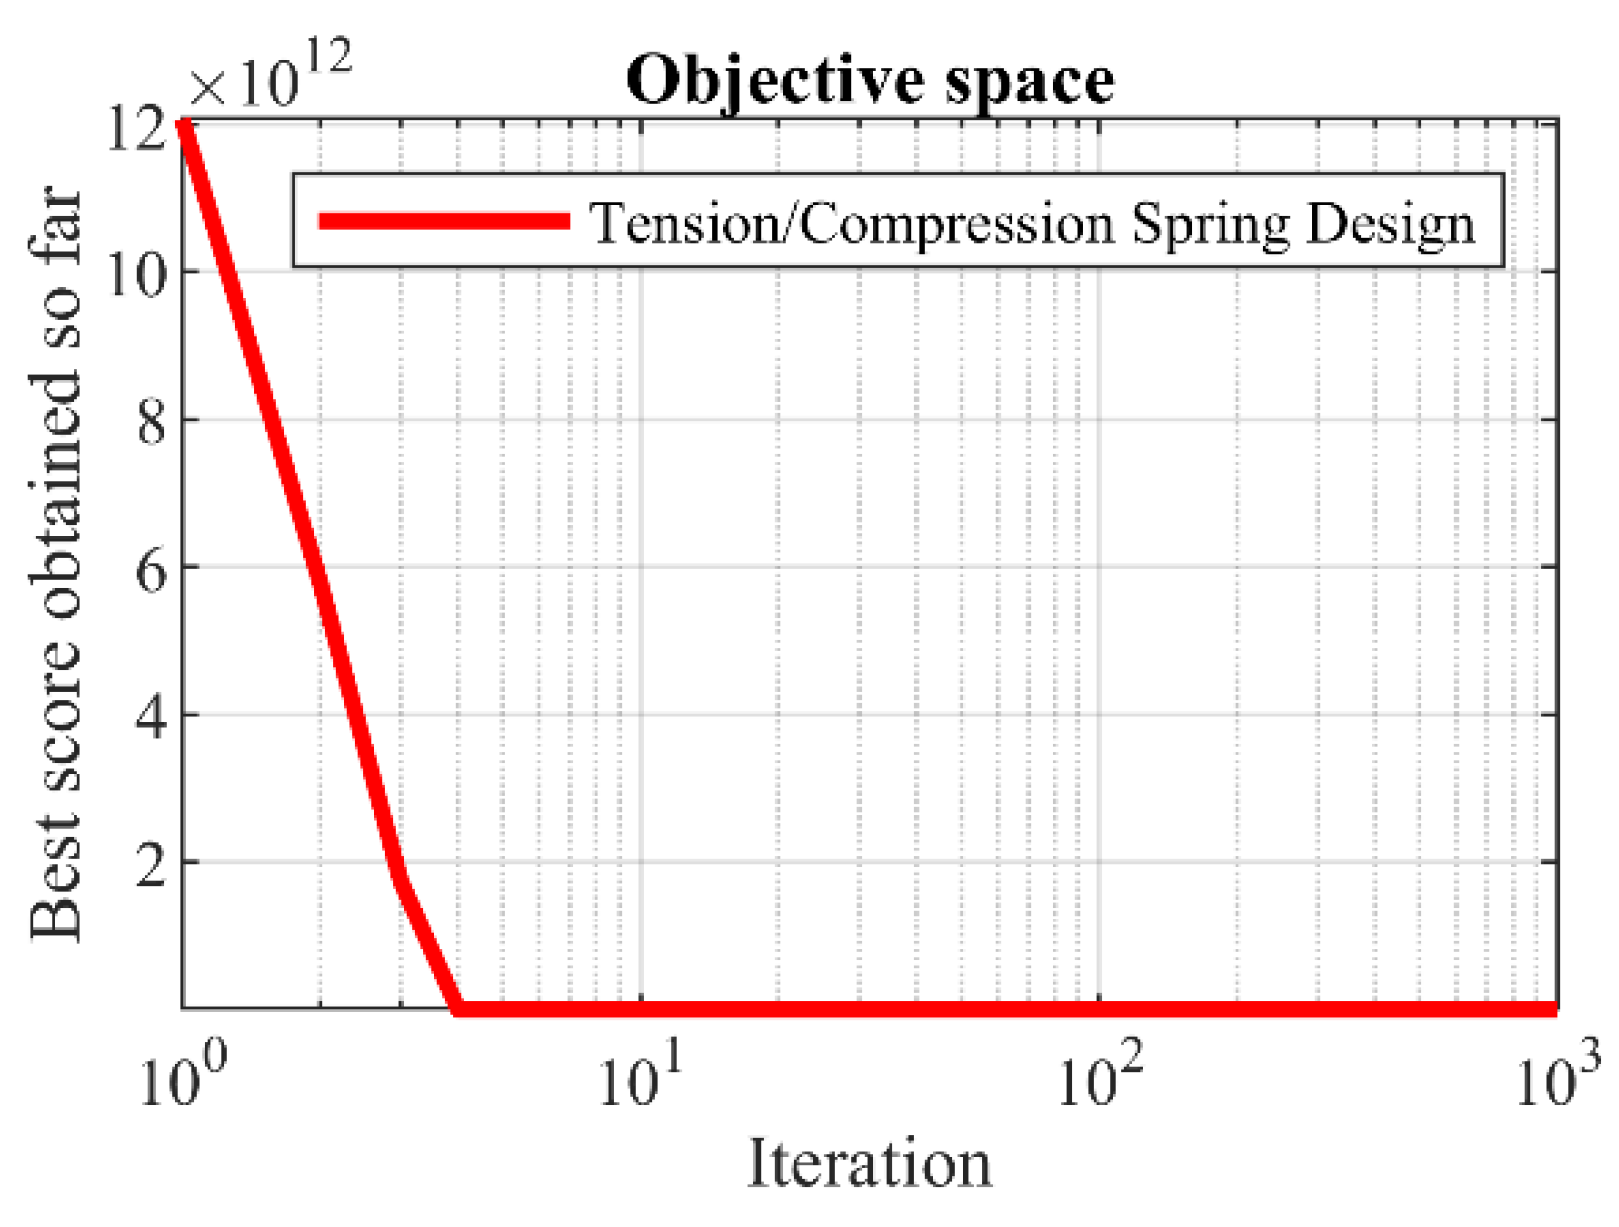
5.5. Tension/Compression Spring Design
6. Conclusions and Future Works
- Binary GAO. The real version of GAO is introduced and fully designed in this paper. However, many optimization problems in science, such as feature selection, should be optimized using binary versions of metaheuristic algorithms. According to this, designing the binary version of the proposed GAO approach (BGAO) is one of the special potentials of this study.
- Multi-objective GAO. From the point of view of the number of objective functions, optimization problems are divided into single-objective and multi-objective categories. In many optimization problems, several objective functions must be considered simultaneously in order to achieve a suitable solution. Therefore, developing the multi-objective version of the proposed GAO approach (MOGAO) in order to handle multi-objective optimization problems is another research potential of this paper.
- Hybrid GAO. Combining two or more metaheuristic algorithms in order to benefit from the advantages of each algorithm and create an effective hybrid approach has always been of interest to researchers. Considering this, developing hybrid versions of the proposed GAO approach is another research proposal for future work.
- Tackle new domains. GAO employment to address real-world applications and optimization problems in various sciences such as renewable energy, chemical engineering, robotics, and image processing are among other research proposals for further work.
Author Contributions
Funding
Institutional Review Board Statement
Data Availability Statement
Acknowledgments
Conflicts of Interest
Appendix A

| Algorithm | Parameter | Value |
|---|---|---|
| GA | ||
| Type | Real coded | |
| Selection | Roulette wheel (Proportionate) | |
| Crossover | Whole arithmetic (Probability = 0.8, α ∈ [−0.5, 1.5] | |
| Mutation | Gaussian (Probability = 0.05) | |
| PSO | ||
| Topology | Fully connected | |
| Cognitive and social constant | (C1, C2) = (2, 2) | |
| Inertia weight | Linear reduction from 0.9 to 0.1 | |
| Velocity limit | 10% of dimension range | |
| GSA | ||
| Alpha, G0, Rnorm, Rpower | 20, 100, 2, 1 | |
| TLBO | ||
| TF: teaching factor | TF = round [(1 + rand)] | |
| random number | rand is a random number between [0–1] | |
| GWO | ||
| Convergence parameter (a) | a: Linear reduction from 2 to 0. | |
| MVO | ||
| wormhole existence probability (WEP) | Min(WEP) = 0.2 and Max(WEP) = 1. | |
| Exploitation accuracy over the iterations (p) | p = 6. | |
| WOA | ||
| Convergence parameter (a) | a: Linear reduction from 2 to 0. | |
| r is a random vector in [0–1] | ||
| l is a random number in [−1, 1] | ||
| TSA | ||
| Pmin and Pmax | 1, 4 | |
| c1, c2, c3 | random numbers lie in the range of [0–1] | |
| MPA | ||
| Constant number | P = 0.5 | |
| Random vector | R is a vector of uniform random numbers in [0, 1] | |
| Fish Aggregating Devices (FADs) | FADs = 0.2 | |
| Binary vector | U = 0 or 1 | |
| RSA | ||
| Sensitive parameter | β = 0.01 | |
| Sensitive parameter | α = 0.1 | |
| Evolutionary Sense (ES) | ES: randomly decreasing values between 2 and −2 | |
| AVOA | ||
| L1, L2 | 0.8, 0.2 | |
| w | 2.5 | |
| P1, P2, P3 | 0.6, 0.4, 0.6 | |
| WSO | ||
| Fmin and Fmax | 0.07, 0.75 | |
| τ, ao, a1, a2 | 4.125, 6.25, 100, 0.0005 |
References
- Zhao, S.; Zhang, T.; Ma, S.; Chen, M. Dandelion Optimizer: A nature-inspired metaheuristic algorithm for engineering applications. Eng. Appl. Artif. Intell. 2022, 114, 105075. [Google Scholar] [CrossRef]
- Sergeyev, Y.D.; Kvasov, D.; Mukhametzhanov, M. On the efficiency of nature-inspired metaheuristics in expensive global optimization with limited budget. Sci. Rep. 2018, 8, 1–9. [Google Scholar] [CrossRef] [PubMed]
- Liberti, L.; Kucherenko, S. Comparison of deterministic and stochastic approaches to global optimization. Int. Trans. Oper. Res. 2005, 12, 263–285. [Google Scholar] [CrossRef]
- Alshanti, W.G.; Batiha, I.M.; Hammad, M.M.A.; Khalil, R. A novel analytical approach for solving partial differential equations via a tensor product theory of Banach spaces. Partial Differ. Equ. Appl. Math. 2023, 8, 100531. [Google Scholar] [CrossRef]
- Dehghani, M.; Trojovská, E.; Trojovský, P. A new human-based metaheuristic algorithm for solving optimization problems on the base of simulation of driving training process. Sci. Rep. 2022, 12, 9924. [Google Scholar] [CrossRef] [PubMed]
- Zeidabadi, F.-A.; Dehghani, M.; Trojovský, P.; Hubálovský, Š.; Leiva, V.; Dhiman, G. Archery Algorithm: A Novel Stochastic Optimization Algorithm for Solving Optimization Problems. Comput. Mater. Contin. 2022, 72, 399–416. [Google Scholar] [CrossRef]
- de Armas, J.; Lalla-Ruiz, E.; Tilahun, S.L.; Voß, S. Similarity in metaheuristics: A gentle step towards a comparison methodology. Nat. Comput. 2022, 21, 265–287. [Google Scholar] [CrossRef]
- Dehghani, M.; Montazeri, Z.; Dehghani, A.; Malik, O.P.; Morales-Menendez, R.; Dhiman, G.; Nouri, N.; Ehsanifar, A.; Guerrero, J.M.; Ramirez-Mendoza, R.A. Binary spring search algorithm for solving various optimization problems. Appl. Sci. 2021, 11, 1286. [Google Scholar] [CrossRef]
- Jakšić, Z.; Devi, S.; Jakšić, O.; Guha, K. A Comprehensive Review of Bio-Inspired Optimization Algorithms Including Applications in Microelectronics and Nanophotonics. Biomimetics 2023, 8, 278. [Google Scholar] [CrossRef]
- Gölcük, İ.; Ozsoydan, F.B. Q-learning and hyper-heuristic based algorithm recommendation for changing environments. Eng. Appl. Artif. Intell. 2021, 102, 104284. [Google Scholar] [CrossRef]
- Huang, Z.; Zhang, H.; Wang, D.; Yu, H.; Wang, L.; Yu, D.; Peng, Y. Preference-based multi-attribute decision-making method with spherical-Z fuzzy sets for green product design. Eng. Appl. Artif. Intell. 2023, 126, 106767. [Google Scholar] [CrossRef]
- Gharehchopogh, F.S.; Maleki, I.; Dizaji, Z.A. Chaotic vortex search algorithm: Metaheuristic algorithm for feature selection. Evol. Intell. 2022, 15, 1777–1808. [Google Scholar] [CrossRef]
- Zhang, H.; Huang, Z.; Tian, G.; Wang, W.; Li, Z. A Hybrid QFD-Based Human-Centric Decision Making Approach of Disassembly Schemes Under Interval 2-Tuple q-Rung Orthopair Fuzzy Sets. IEEE Trans. Autom. Sci. Eng. 2023, 1–12. [Google Scholar] [CrossRef]
- Dinkar, S.K.; Deep, K.; Mirjalili, S.; Thapliyal, S. Opposition-based Laplacian Equilibrium Optimizer with application in Image Segmentation using Multilevel Thresholding. Expert Syst. Appl. 2021, 174, 114766. [Google Scholar] [CrossRef]
- Mohar, S.S.; Goyal, S.; Kaur, R. Localization of sensor nodes in wireless sensor networks using bat optimization algorithm with enhanced exploration and exploitation characteristics. J. Supercomput. 2022, 78, 11975–12023. [Google Scholar] [CrossRef] [PubMed]
- Trojovská, E.; Dehghani, M.; Trojovský, P. Zebra Optimization Algorithm: A New Bio-Inspired Optimization Algorithm for Solving Optimization Algorithm. IEEE Access 2022, 10, 49445–49473. [Google Scholar] [CrossRef]
- Wolpert, D.H.; Macready, W.G. No free lunch theorems for optimization. IEEE Trans. Evol. Comput. 1997, 1, 67–82. [Google Scholar] [CrossRef]
- Kennedy, J.; Eberhart, R. Particle swarm optimization. In Proceedings of the ICNN’95—International Conference on Neural Networks, Perth, WA, Australia, 27 November–1 December 1995; IEEE: Perth, WA, Australia, 1995; Volume 4, pp. 1942–1948. [Google Scholar]
- Dorigo, M.; Maniezzo, V.; Colorni, A. Ant system: Optimization by a colony of cooperating agents. IEEE Trans. Syst. Man Cybern. Part B (Cybern.) 1996, 26, 29–41. [Google Scholar] [CrossRef]
- Karaboga, D.; Basturk, B. Artificial bee colony (ABC) optimization algorithm for solving constrained optimization problems. In Proceedings of the International Fuzzy Systems Association World Congress, Cancun, Mexico, 18–21 June 2007; Springer: Berlin/Heidelberg, Germany, 2007; pp. 789–798. [Google Scholar]
- Yang, X.-S. Firefly algorithm, stochastic test functions and design optimisation. Int. J. Bio-Inspired Comput. 2010, 2, 78–84. [Google Scholar] [CrossRef]
- Mirjalili, S.; Mirjalili, S.M.; Lewis, A. Grey Wolf Optimizer. Adv. Eng. Softw. 2014, 69, 46–61. [Google Scholar] [CrossRef]
- Dehghani, M.; Trojovský, P.; Malik, O.P. Green Anaconda Optimization: A New Bio-Inspired Metaheuristic Algorithm for Solving Optimization Problems. Biomimetics 2023, 8, 121. [Google Scholar] [CrossRef]
- Hashim, F.A.; Houssein, E.H.; Hussain, K.; Mabrouk, M.S.; Al-Atabany, W. Honey Badger Algorithm: New metaheuristic algorithm for solving optimization problems. Math. Comput. Simul. 2022, 192, 84–110. [Google Scholar] [CrossRef]
- Mirjalili, S.; Lewis, A. The whale optimization algorithm. Adv. Eng. Softw. 2016, 95, 51–67. [Google Scholar] [CrossRef]
- Jiang, Y.; Wu, Q.; Zhu, S.; Zhang, L. Orca predation algorithm: A novel bio-inspired algorithm for global optimization problems. Expert Syst. Appl. 2022, 188, 116026. [Google Scholar] [CrossRef]
- Abualigah, L.; Abd Elaziz, M.; Sumari, P.; Geem, Z.W.; Gandomi, A.H. Reptile Search Algorithm (RSA): A nature-inspired meta-heuristic optimizer. Expert Syst. Appl. 2022, 191, 116158. [Google Scholar] [CrossRef]
- Dehghani, M.; Montazeri, Z.; Bektemyssova, G.; Malik, O.P.; Dhiman, G.; Ahmed, A.E. Kookaburra Optimization Algorithm: A New Bio-Inspired Metaheuristic Algorithm for Solving Optimization Problems. Biomimetics 2023, 8, 470. [Google Scholar] [CrossRef]
- Abdel-Basset, M.; Mohamed, R.; Zidan, M.; Jameel, M.; Abouhawwash, M. Mantis Search Algorithm: A novel bio-inspired algorithm for global optimization and engineering design problems. Comput. Methods Appl. Mech. Eng. 2023, 415, 116200. [Google Scholar] [CrossRef]
- Houssein, E.H.; Oliva, D.; Samee, N.A.; Mahmoud, N.F.; Emam, M.M. Liver Cancer Algorithm: A novel bio-inspired optimizer. Comput. Biol. Med. 2023, 165, 107389. [Google Scholar] [CrossRef]
- Faramarzi, A.; Heidarinejad, M.; Mirjalili, S.; Gandomi, A.H. Marine Predators Algorithm: A nature-inspired metaheuristic. Expert Syst. Appl. 2020, 152, 113377. [Google Scholar] [CrossRef]
- Kaur, S.; Awasthi, L.K.; Sangal, A.L.; Dhiman, G. Tunicate Swarm Algorithm: A new bio-inspired based metaheuristic paradigm for global optimization. Eng. Appl. Artif. Intell. 2020, 90, 103541. [Google Scholar] [CrossRef]
- Braik, M.; Hammouri, A.; Atwan, J.; Al-Betar, M.A.; Awadallah, M.A. White Shark Optimizer: A novel bio-inspired meta-heuristic algorithm for global optimization problems. Knowl.-Based Syst. 2022, 243, 108457. [Google Scholar] [CrossRef]
- Chopra, N.; Ansari, M.M. Golden Jackal Optimization: A Novel Nature-Inspired Optimizer for Engineering Applications. Expert Syst. Appl. 2022, 198, 116924. [Google Scholar] [CrossRef]
- Goldberg, D.E.; Holland, J.H. Genetic Algorithms and Machine Learning. Mach. Learn. 1988, 3, 95–99. [Google Scholar] [CrossRef]
- Storn, R.; Price, K. Differential evolution—A simple and efficient heuristic for global optimization over continuous spaces. J. Glob. Optim. 1997, 11, 341–359. [Google Scholar] [CrossRef]
- De Castro, L.N.; Timmis, J.I. Artificial immune systems as a novel soft computing paradigm. Soft Comput. 2003, 7, 526–544. [Google Scholar] [CrossRef]
- Koza, J.R. Genetic Programming: On the Programming of Computers by Means of Natural Selection; MIT Press: Cambridge, MA, USA, 1992; Volume 1. [Google Scholar]
- Reynolds, R.G. An introduction to cultural algorithms. In Proceedings of the Third Annual Conference on Evolutionary Programming, San Diego, CA, USA, 24–26 February 1994; World Scientific: Singapore, 1994; pp. 131–139. [Google Scholar]
- Beyer, H.-G.; Schwefel, H.-P. Evolution strategies—A comprehensive introduction. Nat. Comput. 2002, 1, 3–52. [Google Scholar] [CrossRef]
- Dehghani, M.; Samet, H. Momentum search algorithm: A new meta-heuristic optimization algorithm inspired by momentum conservation law. SN Appl. Sci. 2020, 2, 1720. [Google Scholar] [CrossRef]
- Rashedi, E.; Nezamabadi-Pour, H.; Saryazdi, S. GSA: A gravitational search algorithm. Inf. Sci. 2009, 179, 2232–2248. [Google Scholar] [CrossRef]
- Dehghani, M.; Montazeri, Z.; Dhiman, G.; Malik, O.; Morales-Menendez, R.; Ramirez-Mendoza, R.A.; Dehghani, A.; Guerrero, J.M.; Parra-Arroyo, L. A spring search algorithm applied to engineering optimization problems. Appl. Sci. 2020, 10, 6173. [Google Scholar] [CrossRef]
- Mirjalili, S.; Mirjalili, S.M.; Hatamlou, A. Multi-verse optimizer: A nature-inspired algorithm for global optimization. Neural Comput. Appl. 2016, 27, 495–513. [Google Scholar] [CrossRef]
- Hatamlou, A. Black hole: A new heuristic optimization approach for data clustering. Inf. Sci. 2013, 222, 175–184. [Google Scholar] [CrossRef]
- Hashim, F.A.; Hussain, K.; Houssein, E.H.; Mabrouk, M.S.; Al-Atabany, W. Archimedes optimization algorithm: A new metaheuristic algorithm for solving optimization problems. Appl. Intell. 2021, 51, 1531–1551. [Google Scholar] [CrossRef]
- Eskandar, H.; Sadollah, A.; Bahreininejad, A.; Hamdi, M. Water cycle algorithm—A novel metaheuristic optimization method for solving constrained engineering optimization problems. Comput. Struct. 2012, 110, 151–166. [Google Scholar] [CrossRef]
- Irizarry, R. LARES: An artificial chemical process approach for optimization. Evol. Comput. 2004, 12, 435–459. [Google Scholar] [CrossRef] [PubMed]
- Salmani, M.H.; Eshghi, K. A metaheuristic algorithm based on chemotherapy science: CSA. J. Optim. 2017, 2017, 3082024. [Google Scholar] [CrossRef]
- Wei, Z.; Huang, C.; Wang, X.; Han, T.; Li, Y. Nuclear reaction optimization: A novel and powerful physics-based algorithm for global optimization. IEEE Access 2019, 7, 66084–66109. [Google Scholar] [CrossRef]
- Hashim, F.A.; Houssein, E.H.; Mabrouk, M.S.; Al-Atabany, W.; Mirjalili, S. Henry gas solubility optimization: A novel physics-based algorithm. Future Gener. Comput. Syst. 2019, 101, 646–667. [Google Scholar] [CrossRef]
- Cuevas, E.; Oliva, D.; Zaldivar, D.; Pérez-Cisneros, M.; Sossa, H. Circle detection using electro-magnetism optimization. Inf. Sci. 2012, 182, 40–55. [Google Scholar] [CrossRef]
- Pereira, J.L.J.; Francisco, M.B.; Diniz, C.A.; Oliver, G.A.; Cunha, S.S., Jr.; Gomes, G.F. Lichtenberg algorithm: A novel hybrid physics-based meta-heuristic for global optimization. Expert Syst. Appl. 2021, 170, 114522. [Google Scholar] [CrossRef]
- Kaveh, A.; Dadras, A. A novel meta-heuristic optimization algorithm: Thermal exchange optimization. Adv. Eng. Softw. 2017, 110, 69–84. [Google Scholar] [CrossRef]
- Faramarzi, A.; Heidarinejad, M.; Stephens, B.; Mirjalili, S. Equilibrium optimizer: A novel optimization algorithm. Knowl.-Based Syst. 2020, 191, 105190. [Google Scholar] [CrossRef]
- Rao, R.V.; Savsani, V.J.; Vakharia, D. Teaching–learning-based optimization: A novel method for constrained mechanical design optimization problems. Comput.-Aided Des. 2011, 43, 303–315. [Google Scholar] [CrossRef]
- Matoušová, I.; Trojovský, P.; Dehghani, M.; Trojovská, E.; Kostra, J. Mother optimization algorithm: A new human-based metaheuristic approach for solving engineering optimization. Sci. Rep. 2023, 13, 10312. [Google Scholar] [CrossRef] [PubMed]
- Dehghani, M.; Mardaneh, M.; Guerrero, J.M.; Malik, O.P.; Ramirez-Mendoza, R.A.; Matas, J.; Vasquez, J.C.; Parra-Arroyo, L. A new “Doctor and Patient” optimization algorithm: An application to energy commitment problem. Appl. Sci. 2020, 10, 5791. [Google Scholar] [CrossRef]
- Dehghani, M.; Trojovská, E.; Zuščák, T. A new human-inspired metaheuristic algorithm for solving optimization problems based on mimicking sewing training. Sci. Rep. 2022, 12, 17387. [Google Scholar] [CrossRef] [PubMed]
- Braik, M.; Ryalat, M.H.; Al-Zoubi, H. A novel meta-heuristic algorithm for solving numerical optimization problems: Ali Baba and the forty thieves. Neural Comput. Appl. 2022, 34, 409–455. [Google Scholar] [CrossRef]
- Trojovský, P.; Dehghani, M. A new optimization algorithm based on mimicking the voting process for leader selection. PeerJ Comput. Sci. 2022, 8, e976. [Google Scholar] [CrossRef]
- Al-Betar, M.A.; Alyasseri, Z.A.A.; Awadallah, M.A.; Abu Doush, I. Coronavirus herd immunity optimizer (CHIO). Neural Comput. Appl. 2021, 33, 5011–5042. [Google Scholar] [CrossRef]
- Zhang, Y.; Jin, Z. Group teaching optimization algorithm: A novel metaheuristic method for solving global optimization problems. Expert Syst. Appl. 2020, 148, 113246. [Google Scholar] [CrossRef]
- Oyelade, O.N.; Ezugwu, A.E.-S.; Mohamed, T.I.; Abualigah, L. Ebola optimization search algorithm: A new nature-inspired metaheuristic optimization algorithm. IEEE Access 2022, 10, 16150–16177. [Google Scholar] [CrossRef]
- Mohamed, A.W.; Hadi, A.A.; Mohamed, A.K. Gaining-sharing knowledge based algorithm for solving optimization problems: A novel nature-inspired algorithm. Int. J. Mach. Learn. Cybern. 2020, 11, 1501–1529. [Google Scholar] [CrossRef]
- Ayyarao, T.L.; RamaKrishna, N.; Elavarasam, R.M.; Polumahanthi, N.; Rambabu, M.; Saini, G.; Khan, B.; Alatas, B. War Strategy Optimization Algorithm: A New Effective Metaheuristic Algorithm for Global Optimization. IEEE Access 2022, 10, 25073–25105. [Google Scholar] [CrossRef]
- Dehghani, M.; Montazeri, Z.; Givi, H.; Guerrero, J.M.; Dhiman, G. Darts game optimizer: A new optimization technique based on darts game. Int. J. Intell. Eng. Syst. 2020, 13, 286–294. [Google Scholar] [CrossRef]
- Dehghani, M.; Montazeri, Z.; Saremi, S.; Dehghani, A.; Malik, O.P.; Al-Haddad, K.; Guerrero, J.M. HOGO: Hide objects game optimization. Int. J. Intell. Eng. Syst. 2020, 13, 216–225. [Google Scholar] [CrossRef]
- Dehghani, M.; Montazeri, Z.; Malik, O.P.; Ehsanifar, A.; Dehghani, A. OSA: Orientation search algorithm. Int. J. Ind. Electron. Control Optim. 2019, 2, 99–112. [Google Scholar]
- Doumari, S.A.; Givi, H.; Dehghani, M.; Malik, O.P. Ring Toss Game-Based Optimization Algorithm for Solving Various Optimization Problems. Int. J. Intell. Eng. Syst. 2021, 14, 545–554. [Google Scholar] [CrossRef]
- Dehghani, M.; Mardaneh, M.; Guerrero, J.M.; Malik, O.; Kumar, V. Football game based optimization: An application to solve energy commitment problem. Int. J. Intell. Eng. Syst. 2020, 13, 514–523. [Google Scholar] [CrossRef]
- Montazeri, Z.; Niknam, T.; Aghaei, J.; Malik, O.P.; Dehghani, M.; Dhiman, G. Golf Optimization Algorithm: A New Game-Based Metaheuristic Algorithm and Its Application to Energy Commitment Problem Considering Resilience. Biomimetics 2023, 8, 386. [Google Scholar] [CrossRef]
- Moghdani, R.; Salimifard, K. Volleyball premier league algorithm. Appl. Soft Comput. 2018, 64, 161–185. [Google Scholar] [CrossRef]
- Wang, G.-G.; Deb, S.; Cui, Z. Monarch butterfly optimization. Neural Comput. Appl. 2019, 31, 1995–2014. [Google Scholar] [CrossRef]
- Li, S.; Chen, H.; Wang, M.; Heidari, A.A.; Mirjalili, S. Slime mould algorithm: A new method for stochastic optimization. Future Gener. Comput. Syst. 2020, 111, 300–323. [Google Scholar] [CrossRef]
- Wang, G.-G. Moth search algorithm: A bio-inspired metaheuristic algorithm for global optimization problems. Memetic Comput. 2018, 10, 151–164. [Google Scholar] [CrossRef]
- Yang, Y.; Chen, H.; Heidari, A.A.; Gandomi, A.H. Hunger games search: Visions, conception, implementation, deep analysis, perspectives, and towards performance shifts. Expert Syst. Appl. 2021, 177, 114864. [Google Scholar] [CrossRef]
- Ahmadianfar, I.; Heidari, A.A.; Gandomi, A.H.; Chu, X.; Chen, H. RUN beyond the metaphor: An efficient optimization algorithm based on Runge Kutta method. Expert Syst. Appl. 2021, 181, 115079. [Google Scholar] [CrossRef]
- Tu, J.; Chen, H.; Wang, M.; Gandomi, A.H. The Colony Predation Algorithm. J. Bionic Eng. 2021, 18, 674–710. [Google Scholar] [CrossRef]
- Ahmadianfar, I.; Heidari, A.A.; Noshadian, S.; Chen, H.; Gandomi, A.H. INFO: An efficient optimization algorithm based on weighted mean of vectors. Expert Syst. Appl. 2022, 195, 116516. [Google Scholar] [CrossRef]
- Heidari, A.A.; Mirjalili, S.; Faris, H.; Aljarah, I.; Mafarja, M.; Chen, H. Harris hawks optimization: Algorithm and applications. Future Gener. Comput. Syst. 2019, 97, 849–872. [Google Scholar] [CrossRef]
- Su, H.; Zhao, D.; Heidari, A.A.; Liu, L.; Zhang, X.; Mafarja, M.; Chen, H. RIME: A physics-based optimization. Neurocomputing 2023, 532, 183–214. [Google Scholar] [CrossRef]
- Wilson, D.E.; Reeder, D.M. Mammal Species of the World: A Taxonomic and Geographic Reference; JHU Press: Baltimore, MD, USA, 2005; Volume 1. [Google Scholar]
- Emerson, D. Animal: The Definitive Visual Guide to the World’s Wildlife; Bowker Magazine Group Cahners Magazine Division: New York, NY, USA, 2001. [Google Scholar]
- Carter, T.S.; Superina, M.; Leslie, D.M. Priodontes maximus (Cingulata: Chlamyphoridae). Mamm. Species 2016, 48, 21–34. [Google Scholar] [CrossRef]
- Abdollahzadeh, B.; Gharehchopogh, F.S.; Mirjalili, S. African vultures optimization algorithm: A new nature-inspired metaheuristic algorithm for global optimization problems. Comput. Ind. Eng. 2021, 158, 107408. [Google Scholar] [CrossRef]
- Awad, N.; Ali, M.; Liang, J.; Qu, B.; Suganthan, P.; Definitions, P. Evaluation Criteria for the CEC 2017 Special Session and Competition on Single Objective Real-Parameter Numerical Optimization; Technology Report; Nanyang Technological University: Singapore, 2016. [Google Scholar]
- Wilcoxon, F. Individual comparisons by ranking methods. In Breakthroughs in Statistics; Springer: Berlin/Heidelberg, Germany, 1992; pp. 196–202. [Google Scholar]
- Das, S.; Suganthan, P.N. Problem Definitions and Evaluation Criteria for CEC 2011 Competition on Testing Evolutionary Algorithms on Real World Optimization Problems; Jadavpur University: Kolkata, India; Nanyang Technological University: Singapore, 2010; pp. 341–359. [Google Scholar]
- Kannan, B.; Kramer, S.N. An augmented Lagrange multiplier based method for mixed integer discrete continuous optimization and its applications to mechanical design. J. Mech. Des. 1994, 116, 405–411. [Google Scholar] [CrossRef]
- Gandomi, A.H.; Yang, X.-S. Benchmark problems in structural optimization. In Computational Optimization, Methods and Algorithms; Springer: Berlin/Heidelberg, Germany, 2011; pp. 259–281. [Google Scholar]
- Mezura-Montes, E.; Coello, C.A.C. Useful infeasible solutions in engineering optimization with evolutionary algorithms. In Proceedings of the Mexican International Conference on Artificial Intelligence, Monterrey, Mexico, 14–18 November 2005; Springer: Berlin/Heidelberg, Germany, 2005; pp. 652–662. [Google Scholar]


| GAO | WSO | AVOA | RSA | MPA | TSA | WOA | MVO | GWO | TLBO | GSA | PSO | GA | ||
|---|---|---|---|---|---|---|---|---|---|---|---|---|---|---|
| C17-F1 | mean | 100 | 4.67E+09 | 4,184,979 | 8.73E+09 | 34,330,739 | 1.49E+09 | 9,692,832 | 4,188,121 | 79,553,526 | 1.3E+08 | 4,182,333 | 4,184,382 | 14,308,636 |
| best | 100 | 3.93E+09 | 3746.743 | 7.56E+09 | 10,903.05 | 3.19E+08 | 4,981,868 | 8834.837 | 25,081.34 | 56,192,560 | 1415.894 | 1625.786 | 6,732,111 | |
| worst | 100 | 5.85E+09 | 15,192,929 | 1.04E+10 | 1.25E+08 | 3.24E+09 | 19,205,398 | 15,201,956 | 2.89E+08 | 3.03E+08 | 15,192,873 | 15,193,484 | 26,519,809 | |
| std | 0 | 9.08E+08 | 8,022,380 | 1.4E+09 | 65,875,245 | 1.41E+09 | 7,002,724 | 8,026,144 | 1.53E+08 | 1.27E+08 | 8,023,882 | 8,022,667 | 9,534,136 | |
| median | 100 | 4.44E+09 | 771,620 | 8.48E+09 | 6,292,615 | 1.2E+09 | 7,292,030 | 770,846.8 | 14,580,526 | 80,111,109 | 767,520.9 | 771,208.3 | 11,991,311 | |
| rank | 1 | 12 | 4 | 13 | 8 | 11 | 6 | 5 | 9 | 10 | 2 | 3 | 7 | |
| C17-F3 | mean | 300 | 6653.076 | 432.8431 | 8416.704 | 1377.331 | 9744.62 | 1652.665 | 431.2721 | 2796.49 | 795.3626 | 8937.772 | 431.2255 | 12,795.02 |
| best | 300 | 3819.149 | 358.2124 | 4752.444 | 777.91 | 3952.712 | 640.1711 | 358.2232 | 1407.456 | 504.4881 | 5625.365 | 358.2123 | 4024.146 | |
| worst | 300 | 8784.409 | 568.2645 | 11,138.08 | 2473.984 | 13,631.64 | 2947.044 | 564.9107 | 5337.754 | 1012.646 | 12,088.54 | 564.8045 | 20,125.74 | |
| std | 0 | 2369.321 | 104.7758 | 3175.356 | 851.6238 | 4471.714 | 1195.34 | 103.7782 | 1973.46 | 249.9022 | 2890.252 | 103.7329 | 9176.458 | |
| median | 300 | 7004.373 | 402.4478 | 8888.145 | 1128.715 | 10,697.06 | 1511.722 | 400.9773 | 2220.375 | 832.1585 | 9018.593 | 400.9426 | 13,515.1 | |
| rank | 1 | 9 | 4 | 10 | 6 | 12 | 7 | 3 | 8 | 5 | 11 | 2 | 13 | |
| C17-F4 | mean | 400 | 843.9185 | 404.8598 | 1213.807 | 406.5485 | 551.6274 | 422.2989 | 403.6485 | 410.833 | 408.6382 | 404.6903 | 418.1641 | 413.3818 |
| best | 400 | 633.9161 | 401.4788 | 781.7224 | 402.3817 | 466.9688 | 406.857 | 401.7805 | 405.4965 | 408.3648 | 403.4626 | 400.3805 | 411.3341 | |
| worst | 400 | 1034.209 | 406.7134 | 1637.197 | 411.0784 | 649.5213 | 463.1789 | 405.3186 | 425.5967 | 409.1148 | 406.3282 | 461.3011 | 416.8981 | |
| std | 0 | 195.1214 | 2.525052 | 397.3324 | 4.668634 | 97.40747 | 29.75653 | 1.658473 | 10.72221 | 0.357177 | 1.561991 | 31.59144 | 2.777032 | |
| median | 400 | 853.7743 | 405.6236 | 1218.153 | 406.3669 | 545.0096 | 409.5799 | 403.7475 | 406.1195 | 408.5367 | 404.4852 | 405.4875 | 412.6476 | |
| rank | 1 | 12 | 4 | 13 | 5 | 11 | 10 | 2 | 7 | 6 | 3 | 9 | 8 | |
| C17-F5 | mean | 501.2464 | 554.7301 | 539.6017 | 564.4364 | 512.703 | 557.1398 | 536.9462 | 522.0381 | 512.825 | 530.977 | 548.0728 | 525.6662 | 525.7627 |
| best | 500.9951 | 541.5438 | 525.3512 | 551.2702 | 508.2545 | 539.3227 | 521.9911 | 510.8276 | 508.4225 | 525.7325 | 543.4038 | 510.6874 | 522.1256 | |
| worst | 501.9917 | 562.7056 | 556.257 | 577.8185 | 517.7245 | 584.2697 | 567.3886 | 533.8411 | 519.724 | 534.6331 | 557.7146 | 546.6921 | 531.3457 | |
| std | 0.540776 | 10.53806 | 17.74322 | 16.11171 | 5.423907 | 21.90443 | 23.23182 | 10.3802 | 5.314383 | 4.281877 | 7.152264 | 18.18017 | 4.645014 | |
| median | 500.9993 | 557.3354 | 538.3993 | 564.3285 | 512.4164 | 552.4834 | 529.2026 | 521.7418 | 511.5768 | 531.7711 | 545.5865 | 522.6426 | 524.7898 | |
| rank | 1 | 11 | 9 | 13 | 2 | 12 | 8 | 4 | 3 | 7 | 10 | 5 | 6 | |
| C17-F6 | mean | 600 | 628.1172 | 615.1576 | 635.431 | 601.1785 | 621.6683 | 620.2268 | 602.0072 | 601.1205 | 606.0926 | 615.0587 | 606.5844 | 609.0379 |
| best | 600 | 624.1437 | 614.3677 | 632.6039 | 600.7017 | 613.1533 | 606.6099 | 600.5106 | 600.6181 | 604.2107 | 602.6271 | 601.2733 | 606.0714 | |
| worst | 600 | 632.1329 | 617.3273 | 639.0601 | 602.3672 | 635.1389 | 639.2844 | 604.0274 | 601.5891 | 609.0813 | 631.4329 | 616.984 | 612.8624 | |
| std | 0 | 3.743769 | 1.575387 | 3.181093 | 0.864759 | 10.29375 | 14.95242 | 1.717729 | 0.458809 | 2.412521 | 14.53307 | 7.76462 | 3.27032 | |
| median | 600 | 628.0961 | 614.4676 | 635.0299 | 600.8225 | 619.1905 | 617.5064 | 601.7454 | 601.1374 | 605.5392 | 613.0873 | 604.0401 | 608.609 | |
| rank | 1 | 12 | 9 | 13 | 3 | 11 | 10 | 4 | 2 | 5 | 8 | 6 | 7 | |
| C17-F7 | mean | 711.1267 | 786.7696 | 759.9427 | 793.5837 | 724.4666 | 814.493 | 756.9305 | 729.8769 | 725.6592 | 748.2351 | 717.9475 | 731.4933 | 735.0744 |
| best | 710.6726 | 772.6067 | 741.6925 | 782.6387 | 720.3138 | 780.2592 | 746.903 | 717.8787 | 717.7416 | 744.8348 | 715.8297 | 725.1484 | 725.9664 | |
| worst | 711.7995 | 796.765 | 783.5109 | 804.6758 | 728.8251 | 850.564 | 782.3197 | 747.11 | 741.377 | 755.3906 | 721.2986 | 741.6302 | 739.1596 | |
| std | 0.557384 | 11.05161 | 21.09388 | 11.22471 | 3.89965 | 33.21785 | 18.51036 | 13.41155 | 11.73144 | 5.310127 | 2.641472 | 8.015211 | 6.79059 | |
| median | 711.0174 | 788.8534 | 757.2838 | 793.5102 | 724.3638 | 813.5744 | 749.2497 | 727.2596 | 721.7591 | 746.3575 | 717.331 | 729.5974 | 737.5857 | |
| rank | 1 | 11 | 10 | 12 | 3 | 13 | 9 | 5 | 4 | 8 | 2 | 6 | 7 | |
| C17-F8 | mean | 801.4928 | 842.6739 | 828.5432 | 848.1225 | 812.5351 | 843.4306 | 833.0884 | 811.8088 | 815.2945 | 834.2569 | 818.779 | 821.2983 | 816.1124 |
| best | 800.995 | 838.1575 | 818.6788 | 838.3745 | 808.7549 | 829.3668 | 817.8831 | 808.206 | 810.2093 | 828.4819 | 812.1894 | 815.3777 | 812.8734 | |
| worst | 801.9912 | 847.7998 | 842.4782 | 852.205 | 814.6617 | 859.7064 | 843.6564 | 815.4968 | 819.8403 | 840.725 | 825.0554 | 827.1608 | 822.4095 | |
| std | 0.625636 | 5.545568 | 10.87967 | 7.138078 | 2.962099 | 14.70256 | 12.09117 | 3.247739 | 4.406927 | 7.021296 | 6.025675 | 6.451529 | 4.653363 | |
| median | 801.4926 | 842.3692 | 826.5079 | 850.9554 | 813.3619 | 842.3245 | 835.4072 | 811.7662 | 815.5642 | 833.9103 | 818.9357 | 821.3274 | 814.5833 | |
| rank | 1 | 11 | 8 | 13 | 3 | 12 | 9 | 2 | 4 | 10 | 6 | 7 | 5 | |
| C17-F9 | mean | 900 | 1353.7 | 1150.517 | 1392.659 | 905.134 | 1317.56 | 1312.862 | 901.3205 | 910.9771 | 910.8839 | 900.6254 | 904.305 | 905.059 |
| best | 900 | 1221.615 | 946.6395 | 1309.138 | 900.3235 | 1133.13 | 1051.687 | 900.1139 | 900.5366 | 907.8785 | 900.0394 | 900.8912 | 903.0891 | |
| worst | 900 | 1475.045 | 1561.802 | 1512.884 | 913.1785 | 1566.988 | 1556.076 | 903.3636 | 930.3434 | 917.5471 | 901.6052 | 910.8806 | 907.9139 | |
| std | 0 | 119.594 | 310.193 | 94.4051 | 6.297156 | 204.4421 | 230.9694 | 1.659842 | 15.1837 | 4.893863 | 0.767032 | 4.871949 | 2.216612 | |
| median | 900 | 1359.07 | 1046.813 | 1374.307 | 903.517 | 1285.061 | 1321.842 | 900.9022 | 906.5142 | 909.0551 | 900.4284 | 902.7241 | 904.6165 | |
| rank | 1 | 12 | 9 | 13 | 6 | 11 | 10 | 3 | 8 | 7 | 2 | 4 | 5 | |
| C17-F10 | mean | 1006.179 | 2181.096 | 1729.586 | 2417.519 | 1505.229 | 1948.592 | 1942.061 | 1732.136 | 1684.558 | 2068.376 | 2159.534 | 1874.018 | 1676.188 |
| best | 1000.284 | 1921.987 | 1462.046 | 2268.381 | 1382.756 | 1720.911 | 1445.208 | 1441.456 | 1509.563 | 1717.81 | 1916.982 | 1528.099 | 1415.382 | |
| worst | 1012.668 | 2300.117 | 2273.835 | 2734.951 | 1578.549 | 2151.824 | 2401.429 | 2171.491 | 1922.565 | 2324.822 | 2258.83 | 2231.734 | 2024.674 | |
| std | 7.244311 | 192.7589 | 408.7834 | 235.1122 | 100.3704 | 255.5173 | 495.8664 | 379.7598 | 188.8268 | 281.6863 | 176.5855 | 314.8046 | 282.3401 | |
| median | 1005.882 | 2251.141 | 1591.231 | 2333.372 | 1529.806 | 1960.816 | 1960.804 | 1657.799 | 1653.051 | 2115.435 | 2231.162 | 1868.12 | 1632.348 | |
| rank | 1 | 12 | 5 | 13 | 2 | 9 | 8 | 6 | 4 | 10 | 11 | 7 | 3 | |
| C17-F11 | mean | 1100 | 3101.99 | 1144.84 | 3578.148 | 1126.427 | 4844.162 | 1146.945 | 1126.823 | 1150.648 | 1146.906 | 1136.85 | 1140.57 | 2203.963 |
| best | 1100 | 2031.676 | 1121.626 | 1410.344 | 1112.898 | 4715.435 | 1118.117 | 1107.382 | 1120.125 | 1135.086 | 1123.853 | 1129.361 | 1119.906 | |
| worst | 1100 | 4144.434 | 1188.913 | 5717.17 | 1157.436 | 4912.302 | 1165.353 | 1143.543 | 1217.154 | 1163.618 | 1160.564 | 1162.792 | 5289.488 | |
| std | 0 | 1033.315 | 33.04664 | 2107.652 | 22.88817 | 95.80871 | 23.58632 | 18.64388 | 49.2607 | 13.17059 | 17.71381 | 16.44602 | 2239.144 | |
| median | 1100 | 3115.925 | 1134.41 | 3592.539 | 1117.687 | 4874.455 | 1152.156 | 1128.182 | 1132.656 | 1144.46 | 1131.492 | 1135.064 | 1203.23 | |
| rank | 1 | 11 | 6 | 12 | 2 | 13 | 8 | 3 | 9 | 7 | 4 | 5 | 10 | |
| C17-F12 | mean | 1352.959 | 3.04E+08 | 1,014,691 | 6.07E+08 | 55,6081.8 | 962,283.6 | 2,093,142 | 953,191.8 | 1,285,489 | 4,414,980 | 945,683.3 | 74,718.57 | 588,303.7 |
| best | 1318.646 | 68,431,780 | 396,241.9 | 1.35E+08 | 19,486.36 | 466,272.3 | 220,440.9 | 80,269.96 | 41,489.41 | 1,236,043 | 498,216.7 | 11,672.08 | 240,713.7 | |
| worst | 1438.176 | 5.31E+08 | 1,719,649 | 1.06E+09 | 870,237 | 1,186,611 | 3,466,069 | 2,783,658 | 2,012,132 | 7,801,921 | 1,487,109 | 118,000.4 | 991,573.3 | |
| std | 62.35801 | 2.55E+08 | 689,369.2 | 5.1E+08 | 407,890 | 368,442.3 | 1,616,452 | 1,348,855 | 945,244.5 | 3,753,489 | 457,630 | 49,610.7 | 344,419.3 | |
| median | 1327.506 | 3.09E+08 | 971,435.4 | 6.16E+08 | 667,302 | 1098,125 | 2,343,029 | 474,419.4 | 1,544,168 | 4,310,979 | 898,703.8 | 84,600.92 | 560,463.9 | |
| rank | 1 | 12 | 8 | 13 | 3 | 7 | 10 | 6 | 9 | 11 | 5 | 2 | 4 | |
| C17-F13 | mean | 1305.324 | 14,793,370 | 16,446.49 | 29,577,769 | 5350.291 | 11,633.32 | 7195.222 | 6463.604 | 9535.39 | 15,064.64 | 9339.47 | 6371.288 | 47,520.14 |
| best | 1303.114 | 1,233,731 | 3162.283 | 2,456,038 | 3671.563 | 7329.324 | 3624.201 | 2012.063 | 6068.856 | 14,058.19 | 4950.777 | 2866.249 | 8151.738 | |
| worst | 1308.508 | 49,102,055 | 27,494.33 | 98,191,200 | 6537.327 | 17,832.22 | 13,645.16 | 11,451.69 | 13,197.34 | 17,150.1 | 13,023.45 | 15,181.42 | 15,5719 | |
| std | 2.473462 | 24,946,024 | 13,820.39 | 49,889,389 | 1487.51 | 4917.991 | 4963.144 | 5371.09 | 3183.327 | 1533.341 | 3671.92 | 6442.862 | 78,543.6 | |
| median | 1304.837 | 4,418,847 | 17,564.68 | 8,831,920 | 5596.137 | 10,685.86 | 5755.762 | 6195.332 | 9437.683 | 14,525.13 | 9691.829 | 3718.742 | 13,104.94 | |
| rank | 1 | 12 | 10 | 13 | 2 | 8 | 5 | 4 | 7 | 9 | 6 | 3 | 11 | |
| C17-F14 | mean | 1400.746 | 3537.165 | 2000.121 | 4863.875 | 1929.741 | 3175.526 | 1567.073 | 1612.61 | 2279.672 | 1628.918 | 5052.126 | 2838.871 | 11,422.2 |
| best | 1400 | 2917.026 | 1698.168 | 4293.595 | 1434.361 | 1481.885 | 1482.685 | 1426.054 | 1466.642 | 1506.182 | 4199.684 | 1432.2 | 3408.166 | |
| worst | 1400.995 | 4533.216 | 2636.156 | 6138.936 | 2874.521 | 5007.289 | 1705.952 | 2090.877 | 4648.74 | 1770.088 | 6879.61 | 6156.929 | 22,446.14 | |
| std | 0.541408 | 769.4616 | 466.7728 | 942.5869 | 735.1115 | 2005.623 | 104.9446 | 348.6518 | 1719.029 | 120.5646 | 1372.454 | 2439.604 | 8753.404 | |
| median | 1400.995 | 3349.208 | 1833.079 | 4511.485 | 1705.042 | 3106.466 | 1539.828 | 1466.754 | 1501.653 | 1619.702 | 4564.605 | 1883.177 | 9917.238 | |
| rank | 1 | 10 | 6 | 11 | 5 | 9 | 2 | 3 | 7 | 4 | 12 | 8 | 13 | |
| C17-F15 | mean | 1500.331 | 9291.205 | 5066.766 | 12,452.89 | 3928.049 | 6534.761 | 5859.352 | 1831.798 | 5511.379 | 1975.935 | 21,070.59 | 8252.547 | 4422.54 |
| best | 1500.001 | 3298.851 | 2198.906 | 2860.359 | 3190.009 | 2503.361 | 2217.57 | 1728.182 | 3488.756 | 1843.486 | 10,151.05 | 2955.741 | 2241.563 | |
| worst | 1500.5 | 15,478.21 | 11,357.34 | 26,628.87 | 4826.524 | 11,218.82 | 12,194.46 | 1938.978 | 6425.035 | 2050.737 | 31,372.95 | 13,354.66 | 7407.664 | |
| std | 0.256213 | 5737.638 | 4611.449 | 11,314.8 | 738.847 | 4057.645 | 4744.95 | 94.03401 | 1499.643 | 101.8412 | 10,985.2 | 4717.115 | 2809.182 | |
| median | 1500.413 | 9193.879 | 3355.407 | 10,161.17 | 3847.831 | 6208.432 | 4512.689 | 1830.016 | 6065.863 | 2004.758 | 21,379.17 | 8349.895 | 4020.466 | |
| rank | 1 | 11 | 6 | 12 | 4 | 9 | 8 | 2 | 7 | 3 | 13 | 10 | 5 | |
| C17-F16 | mean | 1600.76 | 1956.927 | 1790.531 | 1968.643 | 1682.603 | 1995.231 | 1911.866 | 1796.276 | 1720.719 | 1676.29 | 2017.507 | 1888.754 | 1784.315 |
| best | 1600.356 | 1899.128 | 1650.114 | 1802.593 | 1640.957 | 1830.958 | 1751.897 | 1713.956 | 1618.636 | 1655.686 | 1903.889 | 1801.282 | 1715.952 | |
| worst | 1601.12 | 2058.375 | 1885.918 | 2204.09 | 1712.608 | 2153.805 | 2017.206 | 1853.043 | 1807.866 | 1726.683 | 2188.933 | 2028.071 | 1812.82 | |
| std | 0.343807 | 77.00688 | 108.6182 | 184.7761 | 33.54393 | 159.3833 | 139.0817 | 64.0361 | 84.9012 | 37.02768 | 140.3106 | 112.9385 | 49.86364 | |
| median | 1600.781 | 1935.103 | 1813.047 | 1933.945 | 1688.423 | 1998.08 | 1939.18 | 1809.054 | 1728.188 | 1661.396 | 1988.604 | 1862.831 | 1804.244 | |
| rank | 1 | 10 | 6 | 11 | 3 | 12 | 9 | 7 | 4 | 2 | 13 | 8 | 5 | |
| C17-F17 | mean | 1700.099 | 1809.53 | 1748.189 | 1806.239 | 1735.059 | 1792.301 | 1826.501 | 1827.26 | 1763.306 | 1754.568 | 1830.699 | 1749.382 | 1752.501 |
| best | 1700.02 | 1793.174 | 1732.49 | 1796.351 | 1721.495 | 1777.798 | 1766.075 | 1770.48 | 1723.924 | 1744.182 | 1743.916 | 1742.235 | 1748.199 | |
| worst | 1700.332 | 1819.041 | 1784.458 | 1812.531 | 1773.486 | 1800.078 | 1872.055 | 1924.708 | 1856.768 | 1765.263 | 1944.2 | 1755.838 | 1758.536 | |
| std | 0.168864 | 12.33483 | 26.48996 | 7.632948 | 27.89407 | 10.77603 | 49.38603 | 79.30684 | 68.11292 | 11.30402 | 110.1293 | 6.920241 | 4.861874 | |
| median | 1700.022 | 1812.953 | 1737.905 | 1808.038 | 1722.628 | 1795.665 | 1833.938 | 1806.927 | 1736.266 | 1754.414 | 1817.34 | 1749.728 | 1751.634 | |
| rank | 1 | 10 | 3 | 9 | 2 | 8 | 11 | 12 | 7 | 6 | 13 | 4 | 5 | |
| C17-F18 | mean | 1805.36 | 2,456,562 | 11,541.03 | 4,895,611 | 10,847.99 | 11,714.98 | 21,376.33 | 19,348.63 | 18,454.43 | 26,699.35 | 9699.424 | 20,146.85 | 12,363.66 |
| best | 1800.003 | 128,322.8 | 5943.256 | 244,067.4 | 4107.461 | 8195.069 | 6640.072 | 8574.872 | 5967.329 | 21,142.43 | 6592.158 | 4256.342 | 4733.467 | |
| worst | 1820.451 | 7,116,657 | 15,404.74 | 14,209,754 | 16,196.96 | 14,526.12 | 31,980.65 | 30,964.52 | 30,634.13 | 32,797.95 | 11,966.24 | 36,094.26 | 17,883.82 | |
| std | 10.95197 | 3,522,742 | 4423.846 | 7,042,499 | 5983.7 | 2856.445 | 13,538.96 | 11,110.68 | 13,611.52 | 5737.733 | 2540.637 | 18,444.41 | 6095.706 | |
| median | 1800.492 | 1,290,633 | 12,408.07 | 2,564,312 | 11,543.77 | 12,069.36 | 23,442.29 | 18,927.56 | 18,608.14 | 26,428.51 | 10,119.65 | 20,118.4 | 13,418.68 | |
| rank | 1 | 12 | 4 | 13 | 3 | 5 | 10 | 8 | 7 | 11 | 2 | 9 | 6 | |
| C17-F19 | mean | 1900.445 | 333,554.7 | 6471.06 | 605,336 | 5517.557 | 108,525 | 30,605.59 | 2353.324 | 5333.283 | 4743.012 | 35,431.25 | 22,136.66 | 6019.454 |
| best | 1900.039 | 22,357.55 | 2187.576 | 39,716.99 | 2308.741 | 2080.283 | 6943.315 | 1957.954 | 2082.111 | 2211.714 | 10,526.97 | 2618.255 | 2890.56 | |
| worst | 1901.559 | 701,682.7 | 12,365.65 | 1,299,174 | 9251.813 | 216,523.7 | 55,721.2 | 2809.084 | 12,850.83 | 11,045.82 | 50,727.43 | 67,203.92 | 9652.432 | |
| std | 0.810364 | 323,164.3 | 5110.522 | 618,250.1 | 3851.325 | 133,408.8 | 21,755.74 | 467.5256 | 5493.958 | 4585.206 | 19,767.59 | 33,107.07 | 3050.353 | |
| median | 1900.09 | 305,089.2 | 5665.506 | 541,226.6 | 5254.838 | 107,747.9 | 29,878.93 | 2323.129 | 3200.098 | 2857.258 | 40,235.29 | 9362.235 | 5767.412 | |
| rank | 1 | 12 | 7 | 13 | 5 | 11 | 9 | 2 | 4 | 3 | 10 | 8 | 6 | |
| C17-F20 | mean | 2000.312 | 2195.65 | 2157.506 | 2202.571 | 2090.307 | 2189.132 | 2188.459 | 2130.878 | 2156.952 | 2072.851 | 2228.919 | 2156.148 | 2054.136 |
| best | 2000.312 | 2151.12 | 2041.552 | 2151.909 | 2071.162 | 2101.769 | 2099.1 | 2050.91 | 2121.121 | 2061.048 | 2171.882 | 2135.012 | 2041.352 | |
| worst | 2000.312 | 2250.869 | 2261.632 | 2253.811 | 2120.147 | 2284.313 | 2255.949 | 2221.207 | 2225.944 | 2081.388 | 2312.523 | 2181.17 | 2059.917 | |
| std | 0 | 44.83411 | 108.1238 | 53.54076 | 22.84341 | 83.61951 | 82.41672 | 75.96454 | 51.25916 | 10.0526 | 74.5843 | 23.99981 | 9.348874 | |
| median | 2000.312 | 2190.305 | 2163.42 | 2202.282 | 2084.959 | 2185.224 | 2199.393 | 2125.698 | 2140.371 | 2074.485 | 2215.636 | 2154.205 | 2057.638 | |
| rank | 1 | 11 | 8 | 12 | 4 | 10 | 9 | 5 | 7 | 3 | 13 | 6 | 2 | |
| C17-F21 | mean | 2200 | 2285.515 | 2218.687 | 2264.516 | 2255.984 | 2314.411 | 2301.249 | 2252.5 | 2304.203 | 2292.508 | 2351.495 | 2308.934 | 2291.201 |
| best | 2200 | 2245.804 | 2210.67 | 2227.49 | 2253.548 | 2224.984 | 2222.545 | 2206.529 | 2300.289 | 2210.095 | 2336.176 | 2301.709 | 2229.95 | |
| worst | 2200 | 2310.048 | 2240.432 | 2285.317 | 2258.467 | 2354.854 | 2338.939 | 2299.234 | 2308.777 | 2325.466 | 2366.304 | 2315.505 | 2320.685 | |
| std | 0 | 31.96962 | 15.80852 | 27.93412 | 2.265614 | 66.04131 | 57.78516 | 57.40188 | 3.79845 | 60.19259 | 13.68159 | 7.42458 | 44.98868 | |
| median | 2200 | 2293.103 | 2211.824 | 2272.629 | 2255.961 | 2338.903 | 2321.756 | 2252.119 | 2303.872 | 2317.235 | 2351.751 | 2309.262 | 2307.086 | |
| rank | 1 | 6 | 2 | 5 | 4 | 12 | 9 | 3 | 10 | 8 | 13 | 11 | 7 | |
| C17-F22 | mean | 2300.073 | 2642.8 | 2308.325 | 2830.323 | 2304.903 | 2656.585 | 2321.07 | 2288.364 | 2307.996 | 2317.434 | 2300.603 | 2312.013 | 2316.02 |
| best | 2300 | 2540.302 | 2304.87 | 2650.497 | 2300.924 | 2428.398 | 2317.164 | 2239.419 | 2301.202 | 2311.909 | 2300.113 | 2300.661 | 2313.04 | |
| worst | 2300.29 | 2745.079 | 2309.73 | 2962.713 | 2309.169 | 2835.901 | 2327.16 | 2305.128 | 2320.393 | 2328.049 | 2301.117 | 2339.816 | 2319.724 | |
| std | 0.157893 | 98.44184 | 2.533489 | 143.0457 | 3.781106 | 197.8878 | 4.924207 | 35.51645 | 9.483233 | 8.127414 | 0.457965 | 20.24666 | 3.028103 | |
| median | 2300 | 2642.909 | 2309.351 | 2854.041 | 2304.759 | 2681.021 | 2319.979 | 2304.455 | 2305.195 | 2314.89 | 2300.591 | 2303.787 | 2315.658 | |
| rank | 2 | 11 | 6 | 13 | 4 | 12 | 10 | 1 | 5 | 9 | 3 | 7 | 8 | |
| C17-F23 | mean | 2600.919 | 2678.961 | 2638.02 | 2688.432 | 2614.073 | 2708.104 | 2643.747 | 2619.19 | 2613.571 | 2638.43 | 2767.027 | 2639.931 | 2650.15 |
| best | 2600.003 | 2649.146 | 2627.825 | 2663.205 | 2611.722 | 2631.522 | 2628.648 | 2608.07 | 2608.201 | 2629.366 | 2711.138 | 2633.477 | 2633.265 | |
| worst | 2602.87 | 2696.413 | 2653.633 | 2723.717 | 2616.706 | 2746.175 | 2660.892 | 2629.469 | 2619.663 | 2646.197 | 2886.071 | 2649.994 | 2657.13 | |
| std | 1.436922 | 24.18562 | 13.10548 | 30.6669 | 2.58295 | 56.43704 | 18.97113 | 10.1202 | 6.4156 | 8.229169 | 89.55711 | 8.02611 | 12.41382 | |
| median | 2600.403 | 2685.143 | 2635.312 | 2683.402 | 2613.933 | 2727.36 | 2642.724 | 2619.611 | 2613.21 | 2639.078 | 2735.45 | 2638.126 | 2655.102 | |
| rank | 1 | 10 | 5 | 11 | 3 | 12 | 8 | 4 | 2 | 6 | 13 | 7 | 9 | |
| C17-F24 | mean | 2630.488 | 2765.185 | 2748.659 | 2819.559 | 2630.65 | 2663.079 | 2742.631 | 2676.028 | 2732.435 | 2738.514 | 2731.304 | 2746.897 | 2710.324 |
| best | 2516.677 | 2724.904 | 2719.254 | 2798.418 | 2614.759 | 2542.972 | 2716.154 | 2515.409 | 2707.696 | 2724.242 | 2519.335 | 2738.729 | 2553.544 | |
| worst | 2732.32 | 2827.028 | 2766.535 | 2875.219 | 2639.513 | 2789.346 | 2771.83 | 2744.133 | 2744.878 | 2750.265 | 2863.426 | 2767.252 | 2788.555 | |
| std | 126.7883 | 51.22319 | 23.88559 | 40.45843 | 12.12815 | 144.3216 | 25.01576 | 117.2769 | 18.93341 | 13.46482 | 161.0712 | 14.8092 | 115.5007 | |
| median | 2636.477 | 2754.404 | 2754.423 | 2802.3 | 2634.163 | 2660 | 2741.269 | 2722.285 | 2738.583 | 2739.775 | 2771.229 | 2740.804 | 2749.598 | |
| rank | 1 | 12 | 11 | 13 | 2 | 3 | 9 | 4 | 7 | 8 | 6 | 10 | 5 | |
| C17-F25 | mean | 2932.639 | 3107.152 | 2914.391 | 3227.178 | 2918.186 | 3103.915 | 2909.269 | 2921.806 | 2936.094 | 2931.645 | 2921.953 | 2922.869 | 2947.757 |
| best | 2898.047 | 3046.034 | 2901.119 | 3168.947 | 2914.345 | 2908.676 | 2786.075 | 2903.552 | 2920.869 | 2915.763 | 2904.944 | 2900.751 | 2934.789 | |
| worst | 2945.793 | 3242.562 | 2945.862 | 3291.747 | 2923.751 | 3554.229 | 2952.81 | 2941.28 | 2943.151 | 2948.071 | 2940.397 | 2942.787 | 2957.685 | |
| std | 25.12878 | 100.3049 | 22.93345 | 55.32727 | 4.509969 | 330.2856 | 89.45057 | 22.78116 | 11.16775 | 19.53837 | 20.8472 | 25.00614 | 10.61883 | |
| median | 2943.359 | 3070.007 | 2905.292 | 3224.008 | 2917.324 | 2976.378 | 2949.096 | 2921.197 | 2940.178 | 2931.373 | 2921.235 | 2923.969 | 2949.278 | |
| rank | 8 | 12 | 2 | 13 | 3 | 11 | 1 | 4 | 9 | 7 | 5 | 6 | 10 | |
| C17-F26 | mean | 2900 | 3479.492 | 2982.128 | 3650.998 | 3009.527 | 3534.254 | 3157.14 | 2913.469 | 3228.037 | 3177.481 | 3741.746 | 2916.838 | 2910.943 |
| best | 2900 | 3232.365 | 2823.293 | 3405.694 | 2892.266 | 3109.432 | 2970.468 | 2899.224 | 2958.692 | 2913.788 | 2823.292 | 2866.913 | 2733.158 | |
| worst | 2900 | 3657.094 | 3168.251 | 3931.414 | 3286.061 | 4083.718 | 3496.999 | 2947.122 | 3814.643 | 3787.575 | 4195.301 | 2993.158 | 3084.441 | |
| std | 4.04E−13 | 205.1181 | 200.8003 | 250.5073 | 201.5685 | 505.4077 | 257.8276 | 24.52868 | 429.3952 | 445.1069 | 680.2302 | 58.49097 | 181.6943 | |
| median | 2900 | 3514.255 | 2968.485 | 3633.443 | 2929.891 | 3471.932 | 3080.547 | 2903.764 | 3069.407 | 3004.281 | 3974.196 | 2903.641 | 2913.088 | |
| rank | 1 | 10 | 5 | 12 | 6 | 11 | 7 | 3 | 9 | 8 | 13 | 4 | 2 | |
| C17-F27 | mean | 3089.518 | 3195.072 | 3117.592 | 3213.317 | 3104.402 | 3168.87 | 3182.133 | 3093.149 | 3114.239 | 3113.362 | 3208.927 | 3131.437 | 3152.052 |
| best | 3089.518 | 3152.328 | 3095.515 | 3122.317 | 3092.192 | 3101.651 | 3171.92 | 3090.086 | 3094.081 | 3095.582 | 3197.261 | 3096.371 | 3115.537 | |
| worst | 3089.518 | 3264.333 | 3173.552 | 3377.978 | 3132.966 | 3204.083 | 3190.778 | 3094.976 | 3169.983 | 3160.563 | 3226.007 | 3175.68 | 3202.016 | |
| std | 2.86E−13 | 52.47827 | 40.68596 | 122.7136 | 20.87492 | 51.55462 | 8.446094 | 2.494371 | 40.49244 | 34.32791 | 13.22445 | 36.38001 | 39.34622 | |
| median | 3089.518 | 3181.814 | 3100.652 | 3176.487 | 3096.226 | 3184.874 | 3182.916 | 3093.767 | 3096.446 | 3098.651 | 3206.22 | 3126.849 | 3145.328 | |
| rank | 1 | 11 | 6 | 13 | 3 | 9 | 10 | 2 | 5 | 4 | 12 | 7 | 8 | |
| C17-F28 | mean | 3100 | 3538.244 | 3231.255 | 3698.548 | 3216.142 | 3532.542 | 3274.874 | 3233.509 | 3324.896 | 3307.813 | 3415.932 | 3291.101 | 3240.069 |
| best | 3100 | 3501.806 | 3114.813 | 3628.394 | 3165.576 | 3383.853 | 3162.006 | 3108.094 | 3189.461 | 3215.18 | 3407.045 | 3181.161 | 3146.602 | |
| worst | 3100 | 3566.356 | 3357.793 | 3752.19 | 3240.529 | 3713.207 | 3365.058 | 3364.619 | 3385.592 | 3364.826 | 3432.454 | 3357.978 | 3470.495 | |
| std | 0 | 29.96079 | 117.1453 | 60.32794 | 37.75453 | 188.0645 | 111.3176 | 152.3908 | 99.02326 | 75.82069 | 12.40021 | 88.80992 | 168.1178 | |
| median | 3100 | 3542.408 | 3226.208 | 3706.803 | 3229.231 | 3516.553 | 3286.217 | 3230.661 | 3362.265 | 3325.623 | 3412.115 | 3312.633 | 3171.588 | |
| rank | 1 | 12 | 3 | 13 | 2 | 11 | 6 | 4 | 9 | 8 | 10 | 7 | 5 | |
| C17-F29 | mean | 3132.241 | 3319.311 | 3271.941 | 3350.056 | 3201.785 | 3230.335 | 3327.388 | 3201.425 | 3255.274 | 3210.003 | 3324.795 | 3256.025 | 3231.194 |
| best | 3130.076 | 3296.748 | 3203.589 | 3284.088 | 3165.3 | 3167.82 | 3231.425 | 3145.081 | 3188.318 | 3171.072 | 3232.237 | 3166.963 | 3187.085 | |
| worst | 3134.841 | 3338.025 | 3339.466 | 3409.497 | 3242.517 | 3286.216 | 3451.911 | 3275.176 | 3358.691 | 3234.574 | 3575.403 | 3325.321 | 3269.021 | |
| std | 2.701544 | 18.49857 | 76.50848 | 71.09305 | 36.97102 | 52.816 | 100.1385 | 59.0418 | 88.90214 | 30.80604 | 182.3029 | 77.94277 | 38.20256 | |
| median | 3132.023 | 3321.236 | 3272.354 | 3353.32 | 3199.661 | 3233.652 | 3313.107 | 3192.721 | 3237.043 | 3217.183 | 3245.769 | 3265.908 | 3234.335 | |
| rank | 1 | 10 | 9 | 13 | 3 | 5 | 12 | 2 | 7 | 4 | 11 | 8 | 6 | |
| C17-F30 | mean | 3418.734 | 1,986,627 | 302,228.1 | 3,202,386 | 405,175.5 | 57,6521.7 | 900,432 | 309,219.2 | 852,117 | 101,430.5 | 720,781.7 | 381,593.1 | 1,359,456 |
| best | 3394.682 | 1,492,625 | 137,971.4 | 774,684 | 15,639.03 | 169,238 | 61,831.73 | 8355.747 | 30,785.93 | 27,099.55 | 580,958.5 | 8815.27 | 517,597.5 | |
| worst | 3442.907 | 2,767,382 | 716,581 | 4,982,029 | 597,963.4 | 1,116,490 | 3,277,457 | 1,055,327 | 1,226,511 | 145,285.1 | 859,319.6 | 730,649.2 | 2,986,435 | |
| std | 30.22288 | 599,846.9 | 301,967 | 1,923,438 | 287,816.6 | 438,153.6 | 1,725,459 | 543,107.4 | 613,998.1 | 57,560.13 | 126,804 | 430,738.3 | 1,265,501 | |
| median | 3418.673 | 1,843,250 | 177,180.1 | 3,526,415 | 503,549.7 | 510,179.4 | 131,219.7 | 86,597.28 | 1,075,585 | 116,668.6 | 721,424.3 | 393,453.9 | 966,895.8 | |
| rank | 1 | 12 | 3 | 13 | 6 | 7 | 10 | 4 | 9 | 2 | 8 | 5 | 11 | |
| Sum rank | 37 | 319 | 178 | 351 | 107 | 287 | 240 | 117 | 189 | 191 | 240 | 184 | 199 | |
| Mean rank | 1.275862 | 11 | 6.137931 | 12.10345 | 3.689655 | 9.896552 | 8.275862 | 4.034483 | 6.517241 | 6.586207 | 8.275862 | 6.344828 | 6.862069 | |
| Total rank | 1 | 11 | 4 | 12 | 2 | 10 | 9 | 3 | 6 | 7 | 9 | 5 | 8 | |
| GAO | WSO | AVOA | RSA | MPA | TSA | WOA | MVO | GWO | TLBO | GSA | PSO | GA | ||
|---|---|---|---|---|---|---|---|---|---|---|---|---|---|---|
| C17-F1 | mean | 100 | 2.24E+10 | 5830.696 | 3.51E+10 | 26,029.03 | 1.53E+10 | 1.45E+09 | 462,149.6 | 1.42E+09 | 5.27E+09 | 8,970,393 | 1.2E+09 | 1.52E+08 |
| best | 100 | 1.93E+10 | 1944.399 | 3.13E+10 | 11,980.07 | 9.61E+09 | 1.15E+09 | 358,035.1 | 2.35E+08 | 3.33E+09 | 4300.234 | 4659.294 | 1.14E+08 | |
| worst | 100 | 2.81E+10 | 8674.084 | 4.32E+10 | 39,572.94 | 2.08E+10 | 1.8E+09 | 588,039.2 | 4.29E+09 | 7.85E+09 | 31,306,915 | 4.79E+09 | 2.1E+08 | |
| std | 8.93E−15 | 4.44E+09 | 3268.739 | 5.96E+09 | 14,512.44 | 5.72E+09 | 3.66E+08 | 123,857.4 | 2.09E+09 | 2.06E+09 | 16,373,797 | 2.61E+09 | 45,358,470 | |
| median | 100 | 2.12E+10 | 6352.15 | 3.3E+10 | 26,281.55 | 1.54E+10 | 1.43E+09 | 451,262.1 | 5.87E+08 | 4.94E+09 | 2,285,178 | 2,732,577 | 1.43E+08 | |
| rank | 1 | 12 | 2 | 13 | 3 | 11 | 9 | 4 | 8 | 10 | 5 | 7 | 6 | |
| C17-F3 | mean | 300 | 83,231.63 | 38,295.6 | 62,966.84 | 1080.016 | 40,427.18 | 198,100.3 | 1654.42 | 35,704.8 | 29,742.72 | 81,960.49 | 27,361.07 | 142,883.2 |
| best | 300 | 75,990.45 | 20,886.01 | 48,763.59 | 835.6308 | 38,295.97 | 163,903.7 | 1359.797 | 31,222.91 | 25,372.64 | 70,568.25 | 19,591.81 | 108,167.1 | |
| worst | 300 | 91,401.08 | 49,468.55 | 68,418.5 | 1327.762 | 42,603.54 | 227,591 | 2234.118 | 39,845.54 | 32,187.24 | 90,214.39 | 35,088.1 | 198,501.9 | |
| std | 0 | 8274.729 | 13,338.25 | 10,339.67 | 240.5065 | 2328.613 | 28,830.94 | 435.0825 | 3847.771 | 3343.804 | 9653.533 | 7695.205 | 46,670.58 | |
| median | 300 | 82,767.5 | 41,413.91 | 67,342.64 | 1078.334 | 40,404.6 | 200,453.3 | 1511.882 | 35,875.37 | 30,705.5 | 83,529.66 | 27,382.18 | 132,431.9 | |
| rank | 1 | 11 | 7 | 9 | 2 | 8 | 13 | 3 | 6 | 5 | 10 | 4 | 12 | |
| C17-F4 | mean | 458.5616 | 5575.746 | 510.5674 | 8459.244 | 492.1852 | 3951.847 | 802.8511 | 495.2865 | 559.4071 | 846.3066 | 578.9619 | 604.0431 | 764.5042 |
| best | 458.5616 | 3162.415 | 490.1107 | 5447.077 | 481.9965 | 964.989 | 746.8999 | 487.3344 | 514.4662 | 669.0919 | 560.641 | 511.0539 | 719.023 | |
| worst | 458.5616 | 7521.568 | 525.685 | 11,795.17 | 513.3417 | 6521.647 | 870.971 | 509.3757 | 584.941 | 1190.549 | 598.5419 | 764.1292 | 785.5119 | |
| std | 0 | 1966.289 | 16.4318 | 2867.916 | 15.6659 | 2553.534 | 60.90524 | 10.60051 | 33.63155 | 254.441 | 17.40204 | 125.6863 | 33.99235 | |
| median | 458.5616 | 5809.5 | 513.237 | 8297.365 | 486.7013 | 4160.375 | 796.7667 | 492.218 | 569.1106 | 762.7929 | 578.3323 | 570.4947 | 776.7408 | |
| rank | 1 | 12 | 4 | 13 | 2 | 11 | 9 | 3 | 5 | 10 | 6 | 7 | 8 | |
| C17-F5 | mean | 502.4874 | 804.9869 | 702.7953 | 838.5171 | 581.1528 | 761.4417 | 786.479 | 612.1267 | 614.2579 | 741.2772 | 700.5764 | 623.3892 | 683.0927 |
| best | 500.995 | 787.2262 | 670.5593 | 815.5432 | 559.181 | 736.3111 | 758.9541 | 602.1272 | 582.3474 | 719.2387 | 684.4747 | 605.1798 | 643.8764 | |
| worst | 503.9798 | 820.5739 | 755.7975 | 865.0304 | 603.5573 | 787.5596 | 801.0327 | 639.4914 | 638.7938 | 766.5766 | 722.3585 | 665.0013 | 737.5901 | |
| std | 1.397909 | 15.42534 | 41.61819 | 26.24631 | 20.23733 | 25.92504 | 20.39522 | 19.87255 | 30.24951 | 23.8542 | 17.75002 | 30.70363 | 42.73087 | |
| median | 502.4874 | 806.0737 | 692.4122 | 836.7474 | 580.9364 | 760.9481 | 792.9647 | 603.4442 | 617.9452 | 739.6468 | 697.7363 | 611.6878 | 675.4521 | |
| rank | 1 | 12 | 8 | 13 | 2 | 10 | 11 | 3 | 4 | 9 | 7 | 5 | 6 | |
| C17-F6 | mean | 600 | 668.4481 | 640.1894 | 671.1451 | 603.1735 | 666.0123 | 665.3591 | 621.1771 | 610.5213 | 637.3057 | 648.544 | 640.3844 | 626.1082 |
| best | 600 | 667.3664 | 638.4326 | 666.4683 | 601.939 | 652.8759 | 656.1085 | 611.1992 | 604.3109 | 631.0881 | 647.7581 | 629.852 | 620.0473 | |
| worst | 600 | 669.7374 | 642.8848 | 676.7635 | 604.5364 | 673.7459 | 669.9162 | 631.8469 | 616.418 | 647.1292 | 649.5544 | 649.4784 | 630.0802 | |
| std | 7.14E−14 | 1.066492 | 2.110469 | 5.171545 | 1.228254 | 10.61633 | 6.893277 | 10.64413 | 5.433745 | 7.617645 | 0.830897 | 9.48126 | 4.784344 | |
| median | 600 | 668.3442 | 639.7201 | 670.6744 | 603.1092 | 668.7137 | 667.7058 | 620.8312 | 610.6782 | 635.5028 | 648.4318 | 641.1036 | 627.1526 | |
| rank | 1 | 12 | 7 | 13 | 2 | 11 | 10 | 4 | 3 | 6 | 9 | 8 | 5 | |
| C17-F7 | mean | 733.478 | 1228.995 | 1099.712 | 1263.799 | 843.951 | 1165.878 | 1236.662 | 850.2233 | 877.2289 | 1039.196 | 950.1445 | 870.9795 | 946.9537 |
| best | 732.8186 | 1186.202 | 1007.089 | 1248.902 | 817.6154 | 1039.596 | 1201.701 | 801.3773 | 815.1492 | 970.212 | 916.1667 | 849.6304 | 909.8194 | |
| worst | 734.5199 | 1259.268 | 1234.888 | 1290.136 | 896.3808 | 1293.007 | 1302.601 | 911.4905 | 908.4492 | 1103.662 | 1008.406 | 892.354 | 1000.135 | |
| std | 0.820605 | 36.18977 | 110.598 | 19.99462 | 38.76962 | 121.0686 | 50.70099 | 51.45941 | 45.79175 | 77.02059 | 45.68643 | 19.11727 | 41.38543 | |
| median | 733.2867 | 1235.255 | 1078.436 | 1258.078 | 830.9039 | 1165.454 | 1221.173 | 844.0127 | 892.6586 | 1041.454 | 938.0026 | 870.9668 | 938.93 | |
| rank | 1 | 11 | 9 | 13 | 2 | 10 | 12 | 3 | 5 | 8 | 7 | 4 | 6 | |
| C17-F8 | mean | 803.3298 | 1054.375 | 939.0289 | 1086.282 | 888.6842 | 1032.224 | 1007.835 | 891.0273 | 889.8869 | 1001.196 | 949.1516 | 916.8257 | 970.2233 |
| best | 801.2023 | 1042.296 | 914.1188 | 1068.901 | 882.1376 | 995.1895 | 958.6942 | 864.7594 | 883.8931 | 984.9519 | 929.263 | 906.7325 | 955.6456 | |
| worst | 804.1574 | 1071.703 | 957.41 | 1109.377 | 896.6531 | 1121.21 | 1044.586 | 915.7834 | 896.691 | 1030.481 | 971.32 | 930.3388 | 987.7654 | |
| std | 1.546288 | 15.01989 | 21.53442 | 22.05067 | 6.526089 | 65.10001 | 39.86739 | 24.5518 | 5.840703 | 21.82905 | 20.35337 | 11.17469 | 17.18677 | |
| median | 803.9798 | 1051.751 | 942.2934 | 1083.424 | 887.9731 | 1006.249 | 1014.029 | 891.7831 | 889.4817 | 994.6756 | 948.0116 | 915.1158 | 968.7411 | |
| rank | 1 | 12 | 6 | 13 | 2 | 11 | 10 | 4 | 3 | 9 | 7 | 5 | 8 | |
| C17-F9 | mean | 900 | 9515.324 | 4272.211 | 9225.632 | 1079.736 | 9962.829 | 9568.298 | 4810.704 | 1927.55 | 5082.281 | 3636.606 | 3182.606 | 1257.708 |
| best | 900 | 8134.16 | 3187.446 | 9011.84 | 928.9729 | 6111.314 | 7340.205 | 3844.345 | 1477.303 | 3695.543 | 3195.715 | 1970.943 | 1094.368 | |
| worst | 900 | 10,808.32 | 4864.822 | 9356.939 | 1228.385 | 13,414.13 | 11,390.81 | 7265.409 | 2581.598 | 7613.125 | 4353.529 | 4753.266 | 1447.598 | |
| std | 7.14E−14 | 1212.907 | 814.2805 | 161.866 | 150.6155 | 3281.801 | 2223.351 | 1786.248 | 580.2782 | 1928.028 | 561.7954 | 1287.229 | 184.2518 | |
| median | 900 | 9559.408 | 4518.287 | 9266.875 | 1080.793 | 10,162.93 | 9771.089 | 4066.531 | 1825.65 | 4510.228 | 3498.591 | 3003.108 | 1244.433 | |
| rank | 1 | 11 | 7 | 10 | 2 | 13 | 12 | 8 | 4 | 9 | 6 | 5 | 3 | |
| C17-F10 | mean | 2293.267 | 6711.466 | 5199.584 | 7297.233 | 3948.269 | 6147.451 | 6093.07 | 4512.635 | 4631.659 | 7314.039 | 4682.42 | 4846.696 | 5790.657 |
| best | 1851.756 | 6257.175 | 4542.675 | 6605.22 | 3601.53 | 4997.117 | 5353.014 | 4231.179 | 4212.362 | 6960.446 | 4431.502 | 4657.101 | 5397.511 | |
| worst | 2525.027 | 7003.829 | 5653.819 | 7857.574 | 4375.692 | 6681.464 | 7277.149 | 4817.147 | 4957.496 | 7486.531 | 5057.283 | 5215.581 | 6319.118 | |
| std | 326.8979 | 348.455 | 562.337 | 566.1807 | 388.8296 | 843.4916 | 936.7337 | 300.4517 | 340.3693 | 261.3508 | 301.6935 | 272.724 | 472.6668 | |
| median | 2398.142 | 6792.43 | 5300.922 | 7363.07 | 3907.926 | 6455.611 | 5871.057 | 4501.106 | 4678.389 | 7404.589 | 4620.448 | 4757.052 | 5723.001 | |
| rank | 1 | 11 | 7 | 12 | 2 | 10 | 9 | 3 | 4 | 13 | 5 | 6 | 8 | |
| C17-F11 | mean | 1102.987 | 6588.648 | 1243.679 | 7700.281 | 1168.172 | 4557.763 | 6855.893 | 1291.932 | 2045.681 | 1868.273 | 2647.571 | 1236.428 | 8014.356 |
| best | 1100.995 | 5445.541 | 1190.234 | 6294.032 | 1121.752 | 3286.896 | 4977.714 | 1249.106 | 1356.107 | 1531.097 | 2080.833 | 1210.801 | 3047.23 | |
| worst | 1105.977 | 7524.423 | 1292.976 | 8649.705 | 1200.997 | 6797.836 | 10,068.8 | 1331.2 | 3882.607 | 2497.356 | 3226.279 | 1262.525 | 14,907.23 | |
| std | 2.342568 | 993.8017 | 46.63589 | 1174.213 | 37.26024 | 1718.502 | 2416.292 | 48.66841 | 1334.469 | 466.8468 | 586.8497 | 24.95497 | 5531.35 | |
| median | 1102.487 | 6692.315 | 1245.752 | 7928.694 | 1174.97 | 4073.161 | 6188.529 | 1293.712 | 1472.005 | 1722.319 | 2641.587 | 1236.193 | 7051.482 | |
| rank | 1 | 10 | 4 | 12 | 2 | 9 | 11 | 5 | 7 | 6 | 8 | 3 | 13 | |
| C17-F12 | mean | 1744.553 | 6.02E+09 | 17,863,386 | 9.34E+09 | 21,141.86 | 4.34E+09 | 2.12E+08 | 9,618,730 | 45,007,811 | 2.59E+08 | 1.71E+08 | 2,197,963 | 6,585,298 |
| best | 1721.81 | 4.97E+09 | 2,515,715 | 8.33E+09 | 15,112.24 | 2.24E+09 | 54,247,868 | 4,467,693 | 4,371,684 | 1.65E+08 | 32,963,915 | 240,110 | 4,560,763 | |
| worst | 1764.937 | 7.64E+09 | 43,624,026 | 1.18E+10 | 26,966.2 | 5.68E+09 | 4.23E+08 | 23,269,434 | 94,380,138 | 4.49E+08 | 5.45E+08 | 4,367,235 | 8,619,582 | |
| std | 21.9323 | 1.24E+09 | 19,693,155 | 1.77E+09 | 5497.114 | 1.62E+09 | 1.85E+08 | 9,919,151 | 42,706,241 | 1.4E+08 | 2.72E+08 | 1,937,243 | 2,003,322 | |
| median | 1745.733 | 5.73E+09 | 12,656,901 | 8.64E+09 | 21,244.5 | 4.73E+09 | 1.85E+08 | 5,368,897 | 40,639,712 | 2.1E+08 | 52,257,988 | 2,092,253 | 6,580,423 | |
| rank | 1 | 12 | 6 | 13 | 2 | 11 | 9 | 5 | 7 | 10 | 8 | 3 | 4 | |
| C17-F13 | mean | 1315.791 | 4.89E+09 | 128,357.7 | 9.03E+09 | 1875.226 | 1.25E+09 | 774,665.8 | 78,141.05 | 646,635.7 | 75,500,364 | 31,494.84 | 27,975.88 | 10,201,641 |
| best | 1314.587 | 2.38E+09 | 71,240.8 | 4.74E+09 | 1607.384 | 16,892,010 | 365,628.3 | 31,432.53 | 78,361.26 | 52,431,398 | 25,563.03 | 11,712.82 | 2,768,082 | |
| worst | 1318.646 | 6.85E+09 | 202,845.2 | 1.11E+10 | 2399.919 | 4.35E+09 | 1,145,245 | 156,691.7 | 2,006,033 | 1.11E+08 | 46,031.26 | 62,954.17 | 21,943,429 | |
| std | 2.107258 | 2.01E+09 | 59,484.26 | 3.16E+09 | 389.8455 | 2.27E+09 | 442,347.8 | 63,996.54 | 999,080.8 | 27,735,110 | 10,663.11 | 25,672.39 | 8,943,170 | |
| median | 1314.967 | 5.17E+09 | 119,672.5 | 1.01E+10 | 1746.801 | 3.23E+08 | 793,895 | 62,219.97 | 251,074.4 | 69,119,457 | 27,192.53 | 18,618.27 | 8,047,527 | |
| rank | 1 | 12 | 6 | 13 | 2 | 11 | 8 | 5 | 7 | 10 | 4 | 3 | 9 | |
| C17-F14 | mean | 1423.017 | 1,620,883 | 232,138.6 | 1,878,343 | 1439.96 | 1,004,611 | 1,901,641 | 17,597.69 | 456,074.8 | 119,821 | 978,295.3 | 16,252.17 | 1,716,822 |
| best | 1422.014 | 999,618.1 | 32,641.8 | 944,177.7 | 1436.666 | 718,913.2 | 30,911.57 | 4476.323 | 29,593.77 | 69,721.47 | 634,875.7 | 2922.639 | 284,338.6 | |
| worst | 1423.993 | 2,051,782 | 537,168.9 | 2,796,941 | 1444.619 | 1,419,165 | 5,808,995 | 29,816.42 | 977,253.7 | 137,833.3 | 1,476,990 | 29,507.03 | 2,894,290 | |
| std | 0.87954 | 535,959.6 | 242,266.2 | 969,969.9 | 3.964006 | 349,745.9 | 2,887,685 | 11,878.97 | 523,579.8 | 36,363.11 | 431,297.5 | 12,638.36 | 1,310,027 | |
| median | 1423.03 | 1,716,065 | 179,371.8 | 1,886,126 | 1439.277 | 940,183.2 | 883,327.9 | 18,049.02 | 408,725.8 | 135,864.6 | 900,657.9 | 16,289.51 | 1,844,330 | |
| rank | 1 | 10 | 6 | 12 | 2 | 9 | 13 | 4 | 7 | 5 | 8 | 3 | 11 | |
| C17-F15 | mean | 1503.129 | 2.6E+08 | 32,238.74 | 5.11E+08 | 1615.842 | 12,285,162 | 4,311,392 | 36,795.69 | 13,526,091 | 4,387,752 | 13,965.85 | 4316.719 | 816,946.7 |
| best | 1502.462 | 2.25E+08 | 9568.865 | 4.41E+08 | 1579.303 | 4,839,717 | 198,819.8 | 21,398.4 | 84,202.47 | 996,467.3 | 9982.633 | 1863.552 | 150,141 | |
| worst | 1504.265 | 2.88E+08 | 52,213.63 | 5.64E+08 | 1632.203 | 28,577,478 | 13,998,112 | 60,719.59 | 50,643,212 | 8,259,350 | 18,859.25 | 7827.492 | 1,830,094 | |
| std | 0.931104 | 33,963,783 | 19,599.84 | 65,714,951 | 26.71831 | 11,924,974 | 7,123,977 | 18,547.3 | 26,943,033 | 3,240,985 | 4038.215 | 2873.981 | 836,631.2 | |
| median | 1502.893 | 2.64E+08 | 33,586.24 | 5.19E+08 | 1625.931 | 7,861,726 | 1,524,317 | 32,532.39 | 1,688,475 | 4,147,596 | 13,510.76 | 3787.916 | 643,775.8 | |
| rank | 1 | 12 | 5 | 13 | 2 | 10 | 8 | 6 | 11 | 9 | 4 | 3 | 7 | |
| C17-F16 | mean | 1663.469 | 3976.13 | 2850.193 | 4538.035 | 2018.075 | 3081.824 | 3912.824 | 2497.509 | 2459.731 | 3246.375 | 3418.88 | 2790.369 | 2806.553 |
| best | 1614.72 | 3677.136 | 2498.276 | 3857.04 | 1729.78 | 2684.641 | 3280.597 | 2281.547 | 2296.23 | 3046.042 | 3224.039 | 2566.73 | 2476.202 | |
| worst | 1744.118 | 4228.361 | 3313.751 | 5153.785 | 2265.618 | 3317.831 | 4670.899 | 2689.547 | 2594.452 | 3477.372 | 3554.178 | 3046.454 | 3136.355 | |
| std | 67.44425 | 260.6856 | 370.1947 | 729.5955 | 262.3233 | 301.4003 | 627.3598 | 194.6654 | 161.2045 | 207.3804 | 160.5896 | 243.2084 | 346.6029 | |
| median | 1647.519 | 3999.511 | 2794.373 | 4570.657 | 2038.452 | 3162.412 | 3849.901 | 2509.47 | 2474.121 | 3231.043 | 3448.651 | 2774.146 | 2806.828 | |
| rank | 1 | 12 | 7 | 13 | 2 | 8 | 11 | 4 | 3 | 9 | 10 | 5 | 6 | |
| C17-F17 | mean | 1728.099 | 3184.02 | 2385.059 | 3444.454 | 1861.554 | 3068.849 | 2705.694 | 2048.793 | 1922.204 | 2146.088 | 2427.883 | 2266.784 | 2113.355 |
| best | 1718.761 | 2670.362 | 2263.79 | 3120.014 | 1753.291 | 2170.082 | 2296.654 | 1992.226 | 1798.016 | 1954.46 | 2328.457 | 2067.577 | 2068.723 | |
| worst | 1733.659 | 3809.326 | 2471.165 | 4025.836 | 1921.879 | 5414.867 | 2971.642 | 2181.755 | 2057.325 | 2387.679 | 2561.329 | 2612.166 | 2177.383 | |
| std | 7.30039 | 526.9921 | 100.2765 | 449.8941 | 80.94562 | 1704.675 | 316.43 | 97.00013 | 131.8202 | 199.0191 | 120.9462 | 266.3502 | 53.95218 | |
| median | 1729.987 | 3128.196 | 2402.64 | 3315.983 | 1885.523 | 2345.223 | 2777.24 | 2010.594 | 1916.738 | 2121.107 | 2410.873 | 2193.697 | 2103.656 | |
| rank | 1 | 12 | 8 | 13 | 2 | 11 | 10 | 4 | 3 | 6 | 9 | 7 | 5 | |
| C17-F18 | mean | 1825.696 | 24,287,534 | 2,263,992 | 27,925,543 | 1895.059 | 31,053,715 | 5,043,241 | 547,132.2 | 358,761.7 | 1,423,873 | 440,293.8 | 117,519 | 3,115,606 |
| best | 1822.524 | 6,996,614 | 241,331.5 | 9,028,538 | 1873.011 | 1,138,972 | 1,699,708 | 137,877.9 | 67,292.89 | 661,159.2 | 246,961.1 | 83,697.64 | 2,432,402 | |
| worst | 1828.42 | 47,167,452 | 4,516,915 | 54,862,462 | 1907.868 | 58,848,115 | 10,408,932 | 1,480,690 | 921,379.6 | 1,790,003 | 857,003.1 | 139,389 | 4,566,779 | |
| std | 2.940513 | 19,326,659 | 2,180,757 | 21,151,997 | 17.03125 | 34,876,427 | 4,073,042 | 681,637.6 | 437,442.1 | 564,848.5 | 306,279.1 | 26,498.85 | 1,064,963 | |
| median | 1825.92 | 21,493,035 | 2,148,860 | 23,905,585 | 1899.679 | 32,113,887 | 4,032,162 | 284,980.2 | 223,187.3 | 1,622,165 | 328,605.4 | 123,494.6 | 2,731,622 | |
| rank | 1 | 11 | 8 | 12 | 2 | 13 | 10 | 6 | 4 | 7 | 5 | 3 | 9 | |
| C17-F19 | mean | 1910.989 | 4.96E+08 | 58,126.47 | 8.37E+08 | 1923.509 | 2.52E+08 | 12,243,666 | 803,041 | 3,446,841 | 4,915,042 | 70,150.44 | 38,301.8 | 1,385,589 |
| best | 1908.84 | 3.71E+08 | 12,610.39 | 6.04E+08 | 1920.961 | 3,125,025 | 1,593,445 | 20,530.54 | 60,786.57 | 2,551,343 | 38,175.1 | 7765.051 | 547,648.4 | |
| worst | 1913.095 | 6.46E+08 | 129,139.1 | 1.27E+09 | 1928.282 | 6.97E+08 | 21,141,224 | 1,805,173 | 11,114,255 | 6,986,559 | 94,307.98 | 114,161.1 | 2,461,289 | |
| std | 2.10261 | 1.5E+08 | 55,242.46 | 3.2E+08 | 3.557655 | 3.49E+08 | 9,701,357 | 945,184 | 5,600,908 | 2,374,247 | 25,431.89 | 55,229.08 | 878,355.7 | |
| median | 1911.01 | 4.84E+08 | 45,378.18 | 7.37E+08 | 1922.396 | 1.53E+08 | 13,119,997 | 693,230.5 | 1,306,161 | 5,061,133 | 74,059.34 | 15,640.51 | 1,266,709 | |
| rank | 1 | 12 | 4 | 13 | 2 | 11 | 10 | 6 | 8 | 9 | 5 | 3 | 7 | |
| C17-F20 | mean | 2065.787 | 2796.248 | 2569.721 | 2842.618 | 2174.505 | 2754.131 | 2743.498 | 2543.502 | 2345.481 | 2709.577 | 2891.383 | 2493.68 | 2431.832 |
| best | 2029.521 | 2717.077 | 2435.499 | 2688.781 | 2060.52 | 2632.945 | 2579.927 | 2330.185 | 2181.405 | 2644.37 | 2572.029 | 2447.954 | 2375.804 | |
| worst | 2161.126 | 2880.76 | 2758.187 | 2923.577 | 2263.092 | 2870.725 | 2902.416 | 2905.285 | 2492.129 | 2815.418 | 3316.121 | 2610.098 | 2471.322 | |
| std | 69.26656 | 72.88532 | 151.0366 | 116.0351 | 92.04375 | 106.7938 | 148.3052 | 272.6655 | 138.6492 | 86.75523 | 340.1559 | 84.99863 | 44.58253 | |
| median | 2036.25 | 2793.577 | 2542.599 | 2879.058 | 2187.204 | 2756.427 | 2745.823 | 2469.269 | 2354.195 | 2689.26 | 2838.691 | 2458.335 | 2440.101 | |
| rank | 1 | 11 | 7 | 12 | 2 | 10 | 9 | 6 | 3 | 8 | 13 | 5 | 4 | |
| C17-F21 | mean | 2308.456 | 2586.112 | 2429.733 | 2635.523 | 2365.407 | 2510.732 | 2575.654 | 2398.876 | 2385.776 | 2476.648 | 2541.079 | 2424.19 | 2474.167 |
| best | 2304.034 | 2503.828 | 2239.133 | 2566.699 | 2355.832 | 2313.975 | 2511.033 | 2367.311 | 2357.335 | 2464.956 | 2524.504 | 2406.825 | 2444.909 | |
| worst | 2312.987 | 2639.649 | 2565.011 | 2717.666 | 2381.228 | 2626.13 | 2631.429 | 2423.678 | 2398.434 | 2485.83 | 2571.965 | 2437.464 | 2519.797 | |
| std | 4.852783 | 70.34927 | 149.177 | 71.48777 | 12.14978 | 150.3418 | 65.13148 | 25.54739 | 21.14649 | 11.60673 | 22.98087 | 15.86086 | 34.85109 | |
| median | 2308.402 | 2600.486 | 2457.394 | 2628.864 | 2362.283 | 2551.411 | 2580.077 | 2402.257 | 2393.667 | 2477.902 | 2533.924 | 2426.235 | 2465.981 | |
| rank | 1 | 12 | 6 | 13 | 2 | 9 | 11 | 4 | 3 | 8 | 10 | 5 | 7 | |
| C17-F22 | mean | 2300 | 7197.735 | 5291.965 | 6988.536 | 2302.872 | 7878.421 | 6699.701 | 3725.871 | 2648.451 | 5216.932 | 5770.482 | 4527.268 | 2646.874 |
| best | 2300 | 6905.286 | 2302.895 | 6100.795 | 2301.873 | 7679.199 | 5875.195 | 2305.955 | 2536.943 | 2665.425 | 3766.123 | 2436.13 | 2582.523 | |
| worst | 2300 | 7653.951 | 6446.791 | 7880.646 | 2304.558 | 7972.315 | 7435.194 | 5489.079 | 2877.381 | 8045.799 | 6651.321 | 6550.838 | 2696.642 | |
| std | 0 | 348.1898 | 2172.161 | 832.4763 | 1.310487 | 149.9847 | 705.559 | 1809.434 | 169.3872 | 3188.216 | 1463.762 | 2059.341 | 61.57958 | |
| median | 2300 | 7115.851 | 6209.087 | 6986.352 | 2302.528 | 7931.085 | 6744.208 | 3554.226 | 2589.739 | 5078.252 | 6332.241 | 4561.053 | 2654.166 | |
| rank | 1 | 12 | 8 | 11 | 2 | 13 | 10 | 5 | 4 | 7 | 9 | 6 | 3 | |
| C17-F23 | mean | 2655.081 | 3119.093 | 2889.696 | 3166.646 | 2646.19 | 3123.314 | 2993.881 | 2725.509 | 2737.411 | 2869.741 | 3618.178 | 2866.813 | 2931.68 |
| best | 2653.745 | 3052.69 | 2774.059 | 3125.186 | 2474.16 | 3028.342 | 2848.34 | 2694.373 | 2710.109 | 2830.903 | 3532.397 | 2816.976 | 2885.392 | |
| worst | 2657.377 | 3197.28 | 3047.49 | 3213.919 | 2711.793 | 3301.686 | 3087.77 | 2740.845 | 2761.013 | 2920.587 | 3703.143 | 2919.204 | 2994.691 | |
| std | 1.79918 | 69.32291 | 126.5441 | 41.69167 | 125.1344 | 132.9871 | 111.362 | 23.13598 | 24.97449 | 41.08474 | 98.87545 | 47.85622 | 49.70222 | |
| median | 2654.6 | 3113.202 | 2868.617 | 3163.74 | 2699.404 | 3081.615 | 3019.707 | 2733.409 | 2739.261 | 2863.737 | 3618.585 | 2865.536 | 2923.318 | |
| rank | 2 | 10 | 7 | 12 | 1 | 11 | 9 | 3 | 4 | 6 | 13 | 5 | 8 | |
| C17-F24 | mean | 2831.409 | 3257.436 | 3132.252 | 3344.225 | 2882.957 | 3227.736 | 3085.012 | 2902.245 | 2915.402 | 3020.71 | 3299.939 | 3097.741 | 3180.377 |
| best | 2829.992 | 3222.637 | 3012.473 | 3264.802 | 2867.506 | 3133.14 | 3030.05 | 2861.253 | 2905.338 | 2998.261 | 3265.898 | 3029.904 | 3098.613 | |
| worst | 2832.366 | 3326.504 | 3265.163 | 3479.85 | 2889.738 | 3273.031 | 3108.048 | 2920.182 | 2922.286 | 3053.136 | 3333.143 | 3197.142 | 3247.25 | |
| std | 1.246718 | 50.93461 | 120.9993 | 107.6055 | 11.36076 | 70.91674 | 40.20797 | 29.98429 | 8.273703 | 25.17521 | 32.17397 | 77.64043 | 75.42338 | |
| median | 2831.64 | 3240.301 | 3125.686 | 3316.123 | 2887.292 | 3252.387 | 3100.975 | 2913.773 | 2916.991 | 3015.721 | 3300.357 | 3081.959 | 3187.823 | |
| rank | 1 | 11 | 8 | 13 | 2 | 10 | 6 | 3 | 4 | 5 | 12 | 7 | 9 | |
| C17-F25 | mean | 2886.698 | 3800.088 | 2906.312 | 4342.239 | 2891.222 | 3392.322 | 3056.359 | 2907.023 | 2979.636 | 3050.164 | 2981.487 | 2894.406 | 3078.72 |
| best | 2886.691 | 3473.964 | 2893.165 | 3818.698 | 2884.561 | 3063.681 | 3023.9 | 2886.114 | 2945.826 | 2945.791 | 2970.645 | 2887.224 | 3063.826 | |
| worst | 2886.707 | 4043.769 | 2939.912 | 5039.77 | 2897.338 | 3732.374 | 3073.082 | 2961.847 | 3041.478 | 3168.502 | 2993.113 | 2910.1 | 3089.885 | |
| std | 0.008278 | 258.9364 | 24.42658 | 553.4353 | 6.284407 | 355.6964 | 25.12833 | 39.88302 | 48.18031 | 116.3059 | 10.12724 | 11.48927 | 12.25239 | |
| median | 2886.698 | 3841.309 | 2896.085 | 4255.243 | 2891.495 | 3386.617 | 3064.226 | 2890.065 | 2965.62 | 3043.182 | 2981.095 | 2890.151 | 3080.585 | |
| rank | 1 | 12 | 4 | 13 | 2 | 11 | 9 | 5 | 6 | 8 | 7 | 3 | 10 | |
| C17-F26 | mean | 3578.65 | 8348.562 | 6747.9 | 8857.441 | 2959.894 | 7963.37 | 7654.154 | 4548.82 | 4356.689 | 5532.353 | 6873.735 | 4601.941 | 4208.71 |
| best | 3559.841 | 7978.641 | 5633.769 | 8131.148 | 2958.088 | 7389.984 | 7017.352 | 4248.451 | 4014.143 | 4334.846 | 5962.246 | 3474.557 | 3875.117 | |
| worst | 3607.686 | 9012.359 | 7403.174 | 10,142.89 | 2962.551 | 8325.199 | 8394.322 | 5096.284 | 4887.213 | 6669.677 | 7348.178 | 5942.959 | 4617.04 | |
| std | 24.78775 | 524.3091 | 846.9994 | 1027.892 | 2.329347 | 436.4335 | 615.4601 | 428.6104 | 405.4909 | 1164.857 | 703.2545 | 1254.391 | 338.6951 | |
| median | 3573.536 | 8201.625 | 6977.328 | 8577.864 | 2959.47 | 8069.148 | 7602.471 | 4425.273 | 4262.7 | 5562.445 | 7092.259 | 4495.123 | 4171.342 | |
| rank | 2 | 12 | 8 | 13 | 1 | 11 | 10 | 5 | 4 | 7 | 9 | 6 | 3 | |
| C17-F27 | mean | 3207.018 | 3557.859 | 3336.614 | 3692.551 | 3214.516 | 3439.143 | 3399.203 | 3229.081 | 3245.065 | 3304.138 | 4738.265 | 3270.064 | 3427.096 |
| best | 3200.749 | 3504.742 | 3259.845 | 3447.597 | 3200.701 | 3325.41 | 3252.487 | 3213.263 | 3239.732 | 3239.46 | 4345.466 | 3234.937 | 3360.528 | |
| worst | 3210.656 | 3647.653 | 3401.068 | 3944.515 | 3234.537 | 3654.379 | 3507.364 | 3250.664 | 3256.4 | 3367.534 | 5025.606 | 3307.487 | 3464.856 | |
| std | 5.058229 | 69.40237 | 81.40933 | 231.9974 | 16.86964 | 160.4216 | 118.7568 | 17.15178 | 8.322647 | 57.63497 | 362.1397 | 33.46625 | 49.7926 | |
| median | 3208.335 | 3539.521 | 3342.771 | 3689.047 | 3211.413 | 3388.391 | 3418.481 | 3226.198 | 3242.063 | 3304.78 | 4790.994 | 3268.916 | 3441.501 | |
| rank | 1 | 11 | 7 | 12 | 2 | 10 | 8 | 3 | 4 | 6 | 13 | 5 | 9 | |
| C17-F28 | mean | 3100 | 4571.047 | 3257.514 | 5360.196 | 3212.502 | 4031.57 | 3407.388 | 3249.529 | 3545.039 | 3607.884 | 3479.289 | 3312.468 | 3532.676 |
| best | 3100 | 4364.764 | 3228.668 | 5089.878 | 3196.105 | 3546.402 | 3354.006 | 3217.768 | 3371.526 | 3476.923 | 3416.993 | 3195.173 | 3485.352 | |
| worst | 3100 | 4796.882 | 3289.077 | 5645.616 | 3242.413 | 4524.153 | 3454.018 | 3276.914 | 3966.099 | 3904.816 | 3607.994 | 3495.259 | 3585.531 | |
| std | 2.86E−13 | 201.1901 | 26.93721 | 288.6574 | 22.52248 | 493.922 | 48.42336 | 26.91766 | 307.589 | 218.2223 | 94.7696 | 151.3715 | 51.32503 | |
| median | 3100 | 4561.271 | 3256.155 | 5352.645 | 3205.744 | 4027.863 | 3410.765 | 3251.717 | 3421.266 | 3524.899 | 3446.085 | 3279.72 | 3529.911 | |
| rank | 1 | 12 | 4 | 13 | 2 | 11 | 6 | 3 | 9 | 10 | 7 | 5 | 8 | |
| C17-F29 | mean | 3353.75 | 5165.165 | 4238.483 | 5356.041 | 3653.907 | 5027.779 | 4894.057 | 3814.832 | 3769.346 | 4394.082 | 4873.204 | 4097.12 | 4200.257 |
| best | 3325.385 | 4781.032 | 3925.131 | 4815.572 | 3502.249 | 4549.384 | 4640.711 | 3697.589 | 3678.852 | 4101.821 | 4617.358 | 3940.75 | 3860.919 | |
| worst | 3370.797 | 5597.427 | 4432.861 | 6103.185 | 3791.683 | 5814.268 | 5060.487 | 3902.269 | 3867.5 | 4822.173 | 5105.334 | 4318.126 | 4492.071 | |
| std | 21.42746 | 430.9386 | 247.3722 | 699.807 | 139.048 | 639.3948 | 194.8489 | 97.52882 | 87.40834 | 336.9599 | 272.1672 | 172.6724 | 311.0435 | |
| median | 3359.41 | 5141.101 | 4297.97 | 5252.703 | 3660.848 | 4873.732 | 4937.515 | 3829.735 | 3765.517 | 4326.167 | 4885.062 | 4064.802 | 4224.02 | |
| rank | 1 | 12 | 7 | 13 | 2 | 11 | 10 | 4 | 3 | 8 | 9 | 5 | 6 | |
| C17-F30 | mean | 5007.854 | 1.23E+09 | 1,226,561 | 2.43E+09 | 7628.457 | 33,024,519 | 33,699,582 | 2,659,152 | 5,482,512 | 32,533,736 | 1,945,470 | 235,225.1 | 604,275.2 |
| best | 4955.449 | 9.06E+08 | 433,022.5 | 1.74E+09 | 6346.969 | 11,291,100 | 6,721,212 | 478,549.6 | 1,223,756 | 17,415,442 | 1,698,234 | 7391.654 | 167,926.1 | |
| worst | 5086.396 | 1.35E+09 | 2,171,246 | 2.68E+09 | 10,132.67 | 77,162,996 | 54,000,073 | 3,806,634 | 14,803,056 | 68,241,237 | 2,340,871 | 887,651.6 | 1,155,344 | |
| std | 64.18196 | 2.36E+08 | 790,932.4 | 4.97E+08 | 1930.5 | 32,540,981 | 21,448,199 | 1,615,422 | 6,825,432 | 26,053,037 | 301,100 | 473,587.2 | 523,179.4 | |
| median | 4994.785 | 1.33E+09 | 1,150,987 | 2.64E+09 | 7017.094 | 21,821,990 | 37,038,521 | 3,175,713 | 2,951,619 | 22,239,133 | 1,871,388 | 22,928.54 | 546,915.6 | |
| rank | 1 | 12 | 5 | 13 | 2 | 10 | 11 | 7 | 8 | 9 | 6 | 3 | 4 | |
| Sum rank | 31 | 334 | 182 | 361 | 57 | 305 | 284 | 128 | 151 | 232 | 231 | 139 | 204 | |
| Mean rank | 1.068966 | 11.51724 | 6.275862 | 12.44828 | 1.965517 | 10.51724 | 9.793103 | 4.413793 | 5.206897 | 8 | 7.965517 | 4.793103 | 7.034483 | |
| Total rank | 1 | 12 | 6 | 13 | 2 | 11 | 10 | 3 | 5 | 9 | 8 | 4 | 7 | |
| GAO | WSO | AVOA | RSA | MPA | TSA | WOA | MVO | GWO | TLBO | GSA | PSO | GA | ||
|---|---|---|---|---|---|---|---|---|---|---|---|---|---|---|
| C17-F1 | mean | 100 | 5.09E+10 | 8,540,548 | 7.98E+10 | 5,463,321 | 3.24E+10 | 6.56E+09 | 4,128,914 | 7.97E+09 | 1.77E+10 | 1.46E+10 | 2.16E+09 | 8.86E+09 |
| best | 100 | 4.55E+10 | 1,215,225 | 6.98E+10 | 2,108,552 | 2.99E+10 | 3.87E+09 | 2,756,506 | 5.74E+09 | 1.2E+10 | 1.16E+10 | 8.85E+08 | 8.44E+09 | |
| worst | 100 | 5.45E+10 | 21,279,391 | 8.72E+10 | 13,852,712 | 3.49E+10 | 9.82E+09 | 5,284,968 | 1.09E+10 | 2.39E+10 | 1.75E+10 | 2.88E+09 | 9.54E+09 | |
| std | 0 | 4.35E+09 | 9,547,461 | 8.27E+09 | 6,130,610 | 2.27E+09 | 3.06E+09 | 1,169,138 | 2.34E+09 | 6.24E+09 | 2.59E+09 | 9.53E+08 | 5.65E+08 | |
| median | 100 | 5.19E+10 | 5,833,788 | 8.11E+10 | 2,946,011 | 3.25E+10 | 6.28E+09 | 4,237,091 | 7.61E+09 | 1.74E+10 | 1.46E+10 | 2.44E+09 | 8.73E+09 | |
| rank | 1 | 12 | 4 | 13 | 3 | 11 | 6 | 2 | 7 | 10 | 9 | 5 | 8 | |
| C17-F3 | mean | 300 | 137,010.9 | 126,882.3 | 136,511.5 | 17,391.76 | 95,002.13 | 201,272.3 | 41,494.88 | 112,747.5 | 85,794.71 | 153,610.6 | 125,333.9 | 226,348.9 |
| best | 300 | 117,906.7 | 97,696.29 | 124,125.1 | 15,025.04 | 83,816.75 | 152,134.7 | 33,432.18 | 99,401.38 | 65,216.63 | 139,017.6 | 94,437.17 | 188,829.6 | |
| worst | 300 | 157,634.1 | 153,730.6 | 148,328 | 20,524.62 | 101,529.7 | 306,297.4 | 51,471.59 | 126,680.5 | 97,304.28 | 172,990.6 | 162,490.2 | 259,863.3 | |
| std | 0 | 18,198.32 | 274,92.83 | 11,628.69 | 2686.645 | 8787.683 | 78,962.98 | 8212.567 | 12,134.77 | 16,021.99 | 18,038.98 | 32,119.68 | 31,660.35 | |
| median | 300 | 136,251.3 | 128,051.1 | 136,796.5 | 17,008.7 | 97,331.05 | 173,328.5 | 40,537.89 | 112,454.1 | 90,328.97 | 151,217 | 122,204 | 228,351.4 | |
| rank | 1 | 10 | 8 | 9 | 2 | 5 | 12 | 3 | 6 | 4 | 11 | 7 | 13 | |
| C17-F4 | mean | 470.3679 | 12,640.05 | 670.9189 | 20,297.76 | 529.2201 | 7151.718 | 1728.284 | 556.4852 | 1299.368 | 2455.851 | 2684.969 | 941.9422 | 1375.405 |
| best | 428.5127 | 9836.365 | 654.6081 | 13,423.73 | 493.8869 | 5740.654 | 1128.951 | 520.5781 | 981.7953 | 1417.507 | 2250.684 | 654.6616 | 1194.41 | |
| worst | 525.7252 | 14,388.37 | 689.3209 | 24,235.9 | 581.4109 | 9217.082 | 2051.556 | 618.0226 | 1569.432 | 4151.915 | 2849.68 | 1617.781 | 1483.827 | |
| std | 53.9489 | 2214.027 | 18.01175 | 5368.95 | 44.6304 | 1598.366 | 449.3558 | 46.63019 | 289.3042 | 1307.92 | 316.5375 | 492.8826 | 138.0845 | |
| median | 463.6168 | 13,167.74 | 669.8733 | 21,765.71 | 520.7913 | 6824.568 | 1866.314 | 543.6699 | 1323.123 | 2126.992 | 2819.756 | 747.663 | 1411.692 | |
| rank | 1 | 12 | 4 | 13 | 2 | 11 | 8 | 3 | 6 | 9 | 10 | 5 | 7 | |
| C17-F5 | mean | 504.7261 | 1037.655 | 832.0331 | 1062.51 | 728.5695 | 1077.7 | 915.4502 | 730.7567 | 719.4511 | 951.9034 | 788.0505 | 773.5328 | 860.9533 |
| best | 503.9798 | 1009.534 | 796.5431 | 1053.971 | 649.5934 | 956.2157 | 883.3966 | 658.6571 | 686.5838 | 906.6592 | 733.7376 | 717.5713 | 825.7998 | |
| worst | 505.9698 | 1062.384 | 874.7422 | 1070.73 | 790.4663 | 1164.931 | 937.424 | 834.3487 | 751.0828 | 977.7863 | 821.9891 | 830.6777 | 884.0127 | |
| std | 1.036717 | 27.61624 | 36.05762 | 7.545912 | 64.31447 | 111.7325 | 28.62198 | 84.28709 | 34.43552 | 34.26955 | 45.11241 | 50.26869 | 28.8839 | |
| median | 504.4773 | 1039.35 | 828.4235 | 1062.669 | 737.1091 | 1094.826 | 920.4901 | 715.0105 | 720.069 | 961.584 | 798.2378 | 772.9411 | 867.0004 | |
| rank | 1 | 11 | 7 | 12 | 3 | 13 | 9 | 4 | 2 | 10 | 6 | 5 | 8 | |
| C17-F6 | mean | 600 | 681.9603 | 652.3174 | 683.7161 | 610.9482 | 677.4992 | 684.2625 | 633.2341 | 620.654 | 655.7374 | 650.412 | 646.7268 | 642.4574 |
| best | 600 | 679.4617 | 648.6703 | 681.4595 | 608.2624 | 660.2885 | 679.3851 | 624.4301 | 615.8844 | 644.814 | 645.9264 | 644.6453 | 631.948 | |
| worst | 600 | 686.6001 | 656.7956 | 686.2413 | 614.4981 | 692.0708 | 691.2724 | 653.6353 | 628.6895 | 663.5099 | 653.3149 | 649.7848 | 652.834 | |
| std | 0 | 3.618989 | 4.092498 | 2.496933 | 2.906614 | 15.27414 | 5.509322 | 15.03081 | 6.167687 | 8.616449 | 3.484165 | 2.621147 | 9.547808 | |
| median | 600 | 680.8897 | 651.9018 | 683.5817 | 610.5162 | 678.8188 | 683.1963 | 627.4354 | 619.021 | 657.3128 | 651.2033 | 646.2385 | 642.5239 | |
| rank | 1 | 11 | 8 | 12 | 2 | 10 | 13 | 4 | 3 | 9 | 7 | 6 | 5 | |
| C17-F7 | mean | 756.7298 | 1667.515 | 1560.123 | 1752.153 | 1019.514 | 1574.269 | 1595.787 | 1040.812 | 1050.837 | 1401.142 | 1343.727 | 1164.307 | 1255.661 |
| best | 754.7543 | 1651.905 | 1504.114 | 1689.052 | 964.5631 | 1449.444 | 1546.801 | 1005.244 | 1024.421 | 1289.8 | 1193.977 | 1033.213 | 1194.715 | |
| worst | 758.3522 | 1687.845 | 1622.18 | 1844.419 | 1066.022 | 1694.582 | 1666.003 | 1072.362 | 1072.624 | 1446.958 | 1459.1 | 1355.126 | 1292.502 | |
| std | 1.69049 | 16.27905 | 54.23613 | 74.30205 | 53.48986 | 127.8245 | 59.26941 | 29.9404 | 24.75606 | 81.06107 | 127.8115 | 152.3713 | 47.12675 | |
| median | 756.9065 | 1665.154 | 1557.099 | 1737.571 | 1023.735 | 1576.525 | 1585.172 | 1042.82 | 1053.152 | 1433.904 | 1360.916 | 1134.445 | 1267.713 | |
| rank | 1 | 12 | 9 | 13 | 2 | 10 | 11 | 3 | 4 | 8 | 7 | 5 | 6 | |
| C17-F8 | mean | 805.721 | 1351.115 | 1100.231 | 1374.561 | 1003.671 | 1365.881 | 1270.348 | 1013.356 | 1023.541 | 1268.178 | 1113.789 | 1042.706 | 1213.494 |
| best | 802.9849 | 1306.313 | 1057.214 | 1351.374 | 973.8483 | 1277.833 | 1160.6 | 982.3324 | 990.5358 | 1217.312 | 1103.608 | 1002.871 | 1180.728 | |
| worst | 810.9445 | 1385.419 | 1143.508 | 1389.617 | 1034.27 | 1477.047 | 1366.566 | 1070.762 | 1059.941 | 1318.566 | 1129.003 | 1102.533 | 1230.719 | |
| std | 3.891615 | 40.62085 | 53.30554 | 17.89982 | 34.19462 | 92.61518 | 92.03362 | 42.74163 | 34.1913 | 45.15074 | 12.91415 | 49.50142 | 24.50797 | |
| median | 804.4773 | 1356.363 | 1100.101 | 1378.627 | 1003.282 | 1354.322 | 1277.113 | 1000.165 | 1021.844 | 1268.417 | 1111.273 | 1032.71 | 1221.264 | |
| rank | 1 | 11 | 6 | 13 | 2 | 12 | 10 | 3 | 4 | 9 | 7 | 5 | 8 | |
| C17-F9 | mean | 900 | 31,051.1 | 11,675.13 | 31,214.4 | 3238.679 | 32,551.61 | 28,392.1 | 17,082.88 | 6244.482 | 20,791.08 | 9460.756 | 9138.502 | 11,261.84 |
| best | 900 | 29,810.85 | 11,146.57 | 29,323.19 | 2032.095 | 29,890.05 | 26,453.7 | 9511.032 | 5336.41 | 15,961.04 | 8656.557 | 8548.842 | 9310.568 | |
| worst | 900 | 34,048.73 | 12,380.93 | 32,909.38 | 4682.586 | 36,436.44 | 33,315.56 | 22,458.82 | 7025.394 | 24,361.63 | 10,359.38 | 10,329.21 | 13,039.73 | |
| std | 1.01E−13 | 2195.966 | 559.63 | 1783.168 | 1191.598 | 3056.232 | 3579.538 | 6649.355 | 980.5268 | 3819.075 | 778.1417 | 888.7583 | 2162.608 | |
| median | 900 | 30,172.41 | 11,586.52 | 31,312.5 | 3120.018 | 31,939.98 | 26,899.57 | 18,180.84 | 6308.061 | 21,420.81 | 9413.544 | 8837.979 | 11,348.54 | |
| rank | 1 | 11 | 7 | 12 | 2 | 13 | 10 | 8 | 3 | 9 | 5 | 4 | 6 | |
| C17-F10 | mean | 4347.157 | 11,960.59 | 7997.318 | 12,995.76 | 6477.477 | 10,922.78 | 10,929.36 | 7432.631 | 8285.742 | 12,815.7 | 8228.953 | 7542.419 | 10,862.63 |
| best | 3555.132 | 11,511.48 | 7500.439 | 12,777.04 | 5611.471 | 10,052.08 | 9913.249 | 6365.31 | 6430.52 | 12,259.66 | 7464.218 | 7304.678 | 10,276.37 | |
| worst | 5099.795 | 12,681.4 | 8505.039 | 13,415.44 | 7088.816 | 11,917.98 | 11,991.42 | 8254.136 | 12,660.49 | 13,271.59 | 9251.954 | 7955.953 | 11,437.09 | |
| std | 701.6898 | 588.0922 | 446.6302 | 320.7599 | 774.7588 | 852.148 | 980.4482 | 881.348 | 3204.405 | 539.0572 | 824.0267 | 309.7522 | 536.1431 | |
| median | 4366.851 | 11,824.73 | 7991.897 | 12,895.29 | 6604.81 | 10,860.52 | 10,906.38 | 7555.538 | 7025.978 | 12,865.77 | 8099.819 | 7454.522 | 10,868.54 | |
| rank | 1 | 11 | 5 | 13 | 2 | 9 | 10 | 3 | 7 | 12 | 6 | 4 | 8 | |
| C17-F11 | mean | 1128.435 | 13,276.15 | 1549.54 | 18,035.48 | 1251.306 | 11,182.39 | 4518.476 | 1518.213 | 5397.474 | 4531.994 | 12,260.42 | 1605.813 | 20,608.14 |
| best | 1121.25 | 12,245.45 | 1447.083 | 16,062.88 | 1204.288 | 9640.254 | 4005.969 | 1391.868 | 3312.855 | 4260.571 | 11,504.42 | 1377.528 | 12,119.73 | |
| worst | 1133.132 | 13,924.57 | 1673.984 | 19,534.31 | 1281.377 | 13,383.07 | 5612.842 | 1642.615 | 9241.98 | 5027.755 | 13,871.78 | 1877.551 | 27,569.61 | |
| std | 5.923599 | 809.4648 | 113.8746 | 1578.695 | 37.32774 | 1755.825 | 805.482 | 119.8359 | 2981.794 | 385.6477 | 1182.421 | 233.5491 | 6954.273 | |
| median | 1129.678 | 13,467.3 | 1538.547 | 18,272.37 | 1259.779 | 10,853.12 | 4227.547 | 1519.185 | 4517.532 | 4419.825 | 11,832.75 | 1584.087 | 21,371.61 | |
| rank | 1 | 11 | 4 | 12 | 2 | 9 | 6 | 3 | 8 | 7 | 10 | 5 | 13 | |
| C17-F12 | mean | 2905.102 | 3.72E+10 | 64,228,735 | 6.06E+10 | 13,971,168 | 2.2E+10 | 1.13E+09 | 69,199,513 | 8.18E+08 | 4.31E+09 | 1.85E+09 | 1.37E+09 | 1.76E+08 |
| best | 2527.376 | 3.12E+10 | 28,088,258 | 4.42E+10 | 13,160,600 | 9.3E+09 | 9.31E+08 | 38,018,157 | 1.3E+08 | 2.43E+09 | 6.11E+08 | 12,579,081 | 56,622,701 | |
| worst | 3168.37 | 4.46E+10 | 98,280,368 | 8.32E+10 | 14,626,284 | 3.71E+10 | 1.53E+09 | 1.09E+08 | 1.52E+09 | 8.47E+09 | 3.33E+09 | 3.95E+09 | 2.43E+08 | |
| std | 297.8769 | 6.56E+09 | 40,914,989 | 1.95E+10 | 74,4618.4 | 1.25E+10 | 3.02E+08 | 32,549,765 | 7.54E+08 | 3.08E+09 | 1.22E+09 | 2E+09 | 89,011,221 | |
| median | 2962.331 | 3.64E+10 | 65,273,157 | 5.76E+10 | 14,048,895 | 2.09E+10 | 1.02E+09 | 64,796,411 | 8.12E+08 | 3.16E+09 | 1.74E+09 | 7.55E+08 | 2.02E+08 | |
| rank | 1 | 12 | 3 | 13 | 2 | 11 | 7 | 4 | 6 | 10 | 9 | 8 | 5 | |
| C17-F13 | mean | 1340.1 | 2.1E+10 | 12,8969.3 | 3.67E+10 | 15,885.29 | 8.59E+09 | 80,889,215 | 20,7549.2 | 3.04E+08 | 4.99E+08 | 15,793,658 | 4.07E+08 | 35,383,568 |
| best | 1333.781 | 1.21E+10 | 31,511.27 | 1.86E+10 | 8423.568 | 4.57E+09 | 60,813,819 | 13,0518.8 | 1.38E+08 | 4.06E+08 | 28,858.85 | 45,666.3 | 23,065,689 | |
| worst | 1343.015 | 2.86E+10 | 28,0915.2 | 5.28E+10 | 18,693.2 | 1.34E+10 | 91,852,073 | 32,1861.4 | 7.65E+08 | 6.82E+08 | 53,232,163 | 1.03E+09 | 47,290,081 | |
| std | 4.660414 | 7.89E+09 | 11,6012.5 | 1.56E+10 | 5419.363 | 4.06E+09 | 14,937,750 | 88,542.93 | 3.35E+08 | 1.35E+08 | 27,629,074 | 5.45E+08 | 11,773,479 | |
| median | 1341.801 | 2.16E+10 | 10,1725.4 | 3.78E+10 | 18,212.2 | 8.22E+09 | 85,445,485 | 188,908.3 | 1.57E+08 | 4.54E+08 | 4,956,805 | 3E+08 | 35,589,250 | |
| rank | 1 | 12 | 3 | 13 | 2 | 11 | 7 | 4 | 8 | 10 | 5 | 9 | 6 | |
| C17-F14 | mean | 1429.458 | 22,138,175 | 1,043,123 | 41,274,749 | 1558.988 | 2,291,762 | 4,066,361 | 162,996.9 | 982,315.2 | 738,324.2 | 12,918,985 | 489,682 | 9,561,064 |
| best | 1425.995 | 7,231,304 | 323,256 | 12,659,192 | 1546.115 | 605,547.5 | 3,600,215 | 103,335.7 | 76,691.77 | 608,829.9 | 2,929,237 | 176,046.7 | 4,704,918 | |
| worst | 1431.939 | 43,338,397 | 2,484,230 | 83,568,278 | 1582.843 | 3,634,801 | 4,832,202 | 316,175.9 | 1,895,369 | 851,820.3 | 21,211,653 | 784,154.5 | 16,455,299 | |
| std | 2.852761 | 16,583,070 | 1,069,026 | 32,825,935 | 18.30144 | 1,366,949 | 578,994.2 | 111,516.1 | 808,058.7 | 137,939 | 9,020,287 | 270,853.1 | 5,399,179 | |
| median | 1429.95 | 18,991,500 | 682,503.8 | 34,435,763 | 1553.497 | 2,463,349 | 3,916,514 | 116,238.1 | 978,600 | 746,323.4 | 13,767,524 | 499,263.5 | 8,542,020 | |
| rank | 1 | 12 | 7 | 13 | 2 | 8 | 9 | 3 | 6 | 5 | 11 | 4 | 10 | |
| C17-F15 | mean | 1530.66 | 2.22E+09 | 32,718.17 | 3.57E+09 | 2239.736 | 1.45E+09 | 8,462,655 | 103,834.4 | 5,074,514 | 60,186,667 | 1.68E+08 | 9569.48 | 7,314,943 |
| best | 1526.359 | 1.57E+09 | 20,328.87 | 2.79E+09 | 2110.365 | 5E+08 | 780,284.2 | 43,186.67 | 36,399.24 | 35,292,025 | 16,631.35 | 2695.893 | 2,485,932 | |
| worst | 1532.953 | 2.91E+09 | 59,974.55 | 4.23E+09 | 2382.754 | 3.16E+09 | 15,801,114 | 154,709.4 | 13,365,072 | 78,344,085 | 6.53E+08 | 18,491.01 | 15,875,307 | |
| std | 3.193106 | 6.85E+08 | 20,003.62 | 6.95E+08 | 156.9426 | 1.35E+09 | 7,185,508 | 53,956.69 | 6,329,484 | 19,594,013 | 3.52E+08 | 7647.803 | 6,444,348 | |
| median | 1531.664 | 2.2E+09 | 25,284.63 | 3.63E+09 | 2232.913 | 1.08E+09 | 8,634,612 | 108,720.8 | 3,448,292 | 63,555,279 | 10,185,651 | 8545.507 | 5,449,267 | |
| rank | 1 | 12 | 4 | 13 | 2 | 11 | 8 | 5 | 6 | 9 | 10 | 3 | 7 | |
| C17-F16 | mean | 2062.891 | 5745.424 | 4099.726 | 6855.564 | 2733.524 | 4345.037 | 5070.653 | 3223.862 | 3221.386 | 4261.553 | 3759.801 | 3235.29 | 3724.023 |
| best | 1728.6 | 5021.146 | 3797.152 | 5232.864 | 2579.866 | 3842.738 | 4253.427 | 3028.869 | 2863.636 | 3913.829 | 3472.365 | 2862.784 | 3178.337 | |
| worst | 2242.663 | 7271.321 | 4460.874 | 10,097.6 | 2996.441 | 4587.664 | 5643.426 | 3415.328 | 3726.251 | 4499.411 | 4087.984 | 3654.38 | 4158.479 | |
| std | 253.4793 | 1148.025 | 329.1293 | 2425.116 | 213.3552 | 379.1183 | 662.8411 | 172.0789 | 440.5687 | 269.1825 | 338.718 | 424.9433 | 463.8989 | |
| median | 2140.15 | 5344.614 | 4070.44 | 6045.895 | 2678.896 | 4474.873 | 5192.879 | 3225.626 | 3147.828 | 4316.486 | 3739.427 | 3211.998 | 3779.638 | |
| rank | 1 | 12 | 8 | 13 | 2 | 10 | 11 | 4 | 3 | 9 | 7 | 5 | 6 | |
| C17-F17 | mean | 2021.151 | 6861.854 | 3396.275 | 9790.292 | 2543.397 | 3736.742 | 4228.425 | 2980.016 | 2892.828 | 3900.141 | 3619.725 | 3219.341 | 3418.688 |
| best | 1900.43 | 5295.665 | 3005.885 | 7230.627 | 2472.901 | 3056.519 | 3816.979 | 2498.974 | 2763.483 | 3344.926 | 3228.971 | 3028.007 | 3217.262 | |
| worst | 2138.267 | 8331.744 | 3851.936 | 12,612.77 | 2598.685 | 4136.552 | 4427.228 | 3401.68 | 3134.984 | 4230.555 | 3885.98 | 3511.96 | 3621.124 | |
| std | 146.0805 | 1361.803 | 434.8743 | 2412.363 | 58.14989 | 512.1874 | 310.0241 | 406.0587 | 180.4802 | 427.0499 | 308.8662 | 250.608 | 205.6284 | |
| median | 2022.954 | 6910.003 | 3363.64 | 9658.884 | 2551.001 | 3876.95 | 4334.746 | 3009.705 | 2836.423 | 4012.542 | 3681.974 | 3168.699 | 3418.184 | |
| rank | 1 | 12 | 6 | 13 | 2 | 9 | 11 | 4 | 3 | 10 | 8 | 5 | 7 | |
| C17-F18 | mean | 1830.62 | 64,614,732 | 2,061,097 | 95,851,415 | 25,555.65 | 29,921,140 | 38,563,414 | 2,256,925 | 4,888,694 | 7,002,910 | 7,180,913 | 706,632.7 | 8,087,329 |
| best | 1822.239 | 51,707,525 | 270,404.9 | 43,098,156 | 3688.893 | 2,689,736 | 10,443,467 | 1,328,303 | 936,181 | 4,814,516 | 3,394,229 | 300,329.9 | 2,900,345 | |
| worst | 1841.673 | 76,192,919 | 3,774,095 | 1.33E+08 | 38,192.73 | 85,479,161 | 69,803,917 | 3,512,025 | 9,749,185 | 9,733,756 | 13,417,427 | 1,157,206 | 19,439,061 | |
| std | 8.863799 | 11,510,224 | 1,931,071 | 48,091,456 | 16,404.48 | 41,406,915 | 31,950,414 | 1,136,560 | 5,005,928 | 2,264,668 | 4,972,069 | 427,457.7 | 8,313,863 | |
| median | 1829.285 | 65,279,243 | 2,099,944 | 1.04E+08 | 30,170.48 | 15,757,831 | 37,003,137 | 2,093,686 | 4,434,706 | 6,731,684 | 5,955,997 | 684,497.7 | 5,004,954 | |
| rank | 1 | 12 | 4 | 13 | 2 | 10 | 11 | 5 | 6 | 7 | 8 | 3 | 9 | |
| C17-F19 | mean | 1925.185 | 2.32E+09 | 221,975.9 | 3.28E+09 | 2077.524 | 2.28E+09 | 5,839,914 | 4,374,448 | 992,916.8 | 43,270,616 | 386,089.3 | 336,264.1 | 846,771.8 |
| best | 1924.437 | 1.11E+09 | 78,106.34 | 2.21E+09 | 2017.947 | 8,346,421 | 878,605.2 | 3,329,863 | 486,155.2 | 36,735,230 | 222,137.6 | 2767.461 | 662,438.1 | |
| worst | 1926.121 | 3.88E+09 | 457,483.6 | 4.05E+09 | 2106.959 | 6.67E+09 | 13,763,901 | 5,424,967 | 1,526,502 | 54,948,013 | 845,719.2 | 839,444.5 | 1,146,958 | |
| std | 0.861219 | 1.27E+09 | 179,180.7 | 8.92E+08 | 44.25295 | 3.24E+09 | 6,026,000 | 930,913.9 | 473,371.6 | 8,823,346 | 333,598.3 | 434,170.1 | 248,843.6 | |
| median | 1925.091 | 2.15E+09 | 176,156.8 | 3.42E+09 | 2092.596 | 1.23E+09 | 4,358,575 | 4,371,482 | 979,505 | 40,699,610 | 238,250.2 | 251,422.2 | 788,845.3 | |
| rank | 1 | 12 | 3 | 13 | 2 | 11 | 9 | 8 | 7 | 10 | 5 | 4 | 6 | |
| C17-F20 | mean | 2160.172 | 3643.744 | 3162.642 | 3872.417 | 2645.336 | 3307.283 | 3576.753 | 3174.558 | 2614.794 | 3598.47 | 3825.639 | 3182.392 | 3078.958 |
| best | 2104.423 | 3321.011 | 2663.899 | 3597.129 | 2368.73 | 2883.838 | 3286.472 | 2964.002 | 2407.186 | 3523.56 | 3591.53 | 2866.252 | 2986.774 | |
| worst | 2323.891 | 3788.589 | 3609.976 | 4028.18 | 2920.336 | 3500.099 | 4068.862 | 3607.955 | 2803.756 | 3711.266 | 4098.01 | 3324.36 | 3179.235 | |
| std | 118.7931 | 238.5395 | 433.907 | 208.6822 | 253.4857 | 309.8258 | 374.6389 | 327.1354 | 227.4299 | 94.65403 | 226.473 | 231.1378 | 85.67285 | |
| median | 2106.186 | 3732.688 | 3188.346 | 3932.179 | 2646.14 | 3422.597 | 3475.84 | 3063.137 | 2624.118 | 3579.528 | 3806.507 | 3269.477 | 3074.912 | |
| rank | 1 | 11 | 5 | 13 | 3 | 8 | 9 | 6 | 2 | 10 | 12 | 7 | 4 | |
| C17-F21 | mean | 2314.895 | 2911.296 | 2708.199 | 2944.32 | 2445.682 | 2881.393 | 2873.592 | 2552.141 | 2507.304 | 2765.108 | 2782.422 | 2625.187 | 2703.313 |
| best | 2309.045 | 2881.915 | 2601.485 | 2852.003 | 2426.012 | 2791.667 | 2773.116 | 2523.981 | 2458.18 | 2741.518 | 2723.144 | 2561.21 | 2680.796 | |
| worst | 2329.683 | 2939.209 | 2867.073 | 3021.404 | 2469.568 | 3024.514 | 2957.342 | 2586.126 | 2545.779 | 2806.139 | 2818.91 | 2714.661 | 2722.612 | |
| std | 10.75977 | 33.25097 | 123.952 | 86.19918 | 24.23715 | 109.0393 | 85.20166 | 35.23339 | 40.96419 | 32.60945 | 46.08534 | 72.90841 | 20.6077 | |
| median | 2310.426 | 2912.031 | 2682.12 | 2951.936 | 2443.575 | 2854.696 | 2881.956 | 2549.229 | 2512.629 | 2756.387 | 2793.816 | 2612.438 | 2704.922 | |
| rank | 1 | 12 | 7 | 13 | 2 | 11 | 10 | 4 | 3 | 8 | 9 | 5 | 6 | |
| C17-F22 | mean | 3095.169 | 13,541.5 | 10,253.37 | 14,628.25 | 5296.695 | 12,479.83 | 12,417.09 | 8414.581 | 8307.775 | 14,155.83 | 10,502.69 | 9065.003 | 8273.435 |
| best | 2300 | 13,306.65 | 8551.137 | 14,094.07 | 2319.709 | 12,172.5 | 12,192.35 | 6411.778 | 7766.883 | 13,363.28 | 10,038.76 | 7990.454 | 3782.2 | |
| worst | 5480.678 | 13,892.82 | 12,094 | 15,153.48 | 8384.778 | 12,641.71 | 12,871.72 | 9834 | 8789.711 | 14,962.82 | 10,913.82 | 9810.043 | 12,642.36 | |
| std | 1730.769 | 289.6574 | 1783.239 | 479.8504 | 3573.342 | 238.4903 | 337.2136 | 1579.056 | 458.2178 | 922.9868 | 390.3125 | 845.8556 | 4946.644 | |
| median | 2300 | 13,483.25 | 10,184.17 | 14,632.73 | 5241.148 | 12,552.56 | 12,302.15 | 8706.272 | 8337.253 | 14,148.61 | 10,529.09 | 9229.756 | 8334.592 | |
| rank | 1 | 11 | 7 | 13 | 2 | 10 | 9 | 5 | 4 | 12 | 8 | 6 | 3 | |
| C17-F23 | mean | 2743.354 | 3689.579 | 3233.464 | 3755.06 | 2887.099 | 3623.224 | 3625.411 | 2972.584 | 2999.287 | 3224.747 | 4495.979 | 3307.134 | 3294.604 |
| best | 2729.988 | 3621.225 | 3159.5 | 3712.118 | 2874.042 | 3441.415 | 3467.184 | 2936.881 | 2929.037 | 3150.466 | 4326.657 | 3249.029 | 3181.817 | |
| worst | 2752.657 | 3772.607 | 3306.203 | 3790.727 | 2906.781 | 3914.242 | 3711.376 | 3036.371 | 3118.56 | 3283.576 | 4642.809 | 3356.671 | 3417.095 | |
| std | 10.90099 | 71.67639 | 74.93054 | 36.15864 | 15.31114 | 244.6359 | 119.6447 | 50.82305 | 89.74451 | 59.99883 | 141.3101 | 61.34768 | 104.9761 | |
| median | 2745.387 | 3682.242 | 3234.076 | 3758.696 | 2883.787 | 3568.618 | 3661.542 | 2958.542 | 2974.775 | 3232.472 | 4507.225 | 3311.417 | 3289.752 | |
| rank | 1 | 11 | 6 | 12 | 2 | 9 | 10 | 3 | 4 | 5 | 13 | 8 | 7 | |
| C17-F24 | mean | 2919.043 | 4054.247 | 3450.701 | 4292.706 | 3063.289 | 3876.423 | 3724.834 | 3123.737 | 3178.789 | 3394.555 | 4202.741 | 3407.358 | 3581.48 |
| best | 2909.046 | 3834.477 | 3350.833 | 3871.663 | 3033.954 | 3797.469 | 3624.721 | 3095.062 | 3097.68 | 3323.599 | 4168.799 | 3264.631 | 3542.81 | |
| worst | 2924.412 | 4553.465 | 3616.246 | 5332.137 | 3100.834 | 3995.323 | 3772.58 | 3150.743 | 3292.593 | 3450.283 | 4250.117 | 3540.786 | 3671.707 | |
| std | 7.426653 | 365.0322 | 125.0123 | 761.4861 | 32.75587 | 98.97493 | 74.03394 | 27.38206 | 89.38906 | 62.56123 | 39.22231 | 133.3472 | 65.79617 | |
| median | 2921.358 | 3914.522 | 3417.862 | 3983.512 | 3059.185 | 3856.449 | 3751.017 | 3124.572 | 3162.442 | 3402.168 | 4196.024 | 3412.007 | 3555.702 | |
| rank | 1 | 11 | 7 | 13 | 2 | 10 | 9 | 3 | 4 | 5 | 12 | 6 | 8 | |
| C17-F25 | mean | 2983.145 | 7840.95 | 3161.682 | 10,719.34 | 3066.596 | 5602.111 | 4003.228 | 3055.294 | 3899.38 | 4192.377 | 4109.234 | 3112.703 | 3912.044 |
| best | 2980.235 | 6532.25 | 3139.605 | 8691.316 | 3046.332 | 4634.032 | 3650.751 | 3027.752 | 3729.328 | 3770.211 | 3810.836 | 3074.445 | 3816.771 | |
| worst | 2991.831 | 8671.091 | 3199.227 | 11,966.67 | 3084.832 | 6525.356 | 4267.227 | 3072.492 | 4076.001 | 4706.468 | 4679.679 | 3157.627 | 4018.564 | |
| std | 6.301777 | 1031.155 | 28.22414 | 1674.205 | 17.3182 | 884.9832 | 285.4902 | 21.50476 | 197.6538 | 513.2887 | 445.8802 | 45.2687 | 90.35902 | |
| median | 2980.257 | 8080.23 | 3153.949 | 11109.69 | 3067.611 | 5624.529 | 4047.468 | 3060.466 | 3896.096 | 4146.414 | 3973.21 | 3109.37 | 3906.421 | |
| rank | 1 | 12 | 5 | 13 | 3 | 11 | 8 | 2 | 6 | 10 | 9 | 4 | 7 | |
| C17-F26 | mean | 3776.432 | 12,636.24 | 9947.181 | 13,487.2 | 3334.791 | 11,373.32 | 12,403.24 | 5464.064 | 6090.526 | 8864.466 | 10,440.88 | 7481.348 | 8229.115 |
| best | 3748.807 | 12,413.2 | 9479.973 | 12,926.99 | 3135.514 | 9523.972 | 11,634.58 | 5015.351 | 5727.379 | 8146.697 | 10,144.46 | 7017.238 | 6617.009 | |
| worst | 3793.643 | 12,836.52 | 10,373.29 | 14,293.02 | 3620.179 | 12,504.6 | 13,871.88 | 5676.619 | 6416.408 | 9551.372 | 10,765.37 | 7950.947 | 10,360.36 | |
| std | 21.16788 | 200.8083 | 397.9168 | 640.6481 | 239.2718 | 1402.329 | 1086.993 | 333.8182 | 371.3207 | 636.637 | 278.0636 | 453.9675 | 1936.675 | |
| median | 3781.639 | 12,647.63 | 9967.729 | 13,364.39 | 3291.736 | 11,732.36 | 12,053.25 | 5582.144 | 6109.158 | 8879.897 | 10,426.85 | 7478.604 | 7969.545 | |
| rank | 2 | 12 | 8 | 13 | 1 | 10 | 11 | 3 | 4 | 7 | 9 | 5 | 6 | |
| C17-F27 | mean | 3251.26 | 4604.683 | 3785.005 | 4768.312 | 3381.636 | 4527.175 | 4311.872 | 3363.123 | 3603.31 | 3768.097 | 7448.439 | 3608.047 | 4298.472 |
| best | 3227.701 | 4328.522 | 3742.878 | 4442.58 | 3274.957 | 3896.836 | 3813.752 | 3327.505 | 3563.181 | 3613.084 | 7240.195 | 3379.099 | 4201.797 | |
| worst | 3313.631 | 4793.514 | 3853.479 | 5001.772 | 3480.831 | 4957.193 | 4822.33 | 3411.334 | 3658.614 | 3915.971 | 7759.333 | 3820.856 | 4436.656 | |
| std | 45.39257 | 226.2235 | 57.51471 | 285.3473 | 91.87787 | 504.5393 | 511.8991 | 40.28773 | 49.36585 | 149.5813 | 273.5143 | 213.321 | 110.8682 | |
| median | 3231.854 | 4648.348 | 3771.831 | 4814.447 | 3385.378 | 4627.336 | 4305.702 | 3356.826 | 3595.723 | 3771.666 | 7397.113 | 3616.117 | 4277.718 | |
| rank | 1 | 11 | 7 | 12 | 3 | 10 | 9 | 2 | 4 | 6 | 13 | 5 | 8 | |
| C17-F28 | mean | 3258.849 | 7995.78 | 3559.18 | 10,110.21 | 3350.874 | 6721.897 | 4620.526 | 3293.53 | 4258.861 | 4989.789 | 4826.547 | 3800.23 | 4809.503 |
| best | 3258.849 | 7261.377 | 3483.448 | 8998.327 | 3314.656 | 5525.71 | 4089.321 | 3277.285 | 4020.132 | 4448.421 | 4770.251 | 3521.168 | 4592.939 | |
| worst | 3258.849 | 9864.723 | 3639.697 | 13,054.31 | 3395.35 | 7951.765 | 4827.562 | 3306.233 | 4558.861 | 5468.299 | 4925.914 | 4249.367 | 4968.115 | |
| std | 0 | 1366.648 | 84.93991 | 2139.942 | 43.07498 | 1334.759 | 386.6102 | 14.34867 | 271.1234 | 455.7595 | 75.25557 | 342.051 | 196.7871 | |
| median | 3258.849 | 7428.51 | 3556.788 | 9194.103 | 3346.745 | 6705.057 | 4782.609 | 3295.302 | 4228.226 | 5021.218 | 4805.012 | 3715.193 | 4838.479 | |
| rank | 1 | 12 | 4 | 13 | 3 | 11 | 7 | 2 | 6 | 10 | 9 | 5 | 8 | |
| C17-F29 | mean | 3263.038 | 12,318.61 | 5299.609 | 17,388.78 | 4082.162 | 6507.888 | 8359.279 | 4724.924 | 4757.362 | 6192.417 | 7611.6 | 4727.779 | 5858.844 |
| best | 3247.132 | 8329.778 | 5194.722 | 9469.678 | 3730.764 | 6141.641 | 5766.427 | 4358.921 | 4577.561 | 5367.093 | 6357.457 | 4485.418 | 5558.764 | |
| worst | 3278.787 | 16,671.54 | 5379.045 | 27,143.86 | 4323.353 | 6956.538 | 10,777.95 | 5273.739 | 5037.961 | 7042.906 | 9841.389 | 4832.262 | 6413.197 | |
| std | 18.99818 | 4176.796 | 84.21284 | 8564.455 | 291.6212 | 366.2191 | 2246.896 | 423.0455 | 231.1973 | 860.2741 | 1716.019 | 177.199 | 432.7455 | |
| median | 3263.116 | 12,136.57 | 5312.334 | 16,470.79 | 4137.266 | 6466.687 | 8446.367 | 4633.518 | 4706.962 | 6179.835 | 7123.777 | 4796.718 | 5731.708 | |
| rank | 1 | 12 | 6 | 13 | 2 | 9 | 11 | 3 | 5 | 8 | 10 | 4 | 7 | |
| C17-F30 | mean | 623,575.2 | 2.8E+09 | 18,892,529 | 4.69E+09 | 1,630,658 | 1.42E+09 | 1.36E+08 | 60,436,983 | 1.19E+08 | 2.57E+08 | 1.58E+08 | 4,325,487 | 50,145,531 |
| best | 582,411.6 | 2.16E+09 | 11,594,191 | 2.88E+09 | 1,237,598 | 1.74E+08 | 91,745,090 | 54,760,529 | 57,828,333 | 1.79E+08 | 1.21E+08 | 3,159,284 | 40,452,446 | |
| worst | 655,637.4 | 3.8E+09 | 25,767,629 | 7.36E+09 | 2,647,612 | 2.87E+09 | 1.87E+08 | 69,458,205 | 1.77E+08 | 3.25E+08 | 2.07E+08 | 5,901,616 | 70,259,757 | |
| std | 35,550.35 | 7.78E+08 | 7,624,147 | 2.1E+09 | 741,170.3 | 1.51E+09 | 52,122,607 | 6,967,947 | 65,532,625 | 66,719,715 | 39,154,562 | 1,485,469 | 15,004,001 | |
| median | 628,125.9 | 2.62E+09 | 19,104,147 | 4.26E+09 | 1,318,710 | 1.31E+09 | 1.32E+08 | 58,764,598 | 1.21E+08 | 2.62E+08 | 1.52E+08 | 4,120,524 | 44,934,960 | |
| rank | 1 | 12 | 4 | 13 | 2 | 11 | 8 | 6 | 7 | 10 | 9 | 3 | 5 | |
| Sum rank | 30 | 335 | 166 | 367 | 63 | 294 | 269 | 112 | 144 | 248 | 254 | 150 | 207 | |
| Mean rank | 1.034483 | 11.55172 | 5.724138 | 12.65517 | 2.172414 | 10.13793 | 9.275862 | 3.862069 | 4.965517 | 8.551724 | 8.758621 | 5.172414 | 7.137931 | |
| Total rank | 1 | 12 | 6 | 13 | 2 | 11 | 10 | 3 | 4 | 8 | 9 | 5 | 7 | |
| GAO | WSO | AVOA | RSA | MPA | TSA | WOA | MVO | GWO | TLBO | GSA | PSO | GA | ||
|---|---|---|---|---|---|---|---|---|---|---|---|---|---|---|
| C17-F1 | mean | 100 | 1.42E+11 | 3.33E+09 | 1.99E+11 | 5.05E+08 | 1.08E+11 | 5.36E+10 | 1.18E+08 | 4.88E+10 | 7.79E+10 | 1.16E+11 | 1.72E+10 | 4.79E+10 |
| best | 100 | 1.39E+11 | 1.64E+09 | 1.96E+11 | 3.82E+08 | 9.48E+10 | 5.06E+10 | 93,364,159 | 4.23E+10 | 7.41E+10 | 1.07E+11 | 1.16E+10 | 4.54E+10 | |
| worst | 100 | 1.46E+11 | 4.78E+09 | 2.01E+11 | 6.38E+08 | 1.2E+11 | 6E+10 | 1.43E+08 | 5.52E+10 | 8.58E+10 | 1.24E+11 | 2.33E+10 | 5.42E+10 | |
| std | 1.26E−14 | 3.17E+09 | 1.4E+09 | 2.5E+09 | 1.34E+08 | 1.15E+10 | 4.68E+09 | 22,474,625 | 6.67E+09 | 5.86E+09 | 8.07E+09 | 7.02E+09 | 4.56E+09 | |
| median | 100 | 1.42E+11 | 3.45E+09 | 2E+11 | 5E+08 | 1.08E+11 | 5.19E+10 | 1.17E+08 | 4.89E+10 | 7.58E+10 | 1.17E+11 | 1.69E+10 | 4.61E+10 | |
| rank | 1 | 12 | 4 | 13 | 3 | 10 | 8 | 2 | 7 | 9 | 11 | 5 | 6 | |
| C17-F3 | mean | 300 | 383,842.5 | 297,065.6 | 293,794.9 | 153,298.3 | 328,723.6 | 691,639.7 | 416,132.3 | 332,672.7 | 271,228.7 | 311,511.4 | 479,906.4 | 510,979.9 |
| best | 300 | 347,055.6 | 291,126.5 | 287,981.8 | 117,347.5 | 262,753.2 | 603,296.5 | 350,527.3 | 302,866 | 254,325.9 | 293,641.2 | 363,707.2 | 486,401.5 | |
| worst | 300 | 404,518.9 | 307,223.7 | 297,843.6 | 185,492.3 | 374,459.6 | 801,936.8 | 493,241.5 | 361,288.5 | 281,529.8 | 337,941.2 | 667,849.7 | 530,908 | |
| std | 0 | 28,746.65 | 7991.764 | 4536.701 | 32,202.67 | 51,409.18 | 93,079.01 | 77,508.77 | 34,488.75 | 12,808.7 | 20,829.9 | 152,845.3 | 20,545.72 | |
| median | 300 | 391,897.7 | 294,956.2 | 294,677.1 | 155,176.7 | 338,840.9 | 680,662.7 | 410,380.2 | 333,268.2 | 274,529.5 | 307,231.6 | 444,034.3 | 513,305 | |
| rank | 1 | 9 | 5 | 4 | 2 | 7 | 13 | 10 | 8 | 3 | 6 | 11 | 12 | |
| C17-F4 | mean | 602.1722 | 38,110.01 | 1463.253 | 64,164.55 | 1006.509 | 13,783.02 | 9464.142 | 786.2998 | 3945.925 | 9294.052 | 29,213.19 | 2245.803 | 7984.771 |
| best | 592.0676 | 35,091.62 | 1264.191 | 58,182.9 | 897.1236 | 9057.49 | 8090.444 | 730.426 | 3070.574 | 8855.585 | 23,271.15 | 1426.042 | 7539.968 | |
| worst | 612.2769 | 41,757.16 | 1585.01 | 71,464.69 | 1120.178 | 18,294.93 | 10,365.01 | 824.3422 | 5875.795 | 10,052.86 | 33,033.64 | 2784.574 | 8489.108 | |
| std | 12.6933 | 3120.87 | 163.7911 | 5990.231 | 117.2572 | 4153.933 | 1053.821 | 43.67809 | 1411.052 | 614.74 | 5126.89 | 636.9998 | 473.8265 | |
| median | 602.1722 | 37,795.63 | 1501.906 | 63,505.3 | 1004.366 | 13,889.83 | 9700.557 | 795.2156 | 3418.665 | 9133.882 | 30,273.98 | 2386.298 | 7955.004 | |
| rank | 1 | 12 | 4 | 13 | 3 | 10 | 9 | 2 | 6 | 8 | 11 | 5 | 7 | |
| C17-F5 | mean | 512.9345 | 1822.958 | 1254.804 | 1797.302 | 1180.149 | 1951.64 | 1694.074 | 1188.948 | 1144.611 | 1723.369 | 1273.26 | 1338.401 | 1479.648 |
| best | 510.9445 | 1810.032 | 1247.779 | 1762.886 | 1058.321 | 1925.842 | 1597.583 | 1106.621 | 1106.334 | 1709.908 | 1229.786 | 1249.81 | 1365.867 | |
| worst | 514.9244 | 1842.261 | 1264.602 | 1836.005 | 1262.3 | 1971.671 | 1817.129 | 1243.386 | 1180.804 | 1733.231 | 1309.72 | 1468.787 | 1563.629 | |
| std | 1.976192 | 15.07849 | 7.699721 | 33.55469 | 107.0527 | 21.56576 | 100.3657 | 71.93899 | 33.26408 | 12.23907 | 38.09065 | 109.6983 | 94.87956 | |
| median | 512.9345 | 1819.769 | 1253.418 | 1795.158 | 1199.987 | 1954.523 | 1680.793 | 1202.892 | 1145.653 | 1725.168 | 1276.766 | 1317.504 | 1494.549 | |
| rank | 1 | 12 | 5 | 11 | 3 | 13 | 9 | 4 | 2 | 10 | 6 | 7 | 8 | |
| C17-F6 | mean | 600 | 692.577 | 655.5795 | 691.1357 | 635.2408 | 696.3684 | 690.4931 | 666.174 | 637.6212 | 671.6821 | 657.3416 | 655.2134 | 656.5741 |
| best | 600 | 689.8974 | 651.7584 | 686.6009 | 631.618 | 685.6778 | 681.9086 | 660.1273 | 634.2029 | 665.0953 | 654.737 | 648.7785 | 651.1896 | |
| worst | 600 | 695.4305 | 659.2454 | 693.6932 | 641.3751 | 704.1858 | 704.4683 | 670.9605 | 642.4555 | 676.195 | 660.4212 | 659.6686 | 661.1833 | |
| std | 0 | 2.546137 | 3.456439 | 3.386495 | 5.031692 | 9.392332 | 10.89493 | 5.209416 | 4.091298 | 5.732751 | 2.561423 | 5.86286 | 5.595732 | |
| median | 600 | 692.49 | 655.6572 | 692.1244 | 633.9852 | 697.8051 | 687.7977 | 666.804 | 636.9131 | 672.7191 | 657.1041 | 656.2032 | 656.9618 | |
| rank | 1 | 12 | 5 | 11 | 2 | 13 | 10 | 8 | 3 | 9 | 7 | 4 | 6 | |
| C17-F7 | mean | 811.392 | 3249.903 | 2809.103 | 3346.473 | 1780.479 | 3104.965 | 3225.886 | 1917.393 | 1930.261 | 2822.842 | 2843.951 | 2306.959 | 2388.427 |
| best | 810.0205 | 3177.749 | 2668.95 | 3271.134 | 1724.798 | 2964.814 | 3121.438 | 1791.09 | 1765.371 | 2702.685 | 2727.712 | 2093.38 | 2301.084 | |
| worst | 813.1726 | 3328.526 | 2917.615 | 3420.581 | 1857.776 | 3239.49 | 3366.132 | 2013.472 | 2047.707 | 2918.788 | 3034.433 | 2407.096 | 2565.297 | |
| std | 1.589565 | 67.33718 | 133.3426 | 68.67265 | 62.52161 | 135.5128 | 122.8352 | 100.7463 | 129.6834 | 97.17736 | 144.9155 | 160.257 | 131.1636 | |
| median | 811.1874 | 3246.669 | 2824.924 | 3347.089 | 1769.67 | 3107.778 | 3207.986 | 1932.506 | 1953.982 | 2834.946 | 2806.83 | 2363.681 | 2343.663 | |
| rank | 1 | 12 | 7 | 13 | 2 | 10 | 11 | 3 | 4 | 8 | 9 | 5 | 6 | |
| C17-F8 | mean | 812.437 | 2212.881 | 1647.373 | 2258.275 | 1393.836 | 2194.03 | 2127.672 | 1413.475 | 1464.418 | 2073.614 | 1720.513 | 1621.273 | 1890.868 |
| best | 808.9546 | 2175.495 | 1607.877 | 2244.776 | 1231.543 | 2149.448 | 1940.752 | 1286.824 | 1383.515 | 2020.033 | 1632.323 | 1580.032 | 1828.262 | |
| worst | 816.9143 | 2263.473 | 1682.993 | 2272.856 | 1494.677 | 2267.22 | 2267.929 | 1577.554 | 1581.495 | 2124.601 | 1829.583 | 1712.871 | 1934.221 | |
| std | 3.697116 | 47.32375 | 36.88267 | 13.67073 | 125.6233 | 59.80833 | 175.3943 | 131.2531 | 104.9716 | 46.47028 | 92.56546 | 66.9778 | 50.5737 | |
| median | 811.9395 | 2206.278 | 1649.31 | 2257.735 | 1424.562 | 2179.726 | 2151.004 | 1394.762 | 1446.331 | 2074.911 | 1710.072 | 1596.095 | 1900.494 | |
| rank | 1 | 12 | 6 | 13 | 2 | 11 | 10 | 3 | 4 | 9 | 7 | 5 | 8 | |
| C17-F9 | mean | 900 | 76,816.82 | 24,403.01 | 66,222.08 | 21,063.39 | 101,805.1 | 65,821.32 | 51,366.63 | 32,197.6 | 63,893.94 | 21,998.26 | 29,657.46 | 40,458.63 |
| best | 900 | 68,900.42 | 20,792.7 | 63,921.65 | 19,605.36 | 83,970.72 | 51,834.98 | 43,765.53 | 20,725.61 | 61,124.6 | 20,701.12 | 25,525.09 | 36,964.91 | |
| worst | 900 | 88,390.72 | 27,225.2 | 68,008.19 | 21,723.38 | 126,398.6 | 82,335.26 | 58,117.91 | 42,909.41 | 65,321.41 | 23,120.05 | 32,788.17 | 45,299.31 | |
| std | 1.01E−13 | 9140.389 | 2905.49 | 1940.678 | 1065.91 | 19,383.02 | 16,524.1 | 6435.124 | 11,756.31 | 2089.674 | 1106.024 | 3542.998 | 3839.177 | |
| median | 900 | 74,988.06 | 24,797.07 | 66,479.23 | 21,462.41 | 98,425.45 | 64,557.51 | 51,791.54 | 32,577.68 | 64,564.88 | 22,085.94 | 30,158.28 | 39,785.15 | |
| rank | 1 | 12 | 4 | 11 | 2 | 13 | 10 | 8 | 6 | 9 | 3 | 5 | 7 | |
| C17-F10 | mean | 11,023.04 | 27,349.26 | 15,441.01 | 28,451.98 | 13,705.22 | 26,592.86 | 25,727.09 | 16,289.98 | 14,793.94 | 28,460.01 | 16,484.36 | 16,357.73 | 23,872.49 |
| best | 9625.608 | 27,025.57 | 13,346.64 | 27,628.2 | 13,035.67 | 26,097.57 | 25,018.54 | 15,674.02 | 13,811.72 | 27,371.81 | 14,979.87 | 14,952.56 | 23,395.55 | |
| worst | 11,858.81 | 27,711.42 | 17,262.38 | 28,960.59 | 14,519.33 | 27,297.11 | 27,009.25 | 16,804.07 | 15,206.42 | 29,371.22 | 17,274.56 | 17,391.97 | 24,443.19 | |
| std | 1054.018 | 322.3919 | 1881.722 | 649.5138 | 681.7138 | 609.0236 | 998.3499 | 535.963 | 720.7513 | 899.0758 | 1173.583 | 1109.584 | 473.1087 | |
| median | 11,303.87 | 27,330.04 | 15,577.5 | 28,609.56 | 13,632.93 | 26,488.39 | 25,440.28 | 16,340.91 | 15,078.81 | 28,548.5 | 16,841.5 | 16,543.19 | 23,825.61 | |
| rank | 1 | 11 | 4 | 12 | 2 | 10 | 9 | 5 | 3 | 13 | 7 | 6 | 8 | |
| C17-F11 | mean | 1162.329 | 138,171.3 | 54,218.15 | 173,245.6 | 4617.217 | 55,259.59 | 174,853 | 4448.069 | 73,503.38 | 60,611.45 | 145,056.9 | 44,126.05 | 117,068.8 |
| best | 1139.568 | 107,408.8 | 48,816.74 | 132,721.4 | 3646.106 | 25,475.78 | 101,876.7 | 3991.368 | 61,195.93 | 51,182.33 | 121,014.7 | 20,433.81 | 89,442.4 | |
| worst | 1220.662 | 160,596.2 | 64,555.37 | 246,485.9 | 5510.858 | 78,913.32 | 281,535.5 | 4786.813 | 82,633.13 | 77,155.18 | 169,243.8 | 89,549.74 | 161,296.6 | |
| std | 42.46,663 | 24,880.2 | 7905.572 | 55,743.48 | 873.2478 | 24,092.58 | 90,902.06 | 361.1768 | 10,009.55 | 12,382.24 | 21,675.86 | 33,640.04 | 34,264.38 | |
| median | 1144.542 | 142,340.1 | 51,750.24 | 156,887.5 | 4655.952 | 58,324.63 | 157,999.9 | 4507.047 | 75,092.23 | 57,054.15 | 144,984.6 | 33,260.32 | 108,768.1 | |
| rank | 1 | 10 | 5 | 12 | 3 | 6 | 13 | 2 | 8 | 7 | 11 | 4 | 9 | |
| C17-F12 | mean | 5974.805 | 8.83E+10 | 5.81E+08 | 1.44E+11 | 2.48E+08 | 4.76E+10 | 1.11E+10 | 3.08E+08 | 9.6E+09 | 1.84E+10 | 5.59E+10 | 8.47E+09 | 1.04E+10 |
| best | 5383.905 | 6.27E+10 | 3.09E+08 | 1.07E+11 | 1.39E+08 | 2.44E+10 | 8.99E+09 | 2.11E+08 | 6.66E+09 | 1.44E+10 | 4.85E+10 | 1.13E+09 | 9.44E+09 | |
| worst | 6570.199 | 9.84E+10 | 9.16E+08 | 1.67E+11 | 2.98E+08 | 7.89E+10 | 1.26E+10 | 4.73E+08 | 1.14E+10 | 2.53E+10 | 6.58E+10 | 1.61E+10 | 1.22E+10 | |
| std | 537.9317 | 1.86E+10 | 2.83E+08 | 2.96E+10 | 80,251,697 | 2.48E+10 | 1.67E+09 | 1.29E+08 | 2.23E+09 | 5.4E+09 | 7.83E+09 | 7.41E+09 | 1.38E+09 | |
| median | 5972.559 | 9.6E+10 | 5.49E+08 | 1.5E+11 | 2.79E+08 | 4.35E+10 | 1.13E+10 | 2.75E+08 | 1.02E+10 | 1.69E+10 | 5.47E+10 | 8.34E+09 | 9.87E+09 | |
| rank | 1 | 12 | 4 | 13 | 2 | 10 | 8 | 3 | 6 | 9 | 11 | 5 | 7 | |
| C17-F13 | mean | 1407.28 | 2.33E+10 | 93,518.05 | 3.57E+10 | 92,388.84 | 1.79E+10 | 4.38E+08 | 307,656.4 | 7.93E+08 | 2.36E+09 | 7.31E+09 | 1.48E+09 | 1.46E+08 |
| best | 1371.145 | 2.03E+10 | 62,963.2 | 2.76E+10 | 39,601.01 | 1.27E+10 | 3.11E+08 | 268,601.7 | 68,370,498 | 1.63E+09 | 4.49E+09 | 1.63E+08 | 1.15E+08 | |
| worst | 1439.935 | 2.58E+10 | 119,547 | 4.05E+10 | 229,396.8 | 2.14E+10 | 5.92E+08 | 373,502.2 | 2.1E+09 | 2.85E+09 | 9.38E+09 | 2.67E+09 | 1.76E+08 | |
| std | 37.80433 | 3.15E+09 | 25,701.38 | 6.46E+09 | 99,954.78 | 4.01E+09 | 1.57E+08 | 50,861.93 | 1.02E+09 | 6.06E+08 | 2.23E+09 | 1.34E+09 | 34,572,729 | |
| median | 1409.02 | 2.35E+10 | 95,780.99 | 3.74E+10 | 50,278.77 | 1.87E+10 | 4.24E+08 | 294,260.8 | 5.03E+08 | 2.47E+09 | 7.68E+09 | 1.54E+09 | 1.47E+08 | |
| rank | 1 | 12 | 3 | 13 | 2 | 11 | 6 | 4 | 7 | 9 | 10 | 8 | 5 | |
| C17-F14 | mean | 1467.509 | 38,082,540 | 5,605,598 | 66,800,415 | 86,803.32 | 7,468,562 | 12,208,820 | 2,554,157 | 8,074,153 | 11,671,525 | 9,650,213 | 693,949.6 | 8,816,297 |
| best | 1458.803 | 32,883,853 | 3,415,353 | 60,921,097 | 24,818.95 | 3,392,874 | 7,027,213 | 779,198.2 | 5,111,901 | 8,699,694 | 7,452,511 | 330,058.5 | 4,938,542 | |
| worst | 1472.733 | 43,502,874 | 9,299,515 | 73,125,403 | 184,373.4 | 14,562,847 | 16,677,476 | 3,504,230 | 12,091,525 | 14,923,989 | 14,459,922 | 1,441,316 | 12,994,340 | |
| std | 6.576739 | 5,070,725 | 2,823,155 | 6,372,141 | 77,728.84 | 5,353,785 | 4,317,050 | 1,323,088 | 3,325,705 | 3,539,240 | 3,527,329 | 550,201.6 | 3,648,073 | |
| median | 1469.25 | 37,971,717 | 4,853,762 | 66,577,581 | 69,010.46 | 5,959,264 | 12,565,295 | 2,966,600 | 7,546,593 | 11,531,208 | 8,344,210 | 502,212.2 | 8,666,153 | |
| rank | 1 | 12 | 5 | 13 | 2 | 6 | 11 | 4 | 7 | 10 | 9 | 3 | 8 | |
| C17-F15 | mean | 1609.893 | 1.29E+10 | 77,286.65 | 1.97E+10 | 53,518.19 | 1.01E+10 | 58,778,711 | 112,631.2 | 4.2E+08 | 9.99E+08 | 1.04E+09 | 2.8E+08 | 10,645,222 |
| best | 1551.154 | 1.19E+10 | 66,065.03 | 1.41E+10 | 15,481.08 | 2.1E+08 | 32,741,200 | 74,503.83 | 27,578,628 | 3.34E+08 | 4.17E+08 | 59,310.67 | 6,867,523 | |
| worst | 1652.294 | 1.45E+10 | 90,717.93 | 2.46E+10 | 81,241.61 | 1.89E+10 | 1.13E+08 | 162,708.2 | 1.26E+09 | 2.13E+09 | 1.33E+09 | 1.1E+09 | 18,137,162 | |
| std | 48.04352 | 1.22E+09 | 13,326.2 | 5.67E+09 | 30,201.72 | 8.84E+09 | 39,831,191 | 41,080.69 | 6.2E+08 | 8.58E+08 | 4.6E+08 | 5.98E+08 | 5,569,986 | |
| median | 1618.063 | 1.26E+10 | 76,181.82 | 2.01E+10 | 58,675.04 | 1.06E+10 | 44,721,842 | 106,656.4 | 1.97E+08 | 7.65E+08 | 1.21E+09 | 7,243,656 | 8,788,101 | |
| rank | 1 | 12 | 3 | 13 | 2 | 11 | 6 | 4 | 8 | 9 | 10 | 7 | 5 | |
| C17-F16 | mean | 2711.795 | 16,653.33 | 6752.877 | 19,761.53 | 5402.929 | 12,984.33 | 14,386.34 | 6302.297 | 5887.338 | 10,410.19 | 10,042.59 | 6208.393 | 9611.617 |
| best | 2171.69 | 15,547.12 | 5757.308 | 15,679.72 | 5307.987 | 10,829.43 | 11,844.45 | 5656.217 | 5400.708 | 9952.753 | 8810.787 | 5969.755 | 8736.575 | |
| worst | 3397.326 | 17,141.74 | 7390.032 | 22,016.02 | 5537.679 | 15,421.12 | 15,871.81 | 6741.128 | 6461.293 | 11,325.02 | 11,504.13 | 6395.272 | 10,309.06 | |
| std | 554.7769 | 808.8727 | 770.3875 | 3124.823 | 107.4954 | 2051.445 | 1956.809 | 519.8196 | 601.7643 | 695.8643 | 1314.398 | 191.9232 | 776.5046 | |
| median | 2639.081 | 16,962.24 | 6932.084 | 20,675.18 | 5383.024 | 12,843.39 | 14,914.56 | 6405.921 | 5843.676 | 10,181.5 | 9927.721 | 6234.271 | 9700.415 | |
| rank | 1 | 12 | 6 | 13 | 2 | 10 | 11 | 5 | 3 | 9 | 8 | 4 | 7 | |
| C17-F17 | mean | 2716.564 | 3,542,232 | 5563.724 | 6,967,945 | 4559.569 | 184,224.2 | 14,958.36 | 4828.586 | 5278.937 | 7997.77 | 39,614.15 | 5776.221 | 6664.501 |
| best | 2275.021 | 1,038,583 | 5357.851 | 1,889,136 | 4342.933 | 9201.727 | 9460.883 | 4476.871 | 4357.063 | 7878.394 | 26,201.78 | 5529.464 | 6522.225 | |
| worst | 3429.127 | 8,058,357 | 5938.059 | 16,032,637 | 4772.105 | 488,362.9 | 24,891.01 | 5113.016 | 6672.656 | 8154.271 | 64,020.8 | 5959.869 | 6842.104 | |
| std | 559.6669 | 3,599,997 | 285.066 | 7,238,974 | 230.5594 | 227,763.7 | 7565.855 | 354.7562 | 1118.696 | 137.2394 | 18,218.35 | 204.2189 | 146.0004 | |
| median | 2581.054 | 2,535,993 | 5479.492 | 4,975,004 | 4561.62 | 119,666.1 | 12,740.77 | 4862.229 | 5043.015 | 7979.208 | 34,117.01 | 5807.776 | 6646.838 | |
| rank | 1 | 12 | 5 | 13 | 2 | 11 | 9 | 3 | 4 | 8 | 10 | 6 | 7 | |
| C17-F18 | mean | 1903.746 | 49,047,583 | 2,391,305 | 86,532,758 | 221,894 | 12,535,993 | 10,102,031 | 4,147,266 | 9,226,887 | 13,629,241 | 9,895,380 | 5,430,289 | 5,095,315 |
| best | 1881.15 | 22,229,584 | 1,194,868 | 33,597,693 | 154,720.5 | 4,704,257 | 7,515,295 | 3,100,094 | 2,945,821 | 10,042,328 | 4,568,763 | 3,356,167 | 4,082,969 | |
| worst | 1919.921 | 88,697,678 | 3,786,728 | 1.58E+08 | 399,841.5 | 25,610,542 | 11,954,144 | 6,942,446 | 14,885,570 | 19,248,180 | 21,987,153 | 7,805,783 | 7,356,158 | |
| std | 21.08244 | 30,890,671 | 1,275,149 | 57,152,959 | 129,457.6 | 10,248,095 | 2,197,656 | 2,034,492 | 5,343,871 | 4,298,217 | 8,932,913 | 2,242,128 | 1,673,052 | |
| median | 1906.955 | 42,631,536 | 2,291,812 | 77,153,607 | 166,507 | 9,914,588 | 10,469,342 | 3,273,261 | 9,538,078 | 12,613,229 | 6,512,802 | 5,279,603 | 4,471,066 | |
| rank | 1 | 12 | 3 | 13 | 2 | 10 | 9 | 4 | 7 | 11 | 8 | 6 | 5 | |
| C17-F19 | mean | 1972.839 | 1.07E+10 | 2,450,387 | 1.88E+10 | 267,860 | 4.24E+09 | 1.13E+08 | 14,008,315 | 3.03E+08 | 5.62E+08 | 1.33E+09 | 2.26E+08 | 10,782,637 |
| best | 1967.139 | 9.42E+09 | 980,922.2 | 1.37E+10 | 56,413.89 | 1.88E+09 | 44,711,356 | 8,206,646 | 2,441,625 | 2.44E+08 | 2.39E+08 | 37,668,367 | 5,494,722 | |
| worst | 1977.869 | 1.26E+10 | 4,488,740 | 2.34E+10 | 453,682.7 | 8.42E+09 | 1.9E+08 | 22,221,007 | 9.11E+08 | 1.29E+09 | 2.5E+09 | 4.9E+08 | 19,497,003 | |
| std | 4.935585 | 1.55E+09 | 1,615,719 | 4.34E+09 | 179,384.6 | 3.15E+09 | 73,083,332 | 7,532,410 | 4.61E+08 | 5.36E+08 | 1.23E+09 | 2.38E+08 | 6,754,581 | |
| median | 1973.174 | 1.04E+10 | 2,165,944 | 1.9E+10 | 280,671.7 | 3.33E+09 | 1.08E+08 | 12,802,803 | 1.49E+08 | 3.56E+08 | 1.28E+09 | 1.89E+08 | 9,069,411 | |
| rank | 1 | 12 | 3 | 13 | 2 | 11 | 6 | 5 | 8 | 9 | 10 | 7 | 4 | |
| C17-F20 | mean | 3192.04 | 6799.892 | 5863.746 | 7013.392 | 4445.793 | 6582.15 | 6592.755 | 5556.399 | 5777.929 | 6765.252 | 5985.866 | 5185.77 | 5944.842 |
| best | 2806.762 | 6627.06 | 5556.257 | 6904.666 | 4389.302 | 6043.63 | 6217.504 | 5281.353 | 4719.943 | 6071.329 | 5603.856 | 4568.552 | 5417.463 | |
| worst | 3662.121 | 6958.325 | 6114.165 | 7084.407 | 4506.979 | 7242.068 | 6913.179 | 6021.008 | 6553.599 | 7070.192 | 6214.763 | 5924.889 | 6361.49 | |
| std | 477.9749 | 150.8324 | 284.3249 | 83.28669 | 55.23384 | 559.0573 | 333.4967 | 349.4198 | 984.7558 | 507.6215 | 295.3101 | 631.4043 | 486.8695 | |
| median | 3149.639 | 6807.092 | 5892.281 | 7032.248 | 4443.445 | 6521.452 | 6620.168 | 5461.617 | 5919.088 | 6959.744 | 6062.424 | 5124.82 | 6000.208 | |
| rank | 1 | 12 | 6 | 13 | 2 | 9 | 10 | 4 | 5 | 11 | 8 | 3 | 7 | |
| C17-F21 | mean | 2342.155 | 4030.891 | 3510.961 | 4134.871 | 2811.333 | 3892.34 | 3978.765 | 3150.553 | 2931.257 | 3545.469 | 4389.644 | 3439.937 | 3302.062 |
| best | 2338.689 | 3985.966 | 3336.056 | 4069.352 | 2768.268 | 3771.866 | 3719.434 | 3096.12 | 2863.353 | 3408.401 | 3921.956 | 3284.861 | 3273.431 | |
| worst | 2346.015 | 4094.767 | 3627.267 | 4177.762 | 2844.976 | 3978.86 | 4179.226 | 3262.762 | 2976.534 | 3695.242 | 4761.858 | 3740.055 | 3339.036 | |
| std | 3.664912 | 54.72408 | 136.7255 | 52.09297 | 35.38474 | 110.7836 | 222.9256 | 83.3817 | 52.53036 | 132.5194 | 381.2425 | 225.2292 | 30.25229 | |
| median | 2341.959 | 4021.415 | 3540.261 | 4146.186 | 2816.044 | 3909.317 | 4008.2 | 3121.666 | 2942.57 | 3539.117 | 4437.381 | 3367.415 | 3297.891 | |
| rank | 1 | 11 | 7 | 12 | 2 | 9 | 10 | 4 | 3 | 8 | 13 | 6 | 5 | |
| C17-F22 | mean | 11,739 | 29,370.52 | 19,711.12 | 30,768.17 | 18,401.05 | 28,523.67 | 27,146.66 | 17,214.54 | 22,298.55 | 30,664.87 | 20,471.56 | 21,114.04 | 26,861.63 |
| best | 11,119.08 | 28,683.13 | 18,482.81 | 30,313.72 | 17,099.57 | 27,540.69 | 25,876.73 | 16,180.59 | 18,097.38 | 29,834.73 | 19,786.44 | 19,847.43 | 26,175.5 | |
| worst | 12,601.6 | 29,715.62 | 21,309.93 | 31,235.73 | 20,018.39 | 29,310.11 | 28,022.86 | 17,998.21 | 31,748.26 | 31,044.72 | 20,799.05 | 22,659.88 | 27,485.86 | |
| std | 710.0872 | 506.5825 | 1319.333 | 474.8296 | 1339.001 | 797.8782 | 1024.07 | 902.6408 | 6997.36 | 620.0927 | 504.5512 | 1302.337 | 667.1921 | |
| median | 11,617.67 | 29,541.65 | 19,525.86 | 30,761.61 | 18,243.11 | 28,621.94 | 27,343.52 | 17,339.67 | 19,674.28 | 30,890.02 | 20,650.37 | 20,974.44 | 26,892.59 | |
| rank | 1 | 11 | 4 | 13 | 3 | 10 | 9 | 2 | 7 | 12 | 5 | 6 | 8 | |
| C17-F23 | mean | 2877.697 | 5006.271 | 3970.619 | 5008.105 | 3281.804 | 5108.575 | 4848.228 | 3440.536 | 3553.965 | 4056.188 | 7171.538 | 4611.657 | 4100.543 |
| best | 2872.107 | 4790.632 | 3900.775 | 4778.495 | 3266.443 | 4459.054 | 4729.584 | 3361.269 | 3525.424 | 4009.727 | 6660.73 | 4165.789 | 4042.702 | |
| worst | 2884.013 | 5261.75 | 4047.115 | 5186.927 | 3312.206 | 5991.468 | 4970.577 | 3545.696 | 3592.285 | 4122.332 | 7535.123 | 4845.715 | 4155.234 | |
| std | 5.674312 | 228.9553 | 74.83691 | 184.2031 | 22.41464 | 745.7664 | 125.832 | 85.12362 | 32.16584 | 52.00293 | 429.2467 | 334.1677 | 64.93272 | |
| median | 2877.334 | 4986.35 | 3967.293 | 5033.499 | 3274.283 | 4991.889 | 4846.375 | 3427.59 | 3549.076 | 4046.346 | 7245.149 | 4717.562 | 4102.117 | |
| rank | 1 | 10 | 5 | 11 | 2 | 12 | 9 | 3 | 4 | 6 | 13 | 8 | 7 | |
| C17-F24 | mean | 3327.407 | 7801.681 | 5114.695 | 9482.038 | 3703.964 | 6220.646 | 5972.339 | 3919.074 | 4196.735 | 4586.681 | 9749.777 | 5615.49 | 5117.215 |
| best | 3295.518 | 6191.278 | 4921.353 | 6514.465 | 3656.964 | 5795.549 | 5613.836 | 3854.929 | 3986.73 | 4394.007 | 9185.954 | 5302.044 | 5033.637 | |
| worst | 3357.991 | 8900.02 | 5273.69 | 11,456.62 | 3768.186 | 6501.711 | 6529.455 | 4016.905 | 4376.127 | 4779.769 | 11,221.45 | 6027.595 | 5258.358 | |
| std | 32.22323 | 1409.723 | 167.7738 | 2604.444 | 57.64469 | 327.8437 | 435.2487 | 79.57128 | 220.1476 | 172.536 | 1068.987 | 354.1205 | 108.0711 | |
| median | 3328.059 | 8057.712 | 5131.868 | 9978.536 | 3695.354 | 6292.662 | 5873.032 | 3902.232 | 4212.042 | 4586.474 | 9295.854 | 5566.161 | 5088.433 | |
| rank | 1 | 11 | 6 | 12 | 2 | 10 | 9 | 3 | 4 | 5 | 13 | 8 | 7 | |
| C17-F25 | mean | 3185.232 | 13,529.95 | 4057.362 | 18,688.73 | 3670.92 | 9451.007 | 6751.414 | 3434.623 | 6009.092 | 8117.186 | 9926.001 | 4058.267 | 7249.185 |
| best | 3137.371 | 12,891.38 | 3736.27 | 17,378.7 | 3498.856 | 8870.306 | 6222.759 | 3357.947 | 5886.475 | 7042.655 | 9174.159 | 3815.299 | 6642.467 | |
| worst | 3261.571 | 15,038.01 | 4340.986 | 21,648.26 | 3792.464 | 9824.884 | 7059.572 | 3496.658 | 6333.98 | 9539.192 | 11,233.8 | 4427.694 | 7851.922 | |
| std | 65.17161 | 1103.36 | 271.7265 | 2191 | 134.2336 | 469.9241 | 415.3623 | 62.94,321 | 236.5814 | 1237.829 | 986.7667 | 318.7455 | 685.3193 | |
| median | 3170.992 | 13,095.21 | 4076.096 | 17,863.99 | 3696.18 | 9554.419 | 6861.663 | 3441.944 | 5907.958 | 7943.448 | 9648.021 | 3995.038 | 7251.174 | |
| rank | 1 | 12 | 4 | 13 | 3 | 10 | 7 | 2 | 6 | 9 | 11 | 5 | 8 | |
| C17-F26 | mean | 5757.621 | 35,167.72 | 22,517.65 | 40,224.61 | 11,453.1 | 29,897.3 | 30,431.15 | 11,630.83 | 15,907.27 | 21,863.98 | 30,347.8 | 19,176.1 | 21,128.3 |
| best | 5645.905 | 34,635.44 | 20,138.23 | 37,982.62 | 10,749.82 | 28,911.34 | 27,353.64 | 10,406.38 | 14,350.84 | 18,216.51 | 29,245.56 | 17,272.12 | 19,652.66 | |
| worst | 5844.642 | 35,653.47 | 24,926.9 | 41,621.02 | 12,187.39 | 30,511.54 | 33,052.29 | 13,730.92 | 17,185.39 | 26,505.71 | 31,963.87 | 20,940.26 | 22,125.46 | |
| std | 91.29453 | 453.0954 | 2255.433 | 1857.913 | 771.9566 | 759.8127 | 3004.529 | 1575.844 | 1323.715 | 3737.738 | 1264.799 | 1698.289 | 1169.621 | |
| median | 5769.969 | 35,190.99 | 22,502.73 | 40,647.39 | 11,437.59 | 30,083.17 | 30,659.34 | 11,193 | 16,046.42 | 21,366.86 | 30,090.88 | 19,246.01 | 21,367.54 | |
| rank | 1 | 12 | 8 | 13 | 2 | 9 | 11 | 3 | 4 | 7 | 10 | 5 | 6 | |
| C17-F27 | mean | 3309.493 | 8472.462 | 4065.701 | 10,998.58 | 3528.702 | 6150.218 | 5640.525 | 3605.339 | 3996.688 | 4207.603 | 12,507.41 | 3990.172 | 5196.33 |
| best | 3278.01 | 7203.499 | 3921.095 | 8352.904 | 3490.261 | 5886.739 | 5039.378 | 3571.895 | 3854.157 | 3968.798 | 12,213.88 | 3815.176 | 4971.8 | |
| worst | 3344.5 | 9747.033 | 4311.362 | 13,743.24 | 3561.724 | 6472.084 | 6305.127 | 3689.085 | 4107.092 | 4605.08 | 12,737.12 | 4166.644 | 5535.875 | |
| std | 30.85754 | 1501.857 | 184.5849 | 3159.148 | 32.00686 | 274.7479 | 745.8619 | 61.13918 | 136.8499 | 308.7915 | 258.9872 | 207.5626 | 262.3963 | |
| median | 3307.732 | 8469.659 | 4015.173 | 10,949.09 | 3531.412 | 6121.026 | 5608.799 | 3580.188 | 4012.751 | 4128.266 | 12,539.32 | 3989.434 | 5138.822 | |
| rank | 1 | 11 | 6 | 12 | 2 | 10 | 9 | 3 | 5 | 7 | 13 | 4 | 8 | |
| C17-F28 | mean | 3322.242 | 18,389.38 | 4558.61 | 24,650.68 | 3759.304 | 13,947.47 | 9399.017 | 3492.414 | 8456.179 | 10,080.85 | 16,594.61 | 7067.786 | 10,348.93 |
| best | 3318.742 | 17,167.17 | 4302.082 | 22,119.53 | 3638.049 | 11,064.52 | 8088.89 | 3423.227 | 7249.838 | 7994.173 | 14,371.5 | 4945.502 | 9470.138 | |
| worst | 3327.816 | 20,674.35 | 4735.228 | 27,803.32 | 3845.863 | 16,143.37 | 10,248.76 | 3564.13 | 10,195.47 | 11,924.7 | 18,271.02 | 10,653.51 | 11,327.38 | |
| std | 4.767125 | 1741.216 | 202.5309 | 2590.902 | 95.07424 | 2644.481 | 1002.041 | 62.67904 | 1354.176 | 1990.043 | 1774.385 | 2826.363 | 1074.312 | |
| median | 3321.205 | 17,858.01 | 4598.564 | 24,339.94 | 3776.653 | 14,290.99 | 9629.211 | 3491.149 | 8189.702 | 10,202.27 | 16,867.96 | 6336.069 | 10,299.1 | |
| rank | 1 | 12 | 4 | 13 | 3 | 10 | 7 | 2 | 6 | 8 | 11 | 5 | 9 | |
| C17-F29 | mean | 4450.696 | 157,317.8 | 9139.852 | 298,621.5 | 6805.141 | 16,662.4 | 15,041.71 | 8338.592 | 8016.546 | 11,529.03 | 22,196.27 | 8307.764 | 11,023.77 |
| best | 4169.151 | 90,006.73 | 8041.684 | 160,652.4 | 6002.795 | 13,000.42 | 12,596.71 | 7548.871 | 7769.158 | 10,697.55 | 18,567.74 | 7738.827 | 10,779.1 | |
| worst | 4829.521 | 214,340.3 | 9695.661 | 414,215.6 | 7560.201 | 20,865.25 | 17,104.72 | 8887.513 | 8277.739 | 12,142.5 | 28,742.04 | 8977.924 | 11,517.96 | |
| std | 307.1569 | 57,574.73 | 814.4624 | 117,534.7 | 693.9889 | 3584.829 | 2382.752 | 617.3333 | 242.3973 | 662.0945 | 5174.887 | 661.4283 | 366.7167 | |
| median | 4402.056 | 162,462.1 | 9411.032 | 309,809 | 6828.783 | 16,391.97 | 15,232.7 | 8458.992 | 8009.643 | 11,638.04 | 20,737.64 | 8257.153 | 10,899.02 | |
| rank | 1 | 12 | 6 | 13 | 2 | 10 | 9 | 5 | 3 | 8 | 11 | 4 | 7 | |
| C17-F30 | mean | 5407.166 | 1.97E+10 | 24,130,069 | 3.21E+10 | 4,546,185 | 1.14E+10 | 1.28E+09 | 88,083,440 | 1.56E+09 | 3.22E+09 | 6.25E+09 | 5.15E+08 | 5.67E+08 |
| best | 5337.48 | 1.73E+10 | 13,795,207 | 3E+10 | 2,025,882 | 6.93E+09 | 1.05E+09 | 54,762,921 | 6.42E+08 | 1.21E+09 | 4.46E+09 | 1.26E+08 | 4.73E+08 | |
| worst | 5557.155 | 2.14E+10 | 41,706,015 | 3.47E+10 | 7,423,374 | 1.41E+10 | 1.73E+09 | 1.08E+08 | 2.04E+09 | 5.97E+09 | 7.57E+09 | 1.59E+09 | 6.07E+08 | |
| std | 110.0477 | 1.89E+09 | 13,513,044 | 2.21E+09 | 2,713,659 | 3.42E+09 | 3.35E+08 | 25,767,589 | 6.85E+08 | 2.6E+09 | 1.43E+09 | 7.84E+08 | 68,320,415 | |
| median | 5367.014 | 2.01E+10 | 20,509,527 | 3.18E+10 | 4,367,742 | 1.23E+10 | 1.17E+09 | 94,878,086 | 1.78E+09 | 2.85E+09 | 6.49E+09 | 1.7E+08 | 5.93E+08 | |
| rank | 1 | 12 | 3 | 13 | 2 | 11 | 7 | 4 | 8 | 9 | 10 | 5 | 6 | |
| Sum rank | 29 | 336 | 140 | 355 | 65 | 293 | 265 | 114 | 156 | 249 | 272 | 162 | 203 | |
| Mean rank | 1 | 11.58621 | 4.827586 | 12.24138 | 2.241379 | 10.10345 | 9.137931 | 3.931034 | 5.37931 | 8.586207 | 9.37931 | 5.586207 | 7 | |
| Total rank | 1 | 12 | 4 | 13 | 2 | 11 | 9 | 3 | 5 | 8 | 10 | 6 | 7 | |
| Compared Algorithm | Objective Function Type | |||
|---|---|---|---|---|
| CEC 2017 | ||||
| D = 10 | D = 30 | D = 50 | D = 100 | |
| GAO vs. WSO | 2.58E−34 | 2.58E−34 | 2.58E−34 | 2.58E−34 |
| GAO vs. AVOA | 3.03E−25 | 4.23E−21 | 2.58E−34 | 2.58E−34 |
| GAO vs. RSA | 2.58E−34 | 2.58E−34 | 2.58E−34 | 2.58E−34 |
| GAO vs. MPA | 1.61E−29 | 5.26E−16 | 8.68E−31 | 2.58E−34 |
| GAO vs. TSA | 7.63E−34 | 2.58E−34 | 2.58E−34 | 2.58E−34 |
| GAO vs. WOA | 7.63E−34 | 2.58E−34 | 2.58E−34 | 2.58E−34 |
| GAO vs. MVO | 6.08E−26 | 7.11E−21 | 2.58E−34 | 2.58E−34 |
| GAO vs. GWO | 8.19E−32 | 2.58E−34 | 2.58E−34 | 2.58E−34 |
| GAO vs. TLBO | 2.97E−32 | 2.58E−34 | 2.58E−34 | 2.58E−34 |
| GAO vs. GSA | 1.29E−27 | 6.21E−21 | 2.58E−34 | 2.58E−34 |
| GAO vs. PSO | 6.24E−28 | 1.89E−21 | 2.58E−34 | 2.58E−34 |
| GAO vs. GA | 5.17E−28 | 2.58E−34 | 2.58E−34 | 2.58E−34 |
| GAO | WSO | AVOA | RSA | MPA | TSA | WOA | MVO | GWO | TLBO | GSA | PSO | GA | ||
|---|---|---|---|---|---|---|---|---|---|---|---|---|---|---|
| C11-F1 | mean | 5.920103 | 16.74641 | 12.47935 | 20.60699 | 7.613273 | 17.40635 | 12.74259 | 13.42229 | 10.58714 | 17.43517 | 20.35526 | 16.99013 | 21.88339 |
| best | 2E−10 | 13.86501 | 8.478707 | 18.18457 | 0.380987 | 16.50584 | 7.451926 | 11.38898 | 1.050147 | 16.64263 | 17.71226 | 10.14258 | 20.69375 | |
| worst | 12.30606 | 19.6453 | 16.37007 | 23.21547 | 12.69538 | 19.05236 | 16.77422 | 15.48484 | 16.38551 | 18.69533 | 22.1194 | 23.16349 | 24.33594 | |
| std | 7.476538 | 3.058894 | 4.906722 | 2.611096 | 6.161367 | 1.264455 | 4.734219 | 2.406333 | 7.278318 | 1.063321 | 2.051999 | 6.277694 | 1.854985 | |
| median | 5.687176 | 16.73766 | 12.53432 | 20.51396 | 8.688362 | 17.03359 | 13.37211 | 13.40768 | 12.45645 | 17.20137 | 20.79468 | 17.32722 | 21.25194 | |
| rank | 1 | 7 | 4 | 12 | 2 | 9 | 5 | 6 | 3 | 10 | 11 | 8 | 13 | |
| C11-F2 | mean | −26.3179 | −15.5172 | −21.4594 | −13.0022 | −25.0711 | −12.7516 | −19.2977 | −10.5326 | −22.8812 | −12.4007 | −16.5475 | −22.9249 | −14.2156 |
| best | −27.0676 | −16.7338 | −22.0088 | −13.416 | −25.7089 | −16.1048 | −22.3643 | −12.4163 | −24.773 | −13.5327 | −21.127 | −24.2021 | −16.3132 | |
| worst | −25.4328 | −14.5198 | −20.8937 | −12.6713 | −23.7335 | −10.8719 | −15.8013 | −9.00571 | −19.5197 | −11.4832 | −12.7537 | −20.8714 | −12.7783 | |
| std | 0.767703 | 1.191398 | 0.561161 | 0.413033 | 1.005704 | 2.689933 | 3.636791 | 1.601866 | 2.551853 | 0.95683 | 4.12006 | 1.566969 | 1.883805 | |
| median | −26.3856 | −15.4077 | −21.4675 | −12.9608 | −25.421 | −12.0149 | −19.5127 | −10.3543 | −23.616 | −12.2934 | −16.1546 | −23.313 | −13.8855 | |
| rank | 1 | 8 | 5 | 10 | 2 | 11 | 6 | 13 | 4 | 12 | 7 | 3 | 9 | |
| C11-F4 | mean | 1.15E−05 | 1.15E−05 | 1.15E−05 | 1.15E−05 | 1.15E−05 | 1.15E−05 | 1.15E−05 | 1.15E−05 | 1.15E−05 | 1.15E−05 | 1.15E−05 | 1.15E−05 | 1.15E−05 |
| best | 1.15E−05 | 1.15E−05 | 1.15E−05 | 1.15E−05 | 1.15E−05 | 1.15E−05 | 1.15E−05 | 1.15E−05 | 1.15E−05 | 1.15E−05 | 1.15E−05 | 1.15E−05 | 1.15E−05 | |
| worst | 1.15E−05 | 1.15E−05 | 1.15E−05 | 1.15E−05 | 1.15E−05 | 1.15E−05 | 1.15E−05 | 1.15E−05 | 1.15E−05 | 1.15E−05 | 1.15E−05 | 1.15E−05 | 1.15E−05 | |
| std | 2.08E−19 | 2.03E−11 | 2.33E−09 | 4.57E−11 | 1.3E−15 | 2.17E−14 | 1.58E−16 | 9.12E−13 | 3.57E−15 | 7.19E−14 | 1.58E−16 | 1.58E−16 | 1.58E−16 | |
| median | 1.15E−05 | 1.15E−05 | 1.15E−05 | 1.15E−05 | 1.15E−05 | 1.15E−05 | 1.15E−05 | 1.15E−05 | 1.15E−05 | 1.15E−05 | 1.15E−05 | 1.15E−05 | 1.15E−05 | |
| rank | 1 | 11 | 13 | 12 | 6 | 8 | 4 | 10 | 7 | 9 | 3 | 2 | 5 | |
| C11-F4 | mean | 0 | 0 | 0 | 0 | 0 | 0 | 0 | 0 | 0 | 0 | 0 | 0 | 0 |
| best | 0 | 0 | 0 | 0 | 0 | 0 | 0 | 0 | 0 | 0 | 0 | 0 | 0 | |
| worst | 0 | 0 | 0 | 0 | 0 | 0 | 0 | 0 | 0 | 0 | 0 | 0 | 0 | |
| std | 0 | 0 | 0 | 0 | 0 | 0 | 0 | 0 | 0 | 0 | 0 | 0 | 0 | |
| median | 0 | 0 | 0 | 0 | 0 | 0 | 0 | 0 | 0 | 0 | 0 | 0 | 0 | |
| rank | 1 | 1 | 1 | 1 | 1 | 1 | 1 | 1 | 1 | 1 | 1 | 1 | 1 | |
| C11-F5 | mean | −34.1274 | −25.7765 | −28.7022 | −21.4775 | −33.271 | −27.837 | −28.2791 | −27.7131 | −31.7667 | −13.3239 | −28.0292 | −11.4033 | −12.1662 |
| best | −34.7494 | −26.8331 | −29.7227 | −23.4213 | −33.8557 | −31.7971 | −28.4609 | −31.7451 | −34.1148 | −15.2637 | −31.5688 | −14.3978 | −13.2792 | |
| worst | −33.3862 | −24.7915 | −28.1294 | −19.226 | −31.9367 | −23.1816 | −27.9722 | −25.5891 | −28.0378 | −11.9458 | −25.2806 | −9.92524 | −10.7534 | |
| std | 0.612958 | 0.950695 | 0.77194 | 2.38908 | 0.977388 | 3.870035 | 0.250642 | 3.142491 | 2.849728 | 1.541204 | 3.011529 | 2.295861 | 1.2422 | |
| median | −34.1871 | −25.7407 | −28.4783 | −21.6314 | −33.6458 | −28.1847 | −28.3416 | −26.7591 | −32.4571 | −13.043 | −27.6336 | −10.6451 | −12.3162 | |
| rank | 1 | 9 | 4 | 10 | 2 | 7 | 5 | 8 | 3 | 11 | 6 | 13 | 12 | |
| C11-F6 | mean | −24.1119 | −15.0062 | −19.4362 | −14.1244 | −22.6084 | −9.25983 | −20.2537 | −11.008 | −19.9677 | −4.61236 | −21.9655 | −5.38056 | −6.18492 |
| best | −27.4298 | −15.3693 | −21.0438 | −14.6552 | −25.7439 | −17.0765 | −22.8753 | −17.9544 | −22.7828 | −5.25001 | −25.9902 | −8.32281 | −10.6604 | |
| worst | −23.0059 | −14.6561 | −17.7919 | −13.074 | −21.3201 | −6.21322 | −13.9021 | −4.37018 | −18.359 | −4.37018 | −18.7012 | −4.37018 | −4.37018 | |
| std | 2.415463 | 0.362766 | 1.575989 | 0.780164 | 2.313354 | 5.723676 | 4.671589 | 7.853513 | 2.296056 | 0.466472 | 3.484428 | 2.142492 | 3.286726 | |
| median | −23.0059 | −14.9997 | −19.4545 | −14.3841 | −21.6849 | −6.87477 | −22.1187 | −10.8537 | −19.3646 | −4.41462 | −21.5854 | −4.41462 | −4.85453 | |
| rank | 1 | 7 | 6 | 8 | 2 | 10 | 4 | 9 | 5 | 13 | 3 | 12 | 11 | |
| C11-F7 | mean | 0.860699 | 1.525865 | 1.242141 | 1.802371 | 0.929865 | 1.257862 | 1.647066 | 0.887071 | 1.051349 | 1.625096 | 1.061967 | 1.100668 | 1.644276 |
| best | 0.582266 | 1.451887 | 1.112942 | 1.598764 | 0.757869 | 1.085156 | 1.552518 | 0.840735 | 0.831043 | 1.466068 | 0.86985 | 0.853582 | 1.279595 | |
| worst | 1.025027 | 1.625584 | 1.376489 | 1.968587 | 1.011582 | 1.588703 | 1.802521 | 0.960573 | 1.258512 | 1.753067 | 1.246812 | 1.322056 | 1.83421 | |
| std | 0.219737 | 0.080974 | 0.155593 | 0.166559 | 0.127917 | 0.245827 | 0.117904 | 0.061752 | 0.190899 | 0.139933 | 0.185054 | 0.257758 | 0.274052 | |
| median | 0.91775 | 1.512994 | 1.239567 | 1.821066 | 0.975005 | 1.178795 | 1.616613 | 0.873488 | 1.057921 | 1.640626 | 1.065602 | 1.113517 | 1.731649 | |
| rank | 1 | 9 | 7 | 13 | 3 | 8 | 12 | 2 | 4 | 10 | 5 | 6 | 11 | |
| C11-F8 | mean | 220 | 277.756 | 238.4052 | 313.4897 | 222.463 | 253.2859 | 261.0367 | 223.905 | 226.789 | 223.905 | 243.6012 | 440.9517 | 222.5031 |
| best | 220 | 254.6314 | 223.8045 | 277.5593 | 220 | 220 | 242.3511 | 220 | 220 | 220 | 220 | 245.4346 | 220 | |
| worst | 220 | 308.7868 | 253.606 | 352.6647 | 224.926 | 339.5656 | 302.0734 | 234.4201 | 233.5781 | 235.0201 | 285.4904 | 530.1433 | 229.4123 | |
| std | 0 | 25.96257 | 14.00974 | 33.66547 | 3.105763 | 63.2005 | 30.12558 | 7.661323 | 8.560688 | 8.097811 | 33.93451 | 146.9772 | 5.039474 | |
| median | 220 | 273.8029 | 238.1052 | 311.8675 | 222.463 | 226.789 | 249.8612 | 220.6 | 226.789 | 220.3 | 234.4572 | 494.1144 | 220.3 | |
| rank | 1 | 10 | 6 | 11 | 2 | 8 | 9 | 4 | 5 | 4 | 7 | 12 | 3 | |
| C11-F9 | mean | 8789.286 | 495,628.6 | 337,304.8 | 942,375.5 | 20,289.66 | 61,028.87 | 334,059.8 | 120,463.1 | 40,488.79 | 364,116.3 | 731,137.6 | 960,487.9 | 1,721,875 |
| best | 5457.674 | 332,586 | 299,628.8 | 616,714.2 | 11,047.41 | 45,559.44 | 184,837.1 | 68,871.61 | 17,607.44 | 301,247 | 626,497.6 | 770,332.1 | 1,650,717 | |
| worst | 14,042.29 | 570,171.3 | 361,787 | 1,106,235 | 28,881.93 | 76,423.83 | 563,855.9 | 181,648.1 | 70,024.01 | 466,965.3 | 785,786.6 | 1,176,387 | 1,822,159 | |
| std | 4040.59 | 121,883.4 | 29,840.72 | 241,894.9 | 8616.991 | 14,638 | 188,476.8 | 50,889.21 | 24,188.06 | 79,408.16 | 77,704.14 | 237,012.5 | 91,820.42 | |
| median | 7828.591 | 539,878.5 | 343,901.7 | 1,023,277 | 20,614.66 | 61,066.11 | 293,773.2 | 115,666.3 | 37,161.85 | 344,126.5 | 756,133.1 | 947,616.3 | 1,707,313 | |
| rank | 1 | 9 | 7 | 11 | 2 | 4 | 6 | 5 | 3 | 8 | 10 | 12 | 13 | |
| C11-F10 | mean | −21.4889 | −14.5416 | −17.1501 | −13.0457 | −19.0113 | −14.9125 | −13.5714 | −15.1881 | −14.6597 | −12.1691 | −13.8193 | −12.2573 | −11.996 |
| best | −21.8299 | −15.5735 | −17.3545 | −13.4342 | −19.4012 | −18.8263 | −14.1193 | −20.9515 | −15.1354 | −12.2888 | −14.3188 | −12.3375 | −12.0839 | |
| worst | −20.7878 | −14.0389 | −16.7705 | −12.8424 | −18.6173 | −12.8716 | −13.1807 | −12.2848 | −13.5969 | −12.0396 | −13.0951 | −12.1735 | −11.8831 | |
| std | 0.518028 | 0.764494 | 0.297295 | 0.297232 | 0.43758 | 2.932237 | 0.430196 | 4.264594 | 0.7905 | 0.126608 | 0.657859 | 0.080422 | 0.094638 | |
| median | −21.669 | −14.277 | −17.2377 | −12.9532 | −19.0134 | −13.976 | −13.4928 | −13.7581 | −14.9532 | −12.1739 | −13.9316 | −12.2591 | −12.0085 | |
| rank | 1 | 7 | 3 | 10 | 2 | 5 | 9 | 4 | 6 | 12 | 8 | 11 | 13 | |
| C11-F11 | mean | 571,712.3 | 5,328,958 | 1,075,534 | 8,031,460 | 1,666,015 | 5,454,829 | 1,273,865 | 1,355,976 | 3,588,035 | 4,805,107 | 1,446,911 | 4,814,899 | 5,612,143 |
| best | 260,837.9 | 5,076,905 | 873,531.3 | 7,760,848 | 1,551,469 | 4,560,614 | 1,162,788 | 748,605.8 | 3,403,937 | 4,770,608 | 1,304,077 | 4,785,378 | 5,565,110 | |
| worst | 828,560.9 | 5,661,658 | 1,250,006 | 8,214,168 | 1,800,123 | 6,560,319 | 1,431,883 | 2,601,629 | 3,895,613 | 4,841,240 | 1,610,216 | 4,842,787 | 5,662,076 | |
| std | 271,080 | 298,039 | 180,691.1 | 209,754.4 | 130,844.8 | 901,463.8 | 125,636.6 | 918,912.5 | 233,276 | 35,734.2 | 137,640.7 | 34,263.64 | 45,115.52 | |
| median | 598,725.2 | 5,288,634 | 1,089,299 | 8,075,412 | 1,656,234 | 5,349,191 | 1,250,395 | 1,036,835 | 3,526,294 | 4,804,290 | 1,436,677 | 4,815,717 | 5,610,694 | |
| rank | 1 | 10 | 2 | 13 | 6 | 11 | 3 | 4 | 7 | 8 | 5 | 9 | 12 | |
| C11-F12 | mean | 1,199,805 | 7,565,001 | 3,131,984 | 11,847,407 | 1,275,035 | 4,593,958 | 5,288,069 | 1,321,780 | 1,407,168 | 12,813,481 | 5,265,826 | 2,193,624 | 12,955,713 |
| best | 1,155,937 | 7,249,457 | 3,037,655 | 11,005,819 | 1,199,042 | 4,365,138 | 4,921,550 | 1,191,166 | 1,253,032 | 12,079,057 | 5,013,496 | 2,052,641 | 12,839,240 | |
| worst | 1,249,353 | 7,846,572 | 3,201,406 | 12,588,956 | 1,354,436 | 4,711,793 | 5,463,430 | 1,445,492 | 1,539,003 | 13,381,134 | 5,440,440 | 2,374,365 | 13,075,086 | |
| std | 48,993.46 | 269,902.4 | 77,934.33 | 709,107.4 | 74,270.29 | 176,865.1 | 274,490.1 | 114,079 | 129,661.2 | 596,428.5 | 201,014.3 | 145,668.3 | 105,930.4 | |
| median | 1,196,965 | 7,581,987 | 3,144,437 | 11,897,426 | 1,273,331 | 4,649,451 | 5,383,648 | 1,325,231 | 1,418,318 | 12,896,866 | 5,304,684 | 2,173,745 | 12,954,263 | |
| rank | 1 | 10 | 6 | 11 | 2 | 7 | 9 | 3 | 4 | 12 | 8 | 5 | 13 | |
| C11-F13 | mean | 15,444.2 | 15,812.19 | 15,449.88 | 16,212.57 | 15,463.3 | 15,487.2 | 15,527.25 | 15,502.86 | 15,496.86 | 15,879.01 | 115,295.8 | 15,487.77 | 28,322.83 |
| best | 15,444.19 | 15,647.84 | 15,448.97 | 15,844.33 | 15,460.98 | 15,478.15 | 15,489.1 | 15,485.46 | 15,490.45 | 15,608.37 | 83,844.39 | 15,472.25 | 15,460.73 | |
| worst | 15,444.21 | 16,210.14 | 15,450.58 | 17,127.49 | 15,467.32 | 15,498.33 | 15,579.17 | 15,536.74 | 15,507.94 | 16,377.02 | 157,954.9 | 15,520.56 | 66,597.52 | |
| std | 0.009445 | 292.5405 | 0.736869 | 671.5627 | 3.070858 | 10.66753 | 45.92712 | 26.08555 | 8.466667 | 379.7534 | 36,436.54 | 24.13568 | 27,864.62 | |
| median | 15,444.2 | 15,695.38 | 15,449.99 | 15,939.23 | 15,462.46 | 15,486.17 | 15,520.37 | 15,494.63 | 15,494.52 | 15,765.32 | 109,691.9 | 15,479.13 | 15,616.53 | |
| rank | 1 | 9 | 2 | 11 | 3 | 4 | 8 | 7 | 6 | 10 | 13 | 5 | 12 | |
| C11-F14 | mean | 18,295.35 | 101,653.8 | 18,531.86 | 204,818.7 | 18,610.08 | 19,427.05 | 19,156.72 | 19,328.03 | 19,162.86 | 277,104.2 | 19,039.05 | 19,067.85 | 19,056.56 |
| best | 18,241.58 | 77,844.33 | 18,433.29 | 151,402.6 | 18,525.09 | 19,197.39 | 19,010.34 | 19,228.27 | 19,023.04 | 28,919.66 | 18,780.81 | 18,920.4 | 18,802.38 | |
| worst | 18,388.08 | 141,318.6 | 18,627.71 | 294,218.2 | 18,686.26 | 19,915.98 | 19,266.53 | 19,403.53 | 19,330.36 | 532,867 | 19,214.64 | 19,206.21 | 19,324.98 | |
| std | 74.38679 | 31,002.63 | 100.4132 | 69,857.14 | 75.5763 | 359.6829 | 130.2265 | 82.13068 | 148.4293 | 264,198.4 | 207.9666 | 127.972 | 233.6991 | |
| median | 18,275.87 | 93,726.14 | 18,533.22 | 186,827.1 | 18,614.48 | 19,297.4 | 19,175 | 19,340.15 | 19,149.02 | 273,315.1 | 19,080.37 | 19,072.4 | 19,049.45 | |
| rank | 1 | 11 | 2 | 12 | 3 | 10 | 7 | 9 | 8 | 13 | 4 | 6 | 5 | |
| C11-F15 | mean | 32,883.58 | 807,662.7 | 99,246.56 | 1,698,853 | 32,948.86 | 52,073.78 | 197,302.8 | 33,083.1 | 33,063.51 | 13,654,593 | 269,150.9 | 33,249.55 | 7,029,271 |
| best | 32,782.17 | 335,111.3 | 42,006.57 | 712,650.2 | 32,870.55 | 33,044.86 | 32,994.05 | 32,999.45 | 33,025.79 | 2,864,102 | 238,633.6 | 33,238.56 | 3,201,535 | |
| worst | 32,956.46 | 2,025,189 | 163,300.4 | 4,428,557 | 33,019.16 | 108,933.8 | 280,775.5 | 33,136.06 | 33,129.28 | 20,360,257 | 290,038.3 | 33,267.85 | 12,044,118 | |
| std | 79.94256 | 889,583.9 | 71,193.56 | 1,990,353 | 66.4763 | 41,394.96 | 122,156.8 | 65.47578 | 51.66162 | 8,687,568 | 26,115.39 | 14.21884 | 4,427,529 | |
| median | 32,897.86 | 435,175.2 | 95,839.63 | 827,102.2 | 32,952.87 | 33,158.25 | 237,720.8 | 33,098.45 | 33,049.48 | 15,697,006 | 273,965.9 | 33,245.9 | 6,435,715 | |
| rank | 1 | 10 | 7 | 11 | 2 | 6 | 8 | 4 | 3 | 13 | 9 | 5 | 12 | |
| C11-F16 | mean | 133,550 | 852,515.9 | 135,494.4 | 1,741,395 | 137,689.9 | 144,300.8 | 141,678.2 | 141,363.5 | 144,961.1 | 78,713,310 | 16,589,469 | 70,453,795 | 67,648,001 |
| best | 131,374.2 | 271,555.2 | 133,906.1 | 435,162.3 | 135,606.9 | 141,665.4 | 136,481.6 | 133,721.9 | 142,697.5 | 76,704,271 | 8,433,558 | 58,281,367 | 54,676,847 | |
| worst | 136,310.8 | 1,992,858 | 136,234.8 | 4,304,701 | 141,382.2 | 145,887.3 | 146,823.4 | 148,906.5 | 150,289.6 | 80,979,120 | 30,001,092 | 84,187,611 | 86,522,477 | |
| std | 2485.329 | 845,493.3 | 1168.748 | 1,900,510 | 2815.212 | 2202.366 | 4704.048 | 6908.098 | 3912.739 | 1,956,382 | 10,183,919 | 12,193,902 | 14,772,336 | |
| median | 133,257.5 | 572,825.3 | 135,918.4 | 1,112,859 | 136,885.2 | 144,825.3 | 141,703.9 | 141,412.9 | 143,428.7 | 78,584,925 | 13,961,613 | 69,673,101 | 64,696,339 | |
| rank | 1 | 8 | 2 | 9 | 3 | 6 | 5 | 4 | 7 | 13 | 10 | 12 | 11 | |
| C11-F17 | mean | 1,926,615 | 7.93E+09 | 2.05E+09 | 1.37E+10 | 2,293,861 | 1.13E+09 | 8.58E+09 | 3,020,765 | 2,938,888 | 1.98E+10 | 9.93E+09 | 1.84E+10 | 1.94E+10 |
| best | 1,916,953 | 6.76E+09 | 1.86E+09 | 9.87E+09 | 1,957,675 | 9.36E+08 | 6.12E+09 | 2,291,610 | 2,029,200 | 1.9E+10 | 8.73E+09 | 1.63E+10 | 1.81E+10 | |
| worst | 1,942,685 | 8.8E+09 | 2.24E+09 | 1.68E+10 | 2,915,059 | 1.3E+09 | 1.14E+10 | 3,551,652 | 4,662,207 | 2.06E+10 | 1.05E+10 | 2.13E+10 | 2.19E+10 | |
| std | 12,470.83 | 9.84E+08 | 1.83E+08 | 3.25E+09 | 468,908.4 | 2.03E+08 | 2.43E+09 | 620,050.3 | 1,295,060 | 7.28E+08 | 8.83E+08 | 2.49E+09 | 1.87E+09 | |
| median | 1,923,412 | 8.09E+09 | 2.05E+09 | 1.41E+10 | 2,151,356 | 1.15E+09 | 8.4E+09 | 3,119,900 | 2,532,073 | 1.97E+10 | 1.02E+10 | 1.81E+10 | 1.87E+10 | |
| rank | 1 | 7 | 6 | 10 | 2 | 5 | 8 | 4 | 3 | 13 | 9 | 11 | 12 | |
| C11-F18 | mean | 942,057.5 | 48,788,595 | 5,915,000 | 1.05E+08 | 971,984.9 | 1,926,661 | 8,592,280 | 986,474.2 | 1,024,549 | 27,556,574 | 9,963,062 | 1.2E+08 | 1.02E+08 |
| best | 938,416.2 | 33,587,280 | 3,598,584 | 72,496,984 | 949,866.2 | 1,696,441 | 3,757,481 | 972,178.6 | 965,175.1 | 21,861,781 | 7,461,469 | 1E+08 | 97,794,840 | |
| worst | 944,706.9 | 55,479,310 | 10,072,337 | 1.2E+08 | 1,030,674 | 2,227,417 | 15,006,887 | 993,724.5 | 1,181,666 | 29,806,868 | 12,546,238 | 1.33E+08 | 1.05E+08 | |
| std | 2882.138 | 11,196,197 | 3,292,143 | 24,174,063 | 42,861.31 | 277,004.9 | 5,187,569 | 10,717.17 | 114,623.8 | 4,163,281 | 2,480,176 | 15,806,321 | 3,328,144 | |
| median | 942,553.5 | 53,043,894 | 4,994,539 | 1.14E+08 | 953,699.6 | 1,891,392 | 7,802,376 | 989,996.7 | 975,677.3 | 29,278,824 | 9,922,270 | 1.23E+08 | 1.02E+08 | |
| rank | 1 | 10 | 6 | 12 | 2 | 5 | 7 | 3 | 4 | 9 | 8 | 13 | 11 | |
| C11-F19 | mean | 1,025,341 | 48,045,429 | 6,024,330 | 1.03E+08 | 1,138,731 | 2,312,239 | 9,177,497 | 1,438,696 | 1,337,888 | 31,640,166 | 5,679,788 | 1.53E+08 | 1.02E+08 |
| best | 967,927.7 | 41,007,057 | 5,529,035 | 88,789,545 | 1,068,540 | 2,091,831 | 1,949,236 | 1,124,620 | 1,214,014 | 22,188,480 | 2,262,615 | 1.39E+08 | 99,335,591 | |
| worst | 1,167,142 | 61,046,693 | 7,266,048 | 1.29E+08 | 1,293,909 | 2,700,255 | 16,514,231 | 1,862,140 | 1,516,560 | 39,430,521 | 7,413,240 | 1.77E+08 | 1.05E+08 | |
| std | 103,555.5 | 9,868,988 | 909,126.9 | 20,540,250 | 114,017.5 | 291,364.9 | 7,492,785 | 336,266.6 | 139,372.1 | 8,153,343 | 2,551,795 | 18,022,451 | 2,504,883 | |
| median | 983,146.6 | 45,063,983 | 5,651,119 | 96,595,837 | 1,096,237 | 2,228,435 | 9,123,261 | 1,384,012 | 1,310,489 | 32,470,832 | 6,521,648 | 1.48E+08 | 1.02E+08 | |
| rank | 1 | 10 | 7 | 12 | 2 | 5 | 8 | 4 | 3 | 9 | 6 | 13 | 11 | |
| C11-F20 | mean | 941,250.4 | 51,056,364 | 5,326,862 | 1.11E+08 | 960,500.6 | 1,727,330 | 6,556,181 | 971,537.3 | 994,311.4 | 30,716,418 | 12,744,216 | 1.41E+08 | 1.02E+08 |
| best | 936,143.2 | 44,933,180 | 4,709,950 | 97,107,724 | 957,168.3 | 1,564,565 | 6,183,561 | 962,742.4 | 975,262.1 | 30,044,795 | 8,502,443 | 1.29E+08 | 97,262,940 | |
| worst | 946,866.6 | 60,440,462 | 5,986,883 | 1.32E+08 | 962,608 | 1,997,607 | 7,053,710 | 981,674.9 | 1,009,090 | 31,442,402 | 19,667,237 | 1.53E+08 | 1.06E+08 | |
| std | 5208.733 | 7,215,894 | 578,753.3 | 16,195,092 | 2558.588 | 224,547 | 406,329.4 | 9206.801 | 15,914.84 | 634,789.9 | 5,328,269 | 14,753,402 | 3,998,704 | |
| median | 940,995.9 | 49,425,907 | 5,305,307 | 1.07E+08 | 961,113 | 1,673,574 | 6,493,726 | 970,866 | 996,446.5 | 30,689,238 | 11,403,593 | 1.41E+08 | 1.03E+08 | |
| rank | 1 | 10 | 6 | 12 | 2 | 5 | 7 | 3 | 4 | 9 | 8 | 13 | 11 | |
| C11-F21 | mean | 12.71443 | 46.34686 | 21.01723 | 69.56401 | 15.96249 | 28.26275 | 36.20316 | 26.2373 | 21.66735 | 91.01918 | 37.89568 | 95.47795 | 92.70667 |
| best | 9.974206 | 38.73143 | 19.57825 | 52.49434 | 13.78985 | 25.13662 | 33.54273 | 23.43905 | 19.92905 | 44.78771 | 33.83682 | 82.90208 | 54.02514 | |
| worst | 14.97499 | 54.54122 | 22.89874 | 86.63233 | 18.25234 | 29.53126 | 39.5914 | 29.18722 | 24.00863 | 133.0501 | 40.61476 | 105.7638 | 112.5417 | |
| std | 2.506594 | 7.425814 | 1.558182 | 16.45118 | 2.263924 | 2.29002 | 2.912469 | 3.413229 | 2.014941 | 39.49753 | 3.257039 | 12.46174 | 29.75296 | |
| median | 12.95425 | 46.0574 | 20.79597 | 69.5647 | 15.90388 | 29.19156 | 35.83926 | 26.16147 | 21.36585 | 93.11946 | 38.56558 | 96.62294 | 102.1299 | |
| rank | 1 | 9 | 3 | 10 | 2 | 6 | 7 | 5 | 4 | 11 | 8 | 13 | 12 | |
| C11-F22 | mean | 5.920103 | 16.74641 | 12.47935 | 20.60699 | 7.613273 | 17.40635 | 12.74259 | 13.42229 | 10.58714 | 17.43517 | 20.35526 | 16.99013 | 21.88339 |
| best | 2E−10 | 13.86501 | 8.478707 | 18.18457 | 0.380987 | 16.50584 | 7.451926 | 11.38898 | 1.050147 | 16.64263 | 17.71226 | 10.14258 | 20.69375 | |
| worst | 12.30606 | 19.6453 | 16.37007 | 23.21547 | 12.69538 | 19.05236 | 16.77422 | 15.48484 | 16.38551 | 18.69533 | 22.1194 | 23.16349 | 24.33594 | |
| std | 7.476538 | 3.058894 | 4.906722 | 2.611096 | 6.161367 | 1.264455 | 4.734219 | 2.406333 | 7.278318 | 1.063321 | 2.051999 | 6.277694 | 1.854985 | |
| median | 5.687176 | 16.73766 | 12.53432 | 20.51396 | 8.688362 | 17.03359 | 13.37211 | 13.40768 | 12.45645 | 17.20137 | 20.79468 | 17.32722 | 21.25194 | |
| rank | 1 | 7 | 4 | 12 | 2 | 9 | 5 | 6 | 3 | 10 | 11 | 8 | 13 | |
| Sum rank | 22 | 191 | 109 | 231 | 55 | 146 | 145 | 118 | 97 | 222 | 157 | 198 | 224 | |
| Mean rank | 1 | 8.681818 | 4.954545 | 10.5 | 2.5 | 6.636364 | 6.590909 | 5.363636 | 4.409091 | 10.09091 | 7.136364 | 9 | 10.18182 | |
| Total rank | 1 | 2 | 12 | 4 | 13 | 3 | 11 | 9 | 6 | 7 | 10 | 5 | 8 | |
| Wilcoxon: p-value | 1.58E−15 | 9.00E−15 | 1.58E−15 | 6.54E−15 | 3.37E−15 | 1.58E−15 | 3.68E−12 | 6.54E−15 | 4.94E−15 | 7.85E−15 | 2.34E−15 | 4.94E−15 | ||
| Algorithm | Optimum Variables | Optimum Cost | |||
|---|---|---|---|---|---|
| Ts | Th | R | L | ||
| GAO | 0.7780271 | 0.3845792 | 40.312284 | 200 | 5882.8955 |
| WSO | 0.7780269 | 0.3845797 | 40.312282 | 200 | 5882.9013 |
| AVOA | 0.7780308 | 0.384581 | 40.312476 | 199.99732 | 5882.9077 |
| RSA | 1.1950157 | 0.64038 | 60.549321 | 48.031984 | 7759.8234 |
| MPA | 0.7780271 | 0.3845792 | 40.312284 | 200 | 5882.9013 |
| TSA | 0.7794994 | 0.385819 | 40.386517 | 200 | 5909.3749 |
| WOA | 0.911517 | 0.4510723 | 46.230782 | 133.83941 | 6270.8621 |
| MVO | 0.8344267 | 0.4164052 | 43.217775 | 163.90679 | 6003.8497 |
| GWO | 0.7784599 | 0.3858127 | 40.320627 | 199.96442 | 5890.2105 |
| TLBO | 1.5622593 | 0.4813024 | 47.695987 | 124.64823 | 10,807.366 |
| GSA | 1.1300127 | 1.1576349 | 44.110061 | 190.7876 | 11,984.417 |
| PSO | 1.55006 | 0.6231249 | 63.139483 | 49.78495 | 9998.6395 |
| GA | 1.406417 | 0.7832762 | 58.253368 | 73.964478 | 10,920.286 |
| Algorithm | Mean | Best | Worst | Std | Median | Rank |
|---|---|---|---|---|---|---|
| GAO | 5882.8955 | 5882.8955 | 5882.8955 | 1.87E−12 | 5882.8955 | 1 |
| WSO | 5891.226 | 5882.9013 | 5965.0365 | 22.218932 | 5882.9017 | 3 |
| AVOA | 6219.5386 | 5882.9077 | 7046.3206 | 352.35848 | 6047.6955 | 5 |
| RSA | 12,409.586 | 7759.8234 | 19,991.769 | 3127.065 | 11,403.338 | 9 |
| MPA | 5882.9013 | 5882.9013 | 5882.9013 | 3.68E−06 | 5882.9013 | 2 |
| TSA | 6271.132 | 5909.3749 | 6948.3792 | 333.1584 | 6143.6153 | 6 |
| WOA | 7998.6372 | 6270.8621 | 12,805.388 | 1681.8974 | 7579.6333 | 8 |
| MVO | 6518.1019 | 6003.8497 | 7050.4059 | 320.31898 | 6572.19 | 7 |
| GWO | 6012.3675 | 5890.2105 | 6670.9945 | 239.38549 | 5898.5494 | 4 |
| TLBO | 28,273.334 | 10,807.366 | 60,311.64 | 13,795.65 | 24,975.491 | 12 |
| GSA | 20,643.589 | 11,984.417 | 32,105.445 | 6711.6675 | 19,830.394 | 10 |
| PSO | 29,687.575 | 9998.6395 | 50,712.307 | 12,915.318 | 32,709.339 | 13 |
| GA | 25,427.766 | 10,920.286 | 45,530.922 | 10,828.815 | 22,551.255 | 11 |
| Algorithm | Optimum Variables | Optimum Cost | ||||||
|---|---|---|---|---|---|---|---|---|
| b | M | p | l1 | l2 | d1 | d2 | ||
| GAO | 3.5 | 0.7 | 17 | 7.3 | 7.8 | 3.3502147 | 5.2866832 | 2996.3482 |
| WSO | 3.5000004 | 0.7 | 17 | 7.3000087 | 7.8000004 | 3.3502148 | 5.2866833 | 2996.3483 |
| AVOA | 3.5 | 0.7 | 17 | 7.3000007 | 7.8 | 3.3502147 | 5.2866832 | 2996.3482 |
| RSA | 3.5812009 | 0.7 | 17 | 8.1120092 | 8.2060046 | 3.3550151 | 5.4598984 | 3160.6387 |
| MPA | 3.5 | 0.7 | 17 | 7.3 | 7.8 | 3.3502147 | 5.2866832 | 2996.3482 |
| TSA | 3.5113634 | 0.7 | 17 | 7.3 | 8.2060046 | 3.3505018 | 5.2897957 | 3011.7899 |
| WOA | 3.5770618 | 0.7 | 17 | 7.3 | 7.9844181 | 3.3602552 | 5.2867471 | 3033.2634 |
| MVO | 3.5019838 | 0.7 | 17 | 7.3 | 8.0370241 | 3.3672881 | 5.2868582 | 3006.8197 |
| GWO | 3.5005649 | 0.7 | 17 | 7.3045311 | 7.8 | 3.3623131 | 5.2885569 | 3000.8991 |
| TLBO | 3.549421 | 0.7035216 | 25.214085 | 8.0060043 | 8.1041201 | 3.6261576 | 5.3330891 | 4999.6584 |
| GSA | 3.5201835 | 0.7024256 | 17.325213 | 7.7585847 | 7.8789461 | 3.4018063 | 5.374124 | 3149.0914 |
| PSO | 3.5072099 | 0.7000634 | 17.965269 | 7.3872523 | 7.8599345 | 3.566267 | 5.3372001 | 3266.1003 |
| GA | 3.5687302 | 0.7049031 | 17.716975 | 7.6899131 | 7.8491985 | 3.65975 | 5.3392351 | 3305.1452 |
| Algorithm | Mean | Best | Worst | Std | Median | Rank |
|---|---|---|---|---|---|---|
| GAO | 2996.3482 | 2996.3482 | 2996.3482 | 9.33E−13 | 2996.3482 | 1 |
| WSO | 2996.5979 | 2996.3483 | 2998.5076 | 0.515253 | 2996.3624 | 3 |
| AVOA | 3000.3195 | 2996.3482 | 3009.3227 | 3.495813 | 3000.2318 | 4 |
| RSA | 3243.4118 | 3160.6387 | 3294.782 | 50.671452 | 3256.5192 | 9 |
| MPA | 2996.3482 | 2996.3482 | 2996.3482 | 2.81E−06 | 2996.3482 | 2 |
| TSA | 3027.8743 | 3011.7899 | 3039.9713 | 8.9331108 | 3029.4495 | 7 |
| WOA | 3131.7628 | 3033.2634 | 3391.7111 | 93.64881 | 3102.3919 | 8 |
| MVO | 3025.8394 | 3006.8197 | 3061.3925 | 11.679823 | 3026.2269 | 6 |
| GWO | 3003.637 | 3000.8991 | 3008.8921 | 2.2089208 | 3003.1807 | 5 |
| TLBO | 6.128E+13 | 4999.6584 | 4.435E+14 | 1.02E+14 | 2.4E+13 | 12 |
| GSA | 3400.1113 | 3149.0914 | 3947.2386 | 231.00301 | 3285.8903 | 10 |
| PSO | 9.044E+13 | 3266.1003 | 4.581E+14 | 1.092E+14 | 6.468E+13 | 13 |
| GA | 4.354E+13 | 3305.145 | 2.81E+14 | 6.859E+13 | 1.745E+13 | 11 |
| Algorithm | Optimum Variables | Optimum Cost | |||
|---|---|---|---|---|---|
| h | l | t | b | ||
| GAO | 0.2057296 | 3.4704887 | 9.0366239 | 0.2057296 | 1.7246798 |
| WSO | 0.2057296 | 3.4704888 | 9.0366238 | 0.2057296 | 1.7248523 |
| AVOA | 0.205056 | 3.4850976 | 9.0365299 | 0.2057339 | 1.7257923 |
| RSA | 0.1977725 | 3.5270192 | 9.8188942 | 0.2163579 | 1.9455461 |
| MPA | 0.2057296 | 3.4704887 | 9.0366239 | 0.2057296 | 1.7248523 |
| TSA | 0.2043787 | 3.4924081 | 9.0609 | 0.2061055 | 1.7327713 |
| WOA | 0.2127738 | 3.3465331 | 8.9813136 | 0.2191754 | 1.8098061 |
| MVO | 0.2059617 | 3.465488 | 9.0437236 | 0.2060167 | 1.7279454 |
| GWO | 0.2056085 | 3.4732685 | 9.0362859 | 0.2057905 | 1.7254435 |
| TLBO | 0.3021777 | 4.3080233 | 7.0649912 | 0.3989007 | 2.86852 |
| GSA | 0.2833168 | 2.8111202 | 7.6140935 | 0.2957385 | 2.0415263 |
| PSO | 0.3526171 | 3.4301508 | 7.5466754 | 0.5299732 | 3.7483578 |
| GA | 0.2220901 | 6.5032092 | 7.9154768 | 0.2925869 | 2.6371953 |
| Algorithm | Mean | Best | Worst | Std | Median | Rank |
|---|---|---|---|---|---|---|
| GAO | 1.7246798 | 1.7246798 | 1.7246798 | 2.28E−16 | 1.7246798 | 1 |
| WSO | 1.7248526 | 1.7248523 | 1.7248572 | 1.101E−06 | 1.7248523 | 3 |
| AVOA | 1.7568691 | 1.7257923 | 1.8286017 | 0.0321107 | 1.7446373 | 7 |
| RSA | 2.127039 | 1.9455461 | 2.4331287 | 0.1269176 | 2.1049933 | 8 |
| MPA | 1.7248523 | 1.7248523 | 1.7248523 | 2.95E−09 | 1.7248523 | 2 |
| TSA | 1.7409627 | 1.7327713 | 1.7490567 | 0.0049359 | 1.7410475 | 6 |
| WOA | 2.2407055 | 1.8098061 | 3.7687515 | 0.5650313 | 2.0426429 | 9 |
| MVO | 1.7392665 | 1.7279454 | 1.7690502 | 0.0121131 | 1.7356826 | 5 |
| GWO | 1.7269657 | 1.7254435 | 1.7305264 | 0.0011999 | 1.7267498 | 4 |
| TLBO | 2.929E+13 | 2.86852 | 2.826E+14 | 7.143E+13 | 5.2174609 | 12 |
| GSA | 2.3577996 | 2.0415263 | 2.6295 | 0.1686298 | 2.3838126 | 10 |
| PSO | 4.039E+13 | 3.7483578 | 2.445E+14 | 7.713E+13 | 6.1318573 | 13 |
| GA | 9.913E+12 | 2.6371953 | 1.073E+14 | 3.043E+13 | 5.1880494 | 11 |
| Algorithm | Optimum Variables | Optimum Cost | ||
|---|---|---|---|---|
| d | D | p | ||
| GAO | 0.0516891 | 0.3567177 | 11.288966 | 0.0126019 |
| WSO | 0.0516873 | 0.3566758 | 11.291426 | 0.0126652 |
| AVOA | 0.0512511 | 0.3462947 | 11.933872 | 0.0126696 |
| RSA | 0.0503175 | 0.3192513 | 14.30236 | 0.0130991 |
| MPA | 0.0516905 | 0.3567534 | 11.286873 | 0.0126652 |
| TSA | 0.0510725 | 0.3420852 | 12.221253 | 0.01268 |
| WOA | 0.0512287 | 0.3457669 | 11.968427 | 0.01267 |
| MVO | 0.0503175 | 0.3243542 | 13.574804 | 0.0127396 |
| GWO | 0.0519242 | 0.3623905 | 10.968951 | 0.01267 |
| TLBO | 0.0658133 | 0.8277549 | 3.7462401 | 0.0169026 |
| GSA | 0.0547015 | 0.4310298 | 8.235468 | 0.0130247 |
| PSO | 0.0657408 | 0.8250149 | 3.7462402 | 0.0168129 |
| GA | 0.0662247 | 0.83462 | 3.7462402 | 0.0172493 |
| Algorithm | Mean | Best | Worst | Std | Median | Rank |
|---|---|---|---|---|---|---|
| GAO | 0.0126019 | 0.0126019 | 0.0126019 | 6.88E−18 | 0.0126019 | 1 |
| WSO | 0.0126749 | 0.0126652 | 0.012805 | 3.115E−05 | 0.0126656 | 3 |
| AVOA | 0.013254 | 0.0126696 | 0.0139577 | 0.0004844 | 0.0131947 | 8 |
| RSA | 0.0131701 | 0.0130991 | 0.0132952 | 6.028E−05 | 0.0131518 | 6 |
| MPA | 0.0126652 | 0.0126652 | 0.0126652 | 2.47E−09 | 0.0126652 | 2 |
| TSA | 0.0129235 | 0.01268 | 0.0134133 | 0.0002099 | 0.0128595 | 5 |
| WOA | 0.0131928 | 0.01267 | 0.0142585 | 0.000525 | 0.0130205 | 7 |
| MVO | 0.0159749 | 0.0127396 | 0.0172239 | 0.0014311 | 0.0167707 | 9 |
| GWO | 0.0127154 | 0.01267 | 0.0129094 | 4.805E−05 | 0.0127132 | 4 |
| TLBO | 0.0173644 | 0.0169026 | 0.0178919 | 0.000311 | 0.017326 | 10 |
| GSA | 0.0185374 | 0.0130247 | 0.0295218 | 0.0037009 | 0.0181672 | 11 |
| PSO | 1.818E+13 | 0.0168129 | 3.225E+14 | 7.217E+13 | 0.0168129 | 13 |
| GA | 1.42E+12 | 0.0172493 | 1.469E+13 | 4.24E+12 | 0.0238647 | 12 |
Disclaimer/Publisher’s Note: The statements, opinions and data contained in all publications are solely those of the individual author(s) and contributor(s) and not of MDPI and/or the editor(s). MDPI and/or the editor(s) disclaim responsibility for any injury to people or property resulting from any ideas, methods, instructions or products referred to in the content. |
© 2023 by the authors. Licensee MDPI, Basel, Switzerland. This article is an open access article distributed under the terms and conditions of the Creative Commons Attribution (CC BY) license (https://creativecommons.org/licenses/by/4.0/).
Share and Cite
Alsayyed, O.; Hamadneh, T.; Al-Tarawneh, H.; Alqudah, M.; Gochhait, S.; Leonova, I.; Malik, O.P.; Dehghani, M. Giant Armadillo Optimization: A New Bio-Inspired Metaheuristic Algorithm for Solving Optimization Problems. Biomimetics 2023, 8, 619. https://doi.org/10.3390/biomimetics8080619
Alsayyed O, Hamadneh T, Al-Tarawneh H, Alqudah M, Gochhait S, Leonova I, Malik OP, Dehghani M. Giant Armadillo Optimization: A New Bio-Inspired Metaheuristic Algorithm for Solving Optimization Problems. Biomimetics. 2023; 8(8):619. https://doi.org/10.3390/biomimetics8080619
Chicago/Turabian StyleAlsayyed, Omar, Tareq Hamadneh, Hassan Al-Tarawneh, Mohammad Alqudah, Saikat Gochhait, Irina Leonova, Om Parkash Malik, and Mohammad Dehghani. 2023. "Giant Armadillo Optimization: A New Bio-Inspired Metaheuristic Algorithm for Solving Optimization Problems" Biomimetics 8, no. 8: 619. https://doi.org/10.3390/biomimetics8080619