


Enhanced Pelican Optimization Algorithm with Deep Learning-Driven Mitotic Nuclei Classification on Breast Histopathology Images
 , , ,
, , ,
Abstract
:1. Introduction
- An automated EPOADL-MNC technique comprising a ShuffleNet feature extractor, EPOA-based hyperparameter tuning, and ANFIS classification model for mitotic nuclei classification has been developed. To the best of our knowledge, the EPOADL-MNC technique has never existed in the literature.
- This paper leverages the ShuffleNet model for feature extraction, which enables the algorithm to learn intricate hierarchical features from histopathology images, improving its ability to detect subtle patterns related to mitotic nuclei.
- The EPOADL-MNC employs the EPOA for fine-tuning the hyperparameters of the ShuffleNet model. This optimization procedure enhances the model’s performance and adaptability. Hyperparameter optimization using the EPOA algorithm and using cross-validation helps to boost the predictive outcome of the EPOADL-MNC model for unseen data.
- This paper utilizes the ANFIS model for the final classification and detection of mitotic cell nuclei in histopathology images. ANFIS combines fuzzy logic and neural networks for accurate classification.
2. Related Works
3. The Proposed Model
3.1. Stage I: ShuffleNet Model
3.2. Stage II: EPOA-Based Hyperparameter Optimizer
3.3. Stage III: ANFIS Classifier
4. Results and Discussion
5. Conclusions
Author Contributions
Funding
Institutional Review Board Statement
Data Availability Statement
Conflicts of Interest
References
- Syam, S.; Pushpalatha, K.P. Machine Learning Based Classification and Grading of Breast Cancer. In Proceedings of the 2023 International Conference on Innovations in Engineering and Technology (ICIET), Kerala, India, 13 July 2023; pp. 1–5. [Google Scholar]
- Zainudin, Z.; Shamsuddin, S.M.; Hasan, S. Deep layer convolutional neural network (CNN) Architecture for breast cancer classification using histopathological images. In Machine Learning and Big Data Analytics Paradigms: Analysis, Applications and Challenges; Springer: Cham, Switzerland, 2021; pp. 347–364. [Google Scholar]
- Razavi, S.; Khameneh, F.D.; Nouri, H.; Androutsos, D.; Done, S.J.; Khademi, A. Minugan: Dual segmentation of mitoses and nuclei using conditional gans on multi-centre breast h&e images. J. Pathol. Inform. 2022, 13, 100002. [Google Scholar] [PubMed]
- Mandair, D.; Reis-Filho, J.S.; Ashworth, A. Biological insights and novel biomarker discovery through deep learning approaches in breast cancer histopathology. NPJ Breast Cancer 2023, 9, 21. [Google Scholar] [CrossRef] [PubMed]
- Mehak, S.; Ashraf, M.U.; Zafar, R.; Alghamdi, A.M.; Alfakeeh, A.S.; Alassery, F.; Hamam, H.; Shafiq, M. Automated Grading of Breast Cancer Histopathology Images Using Multilayered Autoencoder. Comput. Mater. Contin. 2022, 71, 3407–3423. [Google Scholar] [CrossRef]
- Das, A.; Mohanty, M.N.; Mallick, P.K.; Tiwari, P.; Muhammad, K.; Zhu, H. Breast cancer detection using an ensemble deep learning method. Biomed. Signal Process. Control 2021, 70, 103009. [Google Scholar] [CrossRef]
- Rauf, Z.; Sohail, A.; Khan, S.H.; Khan, A.; Gwak, J.; Maqbool, M. Attention-guided multi-scale deep object detection framework for lymphocyte analysis in IHC histological images. Microscopy 2023, 72, 27–42. [Google Scholar] [CrossRef]
- Khikani, H.A.; Elazab, N.; Elgarayhi, A.; Elmogy, M.; Sallah, M. Breast cancer classification based on histopathological images using a deep learning capsule network. arXiv 2022, arXiv:2208.00594. [Google Scholar]
- Rashmi, R.; Prasad, K.; Udupa, C.B.K. Region-based feature enhancement using channel-wise attention for classification of breast histopathological images. Neural Comput. Appl. 2023, 35, 5839–5854. [Google Scholar] [CrossRef]
- Labrada, A.; Barkana, B.D. Breast cancer diagnosis from histopathology images using supervised algorithms. In Proceedings of the 2022 IEEE 35th International Symposium on Computer-Based Medical Systems (CBMS), Shenzhen, China, 21–22 July 2022; pp. 102–107. [Google Scholar]
- Bhausaheb, D.P.; Kashyap, K.L. Shuffled Shepherd Deer Hunting Optimization based Deep Neural Network for Breast Cancer Classification using Breast Histopathology Images. Biomed. Signal Process. Control 2023, 83, 104570. [Google Scholar] [CrossRef]
- Sohail, A.; Khan, A.; Nisar, H.; Tabassum, S.; Zameer, A. Mitotic nuclei analysis in breast cancer histopathology images using deep ensemble classifier. Med. Image Anal. 2021, 72, 102121. [Google Scholar] [CrossRef]
- Saturi, R.; Chand Parvataneni, P. Histopathology breast cancer detection and classification using optimized superpixel clustering algorithm and support vector machine. J. Inst. Eng. Ser. B 2022, 103, 1589–1603. [Google Scholar] [CrossRef]
- Sampath, N.; Srinath, N.K. Breast cancer detection from histopathological image dataset using hybrid convolution neural network. Int. J. Model. Simul. Sci. Comput. 2023, 2441003. [Google Scholar] [CrossRef]
- Wang, P.; Wang, J.; Li, Y.; Li, P.; Li, L.; Jiang, M. Automatic classification of breast cancer histopathological images based on deep feature fusion and enhanced routing. Biomed. Signal Process. Control 2021, 65, 102341. [Google Scholar] [CrossRef]
- Joseph, A.A.; Abdullahi, M.; Junaidu, S.B.; Ibrahim, H.H.; Chiroma, H. Improved multi-classification of breast cancer histopathological images using handcrafted features and deep neural network (dense layer). Intell. Syst. Appl. 2022, 14, 200066. [Google Scholar] [CrossRef]
- Kausar, T.; Ashraf, M.A.; Kausar, A.; Riaz, I. Convolution neural network-based approach for breast cancer type classification. In Proceedings of the 2021 International Bhurban Conference on Applied Sciences and Technologies (IBCAST), Islamabad, Pakistan, 12–16 January 2021; pp. 407–413. [Google Scholar]
- Botlagunta, M.; Botlagunta, M.D.; Myneni, M.B.; Lakshmi, D.; Nayyar, A.; Gullapalli, J.S.; Shah, M.A. Classification and diagnostic prediction of breast cancer metastasis on clinical data using machine learning algorithms. Sci. Rep. 2023, 13, 485. [Google Scholar] [CrossRef] [PubMed]
- Huang, X.; Chen, J.; Chen, M.; Wan, Y.; Chen, L. FRE-Net: Full-region enhanced network for nuclei segmentation in histopathology images. Biocybern. Biomed. Eng. 2023, 43, 386–401. [Google Scholar] [CrossRef]
- Wang, X.; Zhang, J.; Yang, S.; Xiang, J.; Luo, F.; Wang, M.; Zhang, J.; Yang, W.; Huang, J.; Han, X. A generalizable and robust deep learning algorithm for mitosis detection in multicenter breast histopathological images. Med. Image Anal. 2023, 84, 102703. [Google Scholar] [CrossRef]
- Khan, H.U.; Raza, B.; Shah, M.H.; Usama, S.M.; Tiwari, P.; Band, S.S. SMDetector: Small mitotic detector in histopathology images using faster R-CNN with dilated convolutions in the backbone model. Biomed. Signal Process. Control 2023, 81, 104414. [Google Scholar] [CrossRef]
- Ullah, N.; Khan, J.A.; El-Sappagh, S.; El-Rashidy, N.; Khan, M.S. A holistic approach to identify and classify COVID-19 from chest radiographs, ECG, and CT-scan images using shufflenet convolutional neural network. Diagnostics 2023, 13, 162. [Google Scholar] [CrossRef]
- Wang, Z.; Duan, J.; Xu, H.; Song, X.; Yang, Y. Enhanced Pelican Optimization Algorithm for Cluster Head Selection in Heterogeneous Wireless Sensor Networks. Sensors 2023, 23, 7711. [Google Scholar] [CrossRef]
- Baştemur Kaya, C. A Novel Hybrid Method Based on the Marine Predators Algorithm and Adaptive Neuro-Fuzzy Inference System for the Identification of Nonlinear Systems. Symmetry 2023, 15, 1765. [Google Scholar] [CrossRef]
- Veta, M.; Pluim, J.P.W.; Stathonikos, N.; van Diest, P.J.; Beca, F.; Beck, A. Tumor Proliferation Assessment Challenge 2016, MICCAI Grand Challenge. 2016. Available online: http://tupac.tue-image.nl/ (accessed on 13 July 2023).
- Malibari, A.A.; Obayya, M.; Gaddah, A.; Mehanna, A.S.; Hamza, M.A.; Ibrahim Alsaid, M.; Yaseen, I.; Abdelmageed, A.A. Artificial Hummingbird Algorithm with Transfer-Learning-Based Mitotic Nuclei Classification on Histopathologic Breast Cancer Images. Bioengineering 2023, 10, 87. [Google Scholar] [CrossRef] [PubMed]


| Class | No. of Images |
|---|---|
| Mitosis | 75 |
| Non-mitosis | 75 |
| Total No. of Images | 150 |
| Class | MCC | |||||
|---|---|---|---|---|---|---|
| TR Phase (80%) | ||||||
| Mitosis | 95.00 | 100.00 | 95.00 | 97.44 | 95.12 | 97.47 |
| Non-mitosis | 100.00 | 95.24 | 100.00 | 97.56 | 95.12 | 97.59 |
| Average | 97.50 | 97.62 | 97.50 | 97.50 | 95.12 | 97.53 |
| TS Phase (20%) | ||||||
| Mitosis | 93.33 | 100.00 | 93.33 | 96.55 | 93.54 | 96.61 |
| Non-mitosis | 100.00 | 93.75 | 100.00 | 96.77 | 93.54 | 96.82 |
| Average | 96.67 | 96.88 | 96.67 | 96.66 | 93.54 | 96.72 |
| Class | MCC | |||||
|---|---|---|---|---|---|---|
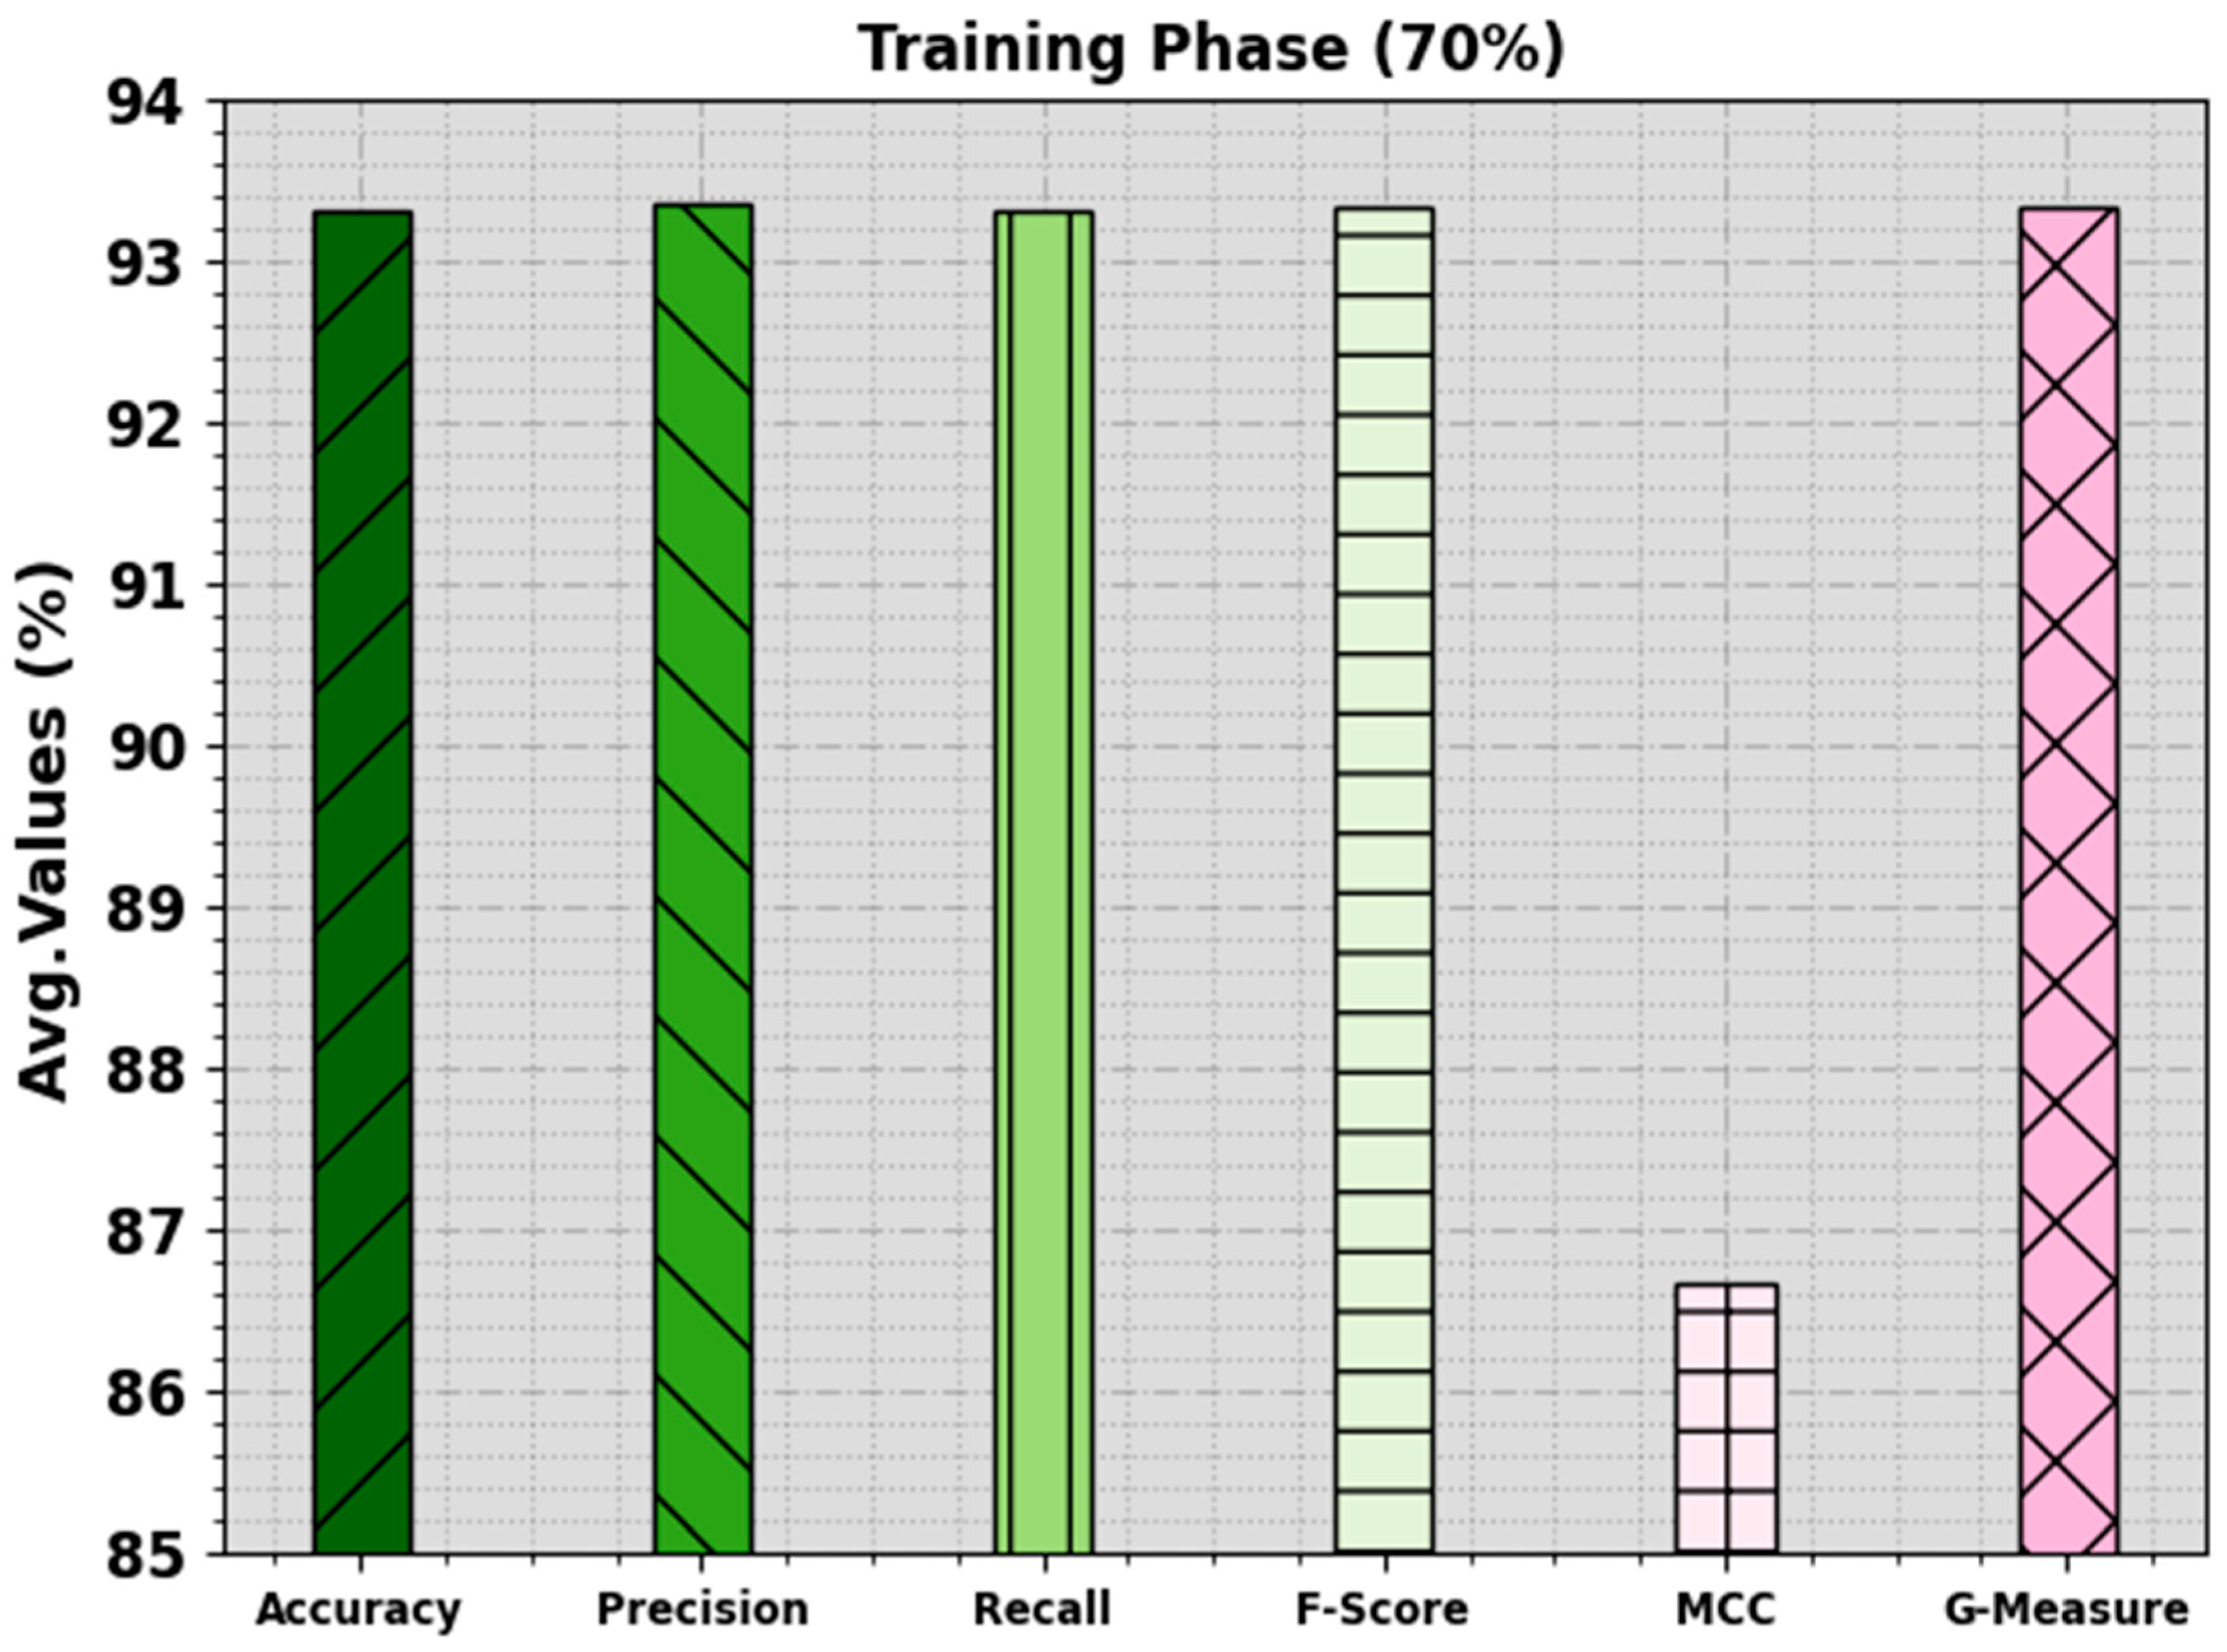
| TR Phase (70%) | ||||||
| Mitosis | 94.34 | 92.59 | 94.34 | 93.46 | 86.68 | 93.46 |
| Non-mitosis | 92.31 | 94.12 | 92.31 | 93.20 | 86.68 | 93.21 |
| Average | 93.32 | 93.36 | 93.32 | 93.33 | 86.68 | 93.34 |
| TS Phase (30%) | ||||||
| Mitosis | 100.00 | 95.65 | 100.00 | 97.78 | 95.65 | 97.80 |
| Non-mitosis | 95.65 | 100.00 | 95.65 | 97.78 | 95.65 | 97.80 |
| Average | 97.83 | 97.83 | 97.83 | 97.78 | 95.65 | 97.80 |
| Methods | ||||
|---|---|---|---|---|
| EPOADL-MNC | 97.83 | 97.83 | 97.83 | 97.78 |
| AHBATL-MNC | 96.77 | 96.77 | 96.77 | 96.67 |
| DHE-Mit | 85.23 | 84.45 | 75.26 | 77.33 |
| DenseNet201 | 83.96 | 83.20 | 73.85 | 76.38 |
| Inception-V3 | 78.54 | 77.51 | 68.18 | 70.64 |
| ResNext50 | 77.48 | 76.20 | 66.73 | 69.49 |
| VGG-16 | 74.72 | 73.93 | 65.00 | 67.66 |
Disclaimer/Publisher’s Note: The statements, opinions and data contained in all publications are solely those of the individual author(s) and contributor(s) and not of MDPI and/or the editor(s). MDPI and/or the editor(s) disclaim responsibility for any injury to people or property resulting from any ideas, methods, instructions or products referred to in the content. |
© 2023 by the authors. Licensee MDPI, Basel, Switzerland. This article is an open access article distributed under the terms and conditions of the Creative Commons Attribution (CC BY) license (https://creativecommons.org/licenses/by/4.0/).
Share and Cite
Alrowais, F.; Alotaibi, F.A.; Hassan, A.Q.A.; Marzouk, R.; Alnfiai, M.M.; Sayed, A. Enhanced Pelican Optimization Algorithm with Deep Learning-Driven Mitotic Nuclei Classification on Breast Histopathology Images. Biomimetics 2023, 8, 538. https://doi.org/10.3390/biomimetics8070538
Alrowais F, Alotaibi FA, Hassan AQA, Marzouk R, Alnfiai MM, Sayed A. Enhanced Pelican Optimization Algorithm with Deep Learning-Driven Mitotic Nuclei Classification on Breast Histopathology Images. Biomimetics. 2023; 8(7):538. https://doi.org/10.3390/biomimetics8070538
Chicago/Turabian StyleAlrowais, Fadwa, Faiz Abdullah Alotaibi, Abdulkhaleq Q. A. Hassan, Radwa Marzouk, Mrim M. Alnfiai, and Ahmed Sayed. 2023. "Enhanced Pelican Optimization Algorithm with Deep Learning-Driven Mitotic Nuclei Classification on Breast Histopathology Images" Biomimetics 8, no. 7: 538. https://doi.org/10.3390/biomimetics8070538