The Nepalese Diaspora and Adaptation in the United States

1
Faculty of Liberal Arts & Sciences, Humber College Institute of Technology & Advanced Learning, Toronto, ON M9W 5L7, Canada
2
Department of Social Sciences and Historical Studies, Texas Woman’s University, Denton, TX 76204, USA
*
Author to whom correspondence should be addressed.
Genealogy 2024, 8(2), 42; https://doi.org/10.3390/genealogy8020042
Submission received: 27 January 2024
/
Revised: 5 April 2024
/
Accepted: 9 April 2024
/
Published: 15 April 2024
(This article belongs to the Section Genealogical Communities: Multi-Ethnic, Multi-Racial, and Multi-National Genealogies)
Abstract
:The Nepalese in the United States of America (USA) are an emerging diasporic community. In spite of the phenomenal growth of the Nepalese diaspora in the USA in the last more than two decades, little is known about this new diasporic community, especially regarding how the Nepalese adapt to American life. This study documents the rapid growth in Nepalese immigration to the USA in the twenty-first century, based on data from the U.S. Department of Homeland Security. Using the data from an online survey, it analyzes the experiences of the Nepalese in cultural adaptation, structural adaptation, marital adaptation, identificational adaptation, and receptional adaptation. The results show that although the Nepalese have become partly assimilated to American culture, they still to a large extent retain their ethnic culture, ethnic association, ethnic identity, and ethnic marital partners, and they have had mixed experiences of prejudice and discrimination. The findings have significant scholarly and practical implications.
1. Introduction
The Nepalese are an emerging diasporic community in the United States of America (USA). The Nepalese in America are largely foreign-born (Dhungel 1999), and many of them immigrated to the USA in the last about two decades. Since 2000, more than 167,000 Nepalese have immigrated to the USA (U.S. Department of Homeland Security 1996–2022). However, the rapid growth of the Nepalese diaspora in the USA has not been well documented in the literature. Furthermore, despite the phenomenal growth of the Nepalese diaspora in the USA in the last couple of decades, little is known about this new diasporic community, especially in terms of how the foreign-born Nepalese adapt to American life.
Immigrant adaptation to the host society has been a long-standing subject of scholarly research. The best-known model of immigrant adaptation is classic assimilation theory, which can be traced back to the Chicago School of Sociology in the 1930s. The classic assimilation theory posits that all immigrant groups will go through four stages of “race relations cycle” (i.e., contact, competition, accommodation, and assimilation) (Park 1937). Assimilation means immigrants will relinquish their ethnic culture and institutions and become totally assimilated into the dominant culture and institutions. In his classic book Assimilation in American Life published in 1964, Milton Gordon (1964) further formulated seven stages of assimilation: cultural assimilation (or acculturation), structural assimilation, marital assimilation (or amalgamation), identificational assimilation, attitude receptional assimilation, behavioral receptional assimilation, and civic assimilation. In this book, Gordon (1964) also portrayed two other models of immigrant adaptation: melting pot and cultural pluralism. The basic idea of melting pot theory is that the outcome of immigrant adaptation is the biological and cultural blending of immigrant group and culture with the dominant group and culture and the creation of a new group called “American” and a new culture called “American culture” (Yang 2000). The cultural pluralism perspective contends that as a result of adaptation, immigrants become partly assimilated to the dominant culture while partly retaining their ethnic culture, leading to the co-existence of immigrant cultures and the dominant culture. Since the 1960s, the classic assimilation theory has lost its potency due to a lack of evidence of total assimilation and its implied assumption of cultural superiority (Yang 2000). Melting pot has been deemed ideal but unrealistic in the American context (Yang 2000). Challenging the classic assimilation theory, the new assimilation theory proposed by Alba and Nee (1997, 2003) argues that assimilation is a two-way street with both the immigrant culture and the host culture affecting each other and that assimilation is neither universal nor straight-line but will eventually happen. Another theory that challenges the classic assimilation theory is segmented assimilation theory proposed by Portes and Zhou (1993). Focusing on the adaptation of second generation, this theory maintains that depending on the segment of the host society assimilated into, the outcomes of assimilation are diverse, including upward mobility to middle-class America, downward mobility to underclass America, and economic mobility coupled with deliberated delayed acculturation. Which of these existing theoretical models best captures the adaptation experience of Nepalese immigrants in the USA? To what extent is the experience of Nepalese immigrants in the USA common or unique? This study of the adaptation of Nepalese migrants in America provides an opportunity to join the discourse and to assess the utility and limitations of these existing immigrant adaptation theories. We use the term “adaptation” to refer to an adjustment of the foreign-born to the life of their host society. We use the term “adaptation” instead of “assimilation” because, unlike the latter, the term does not imply a one-way absorption into the dominant culture or the cultural superiority of the host society. Adaptation includes many dimensions. This study focuses on the cultural, structural, marital, identificational, and receptional adaptation of the Nepalese in America. Cultural adaptation refers to change in cultural patterns, such as language, religion, custom, and so forth in the host society. Structural adaptation is defined as interaction with and adjustment to the social groups and institutions of the host society. Marital adaptation means the extent of intermarriage with other groups. Identificational adaptation refers to a change in identity attributed to the host society. Receptional adaptation is defined as the way migrants are received or accepted by the host society, which includes attitudinal acceptance or prejudice and behavioral acceptance or discrimination.
A review of the literature on the adaptation of Nepalese migrants to American life reveals a lack of scholarly research on Nepalese immigrant adaptation in the USA. Specifically, there is a scarcity of survey research on their cultural adaptation, structural adaptation, marital adaptation, identificational adaptation, and receptional adaptation. What little we know about the Nepalese community in the USA comes from dated qualitative studies, and there is not much quantitative information based on a large sample. There are a few qualitative studies of cultural preservation among Nepalese immigrants including Nepali dances, songs, comedic skits, and the celebration of Dashin and Tihar—the main Nepalese religious festivals—and Nepalese New Year (Koirala 2004; Tamot 2008). While useful, these studies are based on observations or a small number of cases.
Some have observed that regardless of English language proficiency, Nepalese immigrants do not structurally adapt to American society (Tamot 2008). The Nepalese in the USA prefer to spend time and share moments with other Nepalese; therefore, they fail to structurally assimilate in America (Tamot 2008). The Nepalese prefer social gatherings among themselves in most cases. Similarly, the Nepalese have limited contact with Americans as they mostly restrict their contacts to other Nepalese immigrants (Upadhyay 1991). Even though scholars have conducted some ethnographic studies of Nepalese immigrants, these studies tend to examine who the Nepalese spend their leisure time with in the United States. Likewise, there has never been a survey study of structural adaptation among Nepalese immigrants.
Intermarriage intersects with cultural adaptation because marriage and culture both tend to preserve language, religion, and other cultural components (Yang 2011). In terms of marriage, in most cases, Nepalese immigrants were married before coming to the USA or returned to Nepal to get married (Dhungel 1999). Young Nepalese men normally do not prefer to marry Nepalese women raised and educated in the USA (Dhungel 1999). There have been some cases where Nepalese men have married American and other international women (Dhungel 1999). The Nepalese are more likely to accept an international matrimonial relationship than an inter-caste marriage (Dhungel 1999; Gubhaju 1999). Based on the fact that Nepalese traditionalists believe in the caste system, there are mixed opinions about whom their children should marry. In addition, Nepalese parents choose a bride or groom who belongs to the same caste. However, some parents prefer that their children marry someone from Nepal regardless of castes (Gubhaju 1999). Nepalese parents constantly insist on the tradition of arranged marriages (Tamot 2008). Nonetheless, these assertions lack well-supported evidence to substantiate the ongoing status of intermarriage among Nepalese migrants.
Even though the first generation tends to maintain their ethnic identities, identification change is evident (Yang 2011). Among the Nepalese who live in the USA, the “identity of being a Nepalese seems to remain very strong” (Dhungel 1999, 130). A new ethnic identity is inevitable, and “ethnic boundaries and meaning are also constructed from within and from without, propped up by internal and external pressures” (Nagel 1994, 167). A hyphenated identity “is likely to indicate that these Americans cannot be American in the same way as their white peers” (Purkayastha 2005, 9). The implication is that the boundaries define whether one is a member of a particular group or not (Nagel 1994). Shrestha (1995, 123) emphasized that “Nepal is the country of our birth, the United States is the country of our choice, and we are American with Nepalese identity”. Nevertheless, there is little survey research on the identificational adaptation of the Nepalese in the USA.
The Nepalese in the USA face both attitudinal prejudice and behavioral discrimination. How the Nepalese are received in the host country is still understudied. Nepalese immigrants are often mistakenly identified as Hispanic (Tamot 2008). Dhungel (1999, 130) stated, “There is also deep feeling of discrimination among both the Nepalese educated elites and unskilled workers on the job and on the process of findings job”. Furthermore, “Nepalese immigrants have experienced taboos at work particularly from American co-workers, supervisors, or sometimes from other senior employees” (Dhungel 1999, 130). Likewise, in the United States, racism is higher towards Nepalese immigrant women than towards Nepalese immigrant men (Tamot 2008). One of the participants expressed that “You [Nepalese] will never be a part of this country” (Tamot 2008, 244). While these data and narratives are useful, the receptional adaptation of Nepalese in the United States has never been systematically analyzed.
A lack of research on the adaptation of the Nepalese in the United States reveals that there is a need to conduct a systematic empirical study. The literature lacks not only adequate descriptions about the adaptation processes of Nepalese immigrants in the United States but also an in-depth and empirical analysis of various dimensions of adaptation.
The purposes of this paper are twofold: (1) one is to document the rapid growth of the Nepalese diasporic community in the USA based on verifiable data from government agencies and (2) the other is to analyze the experiences of the Nepalese in cultural adaptation, structural adaptation, marital adaptation, identificational adaptation, and receptional adaptation using data from an online survey we conducted. We use the term “Nepalese diaspora” to refer to either the migration of the Nepalese from their homeland or the Nepalese diasporic community. Although we supersede the one-sided term “assimilation” by a neutral term “adaptation”, we retain Gordon’s cultural, structural, marital, identificational, and receptional dimensions because they are useful for organizing our analysis. In the balance of this paper, we first briefly describe the data and method used for this analysis. After that, we discuss the origins of the Nepalese people. The next section looks into the migration of the Nepalese to the USA. The subsequent section investigates the adaptation of the Nepalese in America. The final section summarizes the findings and discusses the implications of the findings.
2. Materials and Methods
We used two sources of data for this study. The data on the trend of Nepalese immigration to the United States come from the Office of Immigration Statistics (OIS) of the US Citizenship and Immigration Services (including its predecessor Immigration and Naturalization Service) now within the U.S. Department of Homeland Security (DHS). Yearbooks of Immigration Statistics produced by the OIS provide information on the numbers and types of Nepalese immigrants.
The data on Nepalese adaptation come from an online survey collected by the first author in 2010. The sample was collected from foreign-born Nepalese who were 18 years old or older and were living in the USA. The sample included both Nepalese immigrants and certain nonimmigrants who had relatively permanent addresses. There were several reasons for including certain Nepalese nonimmigrants in this study. First, due to a lack of a list of Nepalese immigrants in the USA, it was impossible to select immigrants only. Second, certain types of nonimmigrants, such as temporary workers on an H1-B visa, international students on an F-1 visa, and asylees are very likely to become immigrants later and go through the adaptation process. In particular, students who pursue a college or graduate degree in the USA spend at least four to six years to obtain their degrees and often tend to change their nonimmigrant status to permanent resident status after graduation. Therefore, it is likely that they also undergo the adaptation processes in the USA. Likewise, temporary working professionals on an H1-B visa also stay in the USA for quite a long time and go through the adaptation processes; a similar process occurs for the Nepalese who are seeking political asylum in the USA. These Nepalese nonimmigrants are part of the larger Nepalese community in the USA. However, we excluded the respondents who were registered under visitor visas for business or pleasure because they are here for a short period of time and may not go through adaptation processes in the USA. Through the assistance of 18 Nepalese organizations in the USA and the personal networks of the first author, an online questionnaire was delivered to the Nepalese with a valid email address. After three rounds of emails and reminders, a total of 768 valid questionnaires were completed and returned.
At the time of the survey, the average age of the respondents when entering the USA was 24.3 years old with a standard deviation (SD) of 7.5. Among the respondents, 59 percent were male and 41 percent were female. In this sample, 57 percent of the respondents were either US citizens or permanent residents (green card holders). On average, the respondents had resided in the USA for approximately nine years. In terms of the highest level of education, on average, the respondents had somewhat more than a bachelor’s degree. The average level of education completed in the USA was about 4 years with a SD of 3.36. Half of the respondents visited Nepal every two years, sent money back every two years, and never chatted/discussed things online. Half of the respondents read Nepali newspapers once a week.
The limitations of the data in this study ought to be acknowledged. First, because of the non-random nature of the sample, the findings may not be generalizable to the larger Nepalese population living in the USA. Second, although this study attempted to include people with various backgrounds, people with limited knowledge of English and limited computer literacy have been left out. Since this study required some level of education, it may not capture the adaptation experiences of people with lower levels of education. Third, because of the space constraints, we only report the direct answers to the survey questions on the five dimensions of adaptation by using descriptive statistics such as mean, median, mode, and standard deviation. Our survey results do not control for other variables such as gender, age, length of US residence, English competence, and so on. Bivariate and multivariate analysis will require a separate paper. Fourth, our survey data are somewhat dated and only reflect a snapshot of foreign-born Nepalese in 2010. Finally, since many respondents belong to Nepalese organizations in the United States, the results may reflect the experience of the Nepalese in these organizations more than that of the Nepalese outside them; nonetheless, the experience and information in the questionnaire represented the respondents’ personal experience and information rather than those of the organizations. These limitations notwithstanding, our large survey provides an excellent opportunity to study the adaptation of foreign-born Nepalese in the USA.
3. The Origins of the Nepalese People
The Nepalese people have diverse ethnic or cultural origins. Nepal is home to numerous languages and dialects (Gurung 1997). According to the 2021 Nepali Census, there were 124 languages and 142 ethnic groups in Nepal (CBS 2021). Nepali is spoken by approximately 45 percent of the population as their mother tongue, followed by Maithili (11.05 percent), Bhojpuri (6.24 percent), Tharu (5.88), Newari (2.96 percent), and other (29.01 percent) (CBS 2021).
In censuses, ethnicity is subsumed under caste. Out of 142 caste/ethnic groups, Chhetri and Brahman (i.e., those with Indo-Aryan ancestry originating from India) together comprise about 28 percent, followed by approximately 18 percent of Mongolian descent (i.e., Magar, Tamang, Gurung, Rai, and Limbu who originated from Mongolia and Tibet), Newar (who settled in Nepal prior to the Tibeto and Indo-Aryan migrations) at roughly 5 percent, and other castes, which comprise about 49 percent (CBS 2021). In addition, the Nepalese population is divided along ethnic lines that run parallel with the country’s geographical zones (Mihaly 1965). Geographically, in the high mountainous regions, people are primarily of pure Mongolian descent, and their language and customs are similar to those of Tibetans (Mihaly 1965). The southern side of Nepal is flat, and the culture and appearance of the people are similar to those of the people from India (Mihaly 1965). People in the middle hill area mainly comprise Bahun-Chhetris (Indo-Aryan) or privileged castes (Dhungel 1999).
Religion, caste, and ethnicity are determining factors in the spatial and social stratification of the Nepalese people. “Castes are vertically stratified by ritual status” (Gurung 2003, 3). In Hinduism, caste defines certain groups in a hierarchy of ritual purity and pollution (Bennett 1983). Most of the people follow Hinduism as their religion (81.18 percent), followed by Buddhism (8.2 percent), Islam (5.08 percent), Kirat (3.16%), Christianity (1.75 percent), and others (0.59 percent) (CBS 2021). Borrowing from the Hindu caste system, Nepal’s caste system consisted of four castes or varnas in the 1854 Muluki Ain: Brahmin, Kshatriya, Vaishya, and Shudra. At the top, the Brahamans and Kastriya varnas were those who traditionally filled the roles of priests and warriors, respectively (Bennett 1983). Gurung, Magar, and Newar were incorporated into the middle position. Sudra belonged to the bottom of the varna classifications. They were considered as lower castes or untouchables. In 1963, the New Legal Code (Naya Muluki Ain) was introduced to outlaw the caste hierarchy. However, in practice, caste discrimination still prevails.
4. The Nepalese Diaspora in the USA
The Nepalese diaspora in the USA is one of the larger Nepalese diasporas in the world. The largest Nepalese diaspora is in India (over 2.9 million) (Adhikari 2023). Nepalese migration to India has a long history; because of open borders between Nepal and India, Nepalese and Indians could cross the borders freely (Adhikari 2023; Thieme et al. 2005). Sizable Nepalese diasporas can also be found in some Asian countries, such as Malaysia, Qatar, Saudia Arabia, the United Arab Emirates, Kuwait, Japan, South Korea, Bahrain, and Hong Kong, and in some non-Asian countries, such as the USA, the United Kingdom, Australia, and Canada (International Organization for Migration 2019).
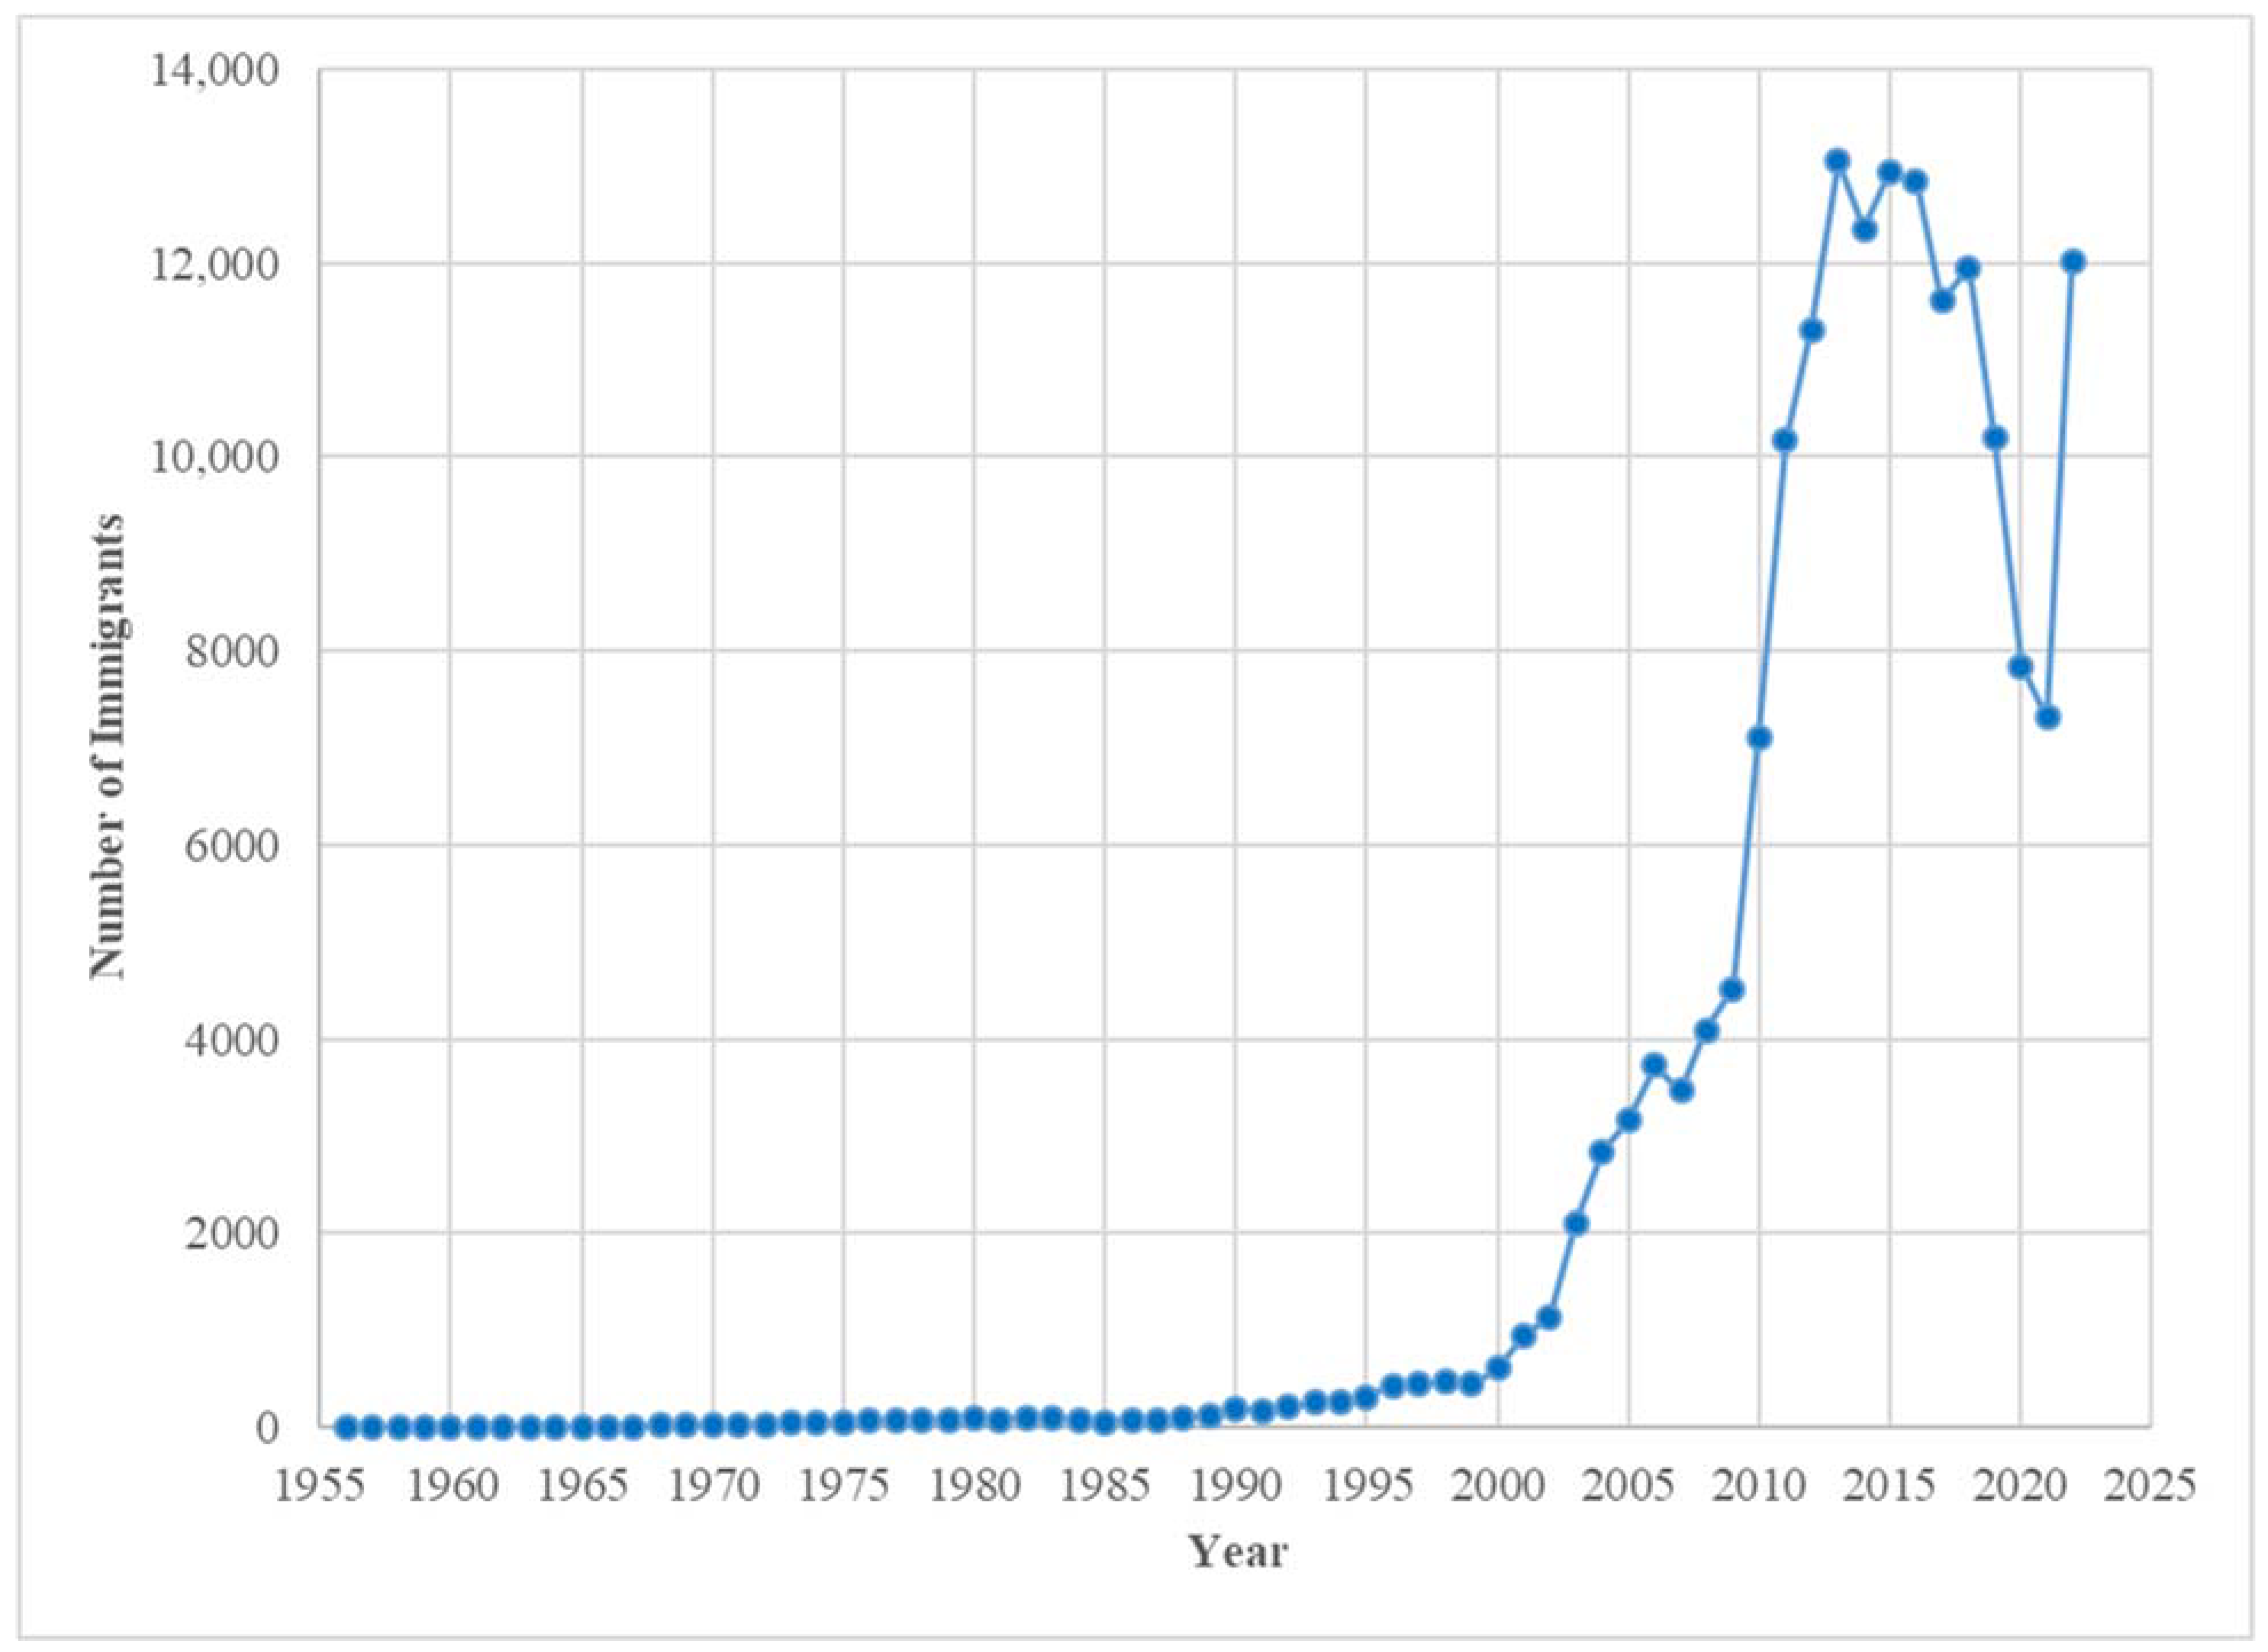
Since the early US immigration data grouped Nepal into the “other Asia” category, we do not know for sure if any Nepalese immigrated to the USA before the 1950s. Nonetheless, we do know that until 1947, the Nepalese were not able to immigrate to the USA because of the restrictive policies of the Nepalese government and the absence of a diplomatic relationship with the United States (Dhungel 1999). The national origins quota system in the USA and the emphasis on family reunification did not favor Nepalese immigration to the USA (Dhungel 1999). The recorded Nepalese immigration to the USA began in 1956 with only one Nepalese immigrant admitted in that year. As Figure 1 and the Appendix A show, from 1956 to 1967, each year less than ten Nepalese were admitted; from 1968 to 1986, the annual number of Nepalese immigrants was less than 100, varying from 19 to 97, except for 1983 (105). From 1988 to 2001, the number started to surpass 100 but never reached 1000. However, since 2002, each year, more than 1000 Nepalese have immigrated to the USA. In particular, the annual admission surpassed 10,000 from 2011 to 2019. It may be appropriate to characterize Nepalese immigration to the USA before 2000 as a trickle, as only 4778 Nepalese immigrated in about half a century. Nevertheless, in the twenty-first century, Nepalese immigration has accelerated and become a major stream. The number of Nepalese immigrants increased 3395 times from the pre-2000 period (1956–1999) to the post-2000 period (2000–2022). This phenomenal increase is vividly shown in Figure 1 (see Appendix A for the numbers of immigrants by year). Although slightly over 167,000 in the post-2000 period may not be a huge number compared to larger immigrant groups, it was indeed tremendous growth compared to the extremely low base number of Nepalese immigrants in the pre-2000 period. For the last seven decades, a total of 172,096 have immigrated to the USA.
The substantial increases in Nepalese immigration since 2000 can be notably attributed to the Diversity Visa (DV) Program. As shown in Table 1, the number of Nepalese DV immigrants rose from 104 in 2000 to 2894 in 2022. In particular, from 2013 to 2018, more than 3000 Nepalese immigrants arrived annually under the DV Program. The total number of Nepalese DV immigrants in the twenty-first century was 46,321, which was approximately 27.6 percent of all Nepalese immigrants in the same period. The DV Program increased the diverse backgrounds of Nepalese immigrants in the USA because the minimum eligibility criteria for applying for the DV lottery were high school graduation and two years of work experience. The lottery system brought relatively less educated Nepalese to the USA (Dhungel 1999).
In the twenty-first century, the largest category of Nepalese immigrants was refugees and asylees. As evident in Table 1, the total number of Nepalese in the category of refugees and asylees who were granted permanent residence was 50,631, or 31.2 percent of all Nepalese immigrants. The number of Nepalese immigrants who obtained permanent residency by adjusting their status of refugees and asylees increased significantly after 2005. In particular, in the decade of the 2010s, 44,327 Nepalese gained permanent residency via the route of refugees and asylees. The reason was the political turmoil resulting from the Maoists–government conflict (1996–2006) (Joshi and Mason 2011). Nepal became a federal democratic republic on 28 May 2008, when the Constituent Assembly overwhelmingly voted to end the country’s 240-year-old monarchy. As a result, King Gyanendra’s reign ended in 2008, as did the Shah Dynasty in Nepal. The Maoists gained the majority of the votes in the 2008 Constituent Assembly election. The Maoist leader, Pushpa Kamal Dahal, became the prime minister of Nepal on 18 August 2008 and held the position for less than a year. Within that three-year period from 2008–2011, Nepal had three prime ministers, each holding a term of less than a year. Nepal’s political parties had not yet been able to establish a stable government. The political instability drove many Nepalese to exit the country and seek refuge in the USA.
As shown in Table 1, family reunification, including family-sponsored preferences and immediate relatives of US citizens, also played a large role in the immigration of many Nepalese in the twenty-first century. Since 2000, a total of 46,393 Nepalese have been admitted through family-sponsored preferences and as immediate relatives of US citizens. Family reunification played a role similar to the DV Program as it contributed to 27.6 percent of the total Nepalese immigration in the twenty-first century. Employment preferences also played a significant role in Nepalese immigration in the twenty-first century as a total of 24,222, or 14.4 percent, Nepalese gained admission through employment.
To be sure, international students are not immigrants, but they are an important source of immigration (Yang 2011) because many students adjust their nonimmigrant status to immigrant after finding an employment in America. This is especially true for Nepalese students in the USA. Table 2 shows that the number of enrolled Nepalese students in American universities has steadily grown with fluctuations from 1219 in academic year 1995–1996 to 15,090 in 2022–2023, an increase of more than 11 times (International Institute of Education 2023). According to the International Institute of Education, Nepal is the eleventh leading country in terms of the number of international students in US higher education in 2023. The total number of Nepalese students in the USA from 1995–1996 to 2022–2023 reached 216,975.
Some Nepalese who were here for a temporary stay also attempted to stay in the United States under the Temporary Protected Status (TPS). Due to the impact of the 7.8 earthquake in Nepal on 25 April 2015, the DHS granted 14,477 Nepalese TPS (U.S. Department of Homeland Security 2023). This allowed eligible Nepalese who could not return safely due to ongoing environmental disasters that substantially disrupted living conditions in Nepal to stay in the USA.
5. Nepalese Adaptation to American Life
How do the Nepalese in the United States adapt culturally, structurally, maritally, identificationally, and receptionally to American life? Available data such as US censuses, current population surveys, and other surveys provide very little information to answer this question for the Nepalese in the USA. Hence, we conducted an online survey of the Nepalese in the USA. This section offers answers to this question based on the survey results.
5.1. Cultural Adaptation
To Gordon (1964), cultural assimilation is the relinquishment of immigrants’ traditional ways of life (e.g., norms, beliefs, values, religion, customs) and the adoption of the dominant culture of the host society. Similarly, we define cultural adaptation as the adjustment to the culture of the host society. To measure the cultural adaptation of the Nepalese in America, the survey asked the respondents whether they celebrated Hindu festivals, whether they celebrated American holidays, how often they attended Hindu religious services, how often they attended Nepalese functions, how often they cooked Nepalese food, what language they spoke at home, whether they spoke Nepali with their children, and how well they spoke English. The first two variables and variables 5 and 6 are dummy variables, coded 1 for the designated category and coded 0 otherwise, and variables 3, 4, and 7 are ordinal variables.
The results of the survey are presented in Table 3. The means of the dummy variables can be interpreted as percentages if multiplying by 100. Table 3 reveals that 95 percent (0.95 multiply by 100) of the Nepalese respondents celebrated Hindu religious festivals. Similarly, 92 percent of the respondents also celebrated American holidays. The mean of 2.17 on a 0–6 scale for attending Hindu religious services meant the respondents attended Hindu religious services slightly more than several times a year. The median of 2 on the same scale indicated that half of the respondents attended Hindu religious services less than several times a year and half of them attended such services more than several times a year. The mean of 1.65 on a 0–6 scale for attending Nepalese functions indicated that respondents attended Nepalese functions more than once a year. As indicated by the median of 2, half of the respondents attended Nepali functions less than several times a year, while the other half attended Nepali functions more than several times a year. In the same vein, on average, the respondents cooked Nepali food somewhat more than 2–3 times a month (mean = 5.35). Most of the respondents spoke Nepali at home (mode = 2) and with their children (mode = 2). On average, the respondents self-claimed that they spoke English close to “very well” (mean = 2.69). These results reveal partial assimilation to American culture and the partial retention of ethnic culture in cultural adaptation among the Nepalese in the USA.
5.2. Structural Adaptation
According to Gordon (1964), structural assimilation refers to gaining entrance into cliques, clubs, and institutions of the host society on a primary group level, but we believe it should not be limited to the primary group level and should be extended to the institutional level. We used eight indicators to measure structural adaptation. The survey asked the Nepalese respondents whether they hesitated to interact with members of other racial/ethnic groups, who was their best or close friend, who they were mostly associated with, who they mostly worked with in workplace, what kind of neighborhood they lived in, if they had membership in Nepalese organizations, if they had membership in South Asian organizations, and if they had membership in American organizations. All of these indicators are dichotomous variables, coded 1 for the designated category and 0 otherwise. We combined Blacks and Hispanics as the number of cases were very small.
Table 4 shows the results of the survey on structural adaptation. Only 8 percent of the respondents hesitated to interact with other racial/ethnic groups. Most of the respondents had the best or close friendship with other Nepalese (mode = 1). Not surprisingly, the respondents mostly socialized with other Nepalese (72 percent); they also socialized with other racial/ethnic groups, such as Whites (48 percent), other Asians (41 percent), Blacks (19 percent), Hispanics (19 percent), and other (7 percent). In terms of who they mostly worked with, the respondents mostly worked or interacted with Whites (75 percent), followed by other Asians (48 percent), Blacks (29 percent), Hispanics (27 percent), and others (9 percent). Interestingly, the Nepalese predominantly lived or had interactions in their neighborhoods with Whites (75 percent), followed by other Asians (25 percent), Hispanics (22 percent), Blacks (19 percent), Nepalese (14 percent), and others (10 percent). More than half of the respondents were members of Nepalese organizations (52 percent), followed by American organizations (14 percent), and only 13 percent were members of Asian organizations in the USA. These results indicate a high degree of ethnic retention but some partial assimilation in structural adaptation among Nepalese in the USA.
5.3. Marital Adaptation
Following Gordon’s (1964) definition of marital assimilation (amalgamation), we use marital adaptation to refer to large-scale intermarriage. Marital adaptation has three indicators, which were based on the following three questions: First, “Is your spouse Nepali”? Second, “Hypothetically, if you had a choice, who would you marry”? Third, “Do you allow your children to marry a non-Nepalese?”
Table 5 shows the percentage distributions of the survey results on the three questions. For the first question, most of the Nepalese respondents (89 percent) were married to Nepalese as compared to 11 percent who were married to non-Nepalese. For the second question, the vast majority of the respondents expressed that if they had a choice, they would marry Nepalis (79.4 percent) while the remaining 21 percent would marry Whites, other Asians, Blacks, Hispanics, or other. Interestingly, for the third question, somewhat more than half of the respondents (54.5 percent) agreed that they would allow their children to marry a non-Nepalese, whereas over one-third of them were unsure and about 10 percent rejected the option of allowing their children to marry a non-Nepalese. These findings suggest a high degree of ethnic retention but some partial assimilation in marital adaptation.
5.4. Identificational Adaptation
According to Gordon (1964), identificational assimilation involves the development of a sense of peoplehood based exclusively on the host society. We define identificational adaptation as the development of identities, which may include the retention of ethnic identity, the development of identity based on the host society, or the development of a new identity. To measure identificational adaptation, the survey asked two questions. First, “How do you identify yourself, that is, what do you call yourself?” Second, “How close do you feel to your ethnic group (Nepalese)?”
Table 6 reports results of the survey on “self-identification” and “feeling close to Nepalese”. When asked how they identified or called themselves, a large majority of the respondents (71.8 percent) in this sample chose “Nepalese”, that is, their ethnic identity, as their identity. Another 20 percent selected “Nepalese American”—an Americanized ethnic identity—as their identity. Only 1.7 percent identified as “American”, an indication of identificational assimilation to the host society. And 6.5 percent chose such pan-ethnic identities as “Asian” or “Asian American” as their identities. The second question reflects a feeling close to own ethnic group, which is Nepalese. Most of the Nepalese in the sample (95.8 percent) felt “very close” (62.2 percent) or “close” (33.6 percent) to their own ethnic group. Only a small minority (4.2 percent) of the respondents did not feel close at all. These results paint a picture of ethnic retention in identificational adaptation.
5.5. Receptional Adaptation
According to Gordon (1964, 70–71), attitude receptional assimilation means the absence of prejudice and behavior receptional assimilation means the absence of discrimination. We used receptional adaptation to gauge whether or not the Nepalese in the USA experienced prejudice and discrimination. Our survey asked the following questions: “How well do you think the U.S. government has treated you?”, “Have you been discriminated against because of your ethnicity in the United States?”, “Have you ever been excluded socially from your co-workers?”, “Have you ever been discriminated against when buying or renting a house in an area you preferred?”, “Have you ever noticed that you were being judged based on your appearance?”, “Have you ever been mistaken as Hispanic/Black/Asian/Other?”, “Because of your ethnicity or nationality, how often do people of other races treat you as less competent than you deserve to be treated?”, and “Because of your ethnicity or nationality, how often do you feel out of place or unwelcome in public places?”. The first question about experiences of US government treatment is an ordinal variable with three categories: “not well”, “well”, and “very well”. The mistaken identity variable is nominal with five categories: “never”, “‘Hispanic”, “Black”, “Asian”, and “other”. We dropped the “Black” category as it had only five cases. All other questions are ordinal variables with four categories: “never”, “sometimes”, “often”, and “all the time”. Since “often” and “all the time” have very few cases, we grouped them together (“never”, “sometimes”, and “often/all the time”).
Table 7 displays the results of the survey on receptional adaptation. On average, the respondents felt that they had been treated “well” by the US government (mean = 2.22). The mean of 0.63 on a 0–2 scale for discrimination indicated that the Nepalese experienced ethnic discrimination between “never” and “sometimes”. The respondents had almost “never” felt exclusion from their co-workers (mean = 0.27), and nearly “never” experienced discrimination in buying/renting houses or apartments (mean = 0.16). The Nepalese faced some sort of prejudice in the USA; the respondents felt they were judged based on their appearance (median = 1); were viewed as less competent, between “never” and “sometimes”, by people from other races (median = 1); and experienced an unwelcomed feeling in public places, between “never” and “sometimes” (median = 0). Overwhelmingly, the majority of them have been mistaken for Hispanic (mode = 1).
6. Discussion and Conclusions
One of the major findings of this study is that for almost half a century after the recorded Nepalese immigration to the USA started in the twentieth century, the number of Nepalese immigrants (i.e., 4787) was small with a very slow pace. Nevertheless, in the twenty-first century, Nepalese immigration to the USA has witnessed phenomenal growth with a total of 167,887 immigrants, making it one of the large migration flows. Refugees and asylees, the DV Program, family reunification, and employment preferences have all played a significant role in the substantial surge of Nepalese immigration.
With regard to Nepalese adaptation to American life, our unique online survey has uncovered some patterns. In terms of cultural adaptation, the Nepalese have become partly assimilated to American culture but have largely maintained their ethnic culture. For example, the majority of the Nepalese in the sample celebrated both Hindu festivals (95 percent) and American holidays (92 percent). On average, they attended Hindu religious services several times a year, attended Nepali functions more than once a year, and cooked Nepali food 2–3 times a month. They tended to speak English very well, but Nepali was the dominant language spoken at home and with children.
Regarding structural adaptation, a large majority of the Nepalese respondents had a fellow Nepalese as their best or close friend, although some also had friendships with Whites, other Asians, Blacks, and Hispanics. The workplace is a different story, as three fourths of Nepalese respondents worked or interacted with Whites, probably because there are more Whites than other racial or ethnic groups. The Nepalese also worked with other Asians (48 percent), Blacks (29 percent), and Hispanics (27 percent). In terms of residential neighborhoods, the Nepalese were most likely to live in predominantly White neighborhoods and a significant proportion of them also lived in other Asian, Black, and Hispanic neighborhoods. Only less than one sixth of them lived in a Nepalese neighborhood. More than half of the respondents were members of Nepalese organizations, but less than one sixth of them were members of American organizations and south Asian organizations.
Intermarriage is a barometer of assimilation to the dominant group of the host society or ethnic retention and social distance (Yang and Prost 2021). Intergroup marriage reduces social distance (Lee and Yamanaka 1990; Lee and Fernandez 1998) and simultaneously reinforces the assimilation of racial minority groups into US society (Lee and Yamanaka 1990). With regard to marital adaptation, most Nepalese had a Nepalese spouse. Their preferred spouses would be Nepali, if given a choice. It is not surprising that the Nepalese prefer to marry their co-ethnics. On the other hand, more than half of the respondents agreed that they would allow their children to marry non-Nepalese.
As for identificational adaptation, the survey results reveal that an overwhelming majority (about 92 percent) of the respondents chose “Nepalese” or “Nepalese “American” as their self-identity while only less than 2 percent self-identified as “American” and 5.5 percent accepted a pan-Asian identity (i.e., “Asian” or “Asian American”). Additionally, most Nepalese felt very close or close to fellow Nepalese. These pieces of evidence appear to favor the retention of ethnic identity much more than assimilation into the American identity.
Receptional adaptation occurs when there is an absence of prejudice and discrimination. The evidence from our online survey indicates that the Nepalese respondents in the sample felt they had been treated well by the US government and reported insignificant experiences of discrimination. They reported very few experiences of social exclusion by co-workers, discrimination when buying or renting houses, and feelings of unwelcomeness in public places. However, the Nepalese respondents in the sample did report facing judgment due to their appearance and being viewed as less competent by other races “sometimes”. Many Nepalese reported being mistaken for Hispanics.
The evidence from our survey appears to lend no support to the classic assimilation theory because total assimilation has not transpired for Nepalese migrants. The melting pot theory is also not supported through our survey evidence since there is little biological and cultural blending between the Nepalese and the dominant group. Our survey does demonstrate that cultural pluralism captures the adaptation experience of the Nepalese in the USA fairly well. Cultural pluralism is a theoretical perspective that portrays partial assimilation into the dominant culture and institutions and the partial retention of ethnic culture and institutions among immigrants (Yang 2000). Evidence of partial assimilation into the dominant culture and partial retention of ethnic culture among the Nepalese in the USA abounds, as reflected in their celebration of both Hindu and American festivals; their, on average, very good English proficiency; their cooking of ethnic food; and their speaking ethnic language at home and to their children. Evidence of structural adaptation among the Nepalese is also in agreement with cultural pluralism as the Nepalese kept their best or close friendships largely with co-ethnics and were largely involved in Nepalese organizations, but they worked largely with Whites and lived mostly in White-dominated neighborhoods. Nepalese marital adaptation is also in line with cultural pluralism because the Nepalese mostly married with co-ethnics and wanted to marry a Nepalese if given a choice but would allow their children to marry non-Nepalese to a certain extent. Evidence of identificational adaptation seems to only partly support the concept of cultural pluralism because the Nepalese overwhelmingly chose their ethnic identity over an American identity. Finally, evidence of receptional adaptation is consistent with cultural pluralism because the Nepalese did not report much bad treatment or discrimination by the US government, but they reported some prejudices. The survey results have yet to offer any affirmative or counter evidence for the new assimilation theory or the segmented assimilation theory. The adaptation experience of Nepalese immigrants appears to be more similar to those of other immigrant groups than unique.
Our finding of Nepalese cultural adaptation appears to be consistent with the literature on Nepalese cultural retention (Koirala 2004; Tamot 2008) but adds evidence of partial assimilation and other evidence of cultural retention. Our result of Nepalese structural adaptation seems to confirm Tamot’s (2008) claim that the Nepalese were not structurally assimilated, but we provide much more evidence of structural adaptation in workplace and residential neighborhoods. Our finding of marital adaptation appears to support Dhungel’s (1999) observation that the Nepalese may be open to international marriage. As Qian (1999, 581) observed, “The more recent the immigrants, the less likely that they will intermarry”. Since the Nepalese were more recent immigrants, this may explain why they tended to marry largely within their own group. Our finding of dominant ethnic identity among the Nepalese is also congruent with Dhungel’s (1999) claim that the Nepalese had a strong ethnic identity. Our result also confirms Tamot’s (2008) claim that Nepalese immigrants were often mistaken for Hispanic. The difference between our study and existing studies is that we provide systematic survey evidence not available in the existing studies. We also provide evidence on receptional adaptation never researched before.
Our findings will have significant practical implications for assisting Nepalese migrants to better adapt to American life. Our findings suggest that there should be a balance between acculturation and cultural retention. On the one hand, we should help new Nepalese immigrants improve English proficiency and learn US norms, values, and customs. On the other hand, we ought to help the Nepalese families and ethnic community maintain Nepalese language, traditions, and customs through Nepalese language schools, ethnic community festival activities, and ethnic media. Our findings also point to the importance for Nepalese immigrants to expand structural assimilation or social networking beyond other Nepalese through residential neighborhoods, workplaces, and organizations. Our findings also intimate that Nepalese immigrants may reduce social distance with other racial or ethnic groups by being more open to intermarriage. It is necessary to educate Nepalese immigrants that there is nothing wrong with simultaneously retaining a Nepalese identity while accepting an American and Asian American identity. Finally, our results also suggest that it is important to educate other racial/ethnic groups about the Nepalese in the USA in order to mitigate prejudice and discrimination in their everyday lives.
A major contribution of this study is that this is the first large-scale survey study of the Nepalese in the United States. It offers a wealth of information on the adaptation of Nepalese that cannot be found elsewhere. In particular, it systematically analyzes the status of Nepalese cultural, structural, marital, identificational, and receptional adaptation. The Nepalese are brand-new immigrants in America. The results provide support for the cultural pluralism theory and challenge the classical assimilation theory.
Although this study provides a wealth of information on the adaptation experiences of the Nepalese, in order to offer a fuller understanding of the adaptation experiences of Nepalese individuals, future research should go beyond the five dimensions covered in this study to explore Nepalese’s socioeconomic, civic, and political adaptation. In addition, it is essential to have more robust data that offer conclusive generalizable findings; therefore, using a random sampling method with a larger representative sample size would be ideal. Given the importance of diversity within the Nepalese population, future studies should be conducted in both English and Nepali and should not be limited to only online surveys. There is also an urgency to conduct research on Bhutanese Nepali refugees, whose ancestors, language, and culture are similar to those of the Nepalese. They lived in Nepal as refugees for more than three decades when they faced ethnic cleansing in Bhutan. About 100,000 Bhutanese Nepalese refugees currently reside in the United States (The White House 2016). Since this study is restricted to first-generation immigrants, future research on second-generation Nepalese would be helpful. Including a qualitative analysis, either independently or in conjunction with a quantitative study, would help to more fully capture the in-depth experiences of the Nepalese in the United States.
Author Contributions
Conceptualization, S.T.-O. and P.Q.Y.; methodology, S.T.-O. and P.Q.Y.; software, S.T.-O.; validation, P.Q.Y.; data curation, S.T-O.; formal analysis, S.T.-O. and P.Q.Y.; writing—original draft preparation, S.T.-O.; writing—review, and editing, P.Q.Y.; visualization, P.Q.Y.; supervision, P.Q.Y. All authors have read and agreed to the published version of the manuscript.
Funding
This research received no external funding.
Institutional Review Board Statement
This study was conducted according to the guidelines of the Declaration of Helsinki, and approved by the Institutional Review Board of Texas Woman’s University (protocol #16182 and 11 June 2010).
Informed Consent Statement
Not applicable.
Data Availability Statement
Data are contained within the article.
Conflicts of Interest
The authors declare no conflicts of interest.
Appendix A

Table A1.
Number of Nepalese immigrants admitted to the United States, fiscal years 1956–2022.
| Year | Number | Year | Number | Year | Number |
|---|---|---|---|---|---|
| 1956 | 1 | 1979 | 79 | 2002 | 1138 |
| 1957 | 5 | 1980 | 98 | 2003 | 2099 |
| 1958 | 0 | 1981 | 83 | 2004 | 2842 |
| 1959 | 4 | 1982 | 97 | 2005 | 3158 |
| 1960 | 4 | 1983 | 105 | 2006 | 3733 |
| 1961 | 5 | 1984 | 75 | 2007 | 3472 |
| 1962 | 5 | 1985 | 63 | 2008 | 4093 |
| 1963 | 3 | 1986 | 86 | 2009 | 4514 |
| 1964 | 7 | 1987 | 78 | 2010 | 7115 |
| 1965 | 4 | 1988 | 106 | 2011 | 10,166 |
| 1966 | 8 | 1989 | 134 | 2012 | 11,312 |
| 1967 | 9 | 1990 | 184 | 2013 | 13,046 |
| 1968 | 19 | 1991 | 174 | 2014 | 12,357 |
| 1969 | 32 | 1992 | 212 | 2015 | 12,926 |
| 1970 | 25 | 1993 | 257 | 2016 | 12,851 |
| 1971 | 40 | 1994 | 257 | 2017 | 11,610 |
| 1972 | 39 | 1995 | 312 | 2018 | 11,953 |
| 1973 | 46 | 1996 | 431 | 2019 | 10,201 |
| 1974 | 43 | 1997 | 447 | 2020 | 7847 |
| 1975 | 56 | 1998 | 476 | 2021 | 7309 |
| 1976 | 68 | 1999 | 453 | 2022 | 12,010 |
| 1977 | 80 | 2000 | 617 | ||
| 1978 | 68 | 2001 | 949 | ||
| Total | 172,096 | ||||
Source: U.S. Department of Homeland Security (1996–2022).
References
- Adhikari, Ambika. 2023. The Nepali Diaspora’s Role in National Development. Policy Design and Practice 6: 357–80. [Google Scholar] [CrossRef]
- Alba, Richard, and Victor Nee. 1997. Special Issue: Immigrant Adaptation and Native-born Responses in the Making of Americans. International Migration Review 31: 826–74. [Google Scholar] [CrossRef] [PubMed]
- Alba, Richard, and Victor Nee. 2003. Remaking the American Mainstream. Cambridge: Harvard University Press. [Google Scholar]
- Bennett, Lynn. 1983. Dangerous Wives and Sacred Sisters: Social and Symbolic Roles of High-Caste Women in Nepal. New York: Columbia University Press. [Google Scholar]
- Central Bureau of Statistics (CBS). 2021. National Population and Housing Census 2021; Kathmandu: Central Bureau of Statistics. Available online: https://censusnepal.cbs.gov.np/Home/Details?tpid=5&dcid=3479c092-7749-4ba6-9369-45486cd67f30&tfsid=17 (accessed on 27 December 2023).
- Dhungel, Ramesh. K. 1999. Nepalese Immigrants in the United States of America. Contribution to Nepalese Studies 26: 119–34. [Google Scholar]
- Gordon, Milton. 1964. Assimilation in American Life: The Role of Race, Religion and National Origins. New York: Oxford University Press. [Google Scholar]
- Gubhaju, Bina. 1999. The Fluidity of Ethnicity: The Case of Nepali and Newar Identity in the United States. Contribution to Nepalese Studies 26: 119–34. [Google Scholar]
- Gurung, Harka. 1997. Linguistic Demographic of Nepal. Contribution to Nepalese Studies 24: 147–85. [Google Scholar]
- Gurung, Harka. 2003. Social Demography of Nepal: Census 2001. Nepal: Himal Books. [Google Scholar]
- International Institute of Education. 2023. Open Doors International Students Data. Available online: https://opendoorsdata.org/data/international-students/leading-places-of-origin/ (accessed on 27 December 2023).
- International Organization for Migration. 2019. Migration in Nepal: A Country Profile 2019. Available online: https://publications.iom.int/system/files/pdf/mp_nepal_2019.pdf (accessed on 15 January 2024).
- Joshi, Madhav, and T. David Mason. 2011. Peasants, Patrons, and Parties: The Tension between Clientelism and Democracy in Nepal. International Studies Quarterly 55: 151–75. [Google Scholar] [CrossRef]
- Koirala, Shabnam. 2004. Exploring Solutions at the Intersection of Education, Immigration and Transnationalism: Efforts of the Diaspora in Nepali Social Change. Ph.D. dissertation, University of California, Berkeley, CA, USA. Available online: http://proquest.umi.com/pqdweb?did=795930961&Fmt=7&clientId=48335&RQT=309&VName=PQD (accessed on 27 December 2023).
- Lee, Sharon M., and Keiko Yamanaka. 1990. Patterns of Asian American Intermarriage and Marital Assimilation. Journal of Comparative Family Studies 31: 287–305. [Google Scholar] [CrossRef]
- Lee, Sharon M., and Marilyn Fernandez. 1998. Trends in Asian American Racial/Ethnic Intermarriage: A Comparison of 1980 and 1990 Census Data. Sociological Perspectives 41: 323–42. [Google Scholar] [CrossRef] [PubMed]
- Mihaly, Eugene B. 1965. Foreign Aid and Politics in Nepal: A Case Study. New York: Oxford University Press. [Google Scholar]
- Nagel, Joane. 1994. Constructing Ethnicity: Creating and Recreating Ethnic Identity and Culture. Social Problems 41: 152–68. [Google Scholar] [CrossRef]
- Park, Robert E. 1937. Our Racial Frontier on the Pacific. In Race and Culture. Vol. 1(1950). Edited by E. C. Hughes and et al. Glencoe: Free Press, pp. 138–51. [Google Scholar]
- Portes, Alejandro, and Min Zhou. 1993. The New Second-Generation: Segmented Assimilation and Its Variants among Post-1965 Immigrant Youth. Annals of the American Academy of Political and Social Sciences 530: 74–98. [Google Scholar] [CrossRef]
- Purkayastha, Bandhana. 2005. Negotiating Ethnicity: Second-Generation South Asian Americans Traverse a Transnational World. New Brunswick: Rutgers University Press. [Google Scholar]
- Qian, Zhenchao. 1999. Who Intermarries? Education, Nativity, Region, and Interracial Marriage, 1980 and 1990. Journal of Comparative Family Studies 30: 579–97. [Google Scholar] [CrossRef]
- Shrestha, Mohan N. 1995. Nepalese in America: A Historical Perspective. In Nepalese American Perspectives. Cincinnati: Association of Nepalese in America, pp. 115–24. [Google Scholar]
- Tamot, Raju. 2008. Marginal Professionals, Predatory Nepalese Elites, and Emigration to the ‘Dreamland’. Michigan: Michigan State University. Available online: http://proquest.umi.com/pqdweb?did=1607939251&Fmt=7&clientId=48335&RQT=309&VName=PQD (accessed on 27 December 2023).
- The White House. 2016. Bhutanese Refugees Find Home in America. Available online: https://obamawhitehouse.archives.gov/blog/2016/03/11/bhutanese-refugees-find-home-america (accessed on 27 December 2023).
- Thieme, Susan, Raju Bhattrai, Ganesh Gurung, Michael Kollmair, Siddhi Manandhar, and Ulrike Müller-Böker. 2005. Addressing the Needs of Nepalese Migrant Workers in Nepal and in Delhi, India. Mountain Research and Development 25: 109–14. [Google Scholar] [CrossRef]
- Upadhyay, Pratima. 1991. The Social Assimilation of Nepalese Immigrants in the United States and the Role of Their English Language Training in This Process. Ph.D. dissertation, The University of Connecticut, Storrs, CT, USA. [Google Scholar]
- U.S. Department of Homeland Security. 1996–2022. Yearbook of Immigration Statistics. Available online: https://www.dhs.gov/ohss/topics/immigration/yearbook (accessed on 27 December 2023).
- U.S. Department of Homeland Security. 2023. Annual Report 2023: Citizenship and Immigration Services Ombudsman. Available online: https://www.dhs.gov/sites/default/files/2023-07/23_0630_cisomb_2023-annual-report-to-congress.pdf (accessed on 27 December 2023).
- Yang, Philip Q. 2000. Ethnic Studies: Issues and Approaches. Albany: State University of New York Press. [Google Scholar]
- Yang, Philip Q. 2011. Asian Immigration to the United States. Malden: Polity Press. [Google Scholar]
- Yang, Philip Q., and Jonbita Prost. 2021. Trends in Attitudes of White individuals, Black individuals, Asians, and Hispanic individuals toward Intermarriage in the Twenty-First Century. Societies 11: 21. [Google Scholar] [CrossRef]
Figure 1.
The number of Nepalese immigrants to the USA, fiscal years 1956–2022 (source: DHS).

Table 1.
Numbers of Nepalese who obtained legal permanent resident status by broad class of admission, fiscal years 2000–2022.
Table 1.
Numbers of Nepalese who obtained legal permanent resident status by broad class of admission, fiscal years 2000–2022.
| Year | Family-Sponsored Preferences | Employment-Based Preferences | Immediate Relatives of US Citizens | Diversity Visas | Refugees and Asylees | Other | Total |
|---|---|---|---|---|---|---|---|
| 2000 | 44 | 258 | 207 | 104 | 1 | 3 | 617 |
| 2001 | 61 | 447 | 296 | 142 | 2 | 0 | 948 |
| 2002 | 31 | 442 | 328 | 331 | 5 | 1 | 1138 |
| 2003 | 18 | 261 | 311 | 1495 | 12 | 0 | 2097 |
| 2004 | 53 | 479 | 415 | 1875 | 15 | 5 | 2842 |
| 2005 | 58 | 961 | 518 | 1545 | 72 | 4 | 3158 |
| 2006 | 88 | 864 | 668 | 1715 | 395 | 3 | 3733 |
| 2007 | 128 | 837 | 643 | 1175 | 683 | 6 | 3472 |
| 2008 | 97 | 765 | 650 | 1663 | 911 | 7 | 4093 |
| 2009 | 145 | 751 | 1013 | 1778 | 812 | 15 | 4514 |
| 2010 | 269 | 788 | 1312 | 1644 | 3093 | 9 | 7115 |
| 2011 | 381 | 1148 | 1522 | 1801 | 5299 | 15 | 10,166 |
| 2012 | 272 | 912 | 1766 | 2353 | 5987 | 22 | 11,312 |
| 2013 | 492 | 1362 | 1822 | 3210 | 6137 | 23 | 13,046 |
| 2014 | 806 | 946 | 1610 | 3443 | 5516 | 36 | 12,357 |
| 2015 | 657 | 1358 | 2161 | 3471 | 5261 | 18 | 12,926 |
| 2016 | 994 | 1386 | 2989 | 3242 | 4209 | 31 | 12,851 |
| 2017 | 1064 | 1355 | 2684 | 3205 | 3287 | 15 | 11,610 |
| 2018 | 1594 | 1594 | 2497 | 3466 | 3346 | 28 | 12,525 |
| 2019 | 895 | 1528 | 2637 | 2919 | 2192 | 30 | 10,201 |
| 2020 | 754 | 1775 | 1862 | 1828 | 1616 | 12 | 7847 |
| 2021 | 635 | 1542 | 3570 | 1022 | 518 | 22 | 7309 |
| 2022 | 2510 | 2463 | 2866 | 2894 | 1262 | 15 | 12,010 |
| Total | 12,046 | 24,222 | 34,347 | 46,321 | 50,631 | 320 | 167,887 |
Source: U.S. Department of Homeland Security (1996–2022).
Table 2.
Nepalese students in the United States, 1995/1996–2022/2023.
| Year | No. of Students from Nepal |
|---|---|
| 2022/23 | 15,090 |
| 2021/22 | 11,799 |
| 2020/21 | 11,172 |
| 2019/20 | 12,730 |
| 2018/19 | 13,229 |
| 2017/18 | 13,270 |
| 2016/17 | 11,607 |
| 2015/16 | 9662 |
| 2014/15 | 8158 |
| 2013/14 | 8155 |
| 2012/13 | 8920 |
| 2011/12 | 9621 |
| 2010/11 | 10,301 |
| 2009/10 | 11,233 |
| 2008/09 | 11,581 |
| 2007/08 | 8936 |
| 2006/07 | 7754 |
| 2005/06 | 6061 |
| 2004/05 | 4861 |
| 2003/04 | 4384 |
| 2002/03 | 3729 |
| 2001/02 | 3019 |
| 2000/01 | 2618 |
| 1999/00 | 2411 |
| 1998/99 | 2358 |
| 1997/98 | 1697 |
| 1996/97 | 1400 |
| 1995/96 | 1219 |
| Total | 216,975 |
Source: International Institute of Education (2023).
Table 3.
Descriptive statistics of cultural adaptation of Nepalese in the USA, 2010.
| Variable | Mean | Median | SD | N |
|---|---|---|---|---|
| Celebrating Hindu festivals (=1) | 0.95 | 0.22 | 762 | |
| Celebrating American holidays (=1) | 0.92 | 0.27 | 768 | |
| Attending Hindu religious services (7-point scale) | 2.17 | 2.00 | 1.20 | 756 |
| Attending Nepali functions (7-point scale) | 1.65 | 2.00 | 1.04 | 755 |
| Cooking Nepali food (7-point scale) | 5.35 | 6.00 | 1.22 | 754 |
| Language spoken at home | 2.44 | 2.00 a | 0.63 | 758 |
| Language spoken with children | 2.40 | 2.00 a | 0.74 | 418 |
| English language ability (4-point scale) | 2.69 | 3.00 | 0.53 | 700 |
a Mode. Source: Nepalese in USA, 2010 Survey.
Table 4.
Descriptive statistics of structural adaptation of Nepalese in the USA, 2010.
| Variable | Mean | Mode | SD | N |
|---|---|---|---|---|
| Hesitant to interact with other racial/ethnic | 0.08 | 0.28 | 747 | |
| groups (=1) | ||||
| Friendship (best or close) | 1.00 | 746 | ||
| Mostly socialized with | ||||
| Nepalese (=1) | 0.72 | 0.45 | 759 | |
| White (=1) | 0.48 | 0.50 | 759 | |
| Black (=1) | 0.19 | 0.39 | 759 | |
| Hispanic (=1) | 0.19 | 0.39 | 759 | |
| Other Asian (=1) | 0.41 | 0.49 | 759 | |
| Other (=1) | 0.07 | 0.25 | 759 | |
| Mostly worked with | ||||
| White (=1) | 0.75 | 0.43 | 759 | |
| Black (=1) | 0.29 | 0.46 | 759 | |
| Hispanic (=1) | 0.27 | 0.44 | 759 | |
| Other Asian (=1) | 0.48 | 0.50 | 759 | |
| Other (=1) | 0.09 | 0.28 | 759 | |
| Neighborhood predominant by | ||||
| Nepalese (=1) | 0.14 | 0.35 | 759 | |
| White (=1) | 0.75 | 0.43 | 759 | |
| Black (=1) | 0.19 | 0.40 | 759 | |
| Hispanic (=1) | 0.22 | 0.41 | 759 | |
| Other Asian (=1) | 0.25 | 0.44 | 759 | |
| Other (=1) | 0.10 | 0.24 | 759 | |
| Membership in Nepali organizations (=1) | 0.52 | 0.50 | 759 | |
| Membership in Asian organizations (=1) | 0.13 | 0.34 | 746 | |
| Membership in American organizations (=1) | 0.14 | 0.35 | 759 |
Source: Nepalese in USA, 2010 Survey.
Table 5.
Percentage distributions of marital adaptation of Nepalese in the USA, 2010.
| Variable | Percent | N |
|---|---|---|
| Nepalese spouse (=1) | 89.0% (455) | 511 |
| Hypothetical spouse to marry | 713 | |
| Nepali | 79.4% (566) | |
| White | 7.2% (51) | |
| Black/Hispanic | 2.2% (16) | |
| Other Asian | 2.4% (17) | |
| Other | 8.8% (63) | |
| Allowing children to marry non-Nepalese | 574 | |
| No | 9.9% (57) | |
| Unsure | 35.5% (204) | |
| Yes | 54.5% (313) |
Source: Nepalese in USA, 2010 Survey.
Table 6.
Percentage distributions of identificational adaptation of Nepalese in the USA, 2010.
| Variable | Percent | N |
|---|---|---|
| Self-identification | 708 | |
| Nepalese | 71.8% (508) | |
| Nepalese American | 20.0% (142) | |
| Asian | 3.7% (26) | |
| Asian American | 2.8% (20) | |
| American/Other | 1.7% (12) | |
| Feeling close to Nepalese | 708 | |
| Not close at all | 4.2% (30) | |
| Close | 33.6% (238) | |
| Very close | 62.2% (440) |
Source: Nepalese in USA, 2010 Survey.
Table 7.
Descriptive statistics of receptional adaptation of Nepalese in the USA, 2010.
| Variable | Mean | Median | N |
|---|---|---|---|
| Reception by the host country (3-point scale) | 2.22 | 2.00 | 725 |
| Experience of racial/ethnic discrimination (3-point scale) | 0.63 | 1.00 | 720 |
| Social exclusion by co-workers (3-point scale) | 0.27 | 0.00 | 717 |
| Experience in housing discrimination (3-point scale) | 0.16 | 0.00 | 719 |
| Judgment based on appearances (3-point scale) | 0.81 | 1.00 | 716 |
| Perception of less competent (3-point scale) | 0.61 | 1.00 | 714 |
| Unwelcome feeling in public places (3-point scale) | 0.50 | 0.00 | 717 |
| Mistaken as Hispanic | 0.90 | 1.00 a | 716 |
a Mode. Source: Nepalese in USA, 2010 Survey.
Disclaimer/Publisher’s Note: The statements, opinions and data contained in all publications are solely those of the individual author(s) and contributor(s) and not of MDPI and/or the editor(s). MDPI and/or the editor(s) disclaim responsibility for any injury to people or property resulting from any ideas, methods, instructions or products referred to in the content. |
© 2024 by the authors. Licensee MDPI, Basel, Switzerland. This article is an open access article distributed under the terms and conditions of the Creative Commons Attribution (CC BY) license (https://creativecommons.org/licenses/by/4.0/).
Share and Cite
MDPI and ACS Style
Thapa-Oli, S.; Yang, P.Q. The Nepalese Diaspora and Adaptation in the United States. Genealogy 2024, 8, 42. https://doi.org/10.3390/genealogy8020042
AMA Style
Thapa-Oli S, Yang PQ. The Nepalese Diaspora and Adaptation in the United States. Genealogy. 2024; 8(2):42. https://doi.org/10.3390/genealogy8020042
Chicago/Turabian StyleThapa-Oli, Soni, and Philip Q. Yang. 2024. "The Nepalese Diaspora and Adaptation in the United States" Genealogy 8, no. 2: 42. https://doi.org/10.3390/genealogy8020042