
A Qualitative and Quantitative Occupational Exposure Risk Assessment to Hazardous Substances during Powder-Bed Fusion Processes in Metal-Additive Manufacturing

 , ,
, ,  ,
,  and
and 
Abstract
:1. Introduction
2. Materials and Methods
- A gravimetric quantitative assessment of the exposure to particulate matter;
- A quantitative assessment of the exposure to UFPs during a particular AM task by direct reading measurements;
- A quantitative evaluation determining the dermal exposure of the workers during AM operations;
- A qualitative risk assessment using CB.
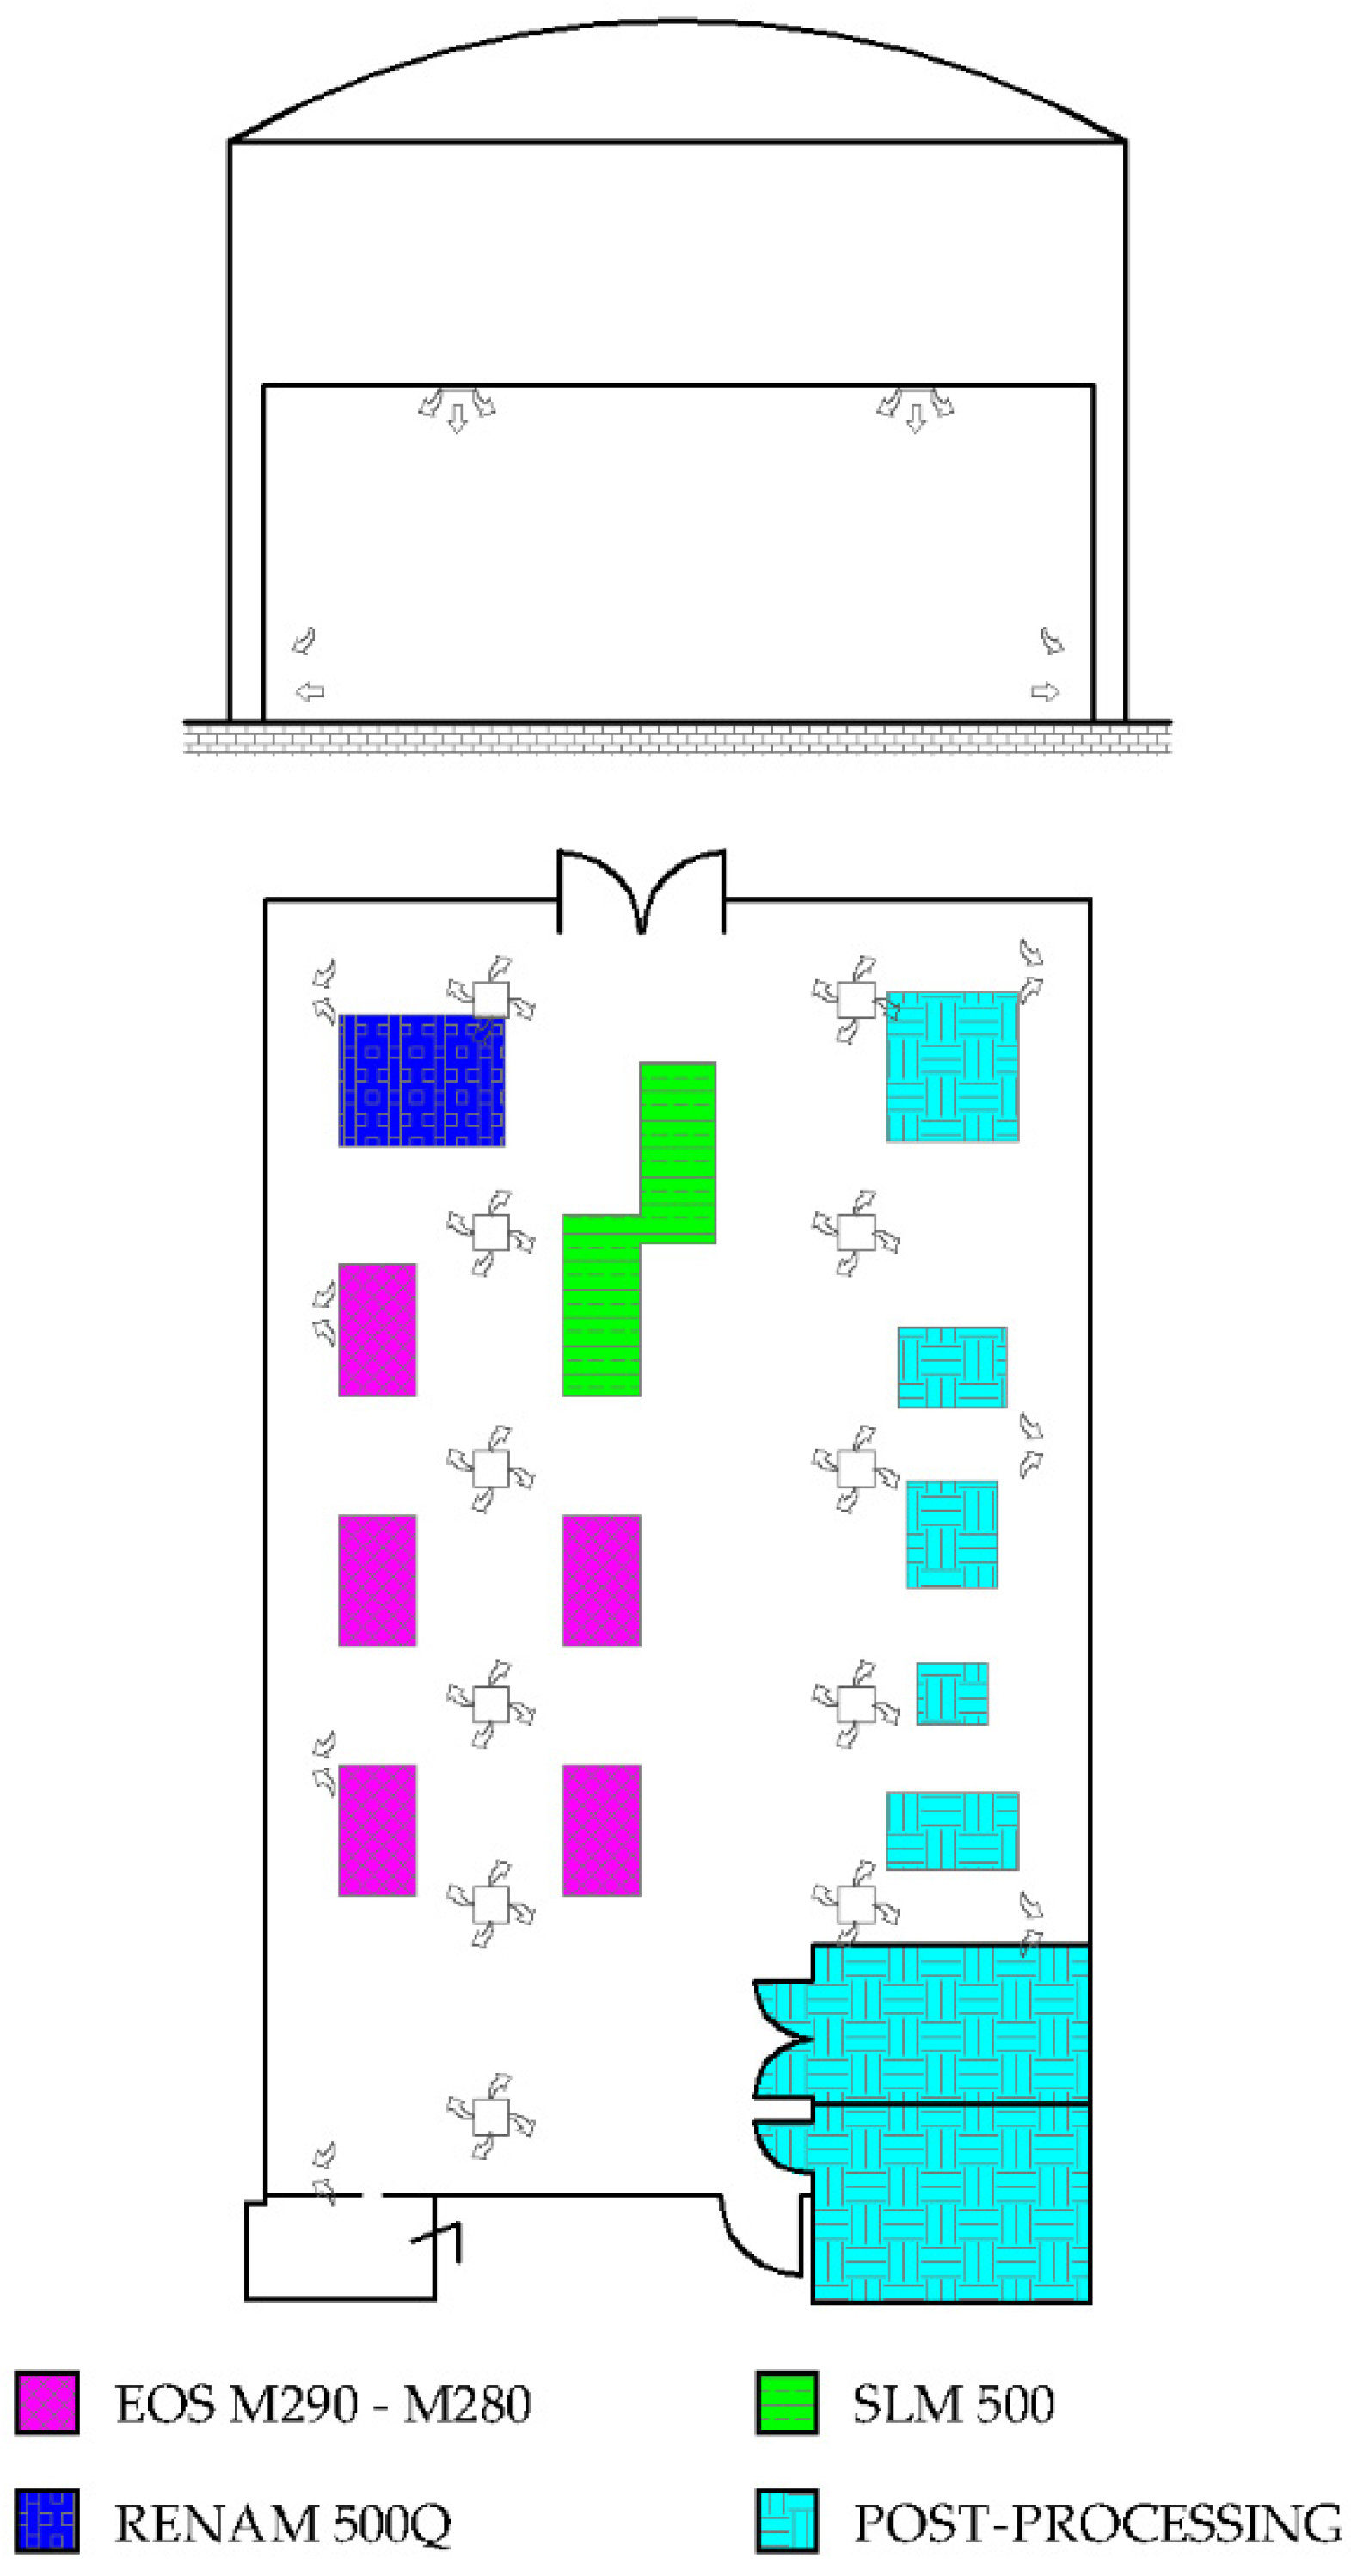
2.1. Facility and Process
- The refilling the machine tank with powder both using the manual open system (O1) and the closed one (O2);
- The removal and cleaning the final product and the recovery of unused powder (inside the machine operating area) with both an external specific vacuum cleaner (O3) and by manually dragging the powder in the perforated grill around the building plate (O4);
- The sifting the recovered powder (O5);
- The depowdering of the final product with compressed air in the post-process restricted area (O6).
2.1.1. Exposure Quantitative Assessment
2.1.2. Risk Qualitative Assessment
3. Results and Discussion
3.1. Exposure Quantitative Assessment
3.2. Risk Qualitative Assessment
4. Conclusions
Supplementary Materials
Author Contributions
Funding
Institutional Review Board Statement
Informed Consent Statement
Data Availability Statement
Conflicts of Interest
References
- Ingarao, G.; Ambrogio, G.; Gagliardi, F.; Di Lorenzo, R. A Sustainability Point of View on Sheet Metal Forming Operations: Material Wasting and Energy Consumption in Incremental Forming and Stamping Processes. J. Clen. Prod. 2012, 29, 255–268. [Google Scholar] [CrossRef]
- Soubihia, D.F.; Jabbour, C.J.C.; De Sousa, J.A.B.L.I. Green manufacturing: Relationship between Adoption of Green Operational Practices and Green Performance of Brazilian ISO 9001-Certified Firms. Int. J. Precis. Eng. Manuf.-Green. Tech. 2015, 2, 95–98. [Google Scholar] [CrossRef] [Green Version]
- Levy, G.N.; Schindel, R.; Kruth, J.P. Rapid manufacturing and rapid tooling with layer manufacturing (LM) technologies, state of the art and future perspectives. CIRP Ann. Manuf. Technol. 2003, 52, 589–609. [Google Scholar] [CrossRef]
- Beyer, C. Strategic implications of current trends in additive manufacturing. J. Manuf. Sci. Eng. 2014, 136, 064701. [Google Scholar] [CrossRef]
- Huang, R.; Riddle, M.; Graziano, D.; Warren, J.; Das, S.; Nimbalkar, S.; Cresko, J.; Masanet, E. Energy and Emissions Saving Potential of Additive Manufacturing: The Case of Lightweight Aircraft Components. J. Clean. Prod. 2016, 135, 1559–1570. [Google Scholar] [CrossRef] [Green Version]
- Ford, S.; Despeisse, M. Additive manufacturing and sustainability: An exploratory study of the advantages and challenges. J. Clean. Prod. 2016, 137, 1573–1587. [Google Scholar] [CrossRef]
- Vafadar, A.; Guzzomi, F.; Rassau, A.; Hayward, K. Advances in metal additive manufacturing: A review of common processes, industrial applications, and current challenges. Appl. Sci. 2021, 11, 1213. [Google Scholar] [CrossRef]
- ASTM International. Committee F42 on Additive Manufacturing Technologies; ASTM International: West Conshohocken, PA, USA, 2009. [Google Scholar]
- ASTM International. ISO/ASTM 52900; Standard Terminology for Additive Manufacturing-General Principles-Terminology. ASTM International: West Conshohocken, PA, USA, 2015.
- Pan, Z.; Ding, D.; Wu, B.; Cuiuri, D.; Li, H.; Norrish, J. Arc welding processes for additive manufacturing: A review. In Transactions on Intelligent Welding Manufacturing; Springer: Berlin/Heidelberg, Germany, 2018; pp. 3–24. [Google Scholar]
- Kruth, J.P.; Mercelis, P.; Van Vaerenbergh, J.; Froyen, L.; Rombouts, M. Binding mechanisms in selective laser sintering and selective laser melting. Rapid Prototyp. J. 2005, 11, 26–36. [Google Scholar] [CrossRef] [Green Version]
- Ahn, D.G. Direct metal additive manufacturing processes and their sustainable applications for green technology: A review. Int. J. Precis. Eng. Manuf.-Green Tech. 2016, 3, 381–395. [Google Scholar] [CrossRef]
- Zhang, Y.; Wu, L.; Guo, X.; Kane, S.; Deng, Y.J.Y.G.; Lee, j.; Zhang, J. Additive Manufacturing of Metallic Materials: A Review. J. Mater. Eng. Perform 2018, 27, 1–13. [Google Scholar] [CrossRef] [Green Version]
- Frazier, W.E. Metal Additive Manufacturing: A Review. Mater. Eng. Perform. 2014, 23, 1917–1928. [Google Scholar] [CrossRef]
- White, D.; Carmein, D.E.E. Ultrasonic Object Consolidation System and Method. US6463349B2, 8 October 2002. [Google Scholar]
- White, D. Ultrasonic Object Consolidation. US6519500B1, 22 February 2003. [Google Scholar]
- Ren, X.; Shao, H.; Lin, T.; Zheng, H.J. 3D Gel- Printing- An Additive Manufacturing Method for Producing Complex Shape Parts. Mater. Des. 2016, 101, 80–87. [Google Scholar] [CrossRef]
- Technavio. Metal Additive Manufacturing Market to Grow by $4.42 Billion during 2020–2024. 2021. Available online: https://www.prnewswire.com/news-releases/metal-additive-manufacturing-market-to-grow-by--4-42-billion-during-2020-2024--technavio-301349482.html (accessed on 15 July 2021).
- Grand View Research. 3D Printing Metal Market Size, Share & Trends Analysis Report by Product (Titanium, Nickel), by form (Filament, Powder), by Application (Aerospace & Defense, Medical & Dental), by Region, and Segment Forecasts, 2021–2028. Available online: https://www.grandviewresearch.com/industry-analysis/3d-metal-printing-market (accessed on 15 July 2021).
- AmpowerReport. Metal Additive Manufacturing Suppliers Predict a Market Size Growth of 27.9%. Available online: https://additive-manufacturing-report.com/additive-manufacturing-market/ (accessed on 15 July 2021).
- Tofail, S.A.M.; Koumoulos, E.P.; Bandyopadhyay, A.; Bose, S.; O’Donoghue, L.; Charitidis, C. Additive manufacturing: Scientific and technological challenges, market uptake and opportunities. Mater. Today 2018, 21, 22–37. [Google Scholar] [CrossRef]
- Schaller, K.H.; Csanady, G.; Filser, J.; Jüngert, B.; Drexler, H. Elimination kinetics of metals after an accidental exposure to welding fumes. Int. Arch. Occup. Environ. Health 2007, 80, 635–641. [Google Scholar] [CrossRef] [PubMed]
- Catalani, S.; Rizzetti, M.C.; Padovani, A.; Apostoli, P. Neurotoxicity of cobalt. Hum. Exp. Toxicol. 2012, 31, 421–437. [Google Scholar] [CrossRef] [PubMed]
- Wild, P.; Bourgkard, E.; Paris, C. Lung cancer and exposure to metals: The epidemiological evidence. Cancer Epidemiol. 2009, 472, 139–167. [Google Scholar]
- Fontenot, A.P.; Amicosante, M. Metal-Induced Diffuse Lung Disease. Semin. Respir. Crit. Care Med. 2008, 29, 662–669. [Google Scholar] [CrossRef]
- Rehfisch, P.; Anderson, M.; Berg, P.; Lampa, E.; Nordling, Y.; Svartengren, M.; Westberg, H.; Gunnarsson, L.-G. Lung function and respiratory symptoms in hard metal workers exposed to cobalt. J. Occup. Environ. 2012, 54, 409–413. [Google Scholar] [CrossRef]
- Peixe, T.S.; de Souza Nascimento, E.; Schofield, K.L.; Arcuri, A.S.; Bulcão, R.P. Nanotoxicology and exposure in the occupational setting. Occup. Dis. Environ. Med. 2015, 3, 35–48. [Google Scholar] [CrossRef] [Green Version]
- Health Effects Institute. Understanding the health effects of ambient ultrafine particles. In HEI Review Panel on Ultrafine Particles; Health Effects Institute: Boston, MA, USA, 2013. [Google Scholar]
- Seipenbusch, M.; Binder, A.; Kasper, G. Temporal evolution of nanoparticle aerosols in workplace exposure. Ann. Occup. Hyg. 2008, 52, 707–716. [Google Scholar]
- BSI—British Standard Istitution. Guide to safe handling and disposal of manufactured nanomaterials. In Nanotechnologies; BSI—British Standard Istitution: London, UK, 2007; pp. 6699–6731. [Google Scholar]
- Lehnert, M.; Pesch, B.; Lotz, A.; Pelzer, J.; Kendzia, B.; Gawrych, K.; Heinze, E.; Van Gelder, R.; Punkenburg, E.; Weiss, T.; et al. Exposure to inhalable, respirable, and ultrafine particles in welding fume. Ann. Occup. Hyg. 2012, 56, 557–567. [Google Scholar] [PubMed] [Green Version]
- Andujar, P.; Simon-Deckers, A.; Galateau-Sallé, F.; Fayard, B.; Beaune, G.; Clin, B.; Billon-Galland, M.A.; Durupthy, O.; Pairon, J.C.; Doucet, J.; et al. Role of metal oxide nanoparticles in histopathological changes observed in the lung of welders. Part. Fibre Toxicol. 2014, 11, 1–13. [Google Scholar] [CrossRef] [PubMed] [Green Version]
- Heyder, J.; Gebhart, J.; Rudolph, G.; Schiller, C.F.; Stahlhofen, W. Deposition of particles in the human respiratory tract in the size range 0.005-15 microns. J. Aerosol Sci. 1986, 17, 811–825. [Google Scholar] [CrossRef]
- Heyder, J. Deposition of inhaled particles in the human respiratory tract and consequences for regional targeting in respiratory drug delivery. Proc. Am. Thorac. Soc. 2004, 1, 315–320. [Google Scholar] [CrossRef] [PubMed]
- Nel, A.; Xia, T.; Mädler, L.; Li, N. Toxic potential of materials at the nanolevel. Science 2006, 311, 622–627. [Google Scholar] [CrossRef] [Green Version]
- De Jong, W.H.; Borm, P.J. Drug delivery and nanoparticles: Applications and hazards. Int. J. Nanomed. 2008, 3, 133–149. [Google Scholar] [CrossRef] [Green Version]
- Terentyuk, G.; Akchurin, G.; Maksimova, I.; Shantrokha, A.; Tuchin, V.; Maslyakova, G.; Suleymanova, L.; Kogan, B.; Khlebtsov; Khlebtsov, B. Tracking gold nanoparticles in the body. J. Biomed. Opt. 2009, 14, 16–19. [Google Scholar] [CrossRef] [Green Version]
- Cheng, L.C.; Jiang, X.; Wang, J.; Chen, C.; Liu, R.S. Nano–bio effects: Interaction of nanomaterials with cells. Nanoscale 2013, 5, 3547–3569. [Google Scholar] [CrossRef]
- Sobot, D.; Mura, S.; Couvreur, P.; Kobayashi, S.; Müllen, K. Nanoparticles: Blood components interactions. In Encyclopedia of Polymeric Nanomaterials; Springer: Berlin/Heidelberg, Germany, 2014; pp. 1–10. [Google Scholar]
- Mc Carthy, D.J.; Malhotra, M.; O’Mahony, A.M.; Cyan, J.F.; O’Driscoll, C.M. Nanoparticles and the blood-brain barrier: Advancing from in-vitro models towards therapeutic significance. Pharm. Res. 2015, 32, 1161–1185. [Google Scholar] [CrossRef]
- Al-Sid-Cheikh, M.; Rowland, S.J.; Stevenson, K.; Rouleau, C.; Henry, T.B.; Thompson, R.C. Uptake, whole-body distribution, and depuration of nanoplastics by the scallop Pecten maximus at environmentally realistic concentrations. Environ. Sci. Technol. 2018, 52, 14480–14486. [Google Scholar] [CrossRef] [Green Version]
- Singh, S.; Nalwa, H.S. Nanotechnology and health safety–toxicity and risk assessments of nanostructured materials on human health. J. Nanosci. Nanotechnol. 2007, 7, 3048–3070. [Google Scholar] [CrossRef]
- Oberdörster, G.; Ferin, J.; Gelein, R.; Soderholm, S.C.; Finkelstein, J. Role of the alveolar macrophage in lung injury: Studies with ultrafine particles. Environ. Health Perspect. 1992, 97, 193–199. [Google Scholar]
- ACGIH. TLVs® and BEIs®; Signature Publications: Salt Lake City, UT, USA, 2018. [Google Scholar]
- Ellenbecker, M.; Tsai, S.J.; Jacobs, M.; Riediker, M.; Peters, T.; Liou, S.; Avila, A.; FossHansen, S. The difficulties in establishing an occupational exposure limit for carbon nanotubes. J. Nanopart. Res. 2018, 20, 1–12. [Google Scholar] [CrossRef]
- Ljunggren, S.A.; Karlsson, H.; Ståhlbom, B.; Krapi, B.; Fornander, L.; Karlsson, L.E. Biomonitoring of metal exposure during additive manufacturing (3D printing). Saf. Health Work 2019, 10, 518–526. [Google Scholar] [CrossRef]
- Van Broekhuizen, P.; Van Veelen, W.I.M.; Streekstra, W.H.; Schulte, P.; Reijnders, L. Exposure limits for nanoparticles: Report of an international workshop on nano reference values. Ann. Occup. Hyg. 2012, 56, 515–524. [Google Scholar]
- IFA. Criteria for Assessment of the Effectiveness of Protective Measures. Available online: https://www.dguv.de/ifa/fachinfos/nanopartikel-am-arbeitsplatz/beurteilung-von-schutzmassnahmen/index-2.jsp (accessed on 10 September 2021).
- Grieger, K.D.; Baun, A.; Owen, R. Redefining risk research priorities for nanomaterials. J. Nanopart. Res. 2010, 12, 383–392. [Google Scholar] [CrossRef] [PubMed] [Green Version]
- Arvidsson, R.; Furberg, A.; Molander, S. Review of Screening Risk Assessment Methods for Nanomaterials; Chalmers Univ. Technol.: Gothenburg, Sweden, 2016. [Google Scholar]
- Brereton, S.; Alenbach, T. Risk ranking methodology for chemical release events. In Proceedings of the International Conference on Probabilistic Safety Assessment and Management, New York, NY, USA, 13–18 September 1998. [Google Scholar]
- Shin, S.; Moon, H.I.; Lee, K.S.; Hong, M.K.; Byeon, S.H. A chemical risk ranking and scoring method for the selection of harmful substances to be specially controlled in occupational environments. Int. J. Environ. Res. Public Health 2014, 11, 12001–12014. [Google Scholar] [CrossRef] [Green Version]
- Brouwer, D.H. Control banding approaches for nanomaterials. Ann. Occup. Hyg. 2012, 56, 506–514. [Google Scholar] [PubMed] [Green Version]
- Hansen, S.F.; Nielsen, K.N.; Knudsen, N.; Grieger, K.D.; Baun, A. Operationalization and application of “early warning signs” to screen nanomaterials for harmful properties. Environ. Sci. Process. Impacts 2013, 15, 190–203. [Google Scholar] [CrossRef] [PubMed] [Green Version]
- Zalk, D.M.; Paik, S.Y.; Chase, W.D. A quantitative validation of the control banding nanotool. Ann. Work Expo. Health 2019, 63, 898–917. [Google Scholar] [CrossRef] [PubMed]
- Pasman, H.; Reniers, G. Past, present and future of Quantitative Risk Assessment (QRA) and the incentive it obtained from Land-Use Planning (LUP). J. Loss Prev. Process Ind. 2014, 28, 2–9. [Google Scholar] [CrossRef]
- Paltrinieri, N.; Comfort, L.; Reniers, G. Learning about risk: Machine learning for risk assessment. Saf. Sci. 2019, 118, 475–486. [Google Scholar] [CrossRef]
- Di Bona, G.; Falcone, D.; Forcina, A.; Silvestri, L. Systematic human reliability analysis (SHRA): A new approach to evaluate human error probability (HEP) in a nuclear plant. Int. J. Math. Eng. Manag. Sci. 2021, 6, 345–362. [Google Scholar] [CrossRef]
- Di Bona, G.; Falcone, D.; Forcina, A.; De Carlo, F.; Silvestri, L. Quality Checks Logit Human Reliability (LHR): A New Model to Evaluate Human Error Probability (HEP). Math. Probl. Eng. 2021, 2021, 12. [Google Scholar] [CrossRef]
- Beisser, R.; von Mering, Y.; Pitzke, K.; Buxtrup, M.; Fendler, D.; Hohenberger, L.; Fendler, D.; Kazda, V.; Niemann, H.; Weiß, R. Inhalation exposure to metals during additive processes (3D printing). Gefahrst. Reinhalt. Luft 2017, 77, 487–496. [Google Scholar]
- Graff, P.; Ståhlbom, B.; Nordenberg, E.; Graichen, A.; Johansson, P.; Karlsson, H. Evaluating measuring techniques for occupational exposure during additive manufacturing of metals: A pilot study. J. Ind. Ecol. 2017, 21, S120–S129. [Google Scholar] [CrossRef] [Green Version]
- Lewinski, N.A.; Secondo, L.E.; Ferri, J.K. On-site three-dimensional printer aerosol hazard assessment: Pilot study of a portable in vitro exposure cassette. Process Saf. Prog. 2019, 38, e12030. [Google Scholar] [CrossRef]
- Sousa, M.; Arezes, P.; Silva, F. Occupational Exposure to Ultrafine Particles in Metal Additive Manufacturing: A Qualitative and Quantitative Risk Assessment. Int. J. Environ. Res. Public Health 2021, 18, 9788. [Google Scholar] [CrossRef]
- Paik, S.Y.; Zalk, D.M.; Swuste, P. Application of a pilot control banding tool for risk level assessment and control of nanoparticle exposures. Ann. Occup. Hyg. 2008, 52, 419–428. [Google Scholar]
- Kaierle, S.; Gieseke, M.; Hustedt, M.; Nölke, C.; Walter, J. Safety First–Current Status of Occupational Safety in Additive Manufacturing. In Proceedings of the 14th Rapid. Tech Conference, Erfurt, Germany, 20–22 June 2017. [Google Scholar]
- Walter, J.; Baumgärtel, A.; Hustedt, M.; Hebisch, R.; Kaierle, S. Inhalation exposure to hazardous substances during powder-bed processes. Procedia CIRP 2018, 74, 295–299. [Google Scholar] [CrossRef]
- Pacenti, M.; Lofrumento, C.; Dugheri, S.; Zoppi, A.; Borsi, I.; Speranza, A.; Cupelli, V. Physicochemical characterization of exhaust particulates from gasoline and diesel engines by solid-phase micro extraction sampling and combined raman microspectroscopic/fast gas-chromotography mass spectrometry analysis. Eur. J. Inflamm. 2009, 7, 25–37. [Google Scholar] [CrossRef]
- Dugheri, S.; Mucci, N.; Cappelli, G.; Bonari, A.; Trevisani, L.; Arcangeli, G. Dealing with chemical risks from ancient times to the 21st century: A review of air sampling and analysis techniques. S. Afr. J. Chem. 2020, 73, 143–156. [Google Scholar]
- Dunn, K.L.; Dunn, K.H.; Hammond, D.; Lo, S. Three-dimensional printer emissions and employee exposures to ultrafine particles during the printing of thermoplastic filaments containing carbon nanotubes or carbon nanofibers. J. Nanopart. Res. 2020, 22, 1–13. [Google Scholar] [CrossRef]
- Oberdörster, G.; Oberdörster, E.; Oberdörster, J. Nanotoxicology: An emerging discipline evolving from studies of ultrafine particles. Environ. Health Perspect. 2005, 113, 823–839. [Google Scholar] [CrossRef] [PubMed]
- Geiss, O.; Bianchi, I.; Barrero-Moreno, J. Lung-deposited surface area concentration measurements in selected occupational and non-occupational environments. J. Aerosol Sci. 2016, 96, 24–37. [Google Scholar] [CrossRef]
- Kuuluvainen, H.; Rönkkö, T.; Järvinen, A.; Saari, S.; Karjalainen, P.; Lähde, T.; Pirjola, L.; Niemi, J.V.; Hillamo, R.; Keskinen, J. Lung deposited surface area size distributions of particulate matter in different urban areas. Atmos. Environ. 2016, 136, 105–113. [Google Scholar] [CrossRef] [Green Version]
- Fierz, M.; Houle, C.; Steigmeier, P.; Burtscher, H. Design, Calibration, and Field Performance of a Miniature Diffusion Size Classifier. Aerosol Sci. Technol. 2011, 45, 1–10. [Google Scholar] [CrossRef]
- Oberbek, P.; Kozikowski, P.; Czarnecka, K.; Sobiech, P.; Jakubiak, S.; Jankowski, T. Inhalation exposure to various nanoparticles in work environment—contextual information and results of measurements. J. Nanopart. Res. 2019, 21, 1–24. [Google Scholar] [CrossRef] [Green Version]
- Mark, D. Occupational exposure to nanoparticles and nanotubes. In Nanotechnology: Consequences for human health and the environment. Issues Environ. Sci. Technol. 2007, 11, 50–80. [Google Scholar]
- Maynard, A.D.; Aitken, R.J. Assessing exposure to airborne nanomaterials: Current abilities and future requirements. Nanotoxicology 2007, 1, 26–41. [Google Scholar] [CrossRef]
- Branche, C.M.; Schulte, P.; Geraci, C. Approaches to Safe Nanotechnology: Managing the Health and Safety Concerns Associated with Engineered Nanomaterials. 2009. Available online: https://www.cdc.gov/niosh/docs/2009-125/pdfs/2009-125.pdf?id=10.26616/NIOSHPUB2009125 (accessed on 8 September 2021).
- Mullins, M.; Murphy, F.; Baublyte, L.; McAlea, E.M.; Tofail, S.A. The insurability of nanomaterial production risk. Nat. Nanotechnol. 2013, 8, 222–224. [Google Scholar] [CrossRef] [PubMed]
- ISO/TS 12901-2:2014; Nanotechnologies—Occupational Risk Management Applied to Engineered Nanomaterials—Part 2: Use of the Control Banding Approach. ISO: Geneva, Switzerland, 2014. Available online: https://www.iso.org/standard/53375.html (accessed on 8 September 2021).
- Subramanian, V.; Semenzin, E.; Hristozov, D.; Zondervan-van den Beuken, E.; Linkov, I.; Marcomini, A. Review of decision analytic tools for sustainable nanotechnology. Environ. Syst. Decis. 2015, 35, 29–41. [Google Scholar] [CrossRef]
- Jensen, K.A.; Saber, A.T.; Kristensen, H.V.; Koponen, I.K.; Liguori, B.; Wallin, H. NanoSafer vs. 1.1-nanomaterial risk assessment using first order modeling. In Proceedings of the 6th International Symposium on Nanotechnology, Occupational and Environmental Health, Nottingham, UK, 23–25 October 2013. [Google Scholar]
- Bouillard, J.X.; Vignes, A. Nano-Evaluris: An inhalation and explosion risk evaluation method for nanoparticle use. Part I: Description of the methodology. J. Nanopart. Res. 2014, 16, 1–29. [Google Scholar] [CrossRef] [Green Version]
- Ostiguy, C.; Riediker, M.; Triolet, J.; Troisfontaines, P.; Vernez, D. Development of a Specific Control Banding Dool for Nanomaterials; ANSES: Afsset, Maisons-Alfort, France, 2010. [Google Scholar]
- American Makes; ANSI AMSC. Standardization Roadmap for Additive Manufacturing Version 2.0. 2018. Available online: www.ansi.org/standards_activities/standards_boards_panels/a (accessed on 15 September 2021).
- Balakrishnan, V.N. Safety Management in Metal Additive Manufacturing: Observations from Industry, 2019. Metal AM. Available online: https://www.metal-am.com/wp-content/uploads/sites/4/2019/03/MAM-Spring-2019-sp.pdf (accessed on 15 September 2021).
- FDA. Technical Considerations for Additive Manufactured Medical Devices, 2017; FDA: Silver Spring, MD, USA, 2017. Available online: www.fda.gov/downloads/MedicalDevices/DeviceRegulationandGuidance/Guidance-Documents/UCM499809.pdf (accessed on 18 September 2021).
- NASA. Standard for Additively Manufactured Spaceflight Hardware by Laser Powder Bed Fusion in Metals; Office of the NASA Chief Engineer: Washington, DC, USA, 2017. Available online: https://standards.nasa.gov/standard/msfc/msfc-std-3716 (accessed on 18 September 2021).
- VDI, the Association of German Engineers. Additive Manufacturing Processes—Powder Bed Fusion of Metal with Laser Beam (PBF-LB/M)—Material Data Sheet Aluminium Alloy AlSi10Mg; VDI: Düsseldorf, Germany, 2020; Available online: https://www.vdi.de/richtlinien/details/vdi-3405-blatt-21-additive-manufacturing-processes-powder-bed-fusion-of-metal-with-laser-beam-pbf-lbm-material-data-sheet-aluminium-alloy-alsi10mg (accessed on 18 September 2021).
- Mattiuzzo, C. 3D Printing: Opportunities and Risks. KAN, Kommission Arbeitsschutz und Normung. Available online: https://www.kan.de/en/publications/kanbrief/new-technologies/3d-printing-opportunities-and-risks (accessed on 19 September 2021).


| Probability | |||||
|---|---|---|---|---|---|
| Extremely Unlikely (0–25) | Less Likely (26–50) | Likely (51–75) | Probable (76–100) | ||
| Severity | Very high (76–100) | RL3 | RL3 | RL4 | RL4 |
| High (51–75) | RL2 | RL2 | RL3 | RL4 | |
| Medium (26–50) | RL1 | RL1 | RL2 | RL3 | |
| Low (0–25) | RL1 | RL1 | RL1 | RL2 | |
| Occupational Exposure Limits (OELs) | |||||
|---|---|---|---|---|---|
| <10 µg/m3 | 10–100 µg/m3 | 101–1000 µg/m3 | >1000 µg/m3 | Unknown | |
| Points | 10 | 5 | 2.5 | 0 | 7.5 |
| Carcinogenicity | |||||
| Yes | No | Unknown | |||
| Points | 4 | 0 | 3 | ||
| Reproductive Toxicity | |||||
| Yes | No | Unknown | |||
| Points | 4 | 0 | 3 | ||
| Mutagenicity | |||||
| Yes | No | Unknown | |||
| Points | 4 | 0 | 3 | ||
| Dermal Toxicity | |||||
| Yes | No | Unknown | |||
| Points | 4 | 0 | 3 | ||
| Asthmagen | |||||
| Yes | No | Unknown | |||
| Points | 4 | 0 | 3 | ||
| Surface Chemistry | ||||
|---|---|---|---|---|
| High | Medium | Low | Unknown | |
| Points | 10 | 5 | 0 | 7.5 |
| Particle Shape | ||||
| Tubular/Fibrous | Anisotropic | Compact/Spherical | Unknown | |
| Points | 10 | 5 | 0 | 7.5 |
| Particle Diameter | ||||
| 1–10 nm | 11–40 nm | >40 nm | Unknown | |
| Points | 10 | 5 | 0 | 7.5 |
| Solubility | ||||
| Insoluble | Soluble | Unknown | ||
| Points | 10 | 5 | 7.5 | |
| Carcinogenicity | ||||
| Yes | No | Unknown | ||
| Points | 6 | 0 | 4.5 | |
| Reproductive Toxicity | ||||
| Yes | No | Unknown | ||
| Points | 6 | 0 | 4.5 | |
| Mutagenicity | ||||
| Yes | No | Unknown | ||
| Points | 6 | 0 | 4.5 | |
| Dermal Toxicity | ||||
| Yes | No | Unknown | ||
| Points | 6 | 0 | 4.5 | |
| Asthmagen | ||||
| Yes | No | Unknown | ||
| Points | 6 | 0 | 4.5 | |
| Estimated Amount of Material Used | |||||
|---|---|---|---|---|---|
| >100 mg | 11–100 mg | 0–10 mg | Unknown | ||
| Points | 25 | 12.5 | 6.25 | 18.75 | |
| Dustiness/Mistiness | |||||
| High | Medium | Low | Unknown | ||
| Points | 30 | 15 | 7.5 | 22.5 | |
| Numbers of Employees with Similar Exposure | |||||
| >15 | 11–15 | 6–10 | 1–5 | Unknown | |
| Points | 15 | 10 | 5 | 0 | 11.25 |
| Frequency of Operation | |||||
| Daily | Weekly | Monthly | >Monthly | Unknown | |
| 15 | 10 | 5 | 0 | 11.25 | |
| Duration of Operation | |||||
| >4 h | 1–4 h | 30–60 min | <30 min | Unknown | |
| 15 | 10 | 5 | 0 | 11.25 | |
| N. Samples | Time (min) | Mean. Volume IOM (L) | Inhalable Dust Concentration (mg/m3) | Mean. Volume Higgins (L) | Respirable Dust Concentration (mg/m3) | ||||
|---|---|---|---|---|---|---|---|---|---|
| Min. | Max. | Mean (s.d.) | Min. | Max. | Mean (s.d.) | ||||
| 12 | 349 | 698 | 0.016 | 1.390 | 0.363 (0.453) | 767.75 | 0.015 | 0.963 | 0.145 (0.273) |
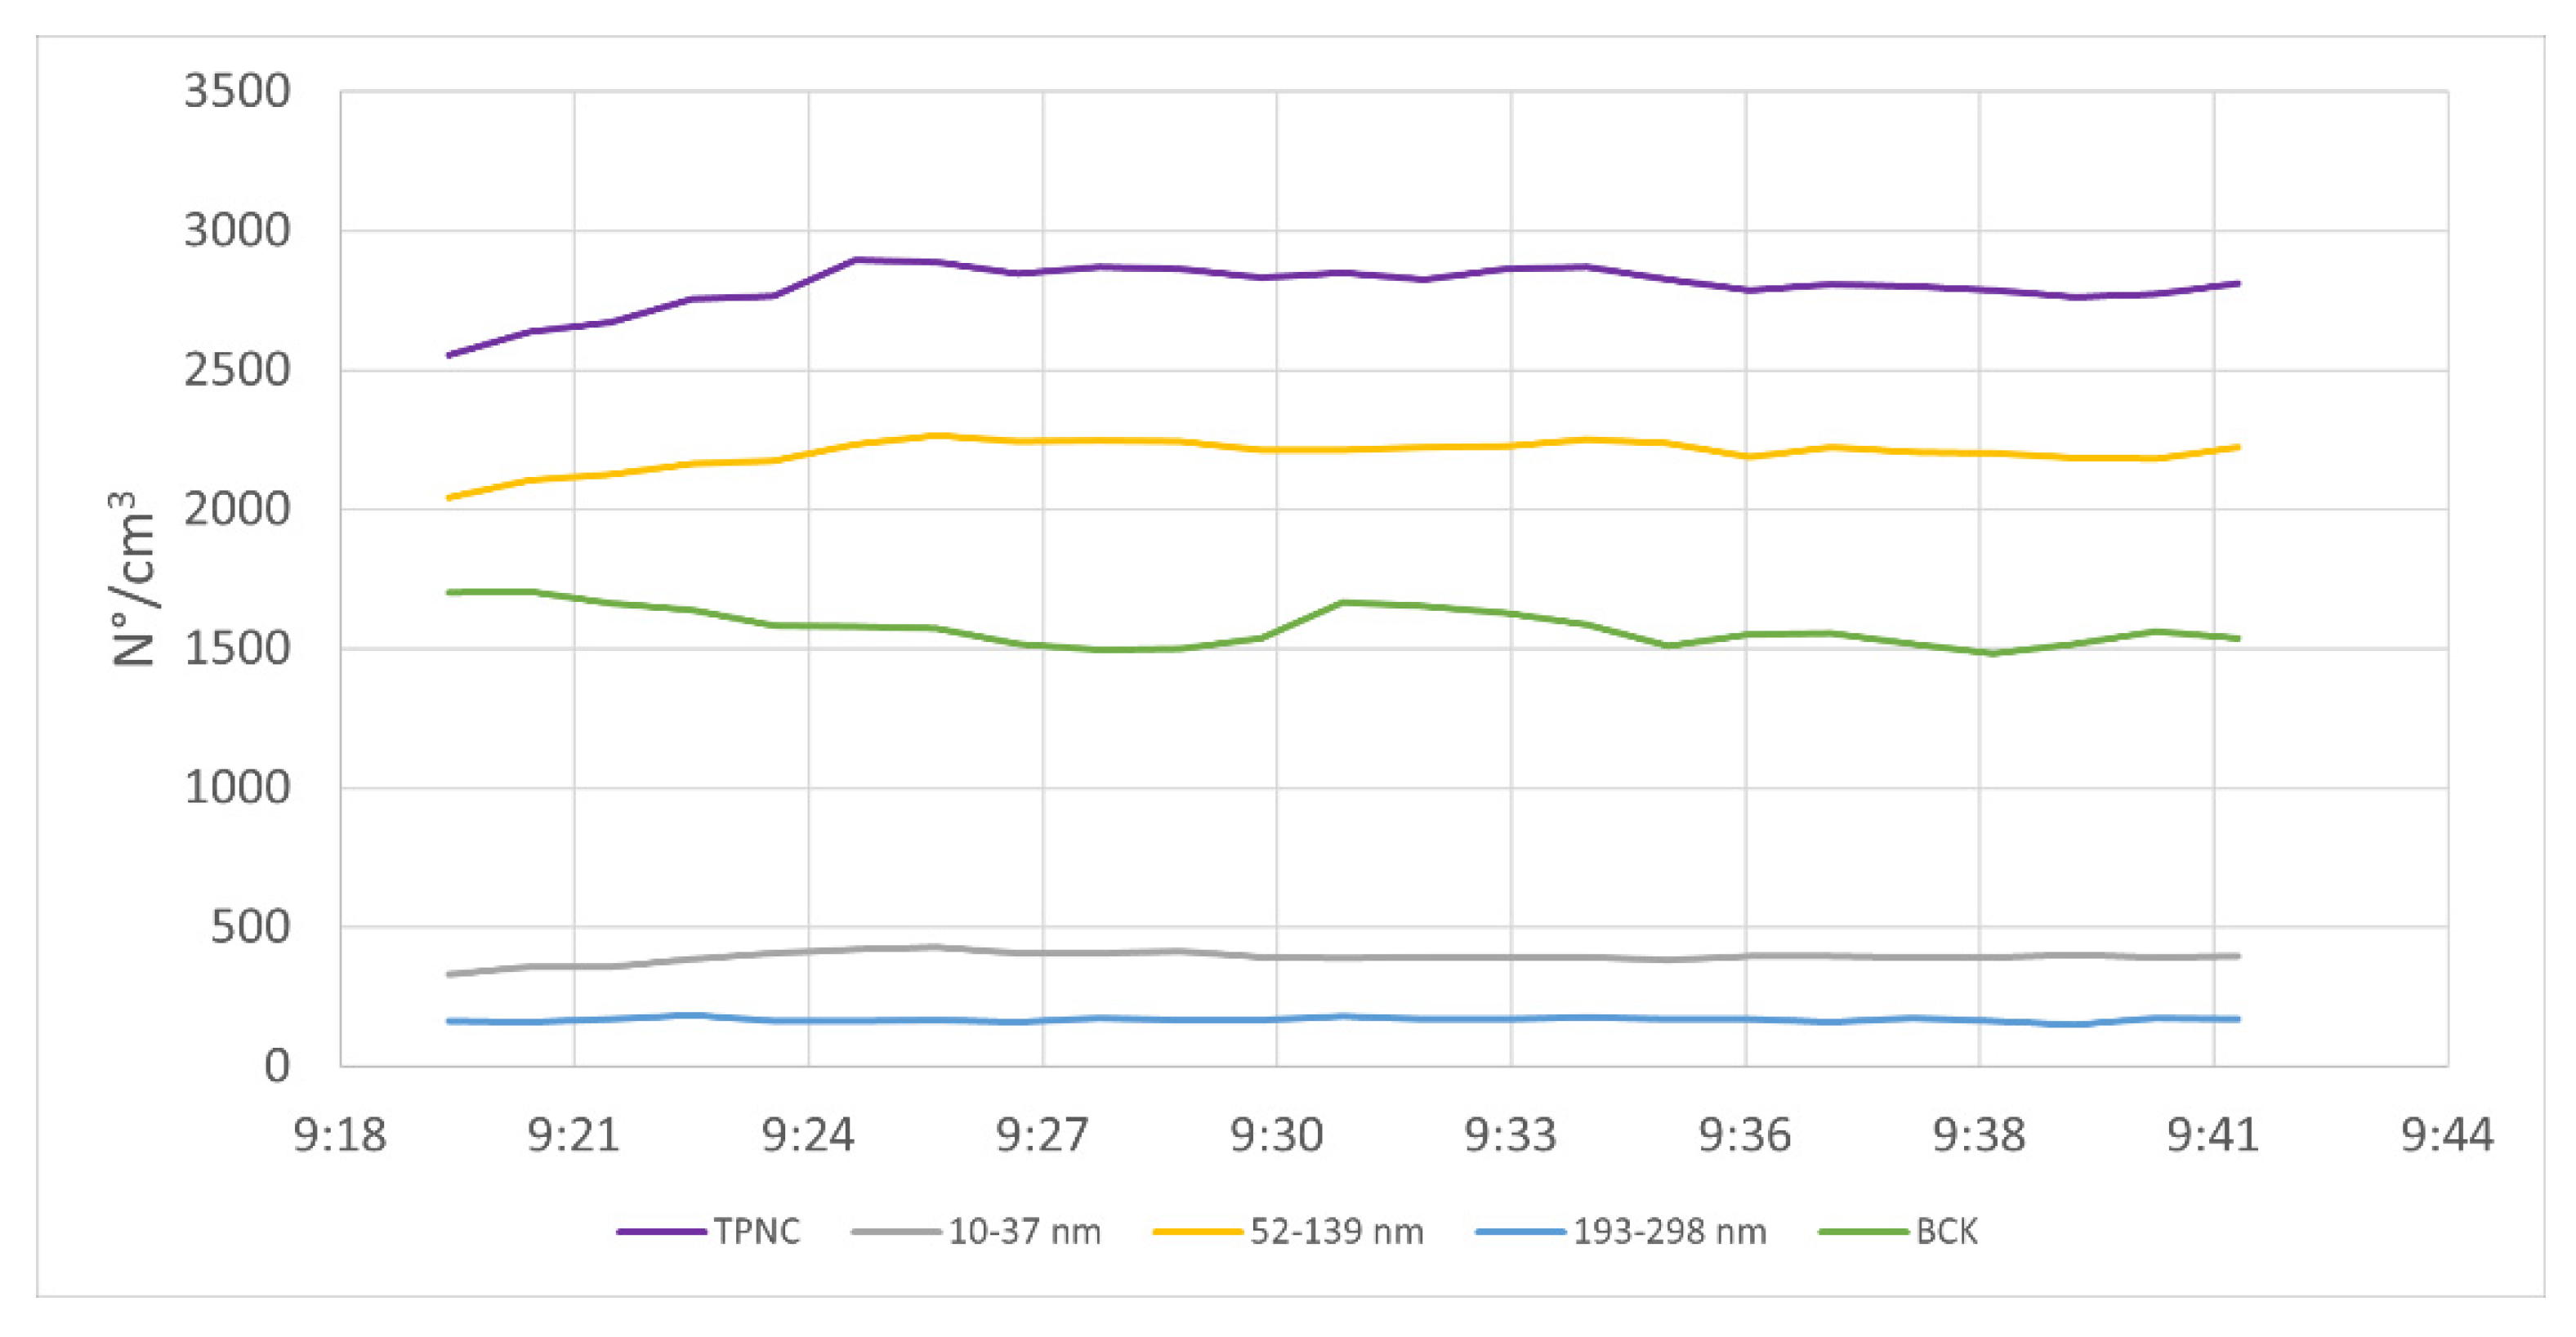
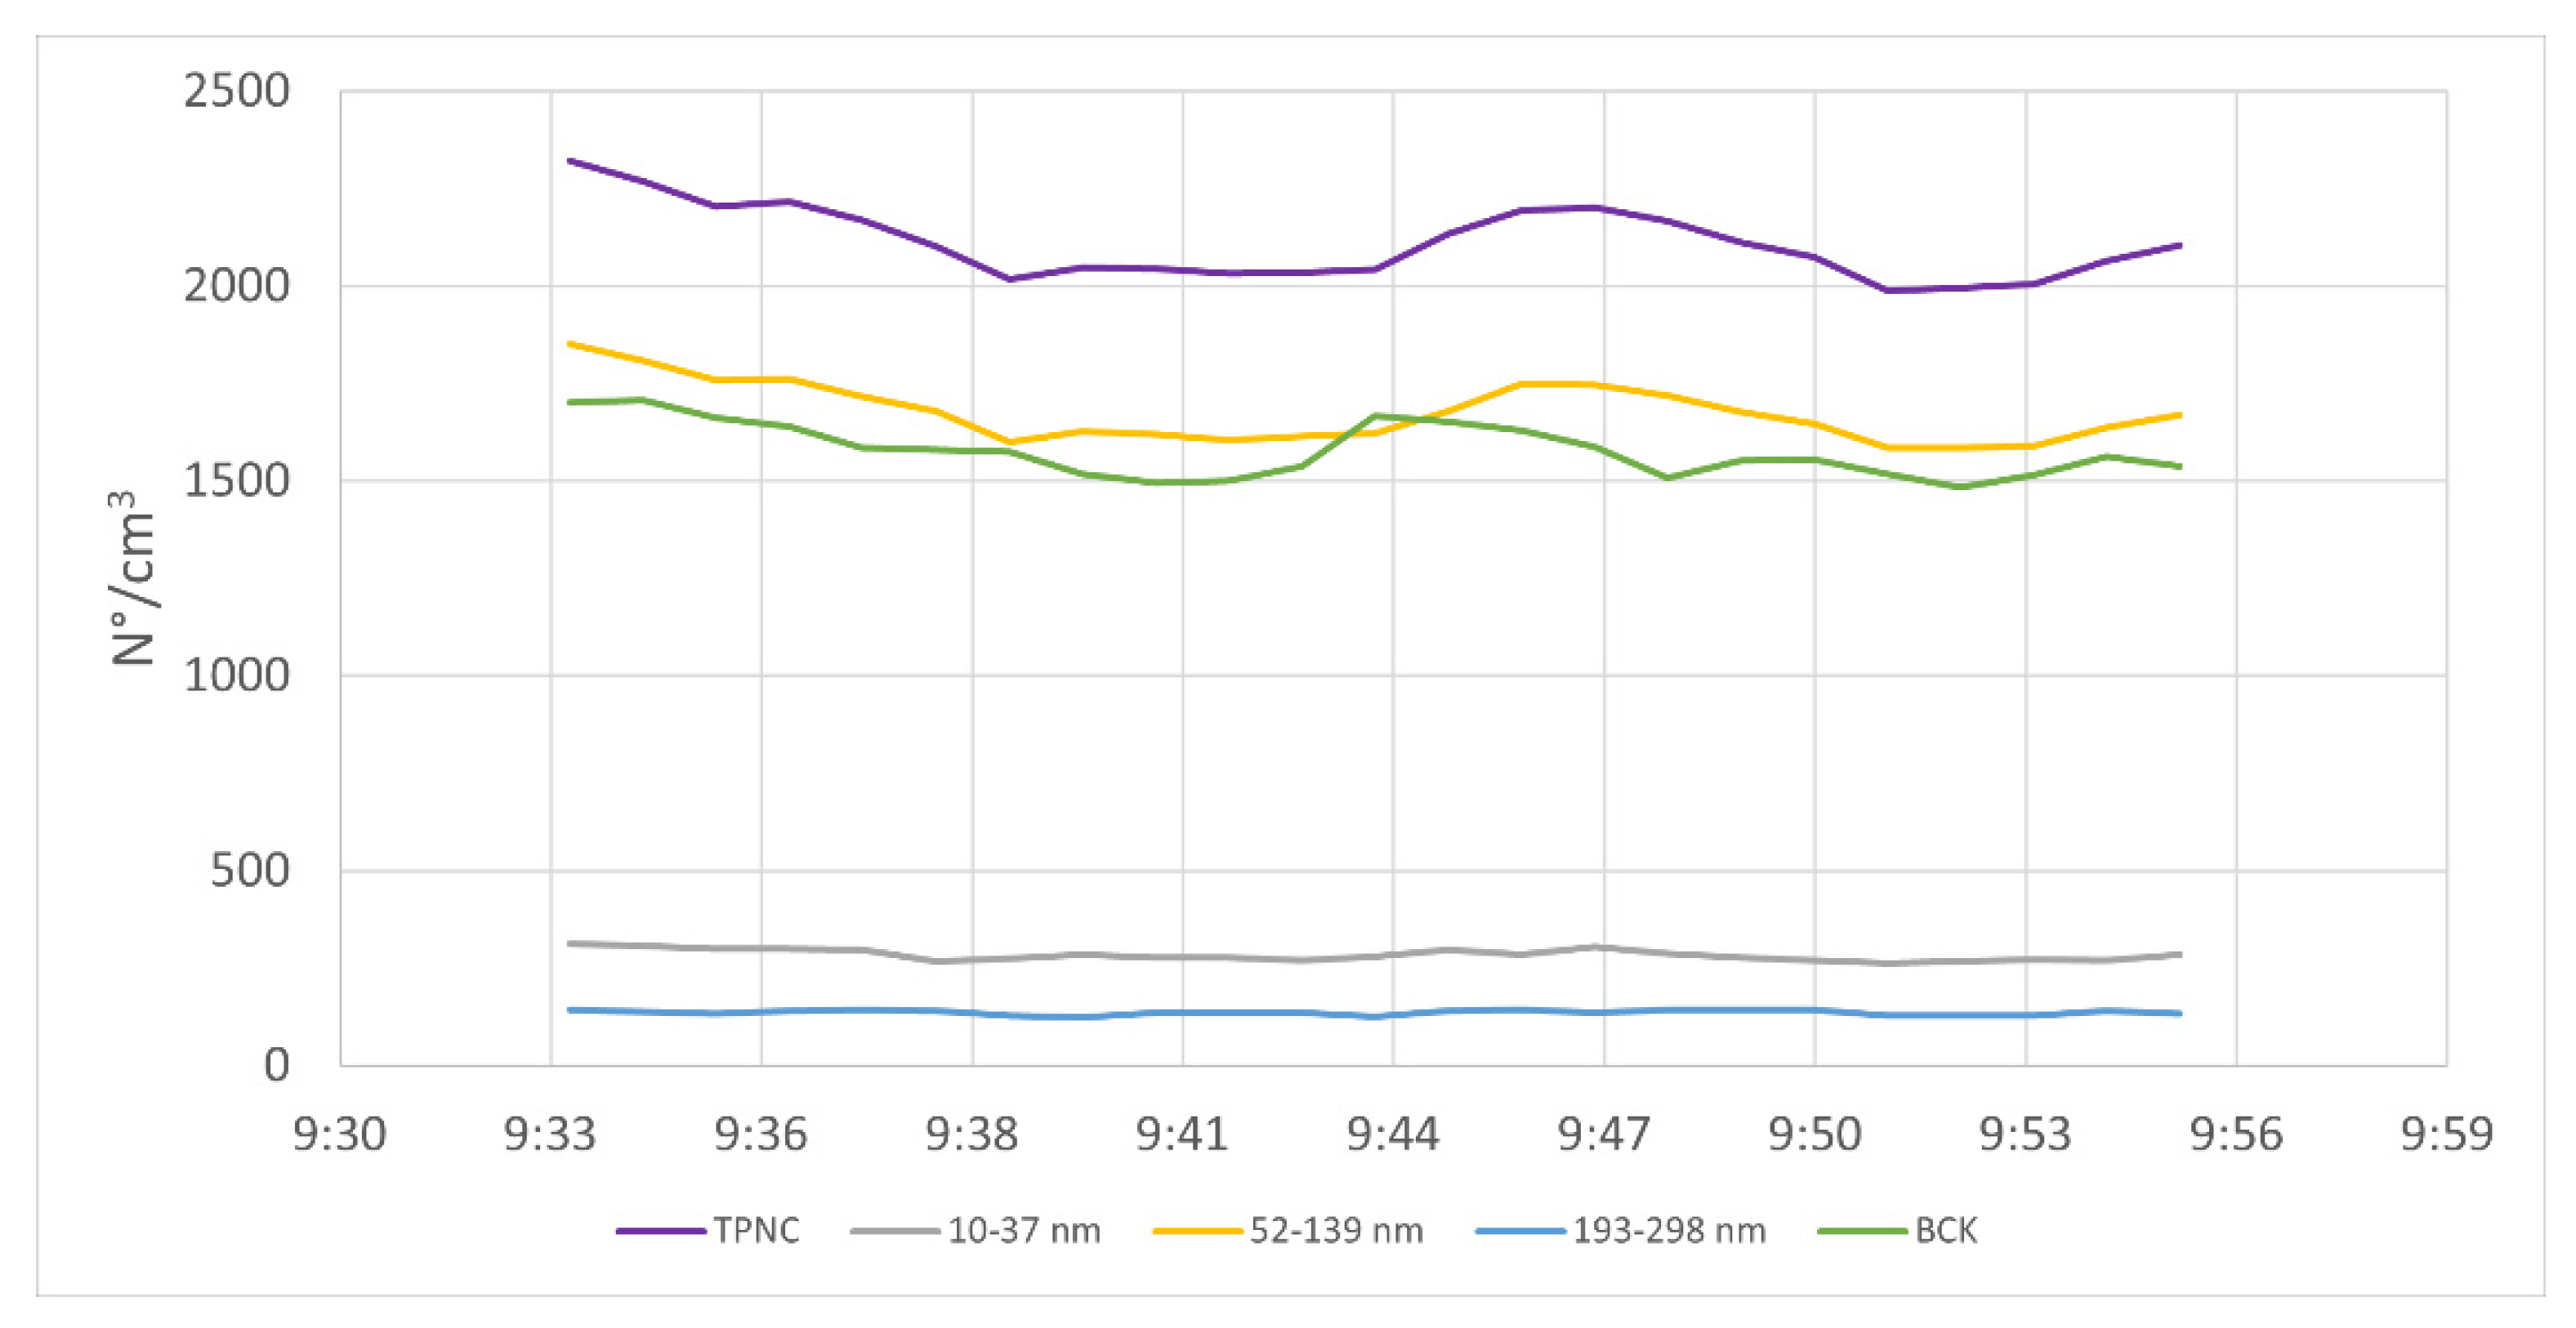
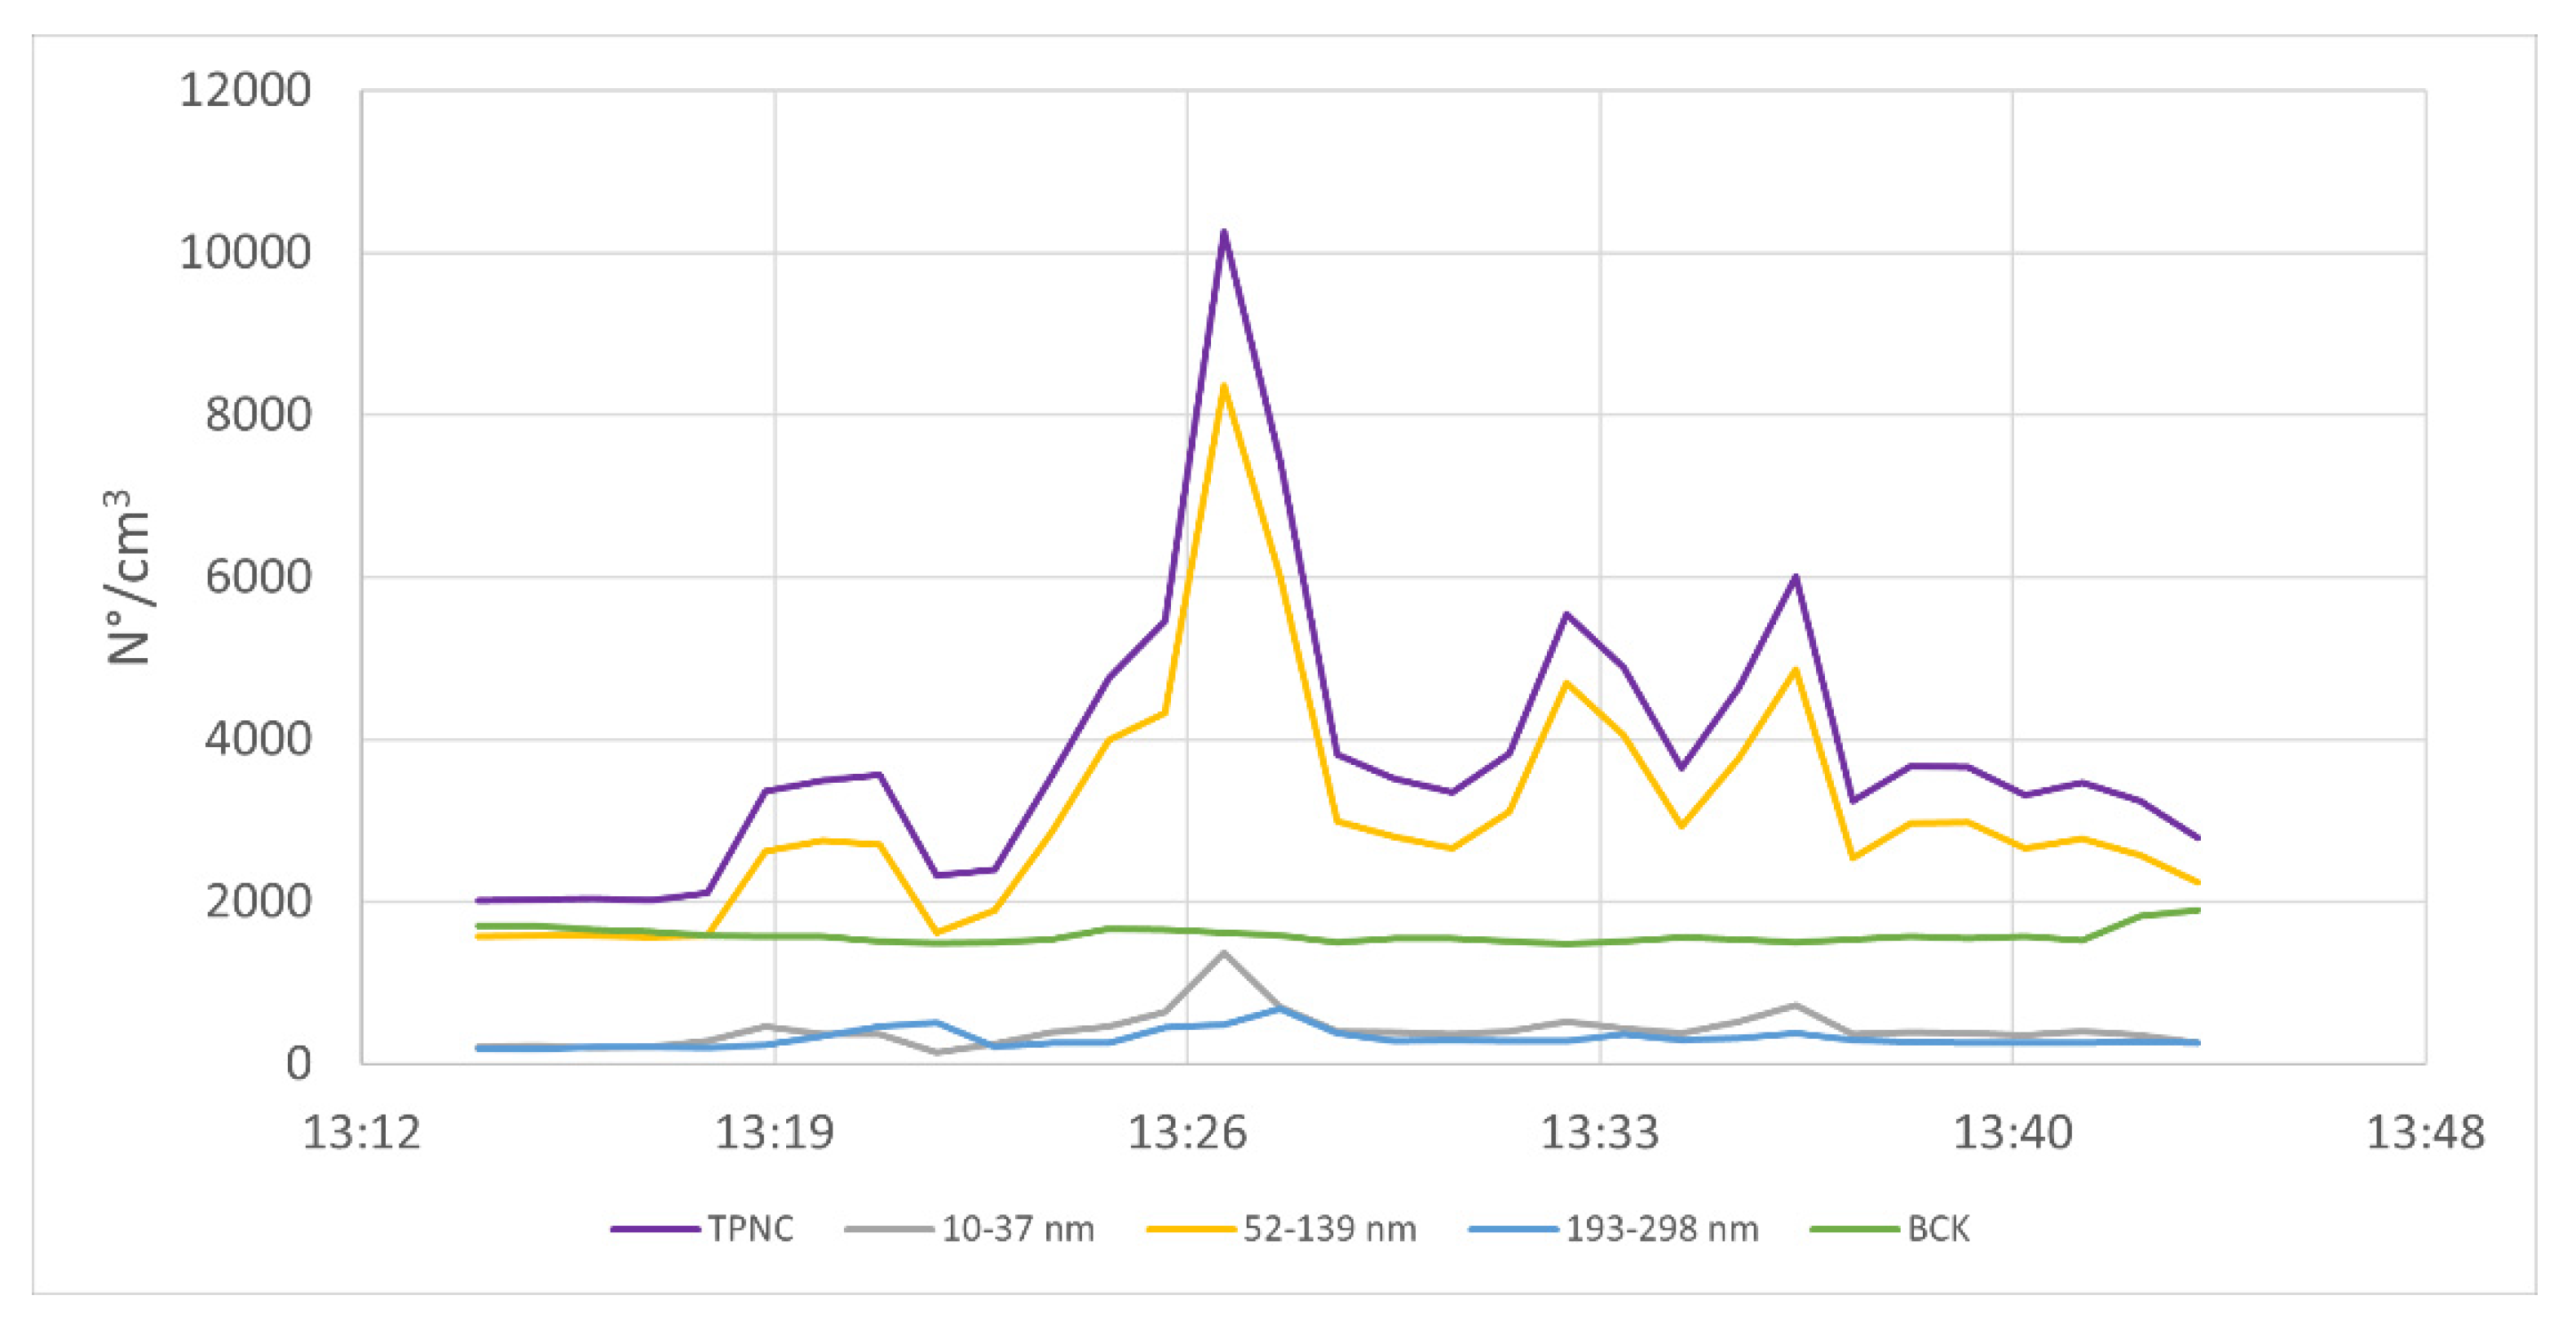
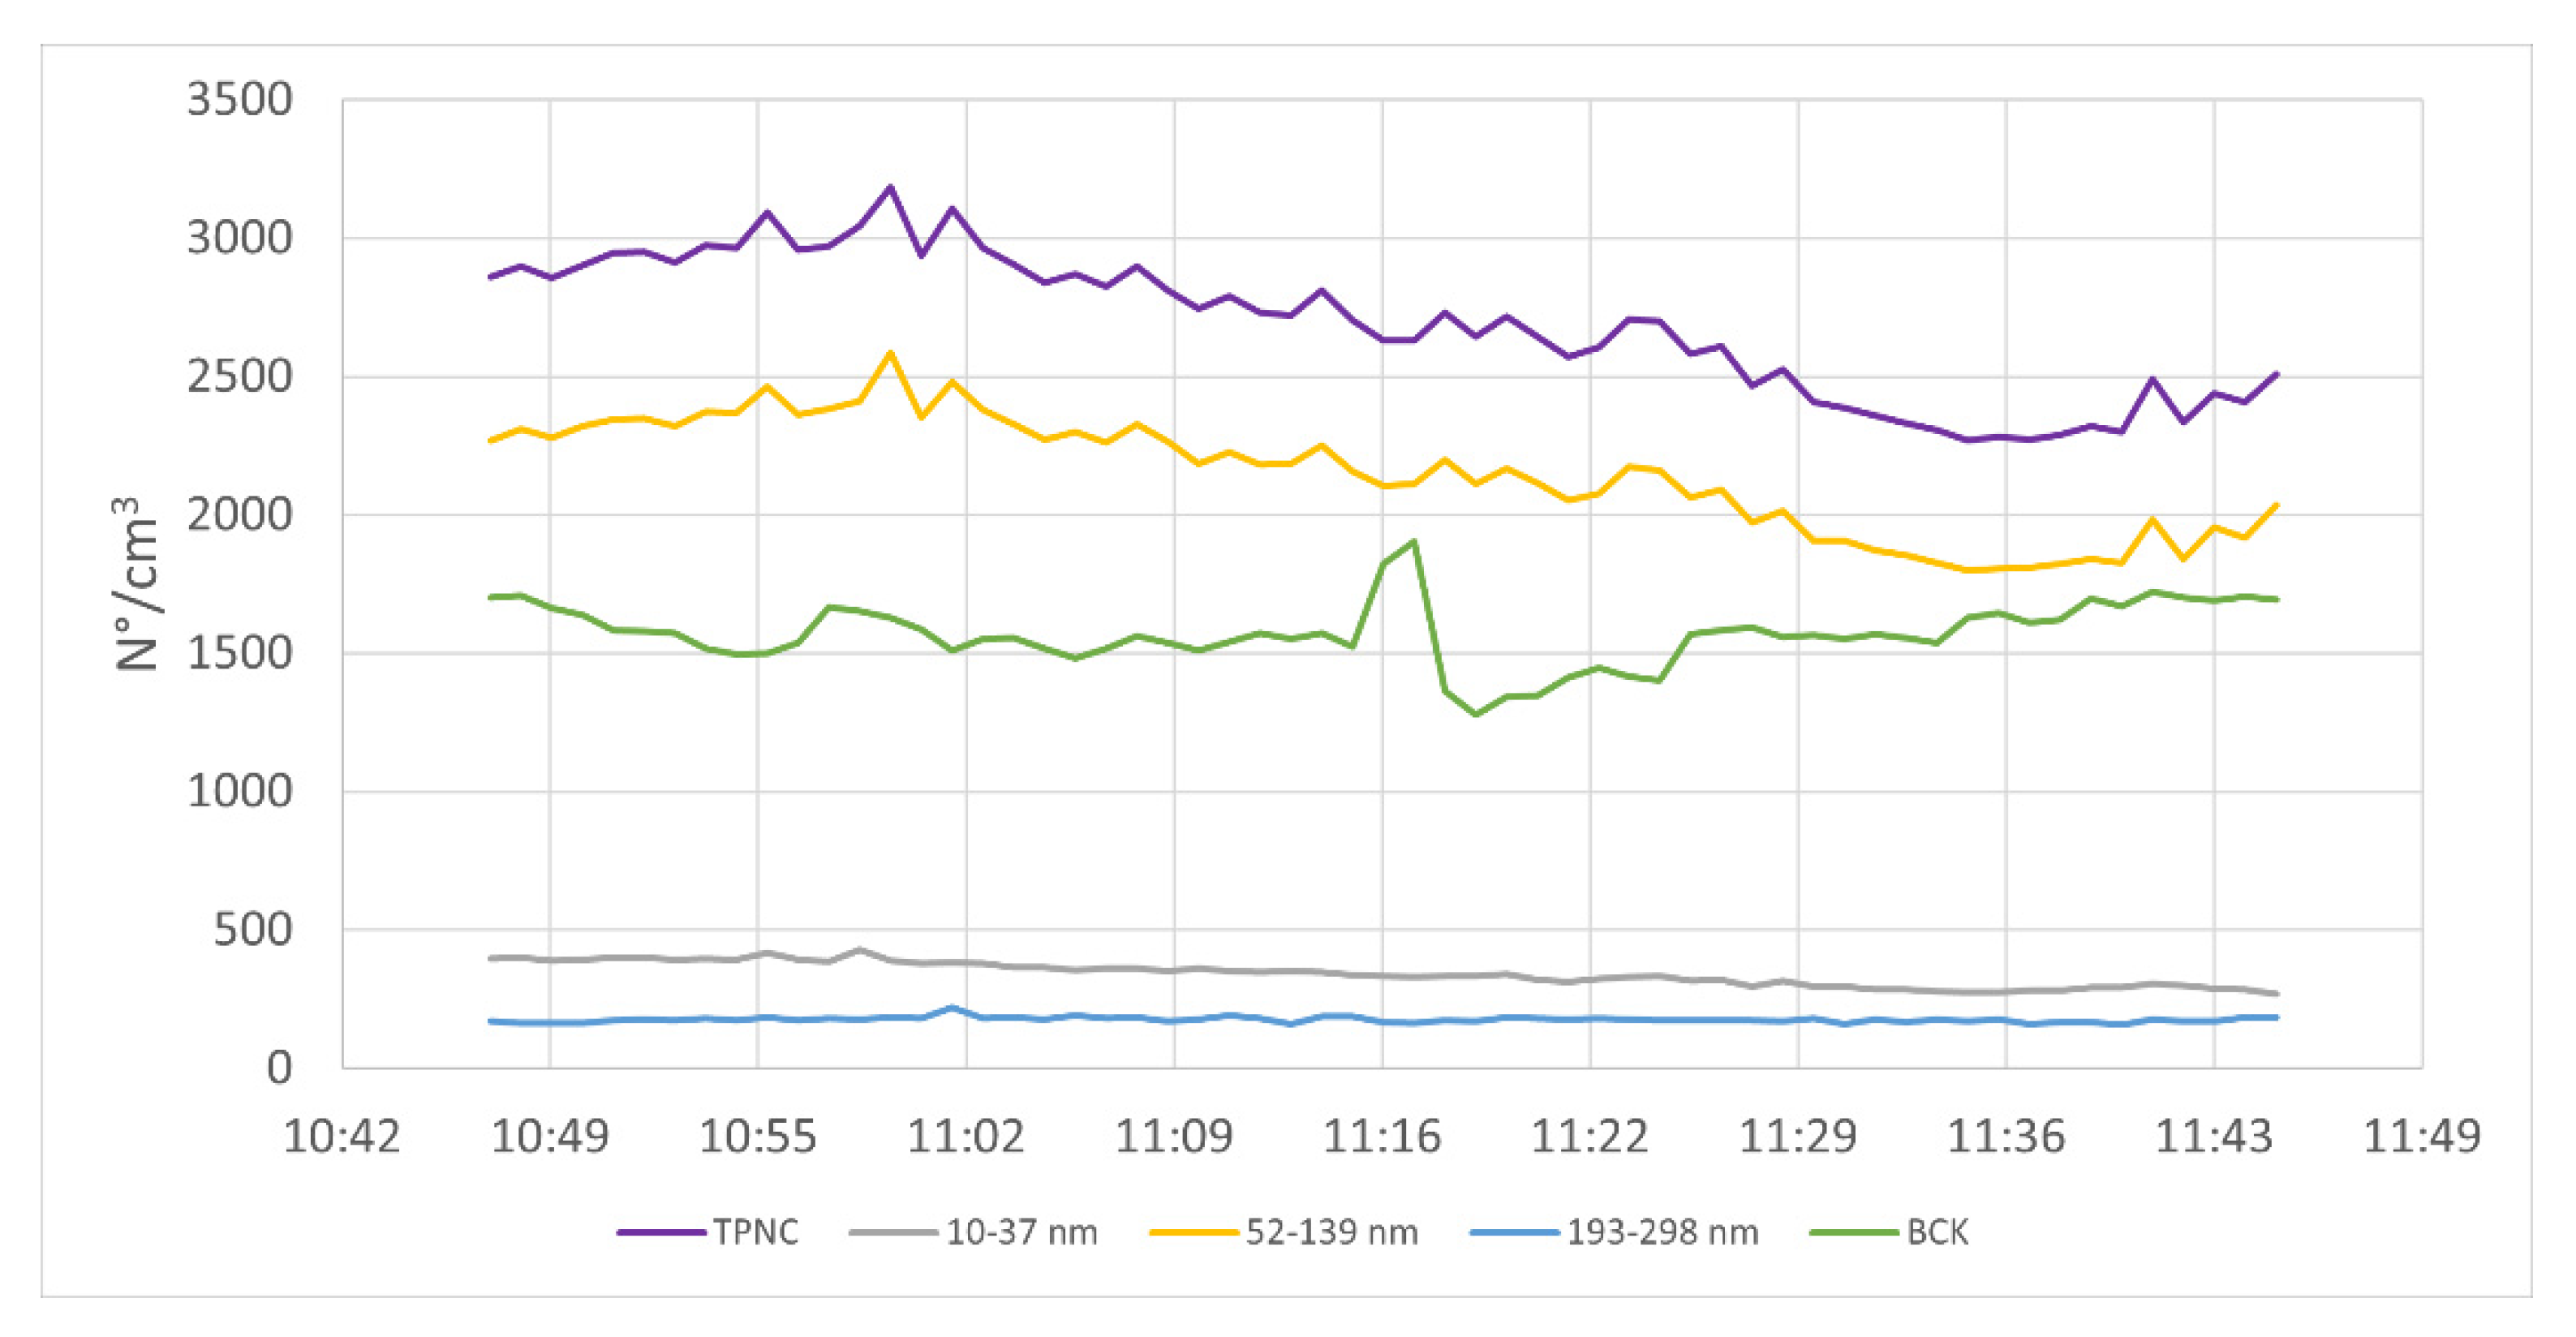
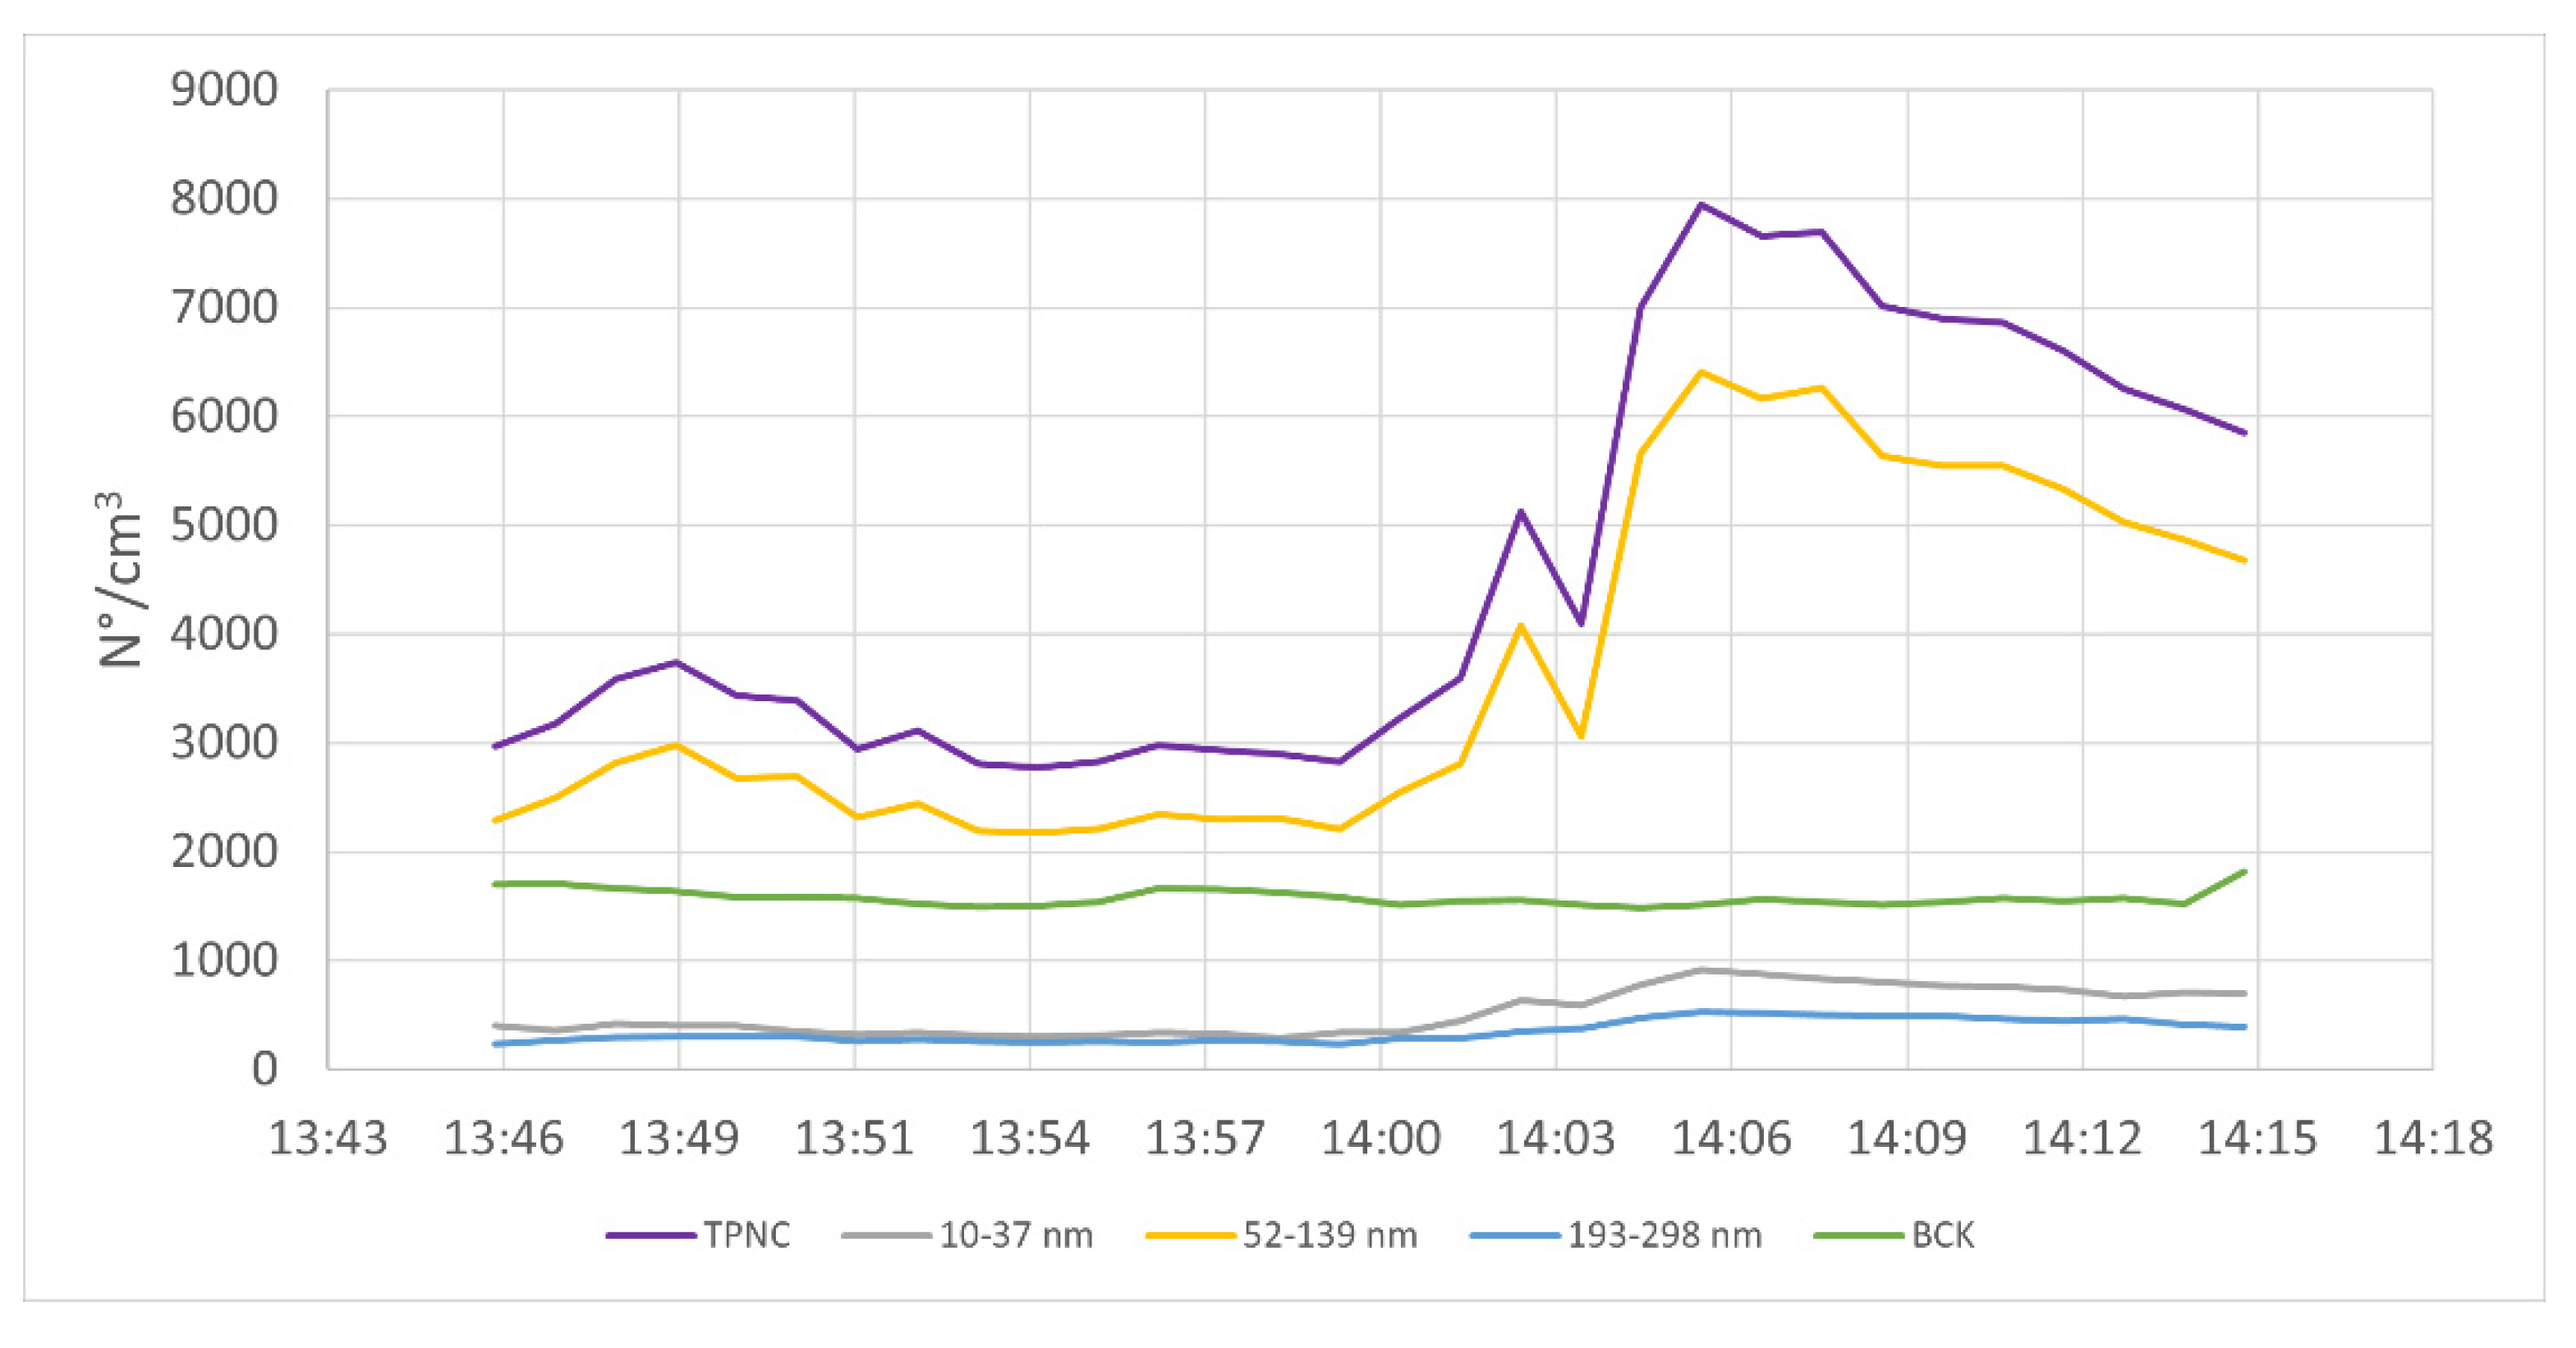
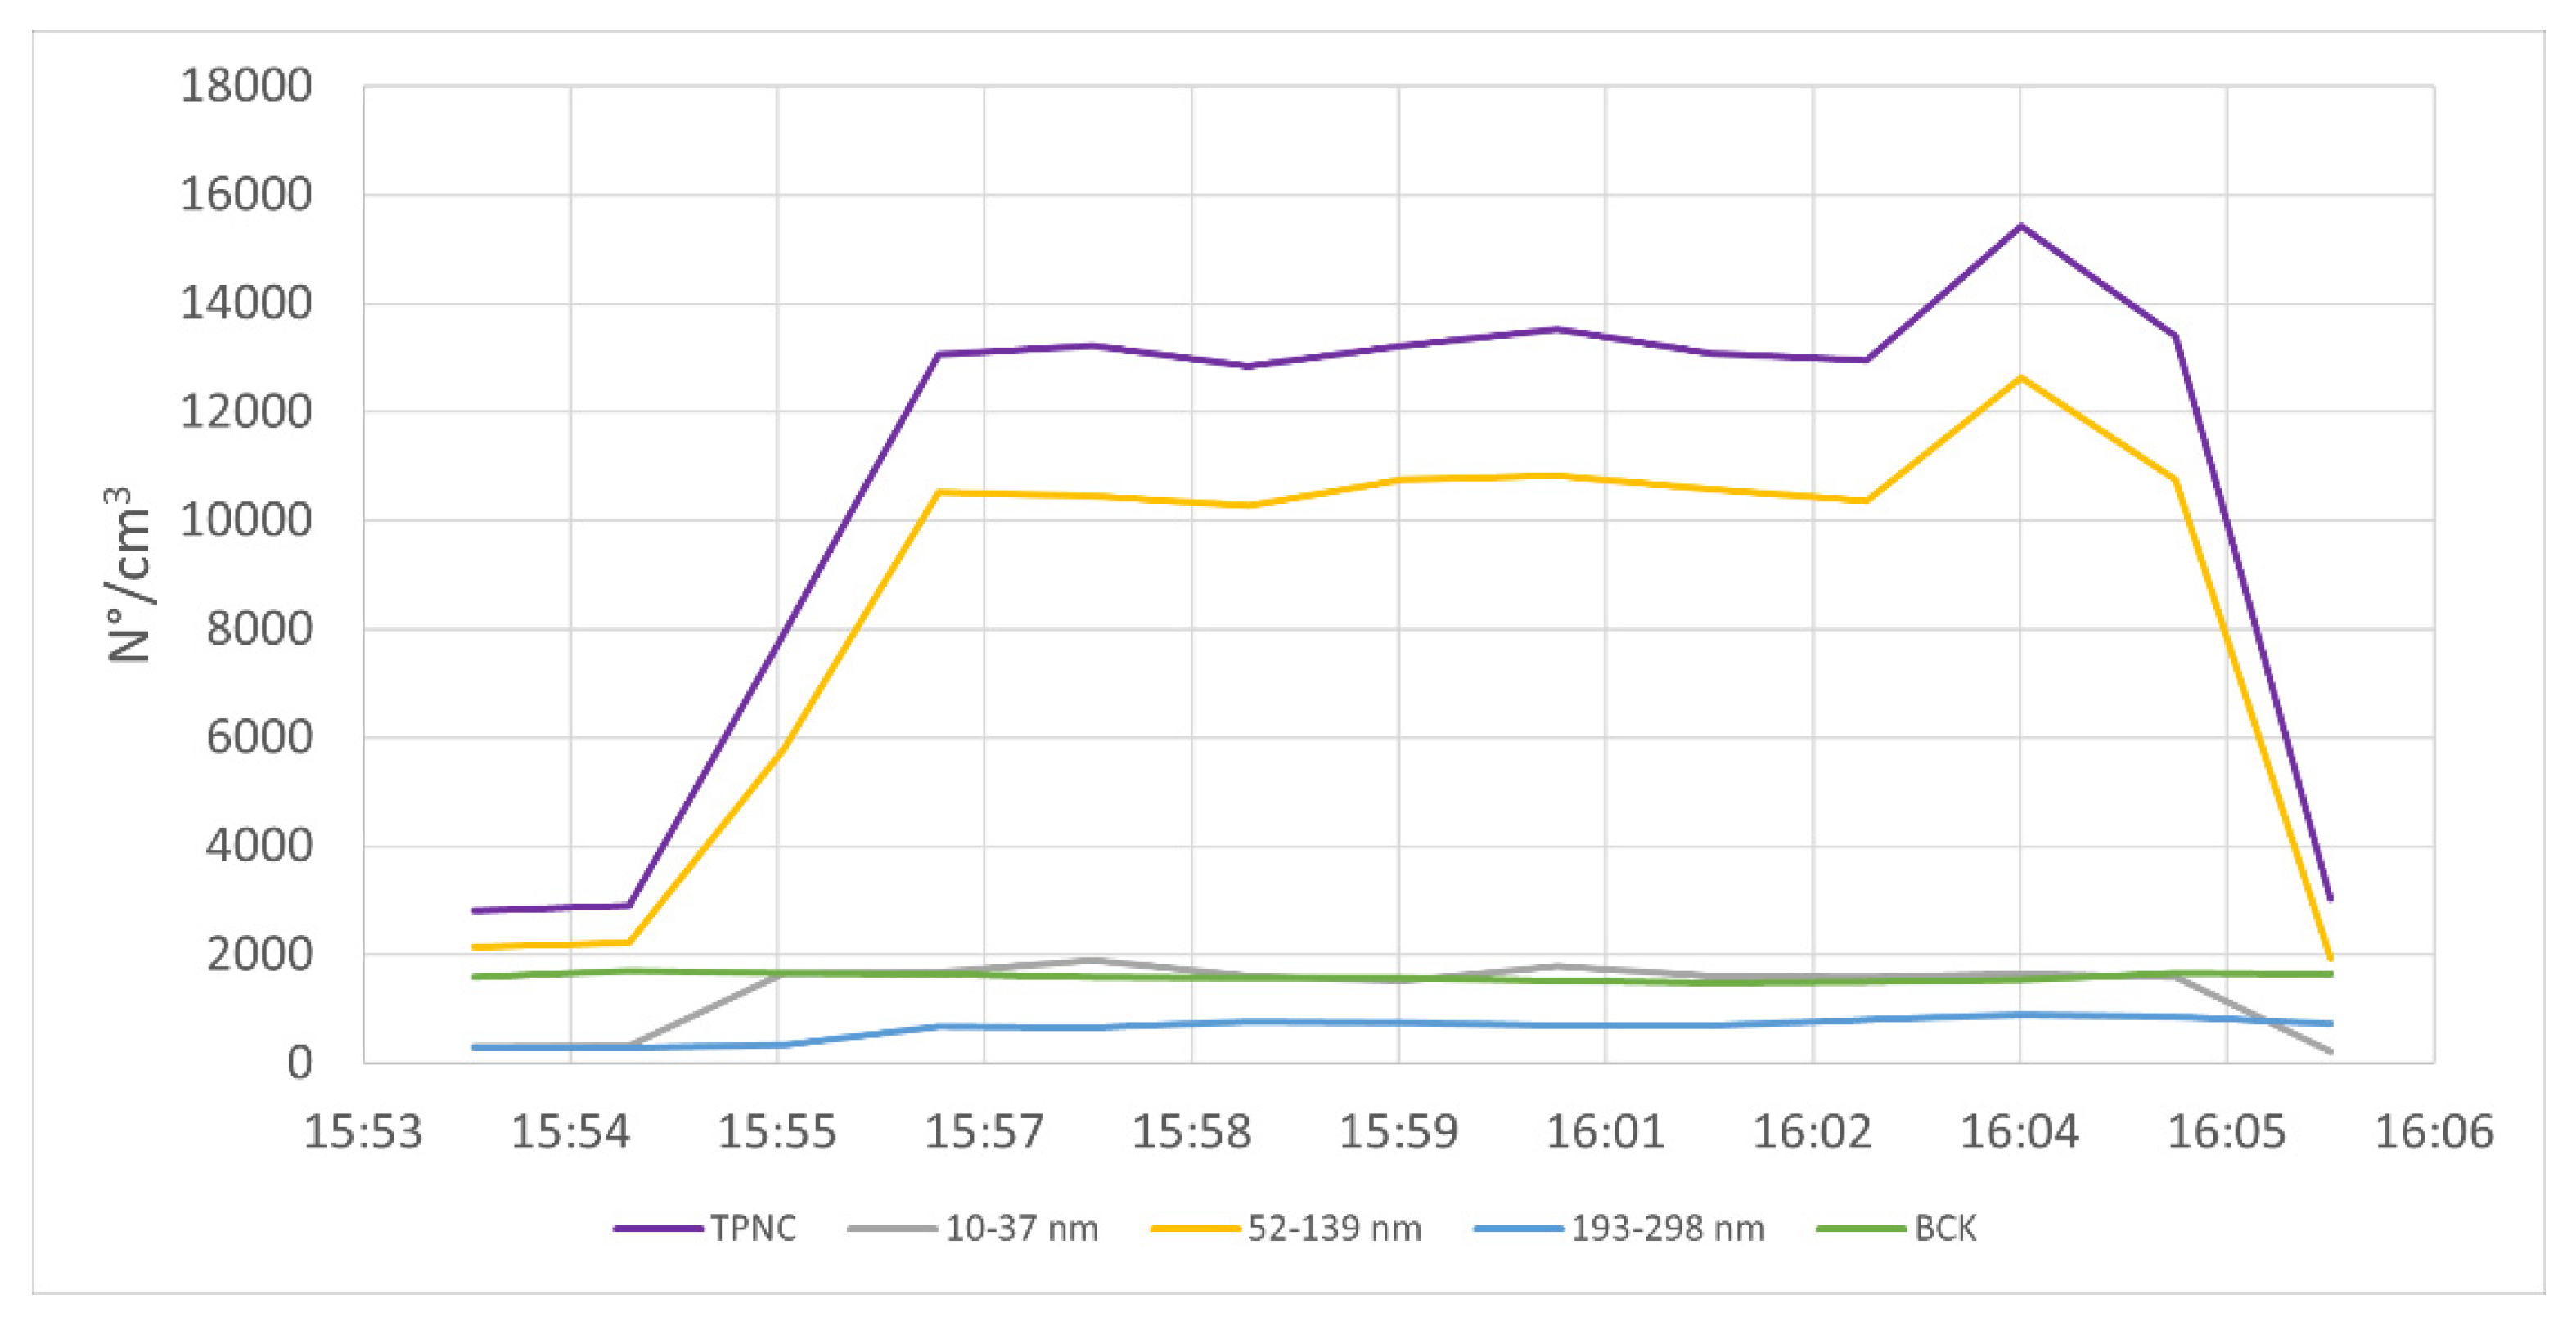
| Operations | OEL (N°/cm3) | Reference Value Indoor (N°/cm3) | Background (N°/cm3) | TPNC (N°/cm3) | Higher Particle Class (nm) | TPNC/BCK |
|---|---|---|---|---|---|---|
| 1 | 20,000 * | 1000–10,000 ** | 1604 | 2798 | 52–139 | 1.7 |
| 2 | 2111 | 52–139 | 1.3 | |||
| 3 | 3856 | 52–139 | 2.4 | |||
| 4 | 2689 | 52–139 | 1.7 | |||
| 5 | 4611 | 52–139 | 2.9 | |||
| 6 | 10,572 | 52–139 | 6.6 |
| CB Factors | O1 | O3 |
|---|---|---|
| PM OEL | 500 µg/m3 * | 200 µg/m3 *** |
| PM Carcinogenicity | Yes (Carc. 1B, H350) ** | Yes (Carc. 2, H351) ** |
| PM Reproductive toxicity | Yes (Repr. 1B, H360F) ** | No |
| PM Mutagenicity | Yes (Muta. 2, H341) ** | No |
| PM Dermal toxicity | Yes (Skin Sens., H317) ** | Yes (Skin Sens., H317) ** |
| PM Asthmagen | No | No |
| NM Surface chemistry | Unknown | Unknown |
| NM Particle shape | Unknown | Unknown |
| NM Particle diameter | Unknown | Unknown |
| NM Solubility | Unknown | Unknown |
| NM Carcinogenicity | Unknown | Unknown |
| NM Reproductive toxicity | Unknown | Unknown |
| NM Mutagenicity | Unknown | Unknown |
| NM Dermal toxicity | Unknown | Unknown |
| NM Asthmagen | Unknown | Unknown |
| Severity Score/Band | 71–High | 58.5–High |
| CB Factors | O1 | O3 |
|---|---|---|
| Estimated amount of material used | >100 mg | >100 mg |
| Dustiness/mistiness | High | High |
| Number of employees with similar exposure | 1–5 | 1–5 |
| Frequency of operation | Daily | Weekly |
| Duration of operation | 30–60 min | 30–60 min |
| Probability Score/Band | 75–Likely | 70–Likely |
| O1 | O3 | |
|---|---|---|
| Severity Score/Band | 71–High | 58.5–High |
| Probability Score/Band | 75–Likely | 70–Likely |
| Overall Risk Level without Controls | RL3 | RL3 |
Publisher’s Note: MDPI stays neutral with regard to jurisdictional claims in published maps and institutional affiliations. |
© 2022 by the authors. Licensee MDPI, Basel, Switzerland. This article is an open access article distributed under the terms and conditions of the Creative Commons Attribution (CC BY) license (https://creativecommons.org/licenses/by/4.0/).
Share and Cite
Dugheri, S.; Cappelli, G.; Trevisani, L.; Kemble, S.; Paone, F.; Rigacci, M.; Bucaletti, E.; Squillaci, D.; Mucci, N.; Arcangeli, G. A Qualitative and Quantitative Occupational Exposure Risk Assessment to Hazardous Substances during Powder-Bed Fusion Processes in Metal-Additive Manufacturing. Safety 2022, 8, 32. https://doi.org/10.3390/safety8020032
Dugheri S, Cappelli G, Trevisani L, Kemble S, Paone F, Rigacci M, Bucaletti E, Squillaci D, Mucci N, Arcangeli G. A Qualitative and Quantitative Occupational Exposure Risk Assessment to Hazardous Substances during Powder-Bed Fusion Processes in Metal-Additive Manufacturing. Safety. 2022; 8(2):32. https://doi.org/10.3390/safety8020032
Chicago/Turabian StyleDugheri, Stefano, Giovanni Cappelli, Lucia Trevisani, Simon Kemble, Fabrizio Paone, Massimiliano Rigacci, Elisabetta Bucaletti, Donato Squillaci, Nicola Mucci, and Giulio Arcangeli. 2022. "A Qualitative and Quantitative Occupational Exposure Risk Assessment to Hazardous Substances during Powder-Bed Fusion Processes in Metal-Additive Manufacturing" Safety 8, no. 2: 32. https://doi.org/10.3390/safety8020032