Article

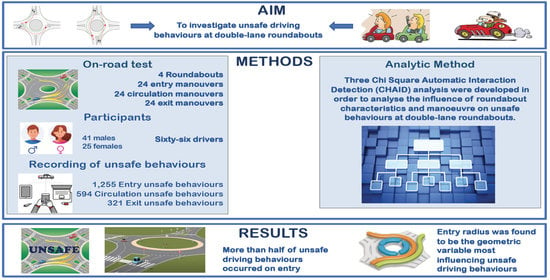
Are Double-Lane Roundabouts Safe Enough? A CHAID Analysis of Unsafe Driving Behaviors

by
Giulia Pulvirenti
1,*,
Natalia Distefano
1,
Salvatore Leonardi
1 and
Tomaz Tollazzi
2
1
Department of Civil Engineering and Architectural, University of Catania, 95125 Catania, Italy
2
Faculty of Civil Engineering, Transportation Engineering and Architecture, University of Maribor, 2000 Maribor, Slovenia
*
Author to whom correspondence should be addressed.
Safety 2021, 7(1), 20; https://doi.org/10.3390/safety7010020
Submission received: 29 December 2020 / Revised: 25 February 2021 / Accepted: 1 March 2021 / Published: 8 March 2021
(This article belongs to the Special Issue Sustainable and Safe Road Design)

Abstract

:
This study investigated the nature and causes of unsafe driving behavior at roundabouts through an on-road study. Four urban double-lane roundabouts with different layouts were selected for an on-road study. Sixty-six drivers (41 males and 25 females) aged 18–65 years took part in the study. Unsafe behaviors observed during the in situ survey were divided into three different categories: entry unsafe behaviors, circulation unsafe behaviors, and exit unsafe behaviors. Three chi-square automatic interaction detection (CHAID) analyses were developed in order to analyze the influence of roundabout characteristics and maneuvers on unsafe behaviors at double-lane roundabouts. The results confirmed the awareness that double-lane roundabouts are unsafe and inadvisable. More than half of unsafe driving behaviors were found to be entry unsafe behaviors. Moreover, the entry radius was found to be the geometric variable most influencing unsafe driving behaviors.

Graphical Abstract

1. Introduction

Roundabouts require that entering traffic be diverted into a circular path parallel to through traffic, and that traffic within the circulatory roadway have the right of way. By diverting the entering traffic, vehicles are induced to reduce their speed, which, together with the low number of conflict points, makes the modern roundabout much safer than a normal signalized intersection [1]. Thanks to the high safety, low delays, and low pollutant emissions from moving vehicles, roundabouts have become a very popular design solution and are, therefore, widely used in both urban and rural areas.
Numerous studies [2,3,4] have shown that roundabouts do have advantages over conventional intersections in terms of traffic safety. Previous studies also examined public opinion of roundabouts and showed that road users are generally positive about roundabouts [5,6,7]. Although roundabouts offer many advantages, there are also some disadvantages. The primary disadvantage is that the right-of-way rules to which road users are accustomed are reversed at roundabouts. Circulating traffic has priority over entering traffic. This could result in improper use and unsafe behaviors. Road user behavior was identified as a prominent causal factor in road traffic accidents and was thoroughly investigated [8,9,10]. Unsafe driving behaviors can be defined as a set of implemented and systematic practices that increase the risk of road accidents. According to [11], these behaviors can lead to a deterioration in the driving behavior of road users with very serious consequences for road safety, as well as increase the risk of accidents. Previous studies found a strong link between road safety and road user unsafe behavior [12,13,14]. For a long time, human error was usually considered the main and more or less fatal cause of road safety problems, because humans are inherently prone to error. While unsafe driving behavior occurs at all points on the road network, it can be particularly pronounced at roundabouts. Due to the complexity of roundabouts, the nature of unsafe behavior may also differ from that at other locations on the road network (e.g., mid-block, signalized intersections, and pedestrian crossings). There is therefore an urgent need to recognize the nature of unsafe behavior by drivers at roundabouts, including factors that may help to mitigate the dangerous effects of such behavior.
It is generally accepted that the geometry of the roundabout affects the behavior of the driver and, thus, their overall performance [15,16]. Indeed, speed reduction is an advantage of a well-designed roundabout, which usually leads to homogeneous behavior [17]. Roundabouts affect drivers’ behavior forcing them to reduce speed in order to drive properly on the circulatory roadway. This significantly reduces the crash severity. For this reason, roundabouts are often used as a traffic calming measure in residential areas. Several studies demonstrated speed reductions at single-lane roundabouts. However, when roundabouts with multiple lanes offer higher capacities [18], their speed and behavior control is less efficient [19]. Increasing the number of lanes allows drivers greater freedom in their behavior, leading to an increase in potential conflicts [20]. The main reason for designing and constructing a double-lane roundabout instead of single-lane roundabout is the higher capacity. Experiences led to the conclusion that performance with respect to both capacity and road safety is disappointing.
In many countries, it has been found that the second lane along the circulatory roadway only contributes to an additional 30% increase in capacity [21]. It is also known that safety benefits are generally greater for single-lane roundabouts than for two-lane roundabouts. Two-lane roundabouts were found to be associated with lower reductions in police-reported crashes [3,22] or even increases in crashes compared to single-lane roundabouts [23]. According to these findings and the fact that newer and safer types of two-lane roundabouts are now available (e.g., turbo-roundabouts, which offer significantly greater capacity and road safety), the construction of new “standard” two-lane roundabouts is not recommended or is even prohibited in several countries. The Netherlands and Slovenia have prohibited the construction of new “standard” two-lane roundabouts in their regulations. The existing two-lane roundabouts were converted to turbo-roundabouts in these countries [21]. French guidelines discourage inner-city two-lane roundabouts for safety reasons [24]. In Switzerland, two-lane exits are never allowed [25]. In Italy, two-lane roundabouts and two-lane exits are not allowed [26]. It is worth noting that several of the existing roundabouts in Italy have two lanes on both the exit and the circulatory roadway.
Researchers have found a strong link between road safety and unsafe road user behavior [14,27]. Human error is considered the main cause of road safety problems because humans are inherently prone to error. Although unsafe driving behavior occurs at all points on the road, it can be particularly pronounced at intersections. Intersections are indeed a complex part of the road system, where drivers often have to make decisions within a tight time frame. There is, therefore, an urgent need to investigate the nature of unsafe driving behavior at intersections, including the factors that contribute to or mitigate the occurrence of these behaviors. A number of studies examined unsafe driving behaviors that contribute to intersection crashes [12,28]. However, to the best of the authors’ knowledge, no studies analyzed driving unsafe behaviors at double-lane roundabouts. The literature review highlights the need for detailed knowledge of unsafe driver behavior at two-lane roundabouts, based on field observations, and the main cause–effect relationships between geometric features and unsafe driver behavior. This study, therefore, provides a convenient opportunity to observe what happens before most accidents occur.
The final aim was to analyze unsafe driving behaviors for double-lane roundabouts and to understand how the geometric characteristics of roundabouts affect unsafe driving behaviors. Four urban single-lane roundabouts and four urban double-lane roundabouts with different geometric characteristics were selected for the on-road study. Unsafe behaviors observed during the on-road survey were divided into three different categories: entry unsafe behaviors, circulation unsafe behaviors, and exit unsafe behaviors. Three chi-square automatic interaction detection (CHAID) analyses were developed in order to analyze the influence of roundabout characteristics and maneuvers on unsafe behaviors at double-lane roundabouts.

2. Materials and Methods

2.1. Participants

Sixty-six drivers (41 males and 25 females) aged 18–65 years took part in the experiment. All participants held a full valid license. To vary age, they were grouped into younger drivers (18–25 years), middle-aged drivers (26–50 years), and older drivers (51–65 years). Participants’ characteristics are presented in Table 1.
The study was conducted in accordance with the Declaration of Helsinki, and the protocol was approved by the University of Catania (Deliberation of the Study Council of Water and Transportation Civil Engineering—verb. n. 5 of 18 September 2018). Participants gave their informed consent to participate in the experiment. They were informed that all data collected would be kept confidential and used for research purposes only. Participants were also informed that they would not be assessed on their skills as drivers and that the sole aim of the study was to analyze the behavior of a group of drivers to draw conclusions about drivers in general.

2.2. Test Route

A 14 km urban route around the suburbs surrounding the city of Catania was used for the on-road test. The urban route contains eight roundabouts. The roundabouts were chosen in order to have different geometric characteristics. Four roundabouts were single-lane, while four roundabouts were double-lane. For this study, only the drivers’ unsafe behaviors made on double-lane roundabouts were considered. This study, therefore, evaluated four roundabouts. The other four single-lane roundabouts, together with another sample of single-lane roundabouts belonging to another route test, were used for another study aimed at evaluating driver unsafe behavior on single-lane roundabouts. Figure 1 shows the test route and the roundabouts considered for this study. Roundabouts 1, 2, and 3 have three legs, while roundabout four has four legs. Four types of maneuvers were considered: first exit (i.e., the driver took the first exit of the roundabout); second exit (i.e., the driver took the second exit of the roundabout); third exit (i.e., the driver took the third exit of the roundabout; this maneuver was possible only on the four-leg roundabout, i.e., roundabout 4); U-turn (i.e., the driver exited from the same leg they entered). For each roundabout, the drivers made at least one maneuver. The drivers undertook each maneuver several times on the four roundabouts considered for this study, in order to obtain 24 maneuvers overall of each type.

2.3. Experiment Design

Two observers aboard the vehicle used a predetermined protocol to manually record unsafe behaviors during the driving tests. While driving, the observer seated in the front seat next to the driver gave instructions. Both observers recorded unsafe behaviors of the driver throughout the driving test (type of behavior, time of occurrence, etc.). At the end of each driving test, the two observers compared the recorded unsafe behaviors with each other: the unsafe behaviors were actually rated as such when both observers agreed. The driving experiments were conducted during off-peak hours with low traffic volume. All testing was conducted during 9:30 and 10:30 a.m. and 2:30 and 2:30 p.m. on weekdays during September and October 2019.

2.4. Unsafe Driving Behavior Classification

The unsafe behaviors observed during the field investigation were categorized into specific types that reflected the nature of the observed behavior as accurately as possible. The specific unsafe behaviors types were subdivided into three different categories: unsafe behaviors made during the approach to the roundabout (entry unsafe behaviors), unsafe behaviors made during the circulation on the roundabout (circulation unsafe behaviors), and unsafe behaviors made while exiting the roundabout (exit unsafe behaviors). Table 2 shows the drivers’ unsafe behavior types considered. Table 3 shows the number of unsafe behaviors registered during the on-road study. The majority of unsafe behaviors were entry unsafe behaviors (57.84%); circulation unsafe behaviors were quite common (27.37%), while exit unsafe behaviors were the least common (14.79%). Among entry unsafe behaviors, high speed of approach (unsafe behavior 1) and failing to detect proper lane when entering (unsafe behavior 5) were the most common. Failing to detect proper lane when entering (unsafe behavior 8) and splitting other users’ lanes (unsafe behavior 6) were the most common circulation unsafe behaviors, while almost all exit unsafe behaviors were of the type 11 (i.e., high exit speed). Only 0.23% of unsafe behaviors were of the type 10 (i.e., failing to detect proper lane when exiting).

2.5. Analytic Method

In order to analyze the characteristics of roundabouts that can lead to unsafe driving behavior, the CHAID (chi-square automatic interaction detection) method was used.
The CHAID method is a technique used to detect relationships between a dependent variable and other independent variables, with a statistically significant result showing their interdependence and the relationship between them. The CHAID algorithm was proposed by Kass [29] to define the distribution condition. The CHAID algorithm is specifically used to determine the degree of dependence between different variables: the larger the value of χ2, the higher the degree of dependence and the probability value of the variable. In addition, a probability value is used to assess whether to continue or terminate the splitting process, which aims to estimate all possible predictive variables. In this way, through the CHAID algorithm, it is possible to test the significance levels of the differences between the different types of dependent variable for each variable.
The CHAID algorithm underlies the following tree branching process:
  • Each node is branched on the basis of the selected dependent variable;
  • The χ2 test is used as the default for branching;
  • Branching is performed by default even if the classification attribute is not significant;
  • If there is no significant difference, the branches merge into the same branch;
  • If the branches differ significantly, the branch is retained and the branching continues to the next level.
The CHAID algorithm allows the following processes to be performed:
-
Selection of the relevant independent variables in such a way that, in the resulting hierarchical structure, the first independent variable is chosen to partition the input data that has the lowest p-value. In hypothesis testing, if the p-value is equal to or less than the predefined significance level α, then the alternative hypothesis suggesting dependence between the variables is accepted; otherwise, the node is considered as the final node. Tree building ends when the p-values of all independent variables are higher than the predefined split threshold.
-
Merging of the categories of all independent variables so that only the nodes with statistically significant difference between them appear in the graph. This is because the algorithm detects the pairs of values of the independent variables that differ the least from the dependent variable. If the obtained p-value after applying the chi-square test is higher than a certain merging threshold, the algorithm merges the categories that do not have significant differences from a statistical point of view. The search for a new merging pair continues until no more pairs are found for which the p-value is smaller than the specified significance level α.
In this study, three CHAID analyses were developed in order to understand how geometric characteristics of roundabouts affect unsafe driving behaviors, entry unsafe behaviors, and circulation unsafe behaviors. A CHAID analysis for exit unsafe behaviors was not developed since, as mentioned before, they were found to be really few in number (less than 15% of the total) and they were mainly of one type (i.e., high exit speed).
The dependent variable considered for the first CHAID analysis was unsafe driving behaviors (UDB), which could assume four values: entry unsafe behaviors; circulation unsafe behaviors; exit unsafe behaviors; no unsafe behaviors. The dependent variable considered for the second CHAID analysis was entry unsafe behaviors (EUB), which could assume five values: (1) high speed of approach; (2) selecting unsafe gap; (3) rejecting a safe gap; (4) turn signal omitted; (5) failing to detect proper lane when entering. The dependent variable considered for the third CHAID analysis was circulation unsafe behaviors (CUB), which could assume four values: (6) splitting other users’ lanes; (7) giving way; (8) failing to detect proper lane when circulating; (9) failing to detect proper lane when taking the first exit.
The independent variables considered for all the CHAID analyses were the roundabout characteristics and the maneuvers shown in Table 4.

3. Results

3.1. Unsafe Driving Behaviors

Table 5 provides a summary of the key parameters of the application of the CHAID analysis. Figure 2 shows the tree diagram obtained for the first CHAID analysis. All unsafe behaviors were divided into 10 subgroups by various branches connecting the root node to the leaf nodes. Three variables out of the original set of seven provided a significant explanation of unsafe behaviors. The tree structure involved, therefore, three splitting variables: entry radius (chi-square = 152.129; p-value = 0.000), maneuver (chi-square = 27.726; p-value = 0.001), and exit width (chi-square = 56.451; p-value = 0.000; chi-square = 14.796; p-value = 0.002), meaning that the variable exit width was responsible for two partitions. The entry radius was, therefore, the variable with the most significant effect on unsafe behaviors.
From the analysis of Figure 2, it can be observed that the most frequent unsafe behaviors were unsafe entry behaviors. The percentage of unsafe entry behaviors at node 0 was indeed 56.0%. Unsafe circulation behaviors were also quite frequent (26.5%), while unsafe exit behaviors were really few (14.3%).
The three splitting variables led to the tree being divided into three levels. The first optimal split in node 0 was according to entry radius, which classified unsafe behaviors into three groups; the tree showed 69.1% of unsafe behaviors for EnR ≥ 30 m, 13.2% of unsafe behaviors for 10 m ≤ EnR ≤ 30 m, and 17.7% of unsafe behaviors for EnR ≤ 10 m. In the second level of the tree, the group including EnR ≥ 30 m led to another split based on maneuver; the group including 10 m ≤ EnR ≤ 30 m led to another split based on exit width. In the third level of the tree, the exit width segmented the groups including second and third exit maneuvers and EnR ≥ 30 m into two subgroups.

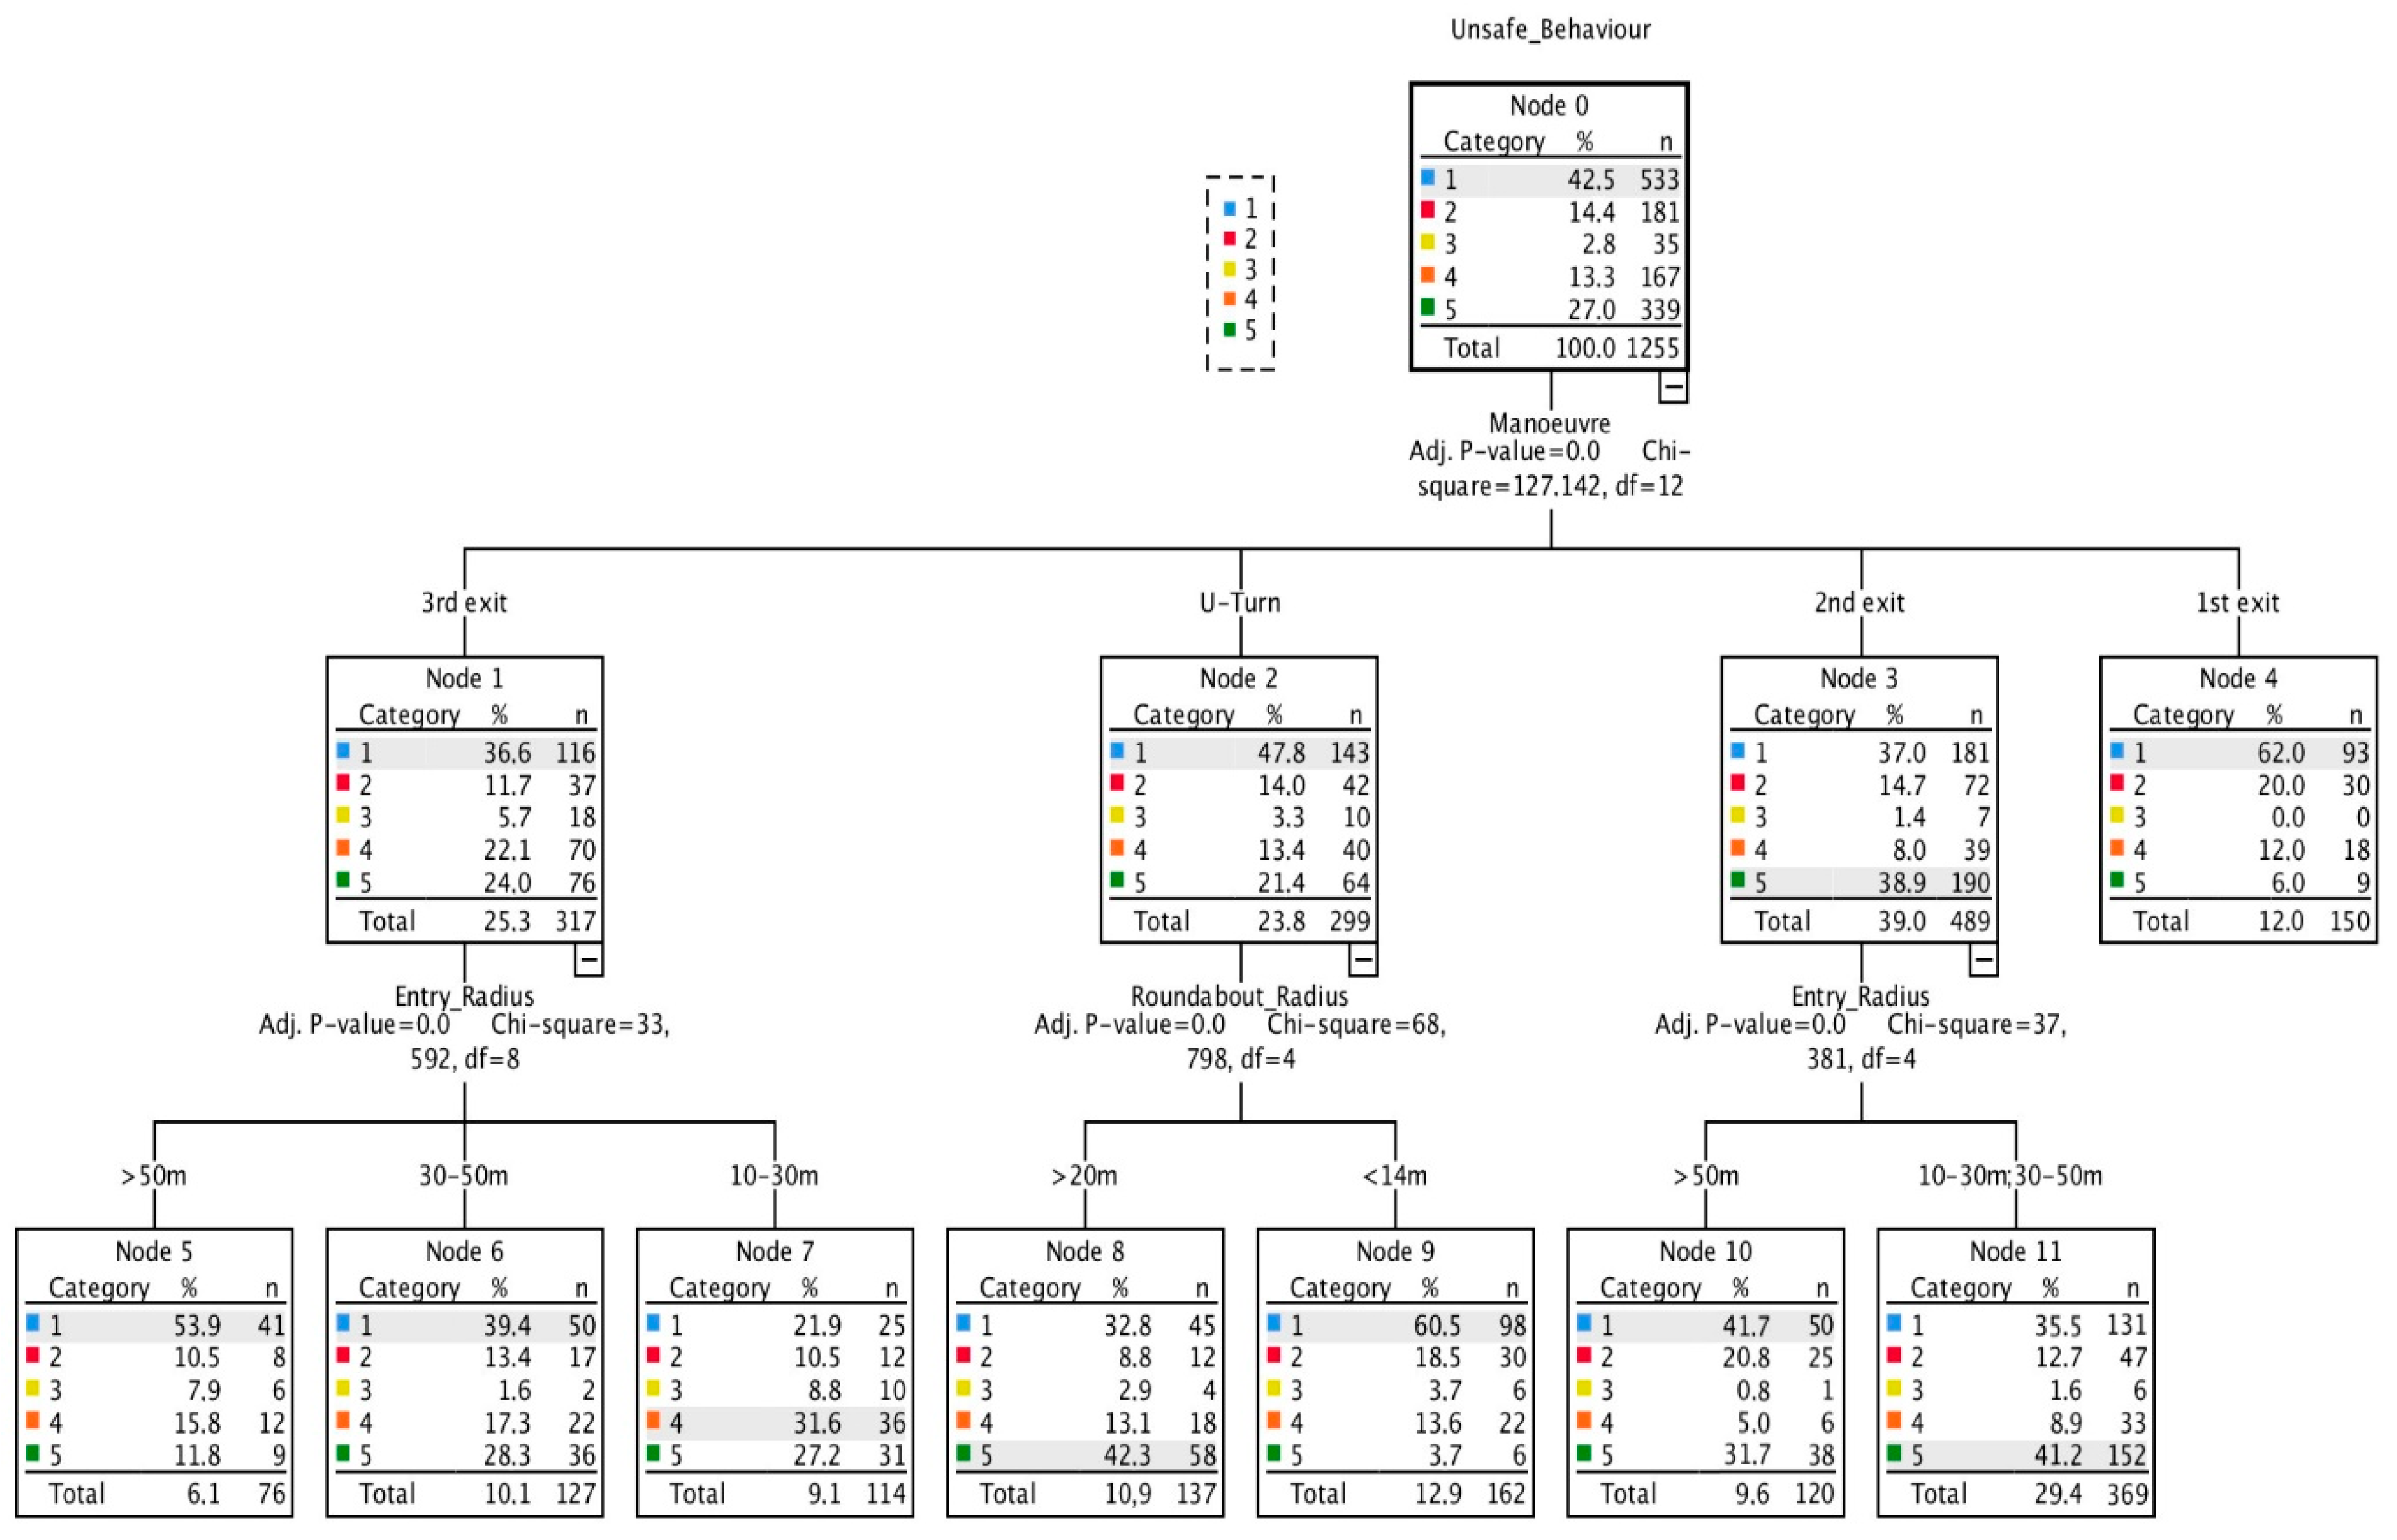
3.2. Entry Unsafe Behaviors

Table 6 provides a summary of the key parameters of the application of the CHAID analysis. Figure 3 shows the tree diagram obtained for the first CHAID analysis. All entry unsafe behaviors were divided into 11 subgroups by various branches connecting the root node to the leaf nodes. Three variables out of the original set of seven provided a significant explanation of the entry unsafe behaviors. The tree structure involved, therefore, three splitting variables: maneuver (chi-square = 127.142; p-value = 0.000), entry radius (chi-square = 33.592; p-value = 0.000; chi-square = 37.381; p-value = 0.000), and roundabout radius (chi square = 68.798; p-value = 0.000), meaning that the variable entry radius was responsible for two partitions. The maneuver was, therefore, the variable with the most significant effect on entry unsafe behaviors.
The first optimal split in node 0 was according to maneuver, which classified unsafe behaviors into four groups; the tree showed 25.3% of unsafe behaviors for third exit maneuvers, 23.8% of unsafe behaviors for U-turn maneuvers, 39.0% of unsafe behaviors for second exit maneuvers, and 12.0% of unsafe behaviors for first exit maneuvers. In the second level of the tree, the group including third exit maneuvers led to another split based on entry radius; the group including U-turn maneuvers led to another split based on roundabout radius; the group including second exit maneuvers led to another split based on entry radius.

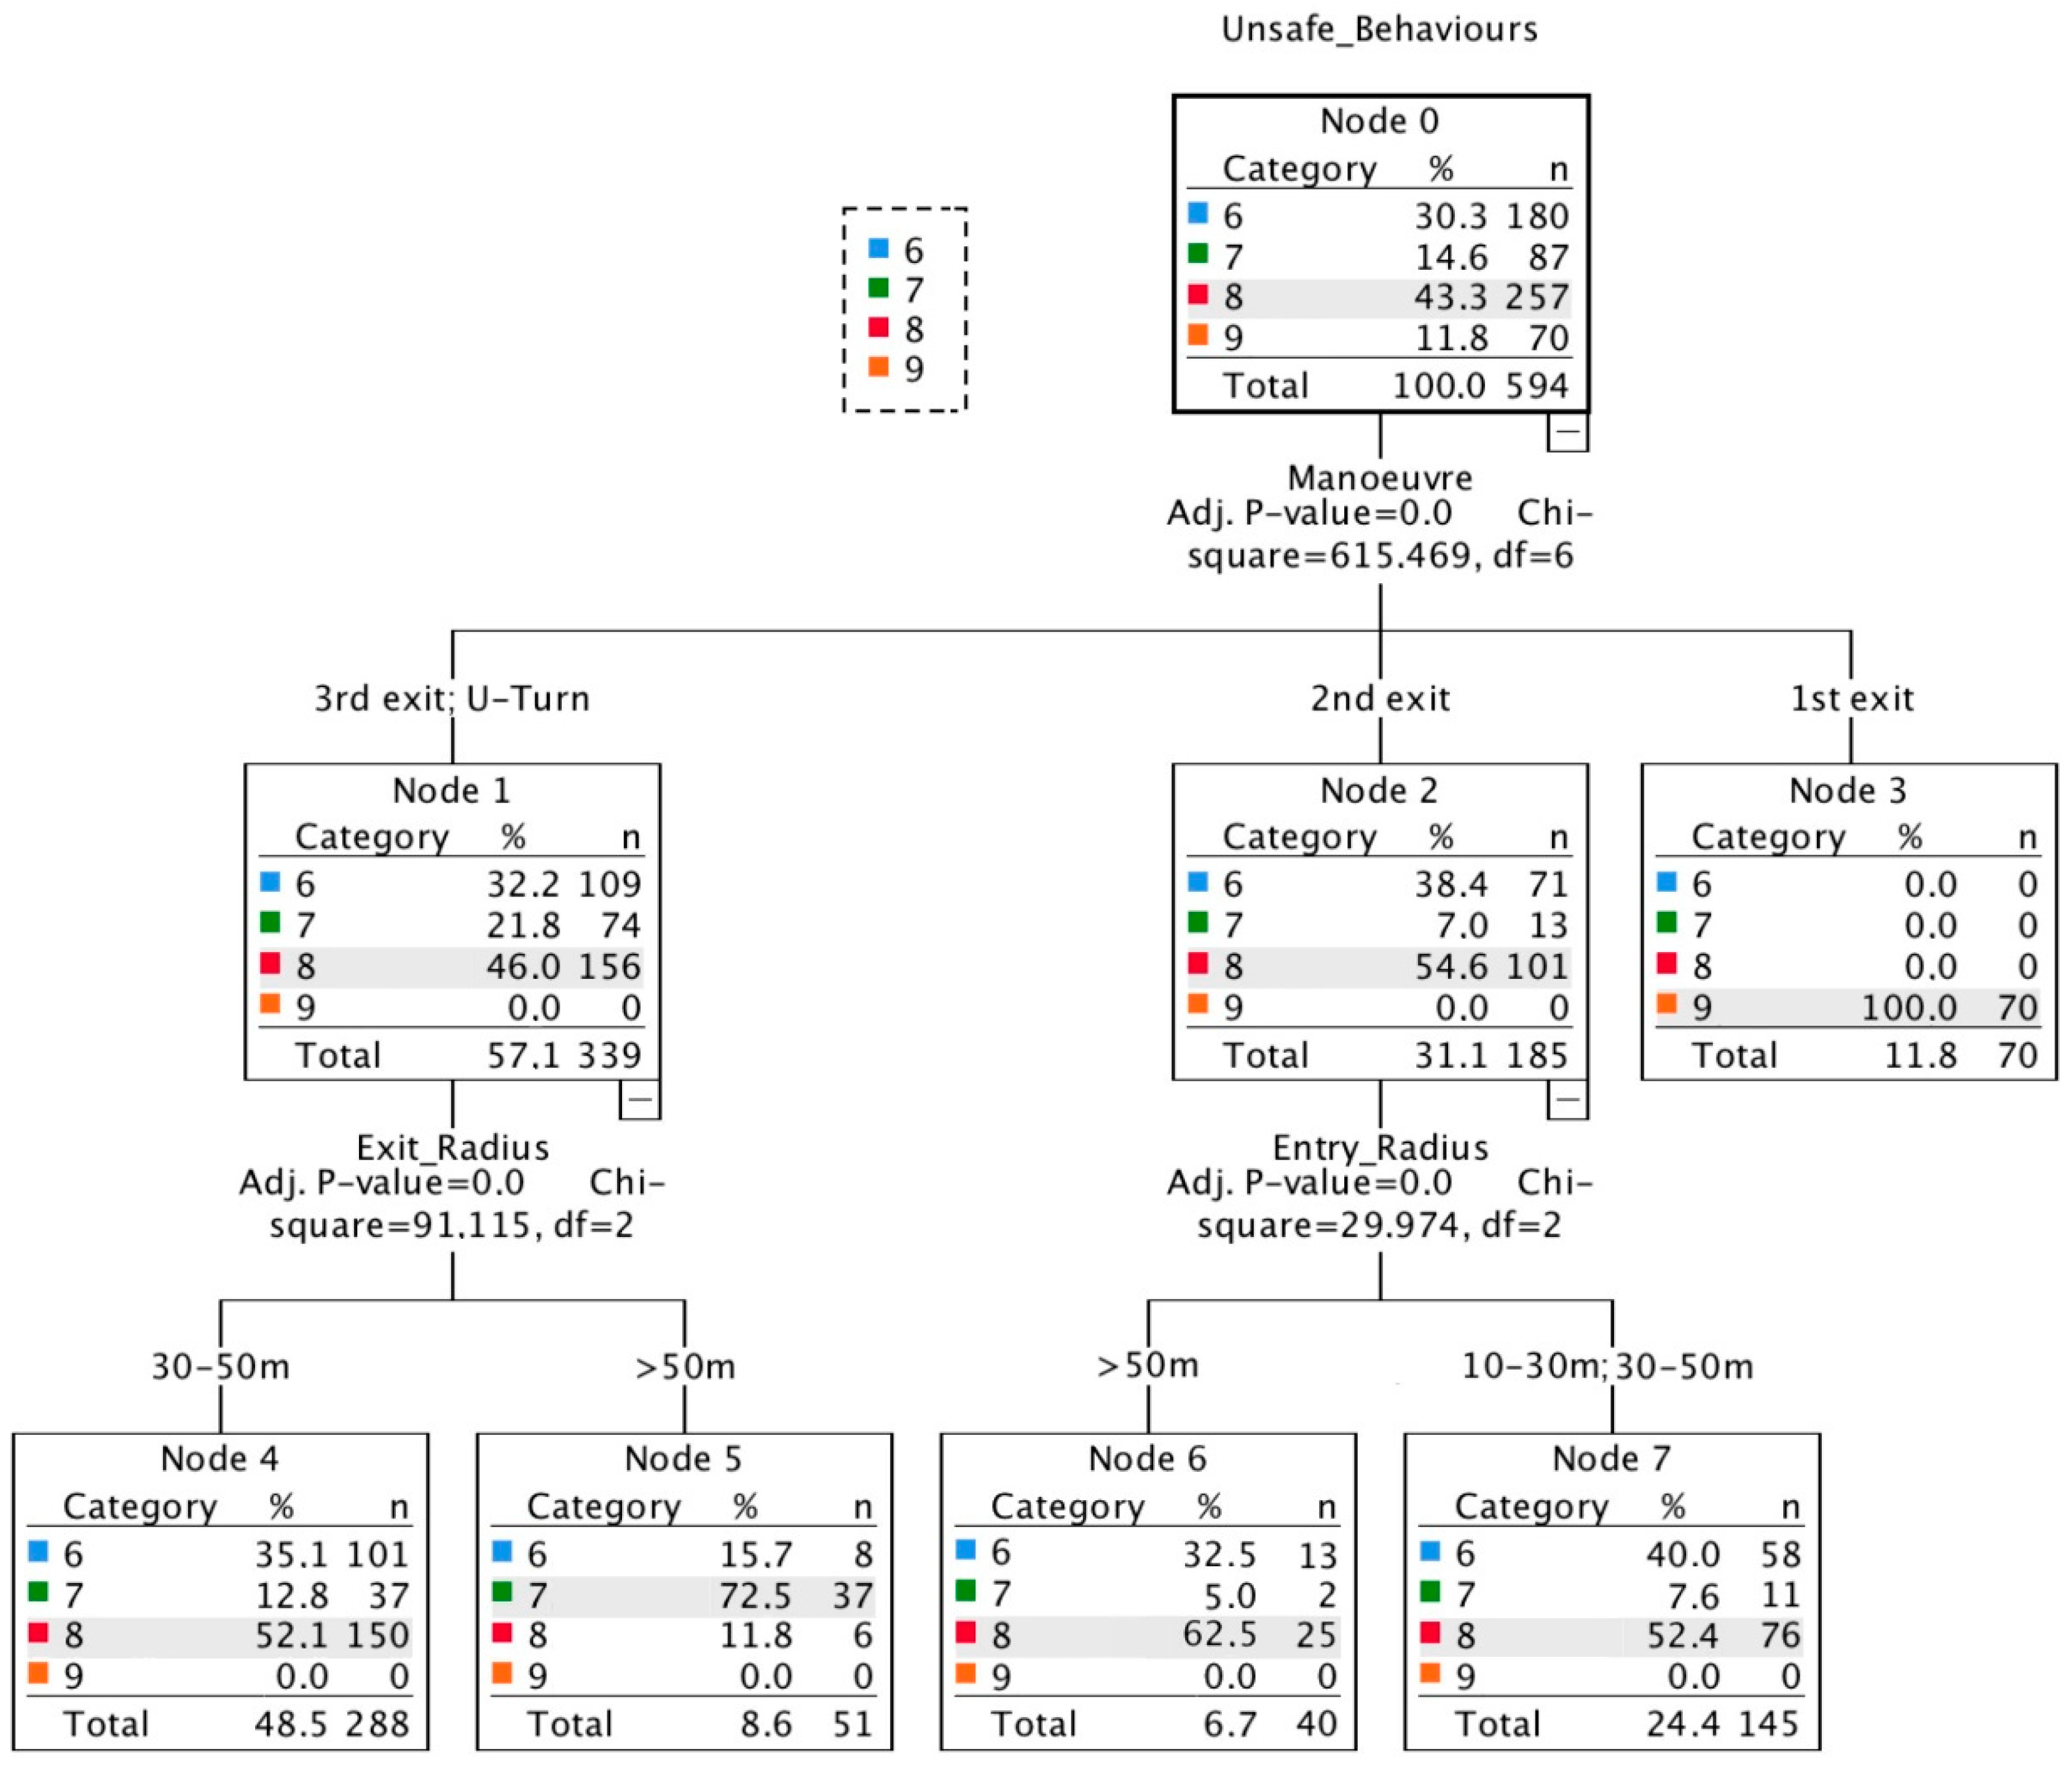
3.3. Circulation Unsafe Behaviors

Table 7 provides a summary of the key parameters of the application of the CHAID analysis. Figure 4 shows the tree diagram obtained for the first CHAID analysis. All circulation unsafe behaviors were divided into seven subgroups by various branches connecting the root node to the leaf nodes. Three variables out of the original set of seven provided a significant explanation of the circulation unsafe behaviors. The tree structure involved, therefore, three splitting variables: maneuver (chi-square = 615.469; p-value = 0.000), exit radius (chi-square = 91.115; p-value = 0.000), and entry radius (chi square = 29.974; p-value = 0.000). The maneuver was, therefore, the variable with the most significant effect on circulation unsafe behaviors.
The first optimal split in node 0 was according to maneuver, which classified unsafe behaviors into three groups; the tree showed 57.1% of unsafe behaviors for third exit and U-turn maneuvers, 31.1% of unsafe behaviors for second exit maneuvers, and 11.8% of unsafe behaviors for first exit maneuvers. In the second level of the tree, the group including third exit and U-turn maneuvers led to another split based on exit radius, while the group including second exit maneuvers led to another split based on entry radius.

4. Discussion

4.1. Unsafe Driving Behaviors

The results obtained (Figure 2) highlighted that more than half of unsafe driving behaviors on double-lane roundabouts were entry unsafe behaviors (56.0%). Circulation unsafe behaviors (26.5%) represented about half of entry unsafe behaviors. Exit unsafe behaviors (14.3%) represented, in turn, about half of circulation unsafe behaviors. There was, therefore, a proportionality among entry, circulation, and exit unsafe behavior based on the ratio 4:2:1.
As can be seen from Figure 2, the most significant independent variable was entry radius. Therefore, this variable was the one most related to the dependent variable and had the greatest power to differentiate and classify unsafe behaviors into four groups. It is noteworthy that almost 70% of unsafe driving behaviors happened on roundabouts with a big entry radius, i.e., EnR ≥ 30 m (node 1, which grouped two categories). Moreover, more than 60% of unsafe driving behaviors on roundabouts with a big entry radius (i.e., node 1) were entry unsafe behaviors. This suggests that a big entry radius affects unsafe driving behaviors especially during the entry phase. In contrast, on roundabouts with a small entry radius (i.e., EnR ≤ 10 m, node 3), the majority of unsafe behaviors were circulation unsafe behaviors (about 40%). Lastly, for roundabouts with 10 m ≤ EnR ≤ 30 m, three positive aspects can be highlighted: (1) the minimum percentage of unsafe driving behaviors (about 12%); (2) the minimum number of circulation unsafe behaviors (89 out of 594) and exit unsafe behaviors (31 out of 321); (3) a high percentage of no unsafe behaviors (about 8%).
For roundabouts with 10 m ≤ EnR ≤ 30 m, the exit width was statistically significant. The results obtained suggest that unsafe driving behaviors are less common for big exit widths. The number of unsafe behaviors for ExW ≥ 8 m (203) was indeed less than half of the percentage of unsafe behaviors for ExW < 8 m (69). Moreover, the percentage of no unsafe behaviors for ExW ≥ 8 m was very high (24.2%).
Node 1, which included two categories, 30 m < EnR < 50 m and EnR ≥ 50 m, was divided into two leaves according to the variable maneuver. It can be observed that the percentage of unsafe driving behaviors for first exit maneuvers and for U-turn maneuvers was similar, while the majority of unsafe driving behaviors occurred for second and third exit maneuvers. In particular, almost 50% of unsafe behaviors occurred for roundabouts with EnR ≥ 30 m and for second and third exit maneuvers (1039 out of 2170). This result suggests that wide entry radii affect, in a similar way, users who take the second and third exit. Indeed, second and third exit maneuvers require, more than first exit maneuvers and U-turns, an adequate geometric configuration of the entry in order to ensure proper entry on the circulatory roadway. First exit maneuvers are indeed usually made directly from the external lane, while drivers making U-turn maneuvers, aware of having to return to the starting point, usually use the inner lane of the circulatory roadway. The results obtained seem to indicate that big entry radii do not allow users to correctly enter the roundabout for second and third exit maneuvers, resulting in several unsafe behaviors for the entry, circulation, and exit phases.
It is also interesting to observe that, for roundabouts with EnR ≥ 30 m and for second and third exit maneuvers, the majority of unsafe driving behaviors occurred for ExW ≥ 8 m, contrary to that observed for roundabouts with 10 m ≤ EnR ≤ 30 m. This suggests that, when driving on roundabouts with big radii, users are further induced to adopt unsafe behaviors via configurations which leave great freedom of maneuvers, such as wide exit lanes.
In conclusion, the results obtained from the first CHAID analysis seem to suggest that, in order to discourage unsafe driving behaviors, double-lane roundabouts should have entry radii between 10 m and 30 m and wide exit lanes. On the other hand, roundabouts with big entry radii (EnR ≥ 30 m) and wide exit lanes should be avoided.

4.2. Entry Unsafe Behaviors

Figure 3 shows that the most common entry unsafe behavior could be grouped into two categories: (a) high speed of approach, which was equal to about 40% (typical of all at-grade intersections); (b) unsafe behaviors due to the presence of the double-lane: turn signal omitted and failing to detect proper lane when entering (e.g., unsafe behaviors 4 and 5), which were equal to 13.3% and 27.0% respectively. A still significant percentage (14.4%) of entry unsafe behaviors was represented by selecting unsafe gap (unsafe behavior 2). The percentage of unsafe behavior 3 (i.e., rejecting a safe gap) was instead almost negligible (2.8%).
Figure 3 shows that the most significant independent variable was maneuver. Therefore, this variable was the one most related to the dependent variable and had the greatest power to differentiate and classify the entry unsafe behaviors. The maneuver split node 0 into four leaves. The major percentage of entry unsafe behaviors occurred for second exit maneuvers (39%), while a minor percentage of entry unsafe behaviors occurred for first exit maneuvers (12%). It is interesting to observe that the prevailing unsafe behavior (62%) for first exit maneuvers was a high speed of approach (e.g., unsafe behavior 1). This can be explained considering that first exit maneuvers are often carried out without a real circulation.
The results obtained for second exit maneuvers (node 3) show that drivers are induced to carry out this maneuver using the entry lanes in an improper way. In particular, drivers seem to be led to carry out second exit maneuvers quickly (which is testified by a high percentage of high speed of approach). This seems to induce drivers to select the improper entry lane; indeed, the majority (38.9%) of unsafe behaviors at node 3 were unsafe behavior 5 (i.e., failing to detect proper lane when entering). If we consider that 8% of unsafe behaviors were turn signal omitted (i.e., unsafe behavior 4), it can be said that about 50% of unsafe behaviors were due to the presence of the double lane.
The percentage of unsafe behaviors due to the presence of the double lane for the third exit maneuvers (node 1) was almost equal to 50% too. However, in contrast to that observed for second exit maneuvers, in this case, the percentages of turn signal omitted and failing to detect proper lane when entering (e.g., unsafe behaviors 4 and 5) were about the same (22.1% and 24.0%, respectively). It is also noteworthy that the percentages of high speed of approach (i.e., unsafe behavior 1) for second and third exit maneuvers were almost the same (37.0% and 36.6%, respectively). Although, in general, crossing maneuvers tended to be traveled faster, during the entry phase, the third exit maneuvers also seemed to induce drivers to adopt a high speed.
As for U-turn maneuvers, the results obtained (node 2) seem to suggest that drivers try to return quickly to the leg they were coming from. It can indeed be observed that almost 50% of unsafe behaviors were a high speed of approach (i.e., unsafe behavior 1). Furthermore, unsafe behavior 2 (i.e., selecting unsafe gap) occurred with a significant percentage (13.4%). Unsafe behaviors due to the presence of the double lane (unsafe behaviors 4 and 5) for U-turn maneuvers occurred instead with lower percentages (about 35% in total).
For both second and third exit maneuvers, the entry radius was the variable affecting entry unsafe behaviors. In particular, the entry radius split node 1 (third exit maneuvers) into three leaves and node 3 (second exit maneuvers) into two leaves, one for EnR ≥ 50 m, one for 10 m ≤ EnR ≤ 30 m, and 30 m ≤ EnR ≤ 50 m. This suggests that, for second exit maneuvers, drivers assume similar driving behaviors for 10 m ≤ EnR ≤ 30 m and 30 m ≤ EnR ≤ 50 m.
As for third exit maneuvers, it can be observed an interesting inverse relationship between the influence of entry radius on unsafe behavior 1 (high speed of approach) and on unsafe behaviors 4 and 5 (turn signal omitted and failing to detect proper lane when entering). As the entry radius increased, unsafe behavior 1 grew (for EnR ≥ 50 m, the percentage of unsafe behavior 1 was even superior than 50%). By contrast, as the entry radius decreased, the percentages of unsafe behaviors 4 and 5 grew significantly (e.g., for 10 m ≤ EnR ≤ 30 m, the percentage of unsafe behaviors 4 and 5 was overall equal to about 60%, while, for EnR ≥ 50 m, this percentage was less than 30%).
Even for second exit maneuvers, it could be observed an inverse relationship between the influence of entry radius on unsafe behavior 1 (high speed of approach) and on unsafe behaviors 4 and 5 (turn signal omitted and failing to detect proper lane when entering), but the relationship was less strong then for third exit maneuvers. For EnR < 50 m, the percentage of unsafe behavior 1 was about 35%, while, for EnR ≥ 50 m, this percentage was less than 40%. On the other hand, for EnR ≥ 50 m, unsafe behaviors 4 and 5 were about 37%, while, for EnR < 50 m, they were about 50%. These results suggest that the entry radius affects more driving unsafe behaviors for third exit maneuvers. When users take the second exit, instead, the entry radius affects less driving unsafe behaviors, probably because users are psychologically predisposed toward a quicker maneuver. A confirmation of this interpretation comes from the fact that, in the case of the first exit maneuver, which is quicker and more direct than second exit maneuver, the entry radius did not affect at all unsafe driving behavior.
Lastly, for U-turn maneuvers, the geometric variable that affected more unsafe behaviors was the roundabout radius. It can be observed that, for roundabouts with RR < 14 m, unsafe behaviors related to high speed (i.e., unsafe behavior 1, about 60%) and to improper use of the entry lanes (i.e., unsafe behavior 2 and 3, about 18%) prevailed over unsafe behaviors related to the double lane (i.e., unsafe behaviors 4 and 5, about 17%). On the other hand, for roundabouts with RR ≥ 20 m, unsafe behaviors related to high speed (i.e., unsafe behavior 1, about 33%) and to improper use of the entry lanes (i.e., unsafe behavior 2and 3, about 9%) occurred less than unsafe behaviors related to the double lane (i.e., unsafe behaviors 4 and 5, about 55%). This suggests that smaller roundabouts are perceived as elements that can be bypassed quickly. Larger roundabouts, on the other hand, induce a greater control of speeds (even though unsafe behaviors due to improper use of the entry lanes increased in this case).

4.3. Circulation Unsafe Behaviors

Figure 4 shows that the most common circulation unsafe behavior (43.3%) was failing to detect proper lane when circulating (i.e., unsafe behavior 8). This highlights, therefore, that, on double-lane roundabouts, drivers, who are led to use intuitively the external exit lane, often circulate on the inner lane of the circulatory roadway, instead of changing circulating lane before exiting. This behavior could be probably due to the confusion generated by an entirely two-lane itinerary and to the lack of knowledge of traffic rules in roundabouts. Splitting other users’ lanes (i.e., unsafe behavior 6) was also quite common (30.3%). This unsafe behavior could be due to driver inattention and to the difficulty of observing other vehicles on the circulation external lane by means of the rearview mirror. Giving way (i.e., unsafe behavior 7) represented about 15% of circulation unsafe behaviors, and it almost exclusively concerned third exit and U-turn maneuvers. Failing to detect proper lane when taking the 1st exit (i.e., unsafe behavior 9) represented instead about 12% of circulation unsafe behaviors.
The second level of the three shows that about 60% of circulation unsafe behaviors occurred for third exit and U-turn maneuvers (node 1). Since the aforementioned maneuvers were those in which the vehicle circulated for the longest time, it seems logical to conclude that driving on parallel lanes is a cause of unsafe behavior. For these maneuvers, it can also be observed that there was a 3:2 relationship between unsafe behaviors 8 and 6, respectively. The same relationship existed for unsafe behaviors 8 and 6 for second exit maneuvers (node 2).
It is noteworthy that the only geometric variables affecting circulation unsafe behaviors were exit radius and entry radius. The exit radius was the geometric variable affecting circulation unsafe behaviors for third exit and U-turn maneuvers. In particular, the majority (48.5%) of circulation unsafe behaviors occurred for ExR < 50 m, while only 8.6% of circulation unsafe behaviors occurred for ExR ≥ 50 m. The entry radius was instead the geometric variable affecting circulation unsafe behaviors for second exit maneuvers. In particular, the majority (24.4%) of circulation unsafe behaviors occurred for EnR < 50 m, while only 6.7% of circulation unsafe behaviors occurred for EnR ≥ 50 m. This seems to suggest that, for big entry radii, users are induced to drive on the circulation lanes in a proper way. On the other hand, for small entry radii, users are probably confused by the smallest room for maneuvers and do not manage to use circulation lanes in a proper way. The number of unsafe behaviors 6 and 8 for EnR ≥ 50 m was instead equal to 145, which was more than triple than the number of unsafe behaviors 6 and 8 for EnR < 50 m, i.e., 40.

5. Conclusions

This study aimed at identifying the contributing factors affecting drivers’ unsafe behaviors at single-lane roundabouts. Unsafe behaviors were evaluated on the basis of the behavior of 66 drivers who performed an on-road test around the suburbs surrounding the city of Catania. Three CHAID analyses were developed in order to analyze the influence of roundabout characteristics on entry, circulation, and exit unsafe behaviors.
Results showed that a double entry lane was the design element that most affected unsafe behaviors. Out of nearly 2200 unsafe behaviors detected on a sample of four double-lane roundabouts at the entrance, in the circulatory roadway, and at the exit, more than half occurred right at the entrances. In particular, results showed that drivers often do not understand well which of the two entry lanes is more appropriate to select in order to enter the roundabout. It is interesting to observe that these difficulties occurred despite the presence of the double lane on the circulatory roadway which should make the entry from a double-lane leg intuitive. Therefore, the realization of a double-lane entry leg is strongly discouraged. However, since several countries allow double entry lanes, it is at least necessary to provide adequate design indications aimed at minimizing their negative effects on safety. An interesting result of this study is that the entry radius was found to strongly affect the driver behavior of users approaching double-lane roundabouts. Wide entry radii, i.e., major than 30 m, were found to be associated with the majority of unsafe driving behaviors (about 1500 unsafe behaviors out of a total of 2170 occurred on the legs with large entry radii). On the other hand, on the legs with entry radii between 10 and 30 m, there were just over 250 unsafe behaviors. Therefore, the results of this study seem to suggest that, for roundabouts with a double entry leg, it would be advisable to adopt entry radii between 10 and 30 m. This would minimize the risks associated with unsafe behaviors resulting from a low-curvature entry.
The results obtained for circulation showed that double-lane roundabouts led to confusion especially as for the exit phase. The number of circulation unsafe behaviors was definitely smaller than entry unsafe behaviors. It can be concluded that the realization of double lanes on a circulatory roadway it is not advisable. This is consistent with the design guidelines of several countries which do not allow a double-lane circulatory roadway. Even the double-lane exit contributed to unsafe behaviors, especially because users were instinctively led to leave the roundabout using the external lane. The double-lane exit, even if associated with a lower number of unsafe behaviors (less than 15% of the total), seems, therefore, to be useless rather than dangerous. For this reason, this design solution should also be avoided.
The CHAID analyses allowed analyzing the influence of roundabout characteristics on entry, circulation, and exit unsafe behaviors. However, other methods such as fuzzy fault tree analysis, TOPSIS (Technique for Order of Preference by Similarity to Ideal Solution), AHP (Analytic Hierarchy Process), and cluster analysis could be useful to address this topic and could be used in the future to further analyze the problem. Other studies in the literature used these methods in transportation fields [30,31,32,33,34]. Despite being based on a small sample of roundabouts, this study contributes to increasing knowledge about unsafe driving behaviors at double-lane roundabouts. The results confirmed the awareness that double-lane roundabouts are unsafe and inadvisable. The entry radius was found to be the variable most affecting driving unsafe behaviors. Unsafe behaviors have the potential to degrade driving performance, which has serious consequences for road safety and greatly increases the risk of accidents. Therefore, the results of this study may be useful for designing a physical road layout to prevent unsafe driving behavior. Moreover, future studies could also analyze how the road design affects traffic congestion. Since roads are not of suitable design in crowded cities, vehicles that do not maneuver on time cause traffic congestion or extra load. It could be interesting to study the conditions of these vehicles and their effect on traffic.

Author Contributions

Conceptualization, G.P., N.D., S.L., and T.T.; methodology, G.P., N.D., and S.L.; software, N.D.; validation, G.P., N.D., and S.L.; formal analysis, G.P., N.D., and S.L.; investigation, G.P.; resources, S.L.; data curation, N.D.; writing—original draft preparation, G.P.; writing—review and editing, G.P., N.D., and S.L.; visualization, G.P., N.D., and S.L.; supervision, S.L. and T.T.; project administration, S.L. and T.T. All authors have read and agreed to the published version of the manuscript.

Funding

This research received no external funding.

Institutional Review Board Statement

The study was conducted according to the guidelines of the Declaration of Helsinki, and the protocol was approved by the University of Catania (Deliberation of the Study Council of Water and Transportation Civil Engineering—verb. n. 5 of 18 September 2018).

Informed Consent Statement

Informed consent was obtained from all subjects involved in the study.

Data Availability Statement

The data presented in this study are available on request from the corresponding author. The data are not publicly available due to confidentiality issues.

Conflicts of Interest

The authors declare no conflict of interest.

References

  1. Retting, R.A.; Persaud, B.N.; Garder, P.E.; Lord, D. Crash and injury reduction following installation of roundabouts in the United States. Am. J. Public Health 2001, 91, 628–631. [Google Scholar] [CrossRef] [PubMed] [Green Version]
  2. Daniels, S.; Wets, G. Traffic Safety Effects of Roundabouts: A review with emphasis on bicyclist’s safety. 18th ICTCT Work. 2005, 18, 1–12. [Google Scholar]
  3. Persaud, B.N.; Retting, R.A.; Garder, P.E.; Lord, D. Safety effect of roundabout conversions in the United States: Empirical Bayes observational before-after study. Transp. Res. Rec. 2001, 1751, 1–8. [Google Scholar] [CrossRef]
  4. Elvik, R. Effects on Road Safety of Converting Intersections to Roundabouts: Review of Evidence from Non-U.S. Studies. Transp. Res. Rec. J. Transp. Res. Board 2007, 1847, 1–10. [Google Scholar] [CrossRef]
  5. Retting, R.A.; Luttrell, G.; Russell, E.R. Public opinion and traffic flow impacts of newly installed modern roundabouts in the United States. ITE J. Inst. Transp. Eng. 2002, 72, 30. [Google Scholar]
  6. Leonardi, S.; Distefano, N.; Pulvirenti, G. Italians’ public opinion on road roundabouts: A web based survey. Transp. Res. Rec. 2020, 45, 293–300. [Google Scholar] [CrossRef]
  7. Macioszek, E.; Kurek, A. Roundabout users subjective safety—Case study from upper silesian and masovian voivodeships (Poland). Trans. Transp. Sci. 2020. [Google Scholar] [CrossRef]
  8. Sheykhfard, A.; Haghighi, F. Driver distraction by digital billboards? Structural equation modeling based on naturalistic driving study data: A case study of Iran. J. Saf. Res. 2020, 72, 1–8. [Google Scholar] [CrossRef] [PubMed]
  9. Parnell, K.J.; Rand, J.; Plant, K.L. A diary study of distracted driving behaviours. Transp. Res. Part F Traffic Psychol. Behav. 2020. [Google Scholar] [CrossRef]
  10. Iversen, H.; Rundmo, T. Attitudes towards traffic safety, driving behaviour and accident involvement among the Norwegian public. Ergonomics 2004. [Google Scholar] [CrossRef] [PubMed]
  11. Regan, M.A.; Lee, J.D.; Young, K.L. Driver Distraction: Theory, Effects and Mitigation; CRC Press: Boca Raton, FL, USA, 2009. [Google Scholar]
  12. Abojaradeh, M.; Jrew, B.; Al-Ababsah, H.; Engineer, C. The Effect of Driver Behavior Mistakes on Traffic Safety. Civ. Environ. Res. 2014, 6, 39–54. [Google Scholar]
  13. Larsson, P.; Dekker, S.W.A.; Tingvall, C. The need for a systems theory approach to road safety. Saf. Sci. 2010. [Google Scholar] [CrossRef]
  14. Jameel, A.K.; Evdorides, H. Developing a safer road user behaviour index. IATSS Res. 2020. [Google Scholar] [CrossRef]
  15. Leonardi, S.; Distefano, N.; Pulvirenti, G. Multiple Correspondence Analysis (MCA) for the evaluation of risk perception of roundabouts for young people. Eur. Transp. Trasp. Eur. 2019, 72, e4. [Google Scholar]
  16. Kim, S.; Choi, J. Safety analysis of roundabout designs based on geometric and speed characteristics. KSCE J. Civ. Eng. 2013, 17, 1446–1454. [Google Scholar] [CrossRef]
  17. Turner, S.A.; Roozenburg, A.P.; Smith, A.W. Roundabout Crash Prediction Models; New Zealand Transport Agency: Wellington, New Zealand, 2009; ISBN 9780478352207.
  18. Lindenmann, H.P. Capacity of small roundabouts with two-lane entries. Transp. Res. Rec. 2006, 1988, 119–126. [Google Scholar] [CrossRef]
  19. St-Aubin, P.; Saunier, N.; Miranda-Moreno, L.; Ismail, K. Use of computer vision data for detailed driver behavior analysis and trajectory interpretation at roundabouts. Transp. Res. Rec. 2013. [Google Scholar] [CrossRef]
  20. Bastos, S.A.; DA Maia, S.Á.J.; DA Silva, J.P.C. Characterization of Trajectories Adopted at Roundabout Crossings. In Proceedings of the European Transport Conference (ETC), Strasburg, France, 18–20 September 2006. [Google Scholar]
  21. Tollazzi, T. Recent alternative types of roundabouts. In Tracts on Transportation and Traffic; Springer: Berlin/Heidelberg, Germany, 2015. [Google Scholar]
  22. Eisenman, S.; Josselyn, J.; List, G.; Persaud, B.; Lyon, C.; Robinson, B.; Blogg, M.; Waltman, E.; Troutbeck, R.J. Operational and Safety Performance of Modern Roundabouts and Other Intersection Types; New York State Department of Transportation: Albany, NY, USA, 2004.
  23. Isebrands, H.; Hallmark, S. Statistical analysis and development of crash prediction model for roundabouts on high-speed rural roadways. Transp. Res. Rec. 2012, 3–13. [Google Scholar] [CrossRef]
  24. Kennedy, J. International Comparison of Roundabout Design Guidelines; TRL Ltd.: Crowthorne, UK, 2007; pp. 6–56. [Google Scholar]
  25. Montella, A.; Turner, S.; Chiaradonna, S.; Aldridge, D. International overview of roundabout design practices and insights for improvement of the Italian standard. Can. J. Civ. Eng. 2013, 40, 1215–1226. [Google Scholar] [CrossRef]
  26. Italian Ministry of Infrastructures and Transports. Decree 19 April 2006: Guidelines for the Design of Road Intersections; No. 170/2006; Official Journal of Italian Republic: Rome, Italy, 2006.
  27. Young, K.L.; Salmon, P.M.; Lenné, M.G. At the cross-roads: An on-road examination of driving errors at intersections. Accid. Anal. Prev. 2013, 58, 226–234. [Google Scholar] [CrossRef]
  28. Uzondu, C.; Jamson, S.; Lai, F. Investigating unsafe behaviours in traffic conflict situations: An observational study in Nigeria. J. Traffic Transp. Eng. 2019. [Google Scholar] [CrossRef]
  29. Kass, G.V. An Exploratory Technique for Investigating Large Quantities of Categorical Data. Appl. Stat. 1980. [Google Scholar] [CrossRef]
  30. Şahin, B. Route Prioritization by using Fuzzy Analytic Hierarchy Process extended Dijkstra Algorithm. J. ETA Marit. Sci. 2019. [Google Scholar] [CrossRef]
  31. Sahin, B.; Soylu, A. Multi-Layer, Multi-Segment Iterative Optimization for Maritime Supply Chain Operations in a Dynamic Fuzzy Environment. IEEE Access 2020. [Google Scholar] [CrossRef]
  32. Lak, A.; Aghamolaei, R.; Myint, P.K. How Do Older Women Perceive their Safety in Iranian Urban Outdoor Environments? Ageing Int. 2020. [Google Scholar] [CrossRef]
  33. Pulvirenti, G.; Distefano, N.; Leonardi, S. Elderly perception of critical issues of pedestrian paths. Civ. Eng. Archit. 2020, 8, 26–37. [Google Scholar] [CrossRef]
  34. Wei, H.; Lee, P.T.W. Designing a coordinated horizontal alliance system for China’s inland ports with China railway express platforms along the Silk Road Economic Belt. Transp. Res. Part. E Logist. Transp. Rev. 2021. [Google Scholar] [CrossRef]
Figure 1. Details of the test route and of the roundabouts considered for the study.
Safety 07 00020 g001
Figure 2. Tree diagram obtained from CHAID analysis for unsafe driving behaviors at double-lane roundabouts.
Safety 07 00020 g002
Figure 3. Tree diagram obtained from CHAID analysis for entry unsafe behaviors at double-lane roundabouts.
Safety 07 00020 g003
Figure 4. Tree diagram obtained from CHAID analysis for circulation unsafe behaviors at double-lane roundabouts.
Safety 07 00020 g004
Table 1. Features of participants.
CategoryNumberPercentage
Age
18–252233.33
26–502639.39
51–651827.28
Gender
Male 4162.12
Female2537.88
Table 2. Unsafe driving behaviors types at double-lane roundabouts.
Entry Unsafe Behaviors
NSchemeType
1 Safety 07 00020 i001High speed of approach:
Approaching the roundabout with a speed higher than the speed limit
2 Safety 07 00020 i002Selecting unsafe gap:
Selecting unsafe gap when entering the roundabout
3 Safety 07 00020 i003Rejecting a safe gap:
Rejecting a safe gap when entering the roundabout
4 Safety 07 00020 i004Turn signal omitted:
Changing lane on the entry leg without using the turn signal to indicate it
5 Safety 07 00020 i005Failing to detect proper lane when entering:
Selecting the inner lane (external lane) of the circulatory roadway coming from the right lane (left lane) of the entry leg
Circulation Unsafe Behaviors
NSchemeType
6 Safety 07 00020 i006Splitting other users’ lanes:
The driver splits other users’ lanes on the circulatory roadway in order to exit the roundabout
7 Safety 07 00020 i007Giving way:
Giving way to incoming vehicle when circulating the roundabout
8 Safety 07 00020 i008Failing to detect proper lane when circulating:
The driver selects the inner lane of the circulatory roadway, even if they take the external lane of the exit lane
9 Safety 07 00020 i009Failing to detect proper lane when taking the first exit:
The driver selects the inner lane of the circulatory roadway, even if they have to take the first exit
Exit Unsafe Behaviors
NSchemeType
10 Safety 07 00020 i010Failing to detect proper lane when exiting:
Selecting the inner lane of the exit lane coming from the external lane of the circulatory roadway
11 Safety 07 00020 i011High exit speed:
Exiting the roundabout with a speed higher than the speed limit
Table 3. Number of unsafe behaviors observed.
NumberPercentage (%)
Entry unsafe behaviors
1High speed of approach53324.56
2Selecting unsafe gap1818.34
3Rejecting a safe gap351.61
4Turn signal omitted1677.69
5Failing to detect proper lane when entering33915.62
Total125557.84
Circulation unsafe behaviors
6Splitting other users’ lanes1808.29
7Giving way874.01
8Failing to detect proper lane when circulating25711.84
9Failing to detect proper lane when taking the 1st exit703.26
Total59427.37
Exit unsafe behaviors
10Failing to detect proper lane when exiting50.23
11High exit speed31614.56
Total32114.79
Total unsafe behaviors2170100.00
Table 4. CHAID (chi-square automatic interaction detection) analysis independent variables.
VariableVariable NameCategories
V1Roundabout radius (RR)<14 m
14–20 m
>20 m
V2Circulatory roadway width (CW)<8 m
>8 m
V3Entry width (EnW)<8 m
>8 m
V4Exit width (ExW)<8 m
>8 m
V5Entry radius (EnR)<10 m
10–30 m
30–50 m
>50 m
V6Exit radius (ExR)<10 m
10–30 m
30–50 m
>50 m
V7Maneuver (M)1st exit
2nd exit
3rd exit
U-turn
Table 5. Method summary.
SpecificationsGrowing methodCHAID
Dependent variableUDB
Independent variablesV1, V2, V3, V4, V5, V6, V7
ValidationCross-validation
Maximum tree depth3
Minimum Cases in Parent Node40
Minimum Cases in Child Node15
ResultsIndependent variables includedV5, V7, V4
Number of Nodes11
Number of Terminal Nodes7
Depth3
Table 6. Method summary.
SpecificationsGrowing methodCHAID
Dependent variableEUB
Independent variablesV1, V2, V3, V4, V5, V6, V7
ValidationCross-validation
Maximum tree depth3
Minimum cases in parent node40
Minimum cases in child node15
ResultsIndependent variables includedV7, V5, V1
Number of nodes12
Number of terminal nodes8
Depth2
Table 7. Model summary.
SpecificationsGrowing methodCHAID
Dependent variableCUB
Independent variablesV1, V2, V3, V4, V5, V6, V7
ValidationCross-validation
Maximum tree depth3
Minimum cases in parent node40
Minimum cases in child node15
ResultsIndependent variables includedV7, V6, V5
Number of nodes8
Number of terminal nodes5
Depth2
Publisher’s Note: MDPI stays neutral with regard to jurisdictional claims in published maps and institutional affiliations.

