

Evaluation of a Linear Measurement Tool in Virtual Reality for Assessment of Multimodality Imaging Data—A Phantom Study
 ,
,
Abstract
:1. Introduction
2. Materials and Methods
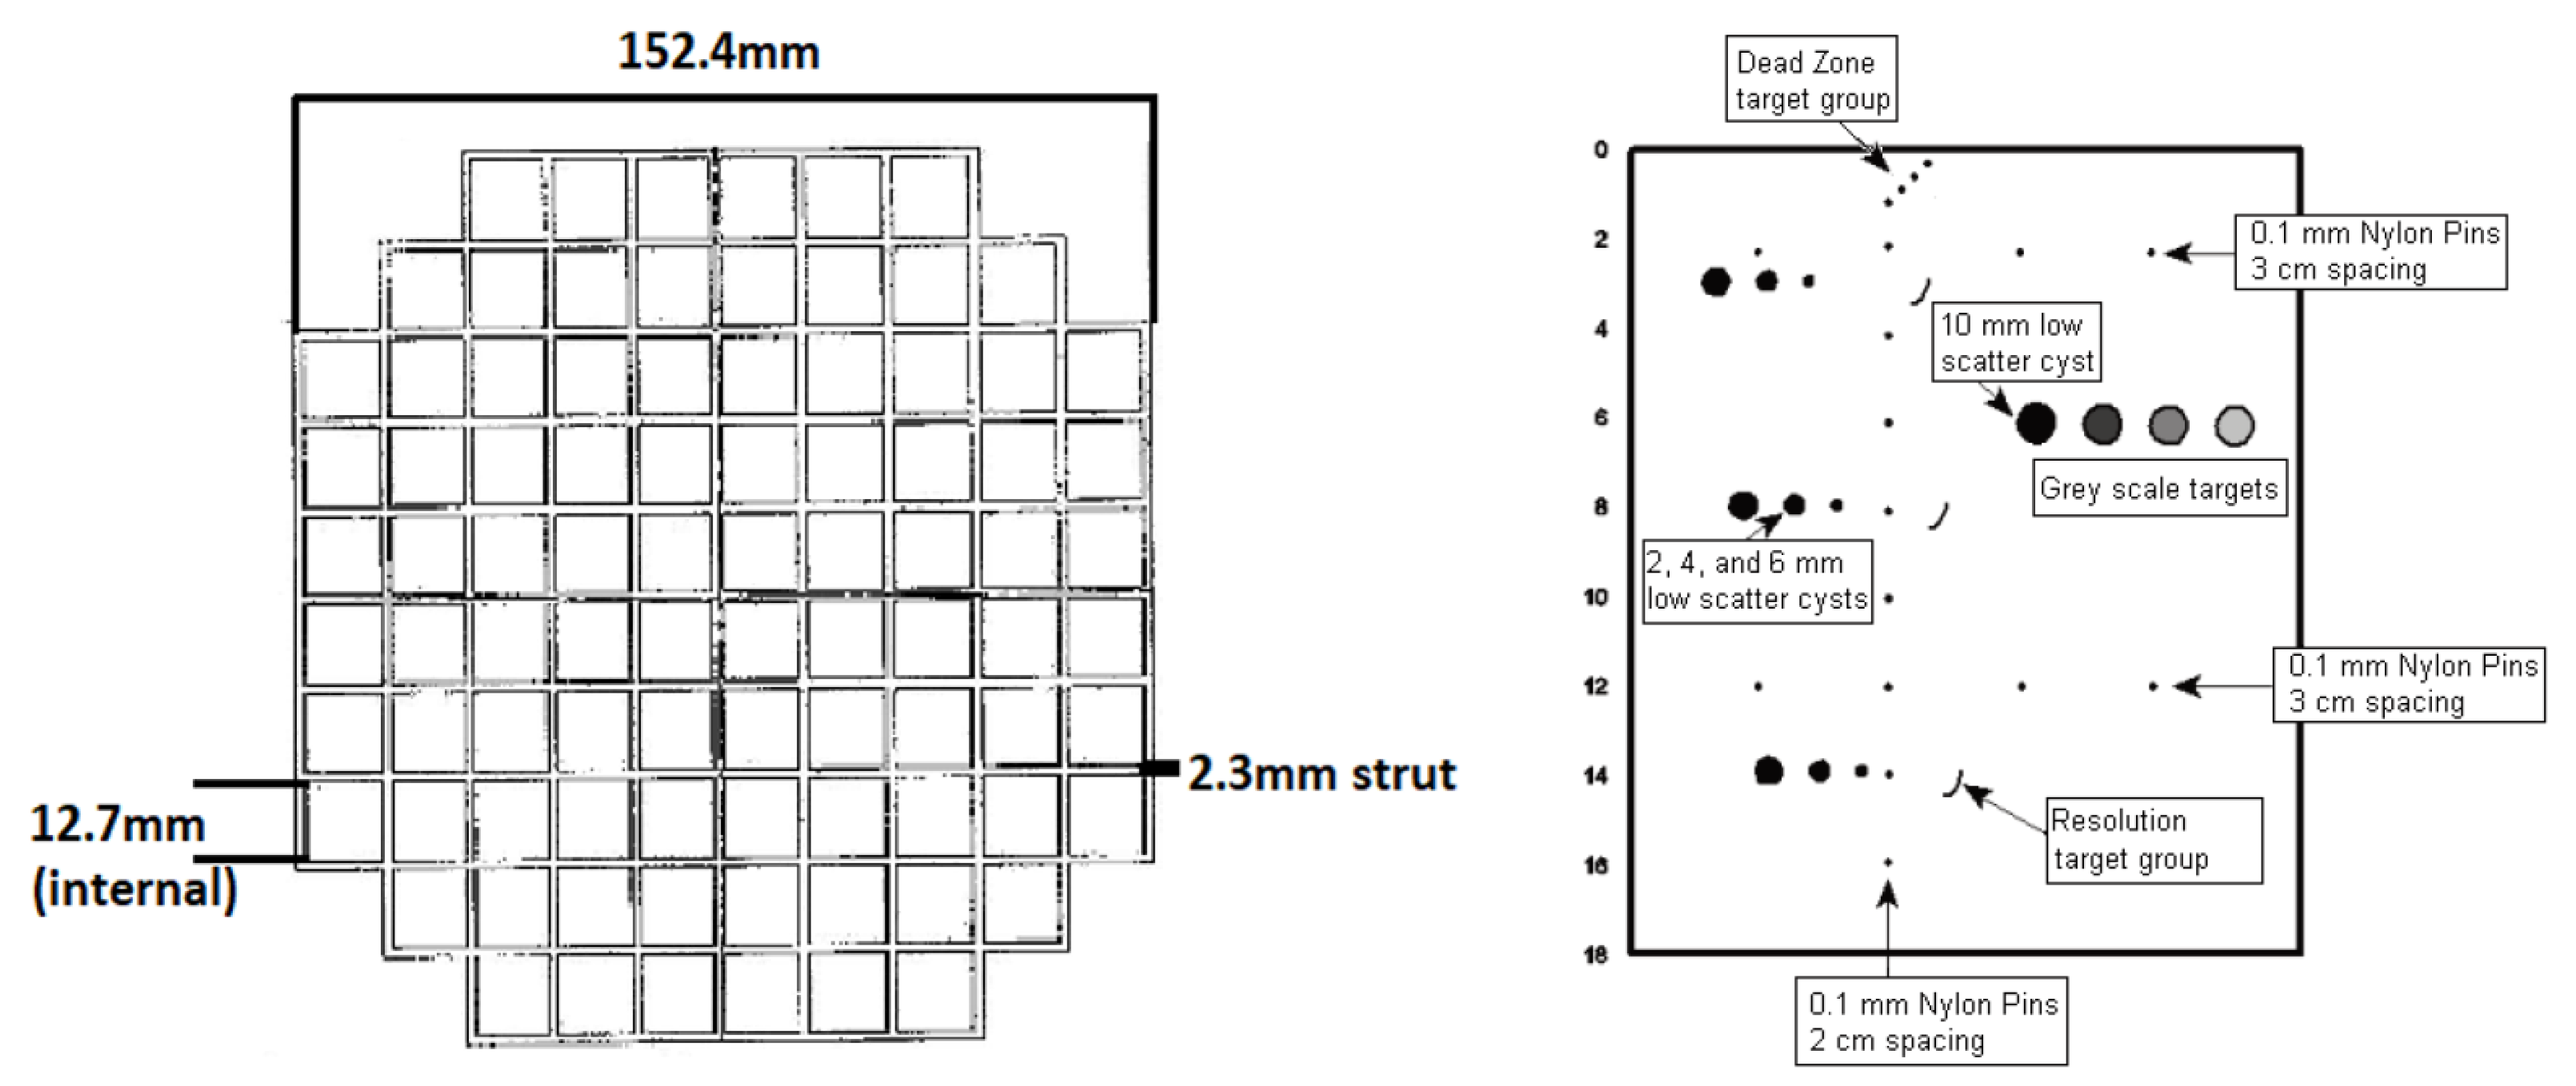
2.1. Phantoms
2.2. Image Acquisition
2.3. Three-Dimensional Image Visualisation and Measurement
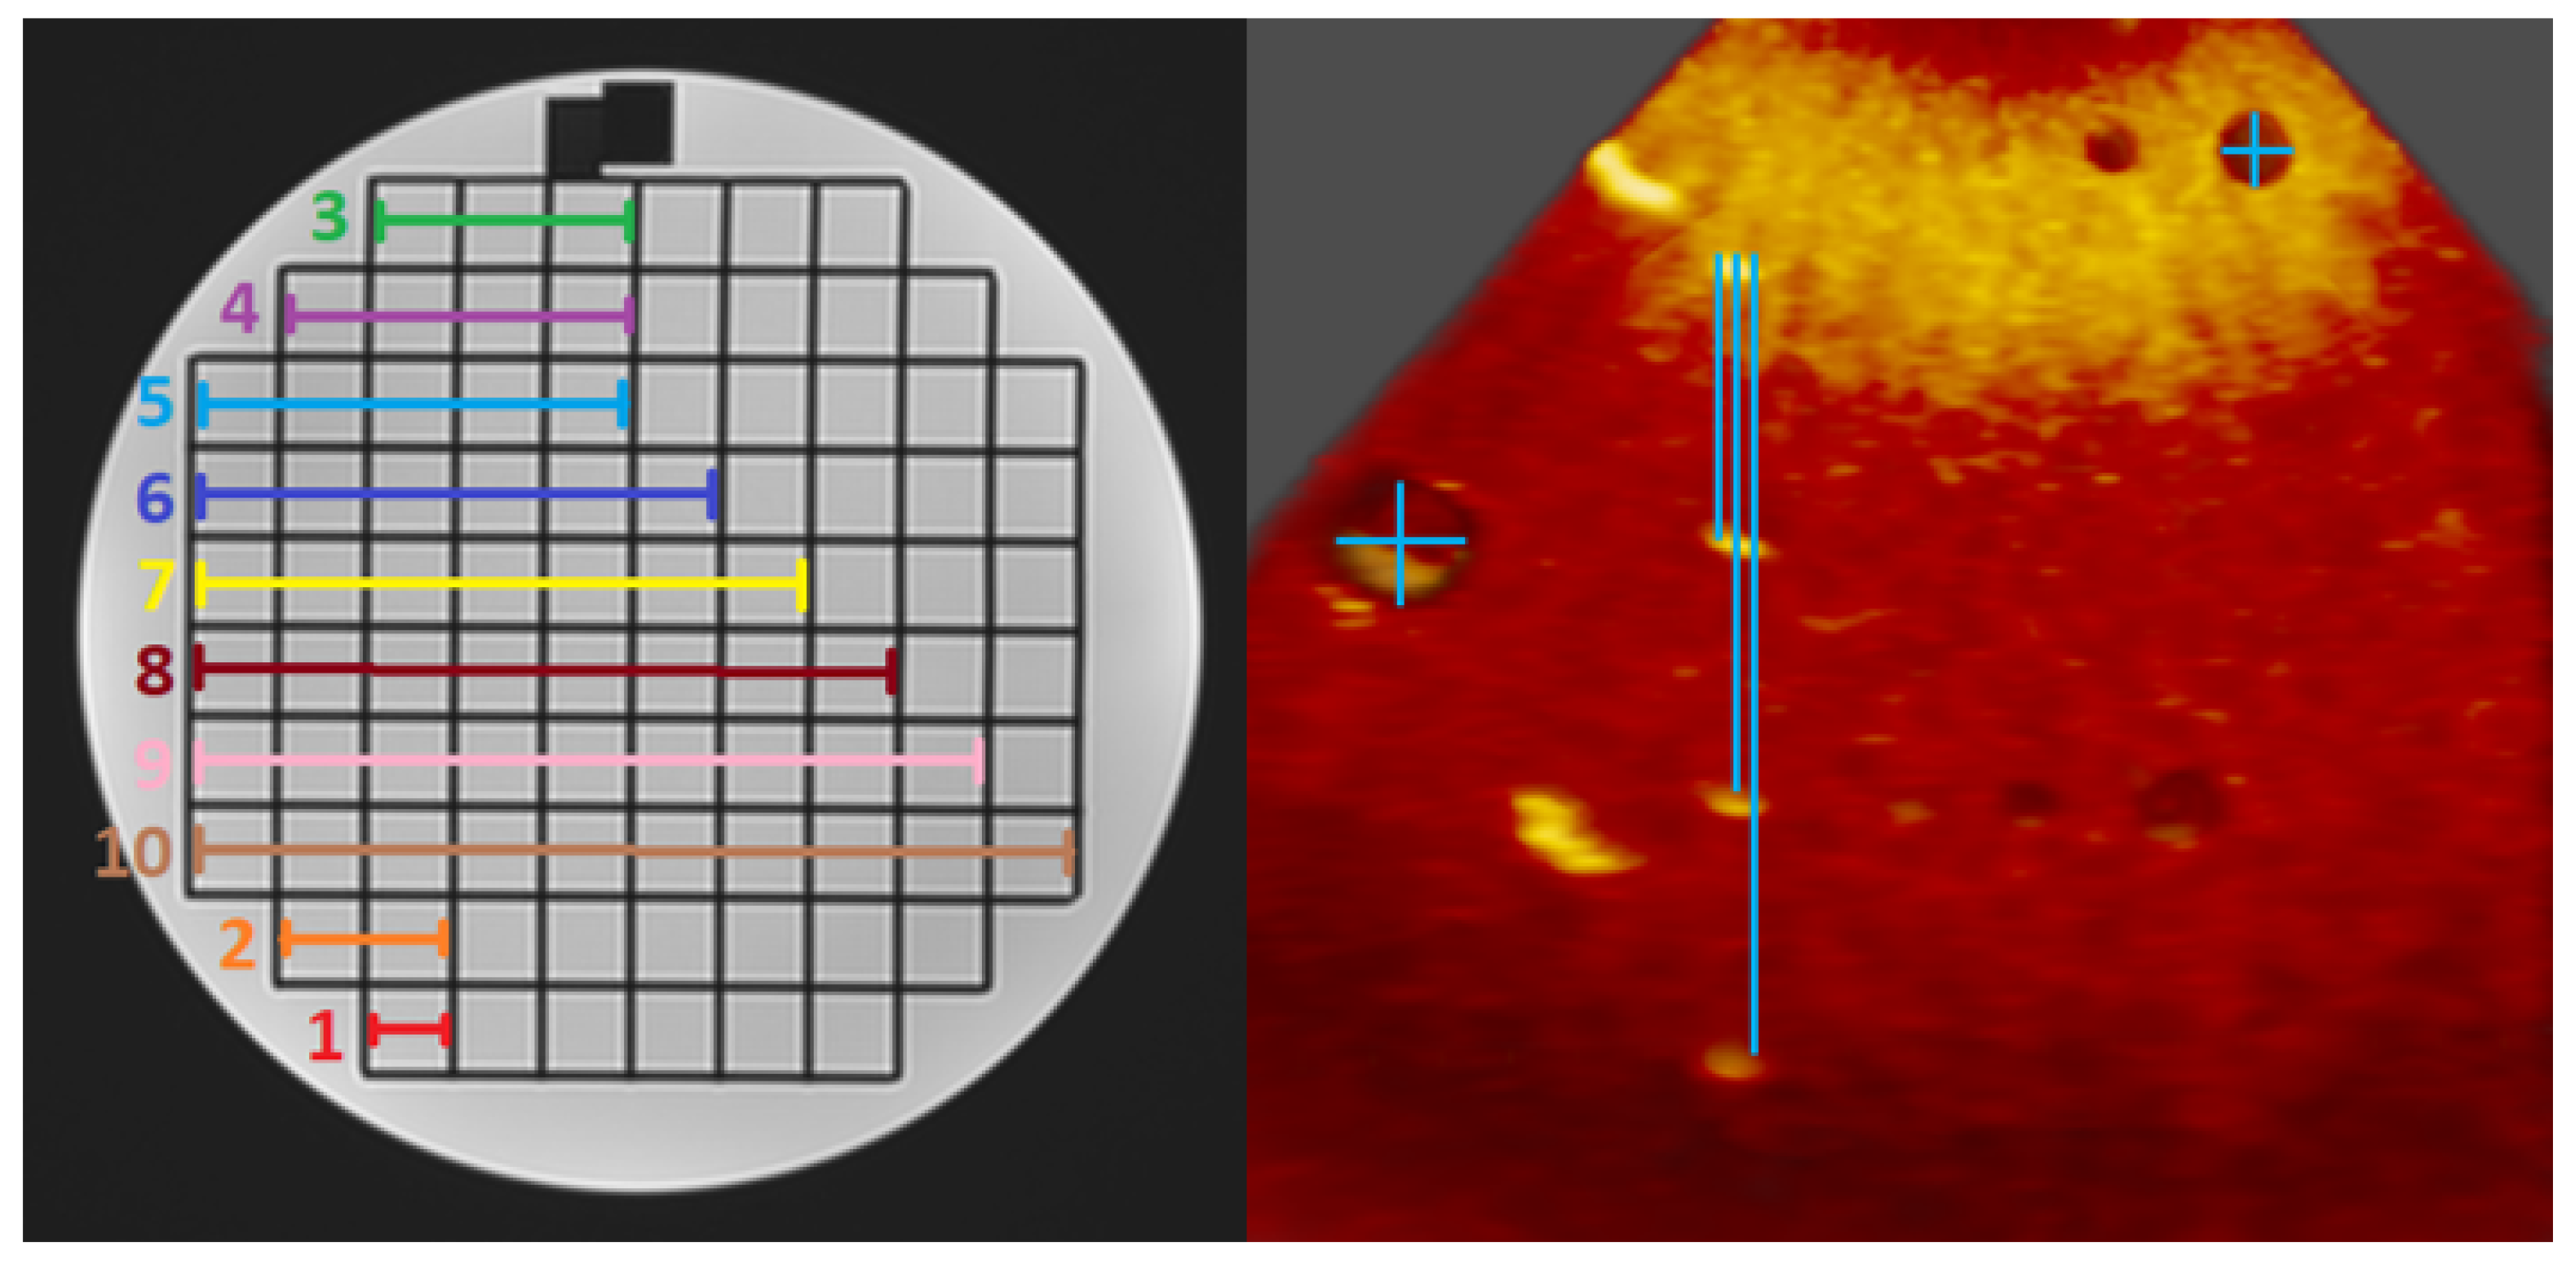
2.4. Phantom Measurement Protocol
2.5. Statistical Analysis
3. Results
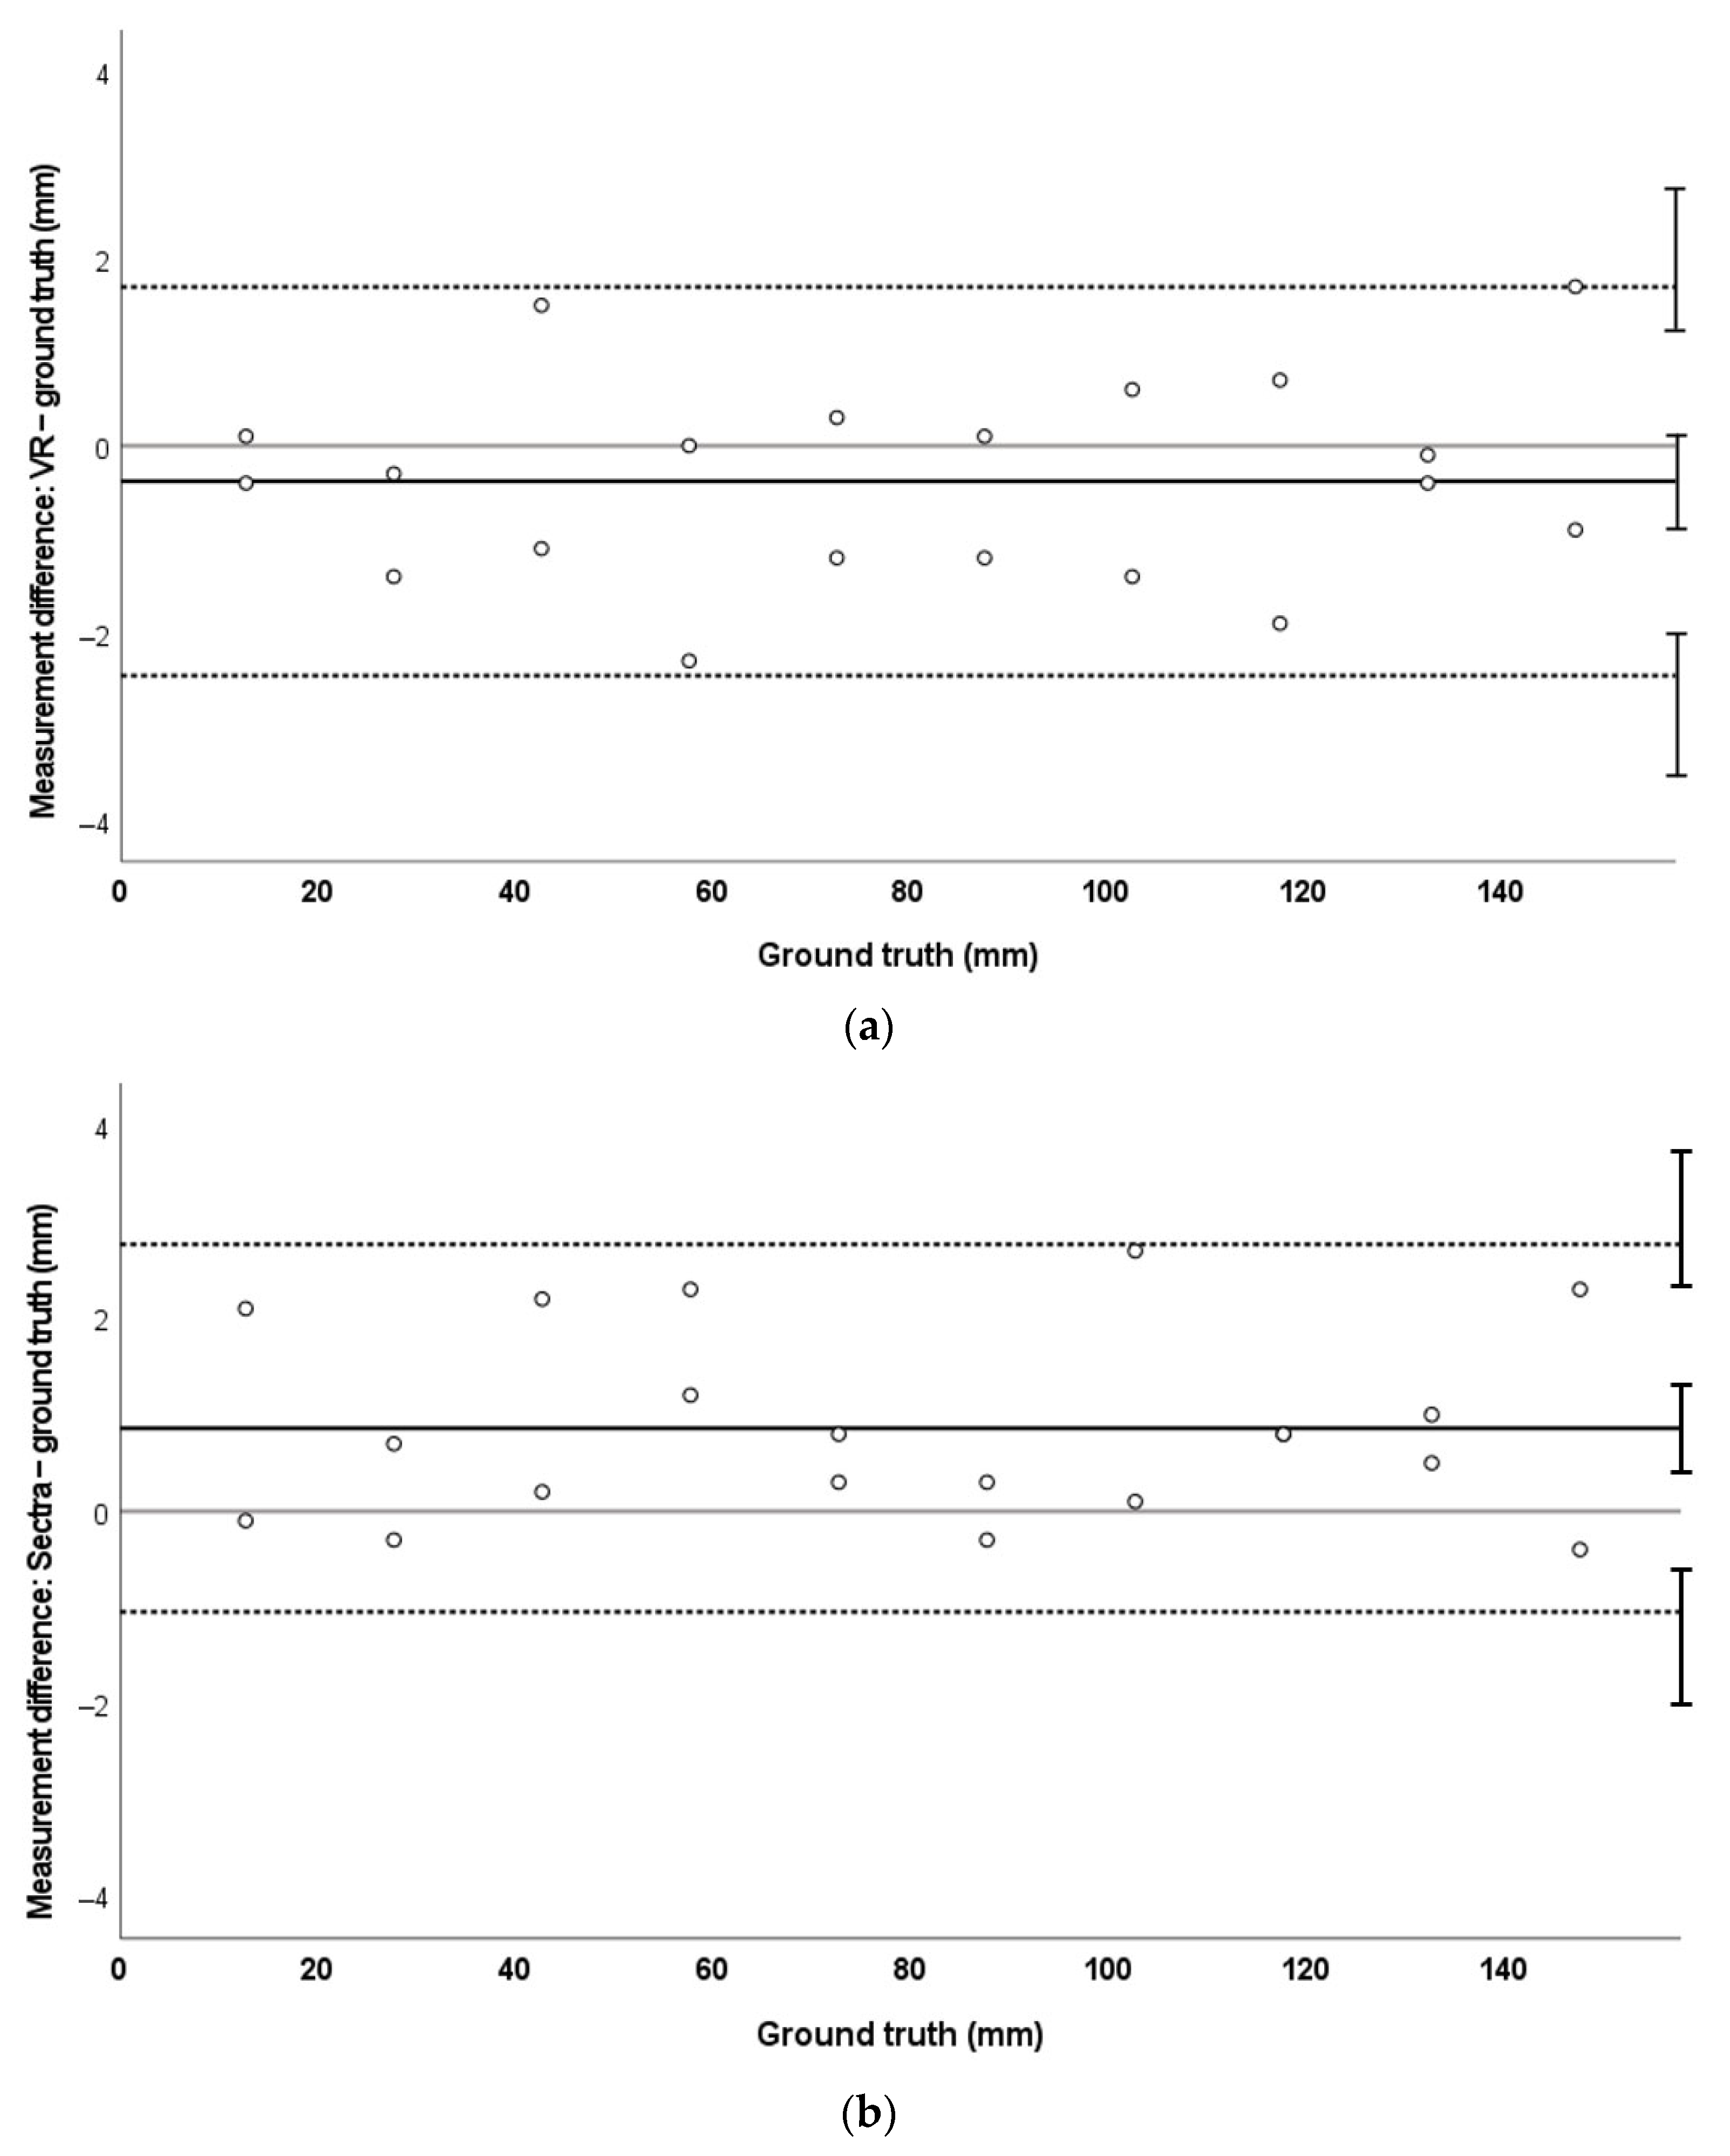
3.1. MRI
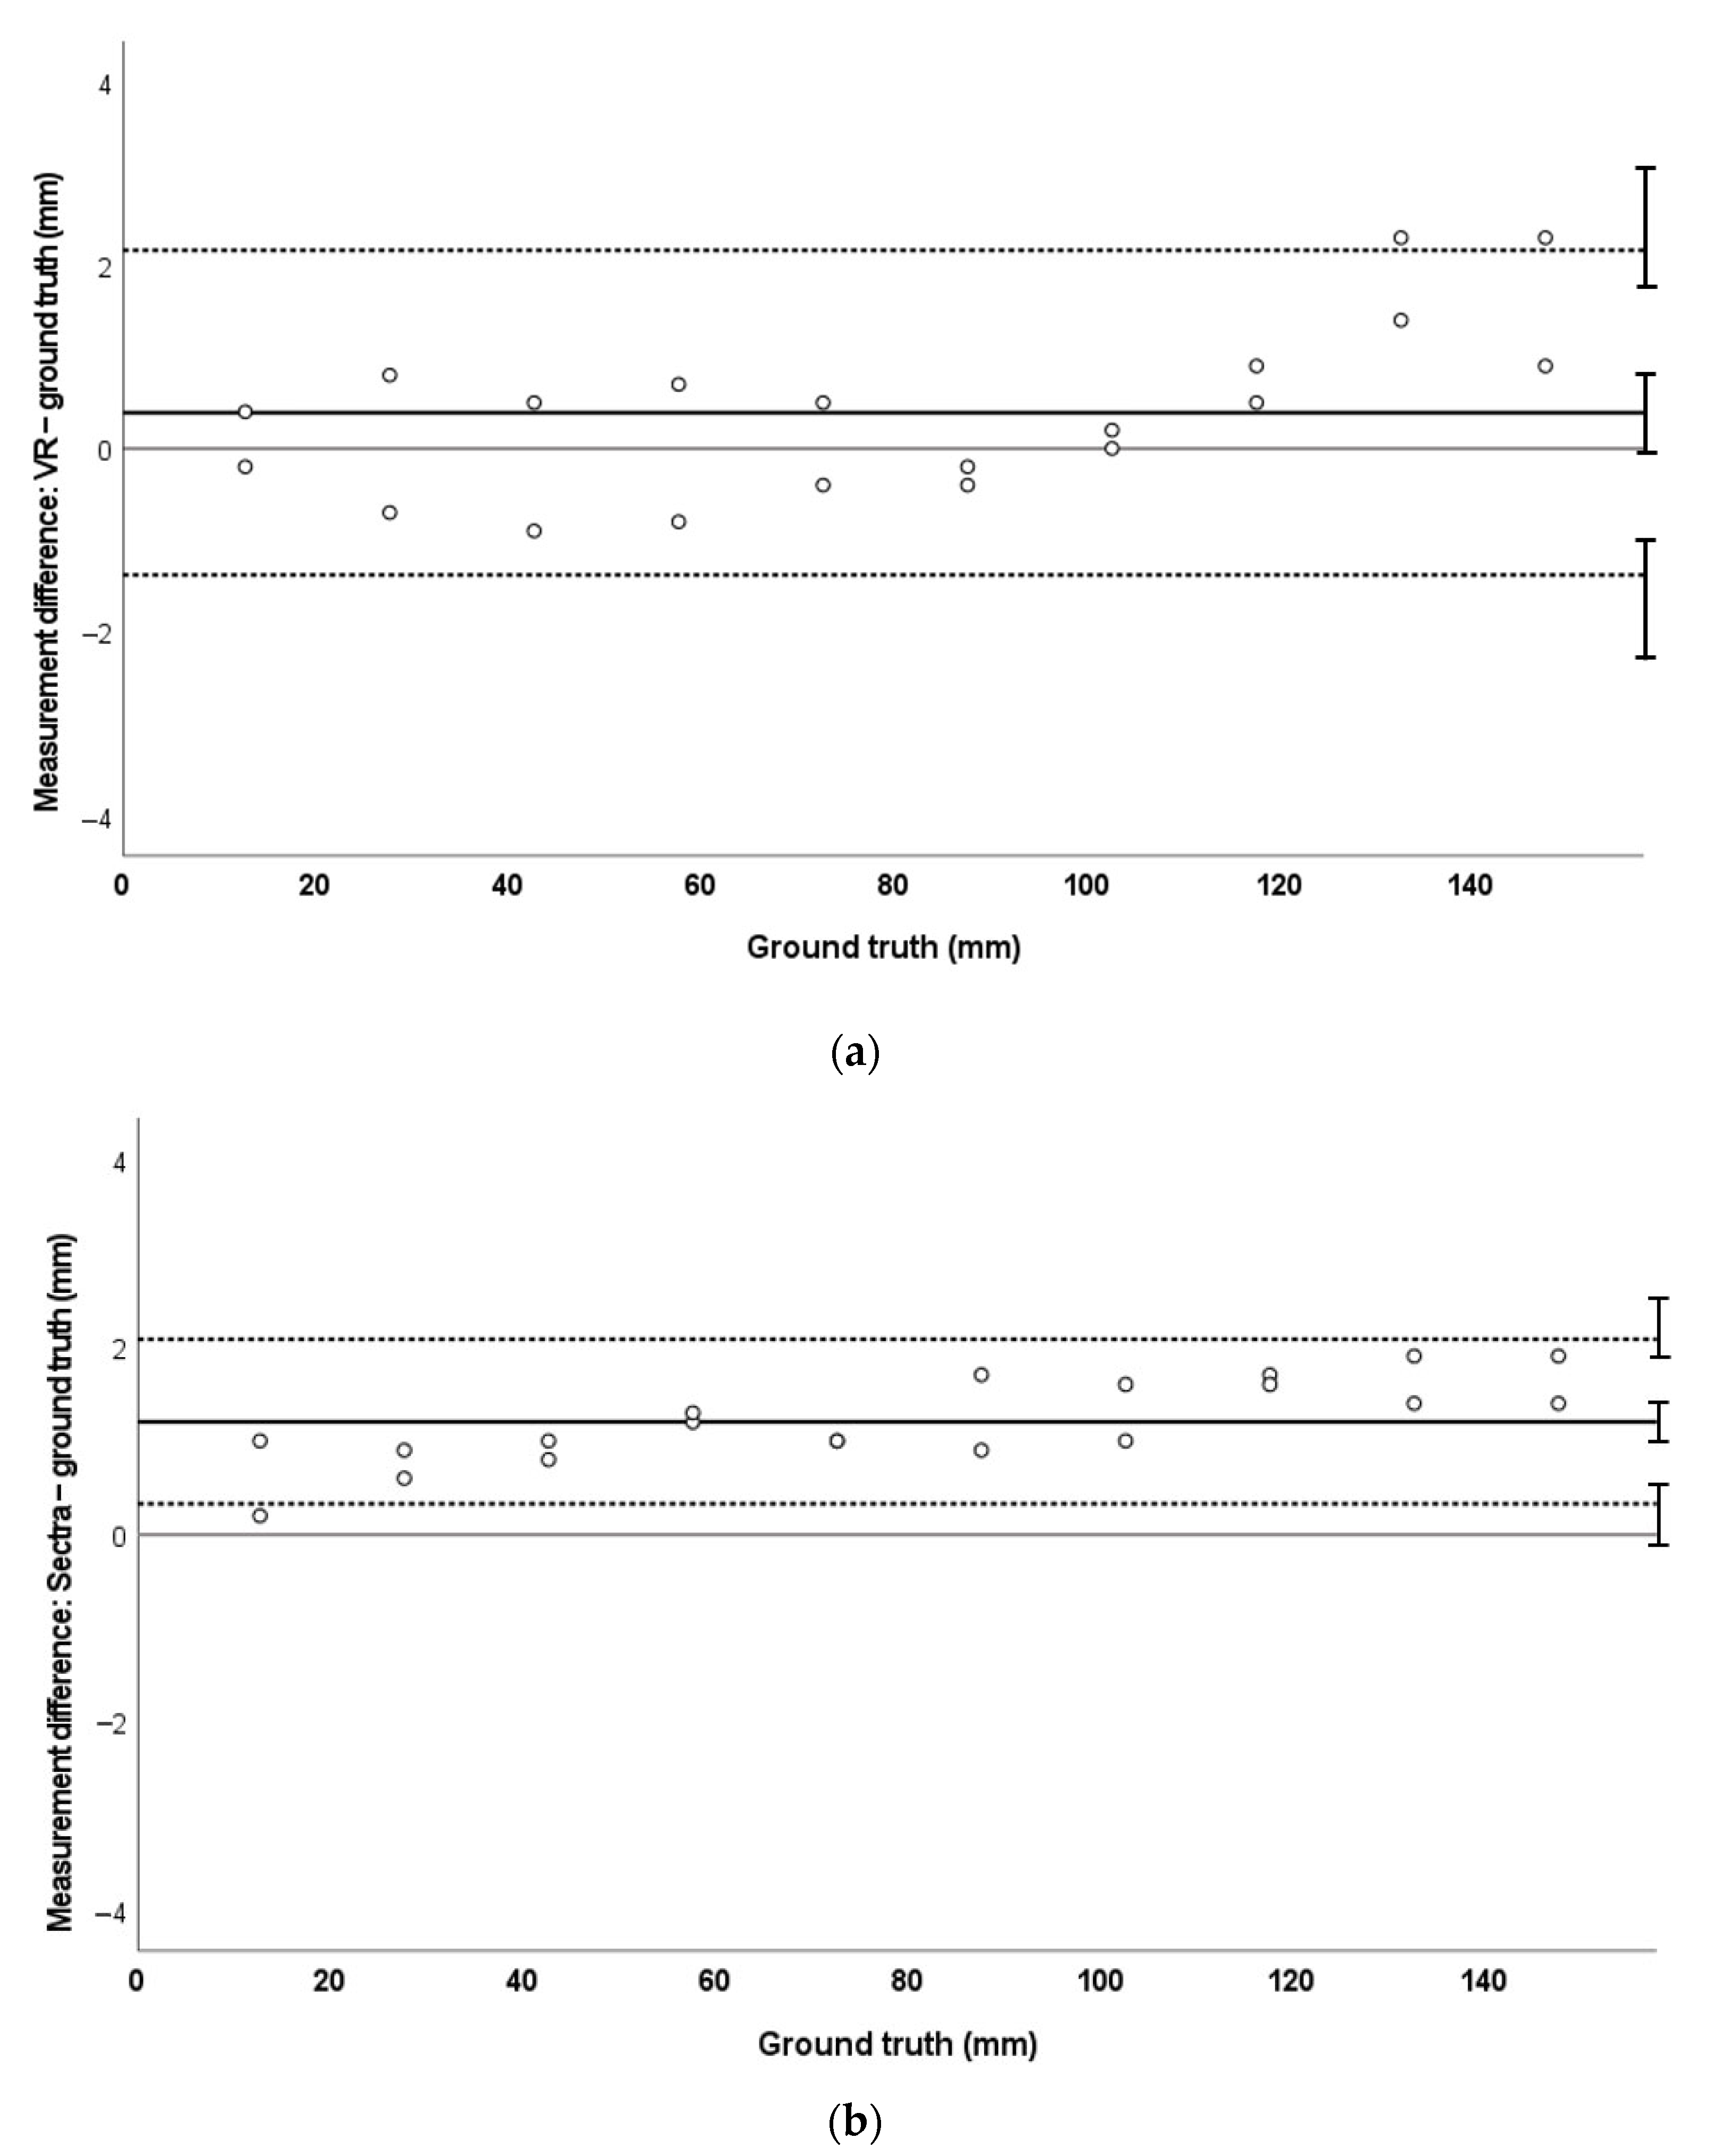
3.2. CT
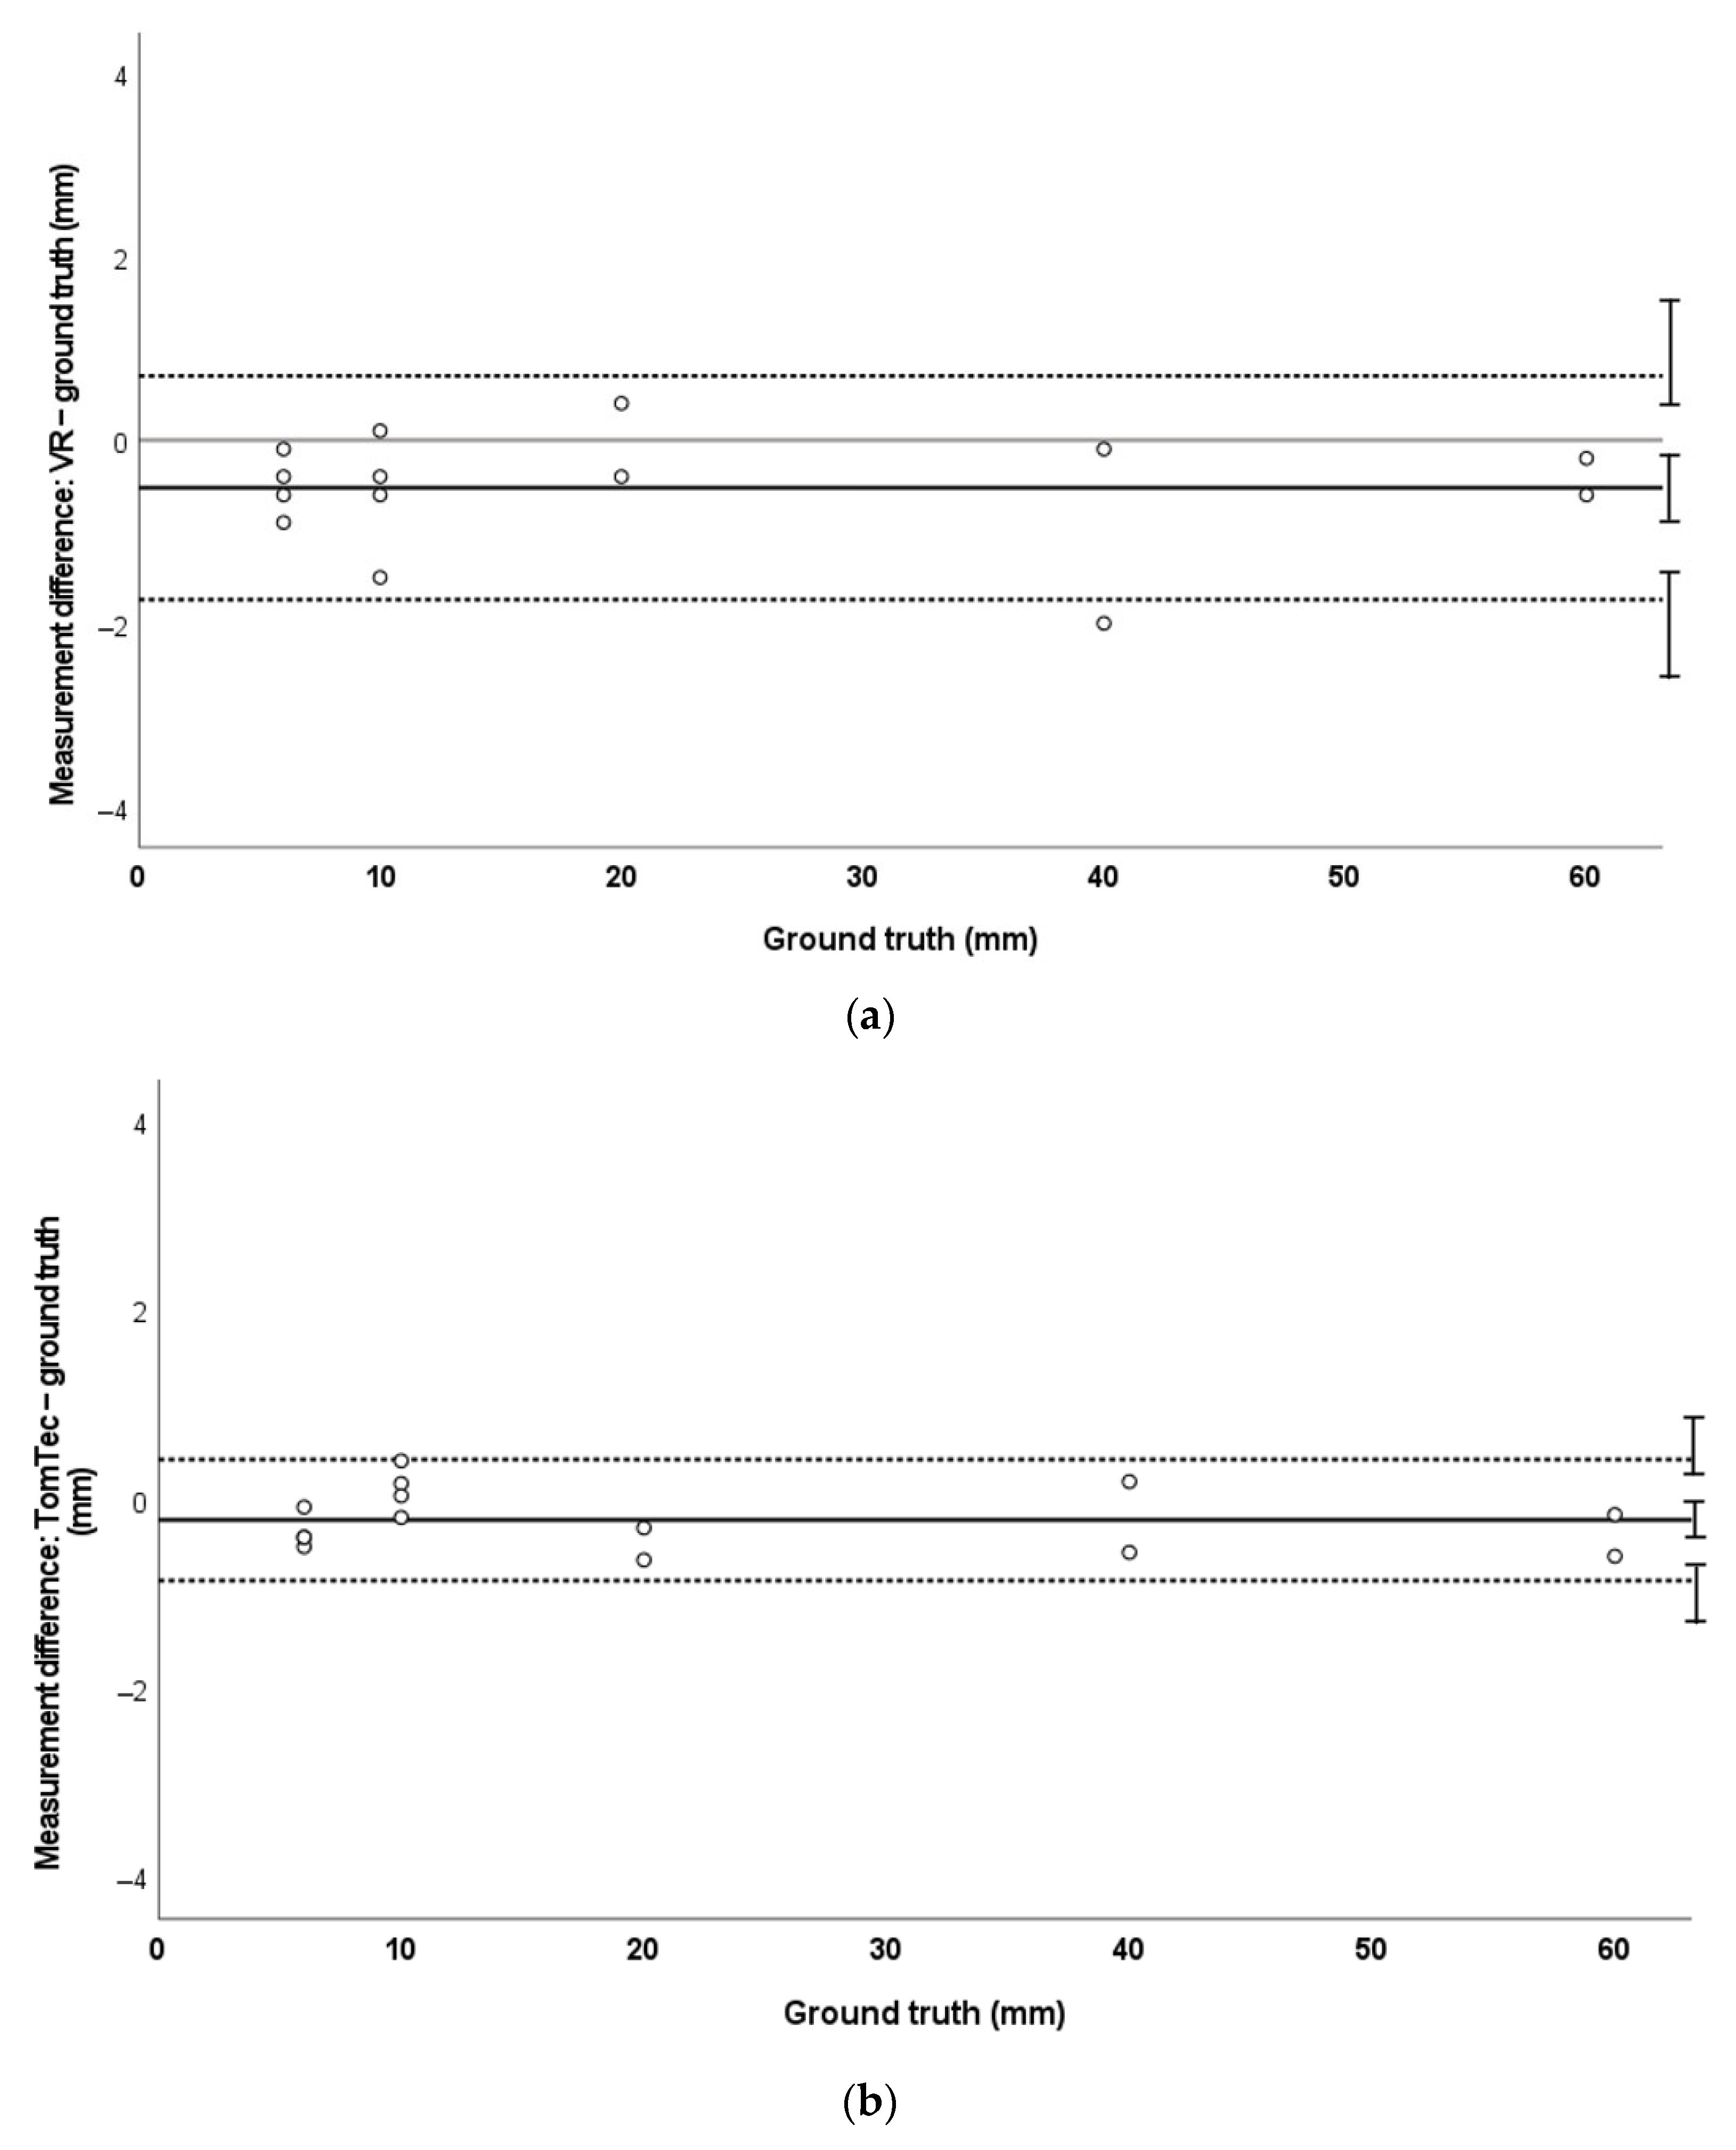
3.3. Three-Dimensional Echocardiography
4. Discussion
Limitations
5. Conclusions
Author Contributions
Funding
Institutional Review Board Statement
Informed Consent Statement
Data Availability Statement
Acknowledgments
Conflicts of Interest
References
- Lu, J.C.; Ensing, G.J.; Ohye, R.G.; Romano, J.C.; Sassalos, P.; Owens, S.T.; Thorsson, T.; Yu, S.; Lowery, R.; Si, M.-S. Stereoscopic Three-Dimensional Visualization for Congenital Heart Surgery Planning: Surgeons’ Perspectives. J. Am. Soc. Echocardiogr. 2020, 33, 775–777. [Google Scholar] [CrossRef] [PubMed]
- Aly, A.H.; Gorman, R.C.; Stauffer, M.; Patel, P.A.; Gorman, J.H.; Pouch, A.M. Virtual reality for visualization and assessment of mitral valve geometry in structural heart disease. Circulation 2019, 140 (Suppl. 1), A16182. [Google Scholar]
- Tandon, A.; Burkhardt, B.E.U.; Batsis, M.; Zellers, T.M.; Velasco Forte, M.N.; Valverde, I.; McMahan, R.P.; Guleserian, K.J.; Greil, G.F.; Hussain, T. Sinus Venosus Defects: Anatomic Variants and Transcatheter Closure Feasibility Using Virtual Reality Planning. JACC Cardiovasc. Imaging 2019, 12, 921–924. [Google Scholar] [CrossRef] [PubMed]
- Ballocca, F.; Meier, L.M.; Ladha, K.; Hiansen, J.Q.; Horlick, E.M.; Meineri, M. Validation of Quantitative 3-Dimensional Transesophageal Echocardiography Mitral Valve Analysis Using Stereoscopic Display. J. Cardiothorac. Vasc. Anesth. 2019, 33, 732–741. [Google Scholar] [CrossRef] [PubMed]
- Kamiya, K.; Matsubayashi, Y.; Mori, Y.; Wakisaka, H.; Lee, J.; Minamidate, N.; Takashima, N.; Kinoshita, T.; Suzuki, T.; Nagatani, Y.; et al. A virtual-reality imaging analysis of the dynamic aortic root anatomy. Ann. Thorac. Surg. 2021, 112, 2077–2083. [Google Scholar] [PubMed]
- Narang, A.; Hitschrich, N.; Mor-Avi, V.; Schreckenberg, M.; Schummers, G.; Tiemann, K.; Hitschrich, D.; Sodian, R.; Addetia, K.; Lang, R.M.; et al. Virtual Reality Analysis of Three-Dimensional Echocardiographic and Cardiac Computed Tomographic Data Sets. J. Am. Soc. Echocardiogr. 2020, 33, 1306–1315. [Google Scholar] [CrossRef] [PubMed]
- Wheeler, G.; Deng, S.; Pushparajah, K.; Schnabel, J.A.; Simpson, J.M.; Gomez, A. Virtual linear measurement system for accurate quantification of medical images. Healthc. Technol. Lett. 2019, 6, 220–225. [Google Scholar] [CrossRef] [PubMed]
- Sadeghi, A.H.; Ooms, J.F.; Bakhuis, W.; Taverne, Y.J.H.J.; Van Mieghem, N.M.; Bogers, A.J.J.C. Immersive Virtual Reality Heart Models for Planning of Transcatheter Paravalvular Leak Closure: A Feasibility Study. JACC Cardiovasc. Interv. 2021, 14, 1854–1856. [Google Scholar] [CrossRef] [PubMed]
- BIPM. International Vocabulary of Metrology—Basic and General Concepts and Associated Terms (VIM); Springer: Berlin/Heidelberg, Germany, 2012. [Google Scholar]
- Deng, S.; Wheeler, G.; Toussaint, N.; Munroe, L.; Bhattacharya, S.; Sajith, G.; Lin, E.; Singh, E.; Chu, K.Y.K.; Kabir, S.; et al. A Virtual Reality System for Improved Image-Based Planning of Complex Cardiac Procedures. J. Imaging 2021, 7, 151. [Google Scholar] [CrossRef] [PubMed]
- Wheeler, G.; Deng, S.; Toussaint, N.; Pushparajah, K.; Schnabel, J.A.; Simpson, J.M.; Gomez, A. Virtual interaction and visualisation of 3D medical imaging data with VTK and Unity. Healthc. Technol. Lett. 2018, 5, 148–153. [Google Scholar] [CrossRef] [PubMed]
- Bland, J.M.; Altman, D.G. Statistical methods for assessing agreement between two methods of clinical measurement. Lancet 1986, 1, 307–310. [Google Scholar] [PubMed]
- Koo, T.K.; Li, M.Y. A Guideline of Selecting and Reporting Intraclass Correlation Coefficients for Reliability Research. J. Chiropr. Med. 2016, 15, 155–163. [Google Scholar] [CrossRef] [PubMed] [Green Version]
- Bland, J.M.; Altman, D.G. Statistics Notes: Measurement error. BMJ 1996, 313, 744. [Google Scholar] [CrossRef] [PubMed]
- Fellbach, V.D.C.V. Bericht 4: Head-Mounted Displays: Messung Räumlicher Präzision bei VR-Trackingsystemen (German); Ministerium für Wirtschaft, Arbeit und Wohnungsbau Baden-Württemberg; Figshare: London, UK, 2020. [Google Scholar]
- Hayden, S. Vive Cosmos Rated Least Accurate among Top Headsets in Controller Tracking Test. 2020. Available online: https://www.roadtovr.com/htc-vive-cosmos-accuracy-test-controller/ (accessed on 1 September 2022).


| VR | Standard Display | |||||||
|---|---|---|---|---|---|---|---|---|
| MRI | CT | 3DE (All) | 3DE (>10 mm) | MRI | CT | 3DE (All) | 3DE (>10 mm) | |
| Intraobserver | ||||||||
| ICC (95% CI) | 1.00 (1.00–1.00) | 1.00 (1.00–1.00) | 1.00 (0.99–1.00) | 1.00 (0.82–1.00) | 1.00 (1.00–1.00) | 1.00 (1.00–1.00) | 1.00 (1.00–1.00) | 1.00 (0.99–1.00) |
| CV (%) | 1.39 | 1.87 | 4.70 | 1.67 | 1.76 | 1.46 | 1.73 | 0.57 |
| Interobserver | ||||||||
| ICC (95% CI) | 1.00 (1.00–1.00) | 1.00 (0.99–1.00) | 0.99 (0.99–1.00) | 0.999 (0.97–1.00) | 0.99 (0.99–1.00) | 1.00 (0.99–1.00) | 1.00 (0.99–1.00) | 1.00 (0.99–1.00) |
| CV (%) | 2.28 | 1.90 | 6.01 | 2.59 | 3.09 | 0.61 | 2.36 | 1.09 |
Publisher’s Note: MDPI stays neutral with regard to jurisdictional claims in published maps and institutional affiliations. |
© 2022 by the authors. Licensee MDPI, Basel, Switzerland. This article is an open access article distributed under the terms and conditions of the Creative Commons Attribution (CC BY) license (https://creativecommons.org/licenses/by/4.0/).
Share and Cite
Stephenson, N.; Pushparajah, K.; Wheeler, G.; Deng, S.; Schnabel, J.A.; Simpson, J.M. Evaluation of a Linear Measurement Tool in Virtual Reality for Assessment of Multimodality Imaging Data—A Phantom Study. J. Imaging 2022, 8, 304. https://doi.org/10.3390/jimaging8110304
Stephenson N, Pushparajah K, Wheeler G, Deng S, Schnabel JA, Simpson JM. Evaluation of a Linear Measurement Tool in Virtual Reality for Assessment of Multimodality Imaging Data—A Phantom Study. Journal of Imaging. 2022; 8(11):304. https://doi.org/10.3390/jimaging8110304
Chicago/Turabian StyleStephenson, Natasha, Kuberan Pushparajah, Gavin Wheeler, Shujie Deng, Julia A. Schnabel, and John M. Simpson. 2022. "Evaluation of a Linear Measurement Tool in Virtual Reality for Assessment of Multimodality Imaging Data—A Phantom Study" Journal of Imaging 8, no. 11: 304. https://doi.org/10.3390/jimaging8110304