The Neutron Imaging Instrument CONRAD—Post-Operational Review

 , , , , and
Abstract
:
1. Chronology
2. Scientific Case
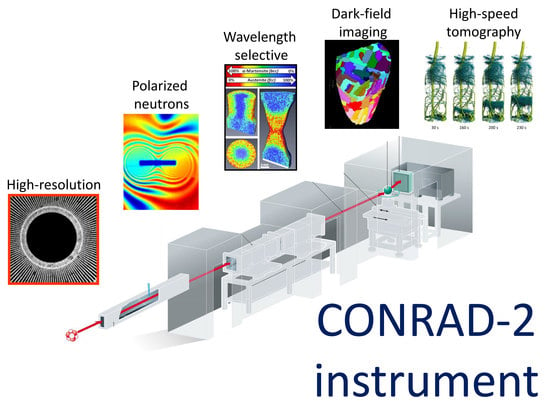
2.1. Attenuation Contrast Imaging Using a Direct Mode
2.2. Beyond Attenuation Contrast, Various Scientifically Promising Fields Have Emerged
3. Scientific Output and User Statistics
3.1. Overload Factors
3.2. Instrument Profile and User Statistics
- -
- Material sciences: investigation of morphology and phase transition in metals, like hydrogen embrittlement and austenitic-martensitic phase transition in steels and 3D mapping of cracking and pore distribution in metals, glasses and metallic foam samples.
- -
- Energy sciences: in-situ and ex-situ investigation of dynamic processes in fuel cells, batteries and hydrogen storage materials.
- -
- Geo sciences: water and oil imbibition in rocks, crack propagation and morphological changes in geological samples.
- -
- Life science: plant physiology and soil-root interaction, bone implants and exchange mechanisms in bones and teeth.
- -
- Cultural heritage: investigation of ancient statues, medieval swords and armor attributes, ancient bronze statues and metallic artefacts and paleontological samples from the collection of the Museum of Natural History Berlin.
- -
- Magnetism: fundamental research in the fields of superconductivity and phase transitions in magnetic materials.
- -
- Radiography: observation of dynamic process with moderate time and spatial resolutions (e.g., exposure of seconds and pixel size larger than 20 µm) by recording of 2D transmission images of the sample.
- -
- Tomography: recording of 2D angular projections of the sample with moderate time and spatial resolutions (e.g., exposure of seconds and pixel size larger than 20 µm) and subsequent reconstruction of the 3D tomographic volume using a filtered back-projection algorithm.
- -
- High-resolution: using a high-resolution detector system with pixel size less than 20 µm and thin Gadox scintillator (less than 20 µm).
- -
- High-speed: using a high-speed camera and optimized detector system (200 µm 6LiZnS scintillator and light efficient lens system) resulting in exposures of 50–100 ms enabling on-the-fly tomography experiments with bellow one-minute temporal resolution.
- -
- Wavelength-resolved imaging: using the double-crystal monochromator or the velocity selector devices to select a certain neutron wavelength in the range from 1.5 Å to 6.0 Å or to perform a wavelength scan with small steps of typically 0.02 Å for Bragg-edge mapping or contrast enhancement.
- -
- Grating interferometry: using the Talbot-Lau grating interferometry setup in order to perform dark-field or phase-contrast imaging experiments for visualization of magnetic domain walls in electric steels or porosity in additively manufactured metal samples.
- -
- Polarized neutron imaging: using polarizer-analyzer arrangement based on solid state benders for recording the contrast produced by the spin precession of polarized neutron in external or intrinsic magnetic fields.
3.3. Scientific Output
4. Conclusions
- ○
- The neutron imaging instruments CONRAD-1/2 served a broad user community from 2005 to the end of 2019, which is reflected in a large number of publications with high scientific as well as societal impact.
- ○
- The improved spatial and temporal resolution capabilities of the instrument, together with the developed and implemented innovative experimental methods including wavelength-selective, dark-field, phase-contrast and polarized neutron imaging, allowed for unique experiments in different scientific fields. Scientific highlights produced by the CONRAD-1/2 instrument are related in particular to polarized neutron imaging, dark-field tomography, wavelength-selective imaging, high-resolution neutron imaging and complementary use of X-ray tomography.
- ○
- The CONRAD-2 instrument stopped its operation due to the shutdown of the research reactor BER II on 11 December 2019.
- ○
- Scientific know-how and advanced hardware will be transferred to the Institute Max Von Laue Paul Langevin (ILL), Grenoble, France in the frame of the Joint Research Unit Ni-Matters.
Author Contributions
Funding
Institutional Review Board Statement
Informed Consent Statement
Data Availability Statement
Conflicts of Interest
References
- Hilger, A.; Kardjilov, N.; Strobl, M.; Treimer, W.; Banhart, J. The new cold neutron radiography and tomography instrument CONRAD at HMI Berlin. Phys. B Condens. Matter 2006, 385, 1213–1215. [Google Scholar] [CrossRef]
- Kardjilov, N.; Hilger, A.; Manke, I.; Strobl, M.; Treimer, W.; Banhart, J. Industrial applications at the new cold neutron radiography and tomography facility of the HMI. Nucl. Instrum. Methods Phys. Res. Sect. A Accel. Spectrom. Detect. Assoc. Equip. 2005, 542, 16–21. [Google Scholar] [CrossRef]
- Kardjilov, N.; Hilger, A.; Manke, I.; Strobl, M.; Treimer, W.; Banhart, J. Multifunctional Tomography Instrument with Cold Neutrons at HMI. In Proceedings of the 8th World Conference on Neutron Radiography (WCNR-8), Gaithersburg, MA, USA, 16–19 October 2006; pp. 28–33. [Google Scholar]
- Schillinger, B.; Lehmann, E.H.; Vontobel, P. 3D neutron computed tomography: Requirements and applications. Phys. B Condens. Matter 2000, 276, 59–62. [Google Scholar] [CrossRef]
- Treimer, W.; Hilger, A.; Kardjilov, N.; Strobl, M. Review about old and new imaging signals for neutron computerized tomography. Nucl. Instrum. Methods Phys. Res. Sect. A Accel. Spectrom. Detect. Assoc. Equip. 2005, 542, 367–375. [Google Scholar] [CrossRef]
- Treimer, W.; Kardjilov, N.; Feye-Treimer, U.; Hilger, A.; Manke, I.; Strobl, M. Absorption- and Phase-Based Imaging Signals for Neutron Tomography. In Advances in Solid State Physics 45; Kramer, B., Ed.; Springer: Berlin/Heidelberg, Germany, 2005; pp. 407–420. [Google Scholar]
- Kardjilov, N.; Manke, I.; Strobl, M.; Hilger, A.; Treimer, W.; Meissner, M.; Krist, T.; Banhart, J. Three-dimensional imaging of magnetic fields with polarized neutrons. Nat. Phys. 2008, 4, 399–403. [Google Scholar] [CrossRef] [Green Version]
- Dawson, M.; Manke, I.; Kardjilov, N.; Hilger, A.; Strobl, M.; Banhart, J. Imaging with polarized neutrons. New J. Phys. 2009, 11, 043013. [Google Scholar] [CrossRef]
- Strobl, M.; Kardjilov, N.; Hilger, A.; Jericha, E.; Badurek, G.; Manke, I. Imaging with polarized neutrons. Phys. B Condens. Matter 2009, 404, 2611–2614. [Google Scholar] [CrossRef]
- Kardjilov, N.; Hilger, A.; Manke, I.; Garcia-Moreno, F.; Banhart, J. Bragg-edge Imaging with Neutrons. Mater. Test. 2008, 50, 569–571. [Google Scholar] [CrossRef]
- Treimer, W.; Strobl, M.; Kardjilov, N.; Hilger, A.; Manke, I. Wavelength tunable device for neutron radiography and tomography. Appl. Phys. Lett. 2006, 89, 203504. [Google Scholar] [CrossRef]
- Woracek, R.; Penumadu, D.; Kardjilov, N.; Hilger, A.; Strobl, M.; Wimpory, R.C.; Manke, I.; Banhart, J. Neutron Bragg-edge-imaging for strain mapping under in situ tensile loading. J. Appl. Phys. 2011, 109, 093506. [Google Scholar] [CrossRef]
- Woracek, R.; Penumadu, D.; Kardjilov, N.; Hilger, A.; Boin, M.; Banhart, J.; Manke, I. 3D mapping of crystallographic phase distribution using energy-selective neutron tomography. Adv. Mater. 2014, 26, 4069–4073. [Google Scholar] [CrossRef] [PubMed]
- Williams, S.H.; Hilger, A.; Kardjilov, N.; Manke, I.; Strobl, M.; Douissard, P.A.; Martin, T.; Riesemeier, H.; Banhart, J. Detection system for microimaging with neutrons. J. Instrum. 2012, 7, P02014. [Google Scholar] [CrossRef] [Green Version]
- Manke, I.; Kardjilov, N.; Schafer, R.; Hilger, A.; Strobl, M.; Dawson, M.; Grünzweig, C.; Behr, G.A.; Hentschel, M.P.; David, C.N.; et al. Three-dimensional imaging of magnetic domains. Nat. Commun. 2010, 1, 125. [Google Scholar] [CrossRef] [PubMed]
- Strobl, M.; Grünzweig, C.; Hilger, A.; Manke, I.; Kardjilov, N.; David, C.; Pfeiffer, F. Neutron Dark-Field Tomography. Phys. Rev. Lett. 2008, 101, 123902. [Google Scholar] [CrossRef] [PubMed] [Green Version]
- Ţuţueanu, A.-E.; Sales, M.; Eliasen, K.; Lǎcǎtuşu, M.-E.; Grivel, J.-C.; Kardjilov, N.; Manke, I.; Krzyzagorski, M.; Sassa, Y.; Andersson, M.; et al. Non-destructive characterisation of dopant spatial distribution in cuprate superconductors. Phys. C Supercond. 2020, 575, 1353691. [Google Scholar] [CrossRef]
- Grosse, M.; Schillinger, B.; Trtik, P.; Kardjilov, N.; Steinbrück, M. Investigation of the 3D hydrogen distribution in zirconium alloys by means of neutron tomography. Int. J. Mater. Res. 2020, 111, 40–46. [Google Scholar] [CrossRef]
- Heubner, F.; Hilger, A.; Kardjilov, N.; Manke, I.; Kieback, B.; Gondek, Ł.; Banhart, J.; Röntzsch, L. In-operando stress measurement and neutron imaging of metal hydride composites for solid-state hydrogen storage. J. Power Sources 2018, 397, 262–270. [Google Scholar] [CrossRef]
- Rasmussen, M.K.; Kardjilov, N.; Oliveira, C.L.P.; Watts, B.; Villanova, J.; Botosso, V.F.; Sant’Anna, O.A.; Fantini, M.C.A.; Bordallo, H.N. 3D visualisation of hepatitis B vaccine in the oral delivery vehicle SBA-15. Sci. Rep. 2019, 9, 1–8. [Google Scholar] [CrossRef] [Green Version]
- Benetti, A.R.; Jacobsen, J.; Lehnhoff, B.; Momsen, N.C.R.; Okhrimenko, D.V.; Telling, M.T.F.; Kardjilov, N.; Strobl, M.; Seydel, T.; Manke, I.; et al. How mobile are protons in the structure of dental glass ionomer cements? Sci. Rep. 2015, 5, 8972. [Google Scholar] [CrossRef]
- Strobl, M.; Manke, I.; Kardjilov, N.; Hilger, A.; Dawson, M.; Banhart, J. Advances in neutron radiography and tomography. J. Phys. D Appl. Phys. 2009, 42, 243001. [Google Scholar] [CrossRef]
- Kardjilov, N.; Manke, I.; Woracek, R.; Hilger, A.; Banhart, J. Advances in neutron imaging. Mater. Today 2018, 21, 652–672. [Google Scholar] [CrossRef]
- Maier, M.; Dodwell, J.; Ziesche, R.; Tan, C.; Heenan, T.; Majasan, J.; Kardjilov, N.; Markötter, H.; Manke, I.; Castanheira, L.; et al. Mass transport in polymer electrolyte membrane water electrolyser liquid-gas diffusion layers: A combined neutron imaging and X-ray computed tomography study. J. Power Sources 2020, 455, 227968. [Google Scholar] [CrossRef]
- Wu, Y.; Cho, J.I.S.; Whiteley, M.; Rasha, L.; Neville, T.P.; Ziesche, R.; Xu, R.; Owen, R.; Kulkarni, N.; Hack, J.; et al. Characterization of water management in metal foam flow-field based polymer electrolyte fuel cells using in-operando neutron radiography. Int. J. Hydrogen Energy 2020, 45, 2195–2205. [Google Scholar] [CrossRef]
- Ziesche, R.F.; Arlt, T.; Finegan, D.P.; Heenan, T.; Tengattini, A.; Baum, D.; Kardjilov, N.; Markötter, H.; Manke, I.; Kockelmann, W.; et al. 4D imaging of lithium-batteries using correlative neutron and X-ray tomography with a virtual unrolling technique. Nat. Commun. 2020, 11, 1–11. [Google Scholar] [CrossRef] [PubMed] [Green Version]
- Ziesche, R.F.; Robinson, J.B.; Markötter, H.; Bradbury, R.; Tengattini, A.; Lenoir, N.; Helfen, L.; Kockelmann, W.; Kardjilov, N.; Manke, I.; et al. Editors’ Choice-4D Neutron and X-ray Tomography Studies of High Energy Density Primary Bat-teries: Part II. Multi-Modal Microscopy of LiSOCl(2)Cells. J. Electrochem. Soc. 2020, 167, 140509. [Google Scholar] [CrossRef]
- Ziesche, R.F.; Robinson, J.B.; Kok, M.D.; Markötter, H.; Kockelmann, W.; Kardjilov, N.; Manke, I.; Brett, D.J.; Shearing, P.R. Editors’ Choice-4D Neutron and X-ray Tomography Studies of High Energy Density Primary Bat-teries: Part I. Dynamic Studies of LiSOCl(2)during Discharge. J. Electrochem. Soc. 2020, 167, 130545. [Google Scholar] [CrossRef]
- Kardjilov, N.; Hilger, A.; Manke, I.; Woracek, R.; Banhart, J. CONRAD-2: The new neutron imaging instrument at the Helmholtz-Zentrum Berlin. J. Appl. Crystallogr. 2016, 49, 195–202. [Google Scholar] [CrossRef]
- Kardjilov, N.; Manke, I.; Hilger, A.; Strobl, M.; Banhart, J. Neutron imaging in materials science. Mater. Today 2011, 14, 248–256. [Google Scholar] [CrossRef]
- Dawson, M.; Kardjilov, N.; Manke, I.; Hilger, A.; Jullien, D.; Bordenave, F.; Strobl, M.; Jericha, E.; Badurek, G.; Banhart, J. Polarized neutron imaging using helium-3 cells and a polychromatic beam. Nucl. Instrum. Methods Phys. Res. Sect. A Accel. Spectrom. Detect. Assoc. Equip. 2011, 651, 140–144. [Google Scholar] [CrossRef]
- Grünzweig, C.; Pfeiffer, F.; Bunk, O.; Donath, T.; Kühne, G.; Frei, G.; Dierolf, M.; David, C. Design, fabrication, and characterization of diffraction gratings for neutron phase contrast imaging. Rev. Sci. Instrum. 2008, 79, 053703. [Google Scholar] [CrossRef]
- Kulkarni, N.; Cho, J.I.; Rasha, L.; Owen, R.E.; Wu, Y.; Ziesche, R.; Hack, J.; Neville, T.; Whiteley, M.; Kardjilov, N.; et al. Effect of cell compression on the water dynamics of a polymer electrolyte fuel cell using in-plane and through-plane in-operando neutron radiography. J. Power Sources 2019, 439, 227074. [Google Scholar] [CrossRef]
- Wu, Y.; Meyer, Q.; Liu, F.; Rasha, L.; Cho, J.I.S.; Neville, T.P.; Millichamp, J.; Ziesche, R.; Kardjilov, N.; Boillat, P.; et al. Investigation of water generation and accumulation in polymer electrolyte fuel cells using hydro-electrochemical impedance imaging. J. Power Sources 2019, 414, 272–277. [Google Scholar] [CrossRef]
- Wu, Y.; Cho, J.I.S.; Lu, X.; Rasha, L.; Neville, T.; Millichamp, J.; Ziesche, R.; Kardjilov, N.; Markötter, H.; Shearing, P.R.; et al. Effect of compression on the water management of polymer electrolyte fuel cells: An in-operando neutron radiography study. J. Power Sources 2019, 412, 597–605. [Google Scholar] [CrossRef]
- AlRwashdeh, S.S.; Manke, I.; Markötter, H.; Haußmann, J.; Kardjilov, N.; Hilger, A.; Kermani, M.J.; Klages, M.; Al-Falahat, A.; Scholta, J.; et al. Neutron radiographic in operando investigation of water transport in polymer electrolyte membrane fuel cells with channel barriers. Energy Convers. Manag. 2017, 148, 604–610. [Google Scholar] [CrossRef]
- Gößling, S.; Klages, M.; Haußmann, J.; Beckhaus, P.; Messerschmidt, M.; Arlt, T.; Kardjilov, N.; Manke, I.; Scholta, J.; Heinzel, A. Analysis of liquid water formation in polymer electrolyte membrane (PEM) fuel cell flow fields with a dry cathode supply. J. Power Sources 2016, 306, 658–665. [Google Scholar] [CrossRef]
- Arlt, T.; Lüke, W.; Kardjilov, N.; Banhart, J.; Lehnert, W.; Manke, I. Monitoring the hydrogen distribution in poly(2,5-benzimidazole)-based (ABPBI) membranes in operating high-temperature polymer electrolyte fuel cells by using H-D contrast neutron imaging. J. Power Sources 2015, 299, 125–129. [Google Scholar] [CrossRef]
- Schröder, A.; Wippermann, K.; Arlt, T.; Sanders, T.; Baumhöfer, T.; Kardjilov, N.; Hilger, A.; Mergel, J.; Lehnert, W.; Stolten, D.; et al. Neutron radiography and current distribution measurements for studying cathode flow field properties of direct methanol fuel cells. Int. J. Energy Res. 2014, 38, 926–943. [Google Scholar] [CrossRef]
- Schroder, A.; Wippermann, K.; Arlt, T.; Sanders, T.; Baumhöfer, T.; Kardjilov, N.; Mergel, J.; Lehnert, W.; Stolten, D.; Banhart, J.; et al. In-plane neutron radiography for studying the influence of surface treatment and design of cathode flow fields in direct methanol fuel cells. Int. J. Hydrogen Energy 2013, 38, 2443–2454. [Google Scholar] [CrossRef]
- Bunn, J.R.; Penumadu, D.; Woracek, R.; Kardjilov, N.; Hilger, A.; Manke, I.; Williams, S.H. Detection of water with high sensitivity to study polymer electrolyte fuel cell membranes using cold neutrons at high spatial resolution. Appl. Phys. Lett. 2013, 102, 234102. [Google Scholar] [CrossRef]
- Arlt, T.; Grothausmann, R.; Manke, I.; Markötter, H.; Hilger, A.; Kardjilov, N.; Tötzke, C.; Banhart, J.; Kupsch, A.; Lange, A.; et al. Tomographic methods for fuel cell research. Mater. Test. 2013, 55, 207–213. [Google Scholar] [CrossRef] [Green Version]
- Haußmann, J.; Markötter, H.; Alink, R.; Bauder, A.; Dittmann, K.; Manke, I.; Scholta, J. Synchrotron radiography and tomography of water transport in perforated gas diffusion media. J. Power Sources 2013, 239, 611–622. [Google Scholar] [CrossRef]
- Klages, M.; Enz, S.; Markötter, H.; Manke, I.; Kardjilov, N.; Scholta, J. Investigations on dynamic water transport characteristics in flow field channels using neutron imaging techniques. J. Power Sources 2013, 239, 596–603. [Google Scholar] [CrossRef]
- Matsushima, U.; Kardjilov, N.; Hilger, A.; Graf, W.; Herppich, W.B. Application potential of cold neutron radiography in plant science research. J. Appl. Bot. Food Qual. Angew. Bot. 2008, 82, 90–98. [Google Scholar]
- Matsushima, U.; Herppich, W.B.; Kardjilov, N.; Graf, W.; Hilger, A.; Manke, I. Estimation of water flow velocity in small plants using cold neutron imaging with D2O tracer. Nucl. Instrum. Methods Phys. Res. Sect. A Accel. Spectrom. Detect. Assoc. Equip. 2009, 605, 146–149. [Google Scholar] [CrossRef]
- Matsushima, U.; Kardjilov, N.; Hilger, A.; Manke, I.; Shono, H.; Herppich, W.B. Visualization of water usage and photosynthetic activity of street trees exposed to 2ppm of SO2—A combined evaluation by cold neutron and chlorophyll fluorescence imaging. Nucl. Instrum. Methods Phys. Res. Sect. A Accel. Spectrom. Detect. Assoc. Equip. 2009, 605, 185–187. [Google Scholar] [CrossRef]
- Tötzke, C.; Miranda, T.; Konrad, W.; Gout, J.; Kardjilov, N.; Dawson, M.; Manke, I.; Roth-Nebelsick, A. Visualization of embolism formation in the xylem of liana stems using neutron radiography. Ann. Bot. 2013, 111, 723–730. [Google Scholar] [CrossRef] [Green Version]
- Tötzke, C.; Kardjilov, N.; Manke, I.; Oswald, S.E. Capturing 3D Water Flow in Rooted Soil by Ultra-fast Neutron Tomography. Sci. Rep. 2017, 7, 1–9. [Google Scholar] [CrossRef] [Green Version]
- Salvemini, F.; Grazzi, F.; Kardjilov, N.; Manke, I.; Scherillo, A.; Roselli, M.G.; Zoppi, M. Non-invasive characterization of ancient Indonesian Kris through neutron methods. Eur. Phys. J. Plus 2020, 135, 1–25. [Google Scholar] [CrossRef]
- Williams, A.; Edge, D.; Grazzi, F.; Kardjilov, N. A New Method of Revealing Armourers’ Marks. Stud. Conserv. 2019, 64, 10–15. [Google Scholar] [CrossRef]
- Salvemini, F.; Kardjilov, N.; Civita, F.; Zoppi, M.; Grazzi, F.; Manke, I. Neutron computed laminography on ancient metal artefacts. Anal. Methods 2014, 7, 271–278. [Google Scholar] [CrossRef]
- Agresti, J.; Osticioli, I.; Guidotti, M.C.; Capriotti, G.; Kardjilov, N.; Scherillo, A.; Siano, S. Combined neutron and laser techniques for technological and compositional investigations of hollow bronze figurines. J. Anal. At. Spectrom. 2015, 30, 713–720. [Google Scholar] [CrossRef]
- Müller, J.; Hipsley, C.A.; Head, J.J.; Kardjilov, N.; Hilger, A.; Wuttke, M.; Reisz, R.R. Eocene lizard from Germany reveals amphisbaenian origins. Nat. Cell Biol. 2011, 473, 364–367. [Google Scholar] [CrossRef] [PubMed]
- Laass, M.; Hampe, O.; Schudack, M.; Kardjilov, N.; Hilger, A. New Details of a Skull of Lystrosaurus Declivis and Implications for Lifestyle Adaptions. J. Vertebr. Paleontol. 2009, 29, 131a. [Google Scholar]
- Laaß, M.; Hampe, O.; Schudack, M.; Hoff, C.; Kardjilov, N.; Hilger, A. New insights into the respiration and metabolic physiology of Lystrosaurus. Acta Zoöl. 2011, 92, 363–371. [Google Scholar] [CrossRef]
- Oliveira, G.J.R.; De Oliveira, P.C.; Surmas, R.; Ferreira, L.D.P.; Markötter, H.; Kardjilov, N.; Manke, I.; Montoro, L.A.; Isaac, A. Probing the 3D molecular and mineralogical heterogeneity in oil reservoir rocks at the pore scale. Sci. Rep. 2019, 9, 8263. [Google Scholar] [CrossRef]
- Al-Falahat, A.M.; Kardjilov, N.; Khanh, T.V.; Markötter, H.; Boin, M.; Woracek, R.; Salvemini, F.; Grazzi, F.; Hilger, A.; Alrwashdeh, S.S.; et al. Energy-selective neutron imaging by exploiting wavelength gradients of double crystal mono-chromators-Simulations and experiments. Nucl. Instrum. Methods Phys. Res. Sect. A Accel. Spectrom. Detect. Assoc. Equip. 2019, 943, 162477. [Google Scholar] [CrossRef]
- Kardjilov, N.; Manke, I.; Hilger, A.; Williams, S.; Strobl, M.; Woracek, R.; Boin, M.; Lehmann, E.; Penumadu, D.; Banhart, J. Neutron Bragg-edge mapping of weld seams. Int. J. Mater. Res. 2012, 103, 151–154. [Google Scholar] [CrossRef]
- Dabah, E.; Pfretzschner, B.; Schaupp, T.; Kardjilov, N.; Manke, I.; Boin, M.; Woracek, R.; Griesche, A. Time-resolved Bragg-edge neutron radiography for observing martensitic phase transformation from austenitized super martensitic steel. J. Mater. Sci. 2017, 52, 3490–3496. [Google Scholar] [CrossRef]
- Tudisco, E.; Etxegarai, M.; Hall, S.A.; Charalampidou, E.M.; Couples, G.D.; Lewis, H.; Tengattini, A.; Kardjilov, N. Fast 4-D Imaging of Fluid Flow in Rock by High-Speed Neutron Tomography. J. Geophys. Res. Solid Earth 2019, 124, 3557–3569. [Google Scholar] [CrossRef]
- Tremsin, A.S.; Kardjilov, N.; Strobl, M.; Manke, I.; Dawson, M.; McPhate, J.B.; Vallerga, J.V.; Siegmund, O.H.W.; Feller, W.B. Imaging of dynamic magnetic fields with spin-polarized neutron beams. New J. Phys. 2015, 17, 43047. [Google Scholar] [CrossRef] [Green Version]
- Manke, I.; Kardjilov, N.; Strobl, M.; Hilger, A.; Banhart, J. Investigation of the skin effect in the bulk of electrical conductors with spin-polarized neutron radiog-raphy. J. Appl. Phys. 2008, 104, 076109. [Google Scholar] [CrossRef]
- Dhiman, I.; Ziesche, R.; Riik, L.; Manke, I.; Hilger, A.; Radhakrishnan, B.; Burress, T.; Treimer, W.; Kardjilov, N. Visualization of magnetic domain structure in FeSi based high permeability steel plates by neutron imaging. Mater. Lett. 2020, 259, 126816. [Google Scholar] [CrossRef]
- Hilger, A.; Manke, I.; Kardjilov, N.; Osenberg, M.; Markötter, H.; Banhart, J. Tensorial neutron tomography of three-dimensional magnetic vector fields in bulk materials. Nat. Commun. 2018, 9, 1–7. [Google Scholar] [CrossRef] [Green Version]
- Hilger, A.; Kardjilov, N.; Kandemir, T.; Manke, I.; Banhart, J.; Penumadu, D.; Manescu, A.; Strobl, M. Revealing microstructural inhomogeneities with dark-field neutron imaging. J. Appl. Phys. 2010, 107, 036101. [Google Scholar] [CrossRef]
- Harti, R.P.; Strobl, M.; Schäfer, R.; Kardjilov, N.; Tremsin, A.S.; Grünzweig, C. Dynamic volume magnetic domain wall imaging in grain oriented electrical steel at power frequen-cies with accumulative high-frame rate neutron dark-field imaging. Sci. Rep. 2018, 8, 15754. [Google Scholar] [CrossRef]


| Neutron Guide | NL-1A (m = 2,3) with Beam Cross-Section 125 mm (Height) × 30 mm (Width) Radius of Curvature 750 m |
|---|---|
| Pinhole changer | 1 cm, 2 cm and 3 cm in diameter |
| Flight path | 10 m flight path Aluminum containers filled with He |
| Measurement positions | Position 1 (end of the guide): Flux: 2.6 × 10⁹ n/cm2s @ L/D ca. 70; beam size: 12 × 3 cm Position 2 (5 m from the pinhole): Flux: 7.2 × 10⁷ n/cm2s @ L/D 170; beam size: 15 × 15 cm Position 3 (10 m from the pinhole): Flux: 2.4 × 10⁷ n/cm2s @ L/D 350; beam size: 30 × 30 cm |
| Double crystal monochromator | Pyrolytic graphite (002) with mosaicity of 0.8° Wavelength resolution 1–3% Wavelength range: 1.5 Å–6.0 Å |
| Velocity selector | Wavelength range: 3.0 Å–6.0 Å Wavelength resolution 10–20% |
| Polarizers | 2× Solid-state benders 4× Polarized 3He cells and 2× magic boxes |
| Detectors | CCD camera (Andor, 2048 × 2048 pixels) sCMOS camera (Andor Neo) |
| Sample positioning | Rotation table (s): 0–360° Translation table: 0–800 mm Lift table: 0–250 mm Goniometer (s): ±20° Maximum weight: 200 kg |
| Media connections | Cooling water (15 °C), pressurized air (up to 10 bar), nitrogen gas, helium gas, exhaust pipeline. Hydrogen supply system including safety storage box for the bottles, hydrogen sensors, magnetic valve and under-pressure exhaust pipeline. |
| µ-CT scanner | Micro focus X-ray tube 150 kV (Hamamatsu, L8121-03) and flat panel sensor (Hamamatsu, C7942SK-05) with 2316 × 2316 pixels and a pixel size of 50 µm; cone beam with maximal magnification of 10×. |
| Year | Publications | IF > 7 | 7 > IF > 3 | IF < 3 |
|---|---|---|---|---|
| 2020 | 8 | 2 | 5 | 1 |
| 2019 | 20 | 6 | 8 | 6 |
| 2018 | 16 | 5 | 5 | 6 |
| 2017 | 16 | 2 | 6 | 8 |
| 2016 | 12 | 5 | 4 | 3 |
| 2015 | 25 | 3 | 4 | 18 |
| 2014 | 7 | 2 | 1 | 4 |
| 2013 | 7 | 1 | 3 | 3 |
| 2012 | 14 | 1 | 1 | 12 |
| 2011 | 21 | 4 | 3 | 14 |
| 2010 | 15 | 2 | 1 | 12 |
| 2009 | 16 | 0 | 3 | 13 |
| 2008 | 22 | 3 | 3 | 16 |
| 2007 | 4 | 0 | 3 | 1 |
| 2006 | 7 | 0 | 1 | 6 |
| Average | 14.1 | 2.4 (17%) | 3.4 (24%) | 8.3 (59%) |
Publisher’s Note: MDPI stays neutral with regard to jurisdictional claims in published maps and institutional affiliations. |
© 2021 by the authors. Licensee MDPI, Basel, Switzerland. This article is an open access article distributed under the terms and conditions of the Creative Commons Attribution (CC BY) license (http://creativecommons.org/licenses/by/4.0/).
Share and Cite
Kardjilov, N.; Manke, I.; Hilger, A.; Arlt, T.; Bradbury, R.; Markötter, H.; Woracek, R.; Strobl, M.; Treimer, W.; Banhart, J. The Neutron Imaging Instrument CONRAD—Post-Operational Review. J. Imaging 2021, 7, 11. https://doi.org/10.3390/jimaging7010011
Kardjilov N, Manke I, Hilger A, Arlt T, Bradbury R, Markötter H, Woracek R, Strobl M, Treimer W, Banhart J. The Neutron Imaging Instrument CONRAD—Post-Operational Review. Journal of Imaging. 2021; 7(1):11. https://doi.org/10.3390/jimaging7010011
Chicago/Turabian StyleKardjilov, Nikolay, Ingo Manke, André Hilger, Tobias Arlt, Robert Bradbury, Henning Markötter, Robin Woracek, Markus Strobl, Wolfgang Treimer, and John Banhart. 2021. "The Neutron Imaging Instrument CONRAD—Post-Operational Review" Journal of Imaging 7, no. 1: 11. https://doi.org/10.3390/jimaging7010011