

Circular Construction Indicator: Assessing Circularity in the Design, Construction, and End-of-Life Phase

Abstract
:
1. Introduction
2. State-of-the-Art
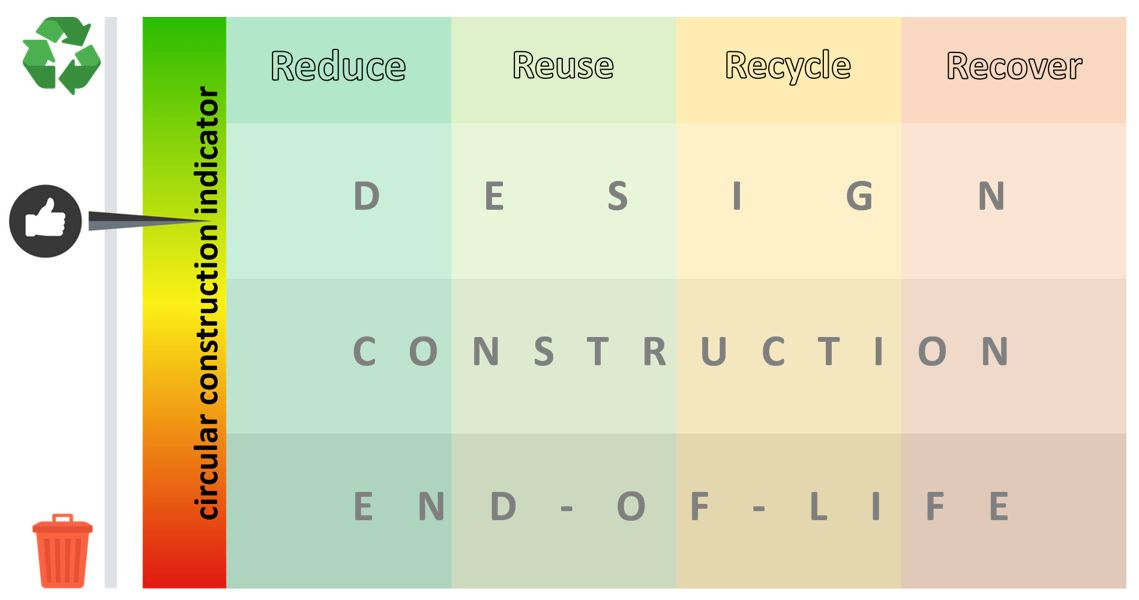
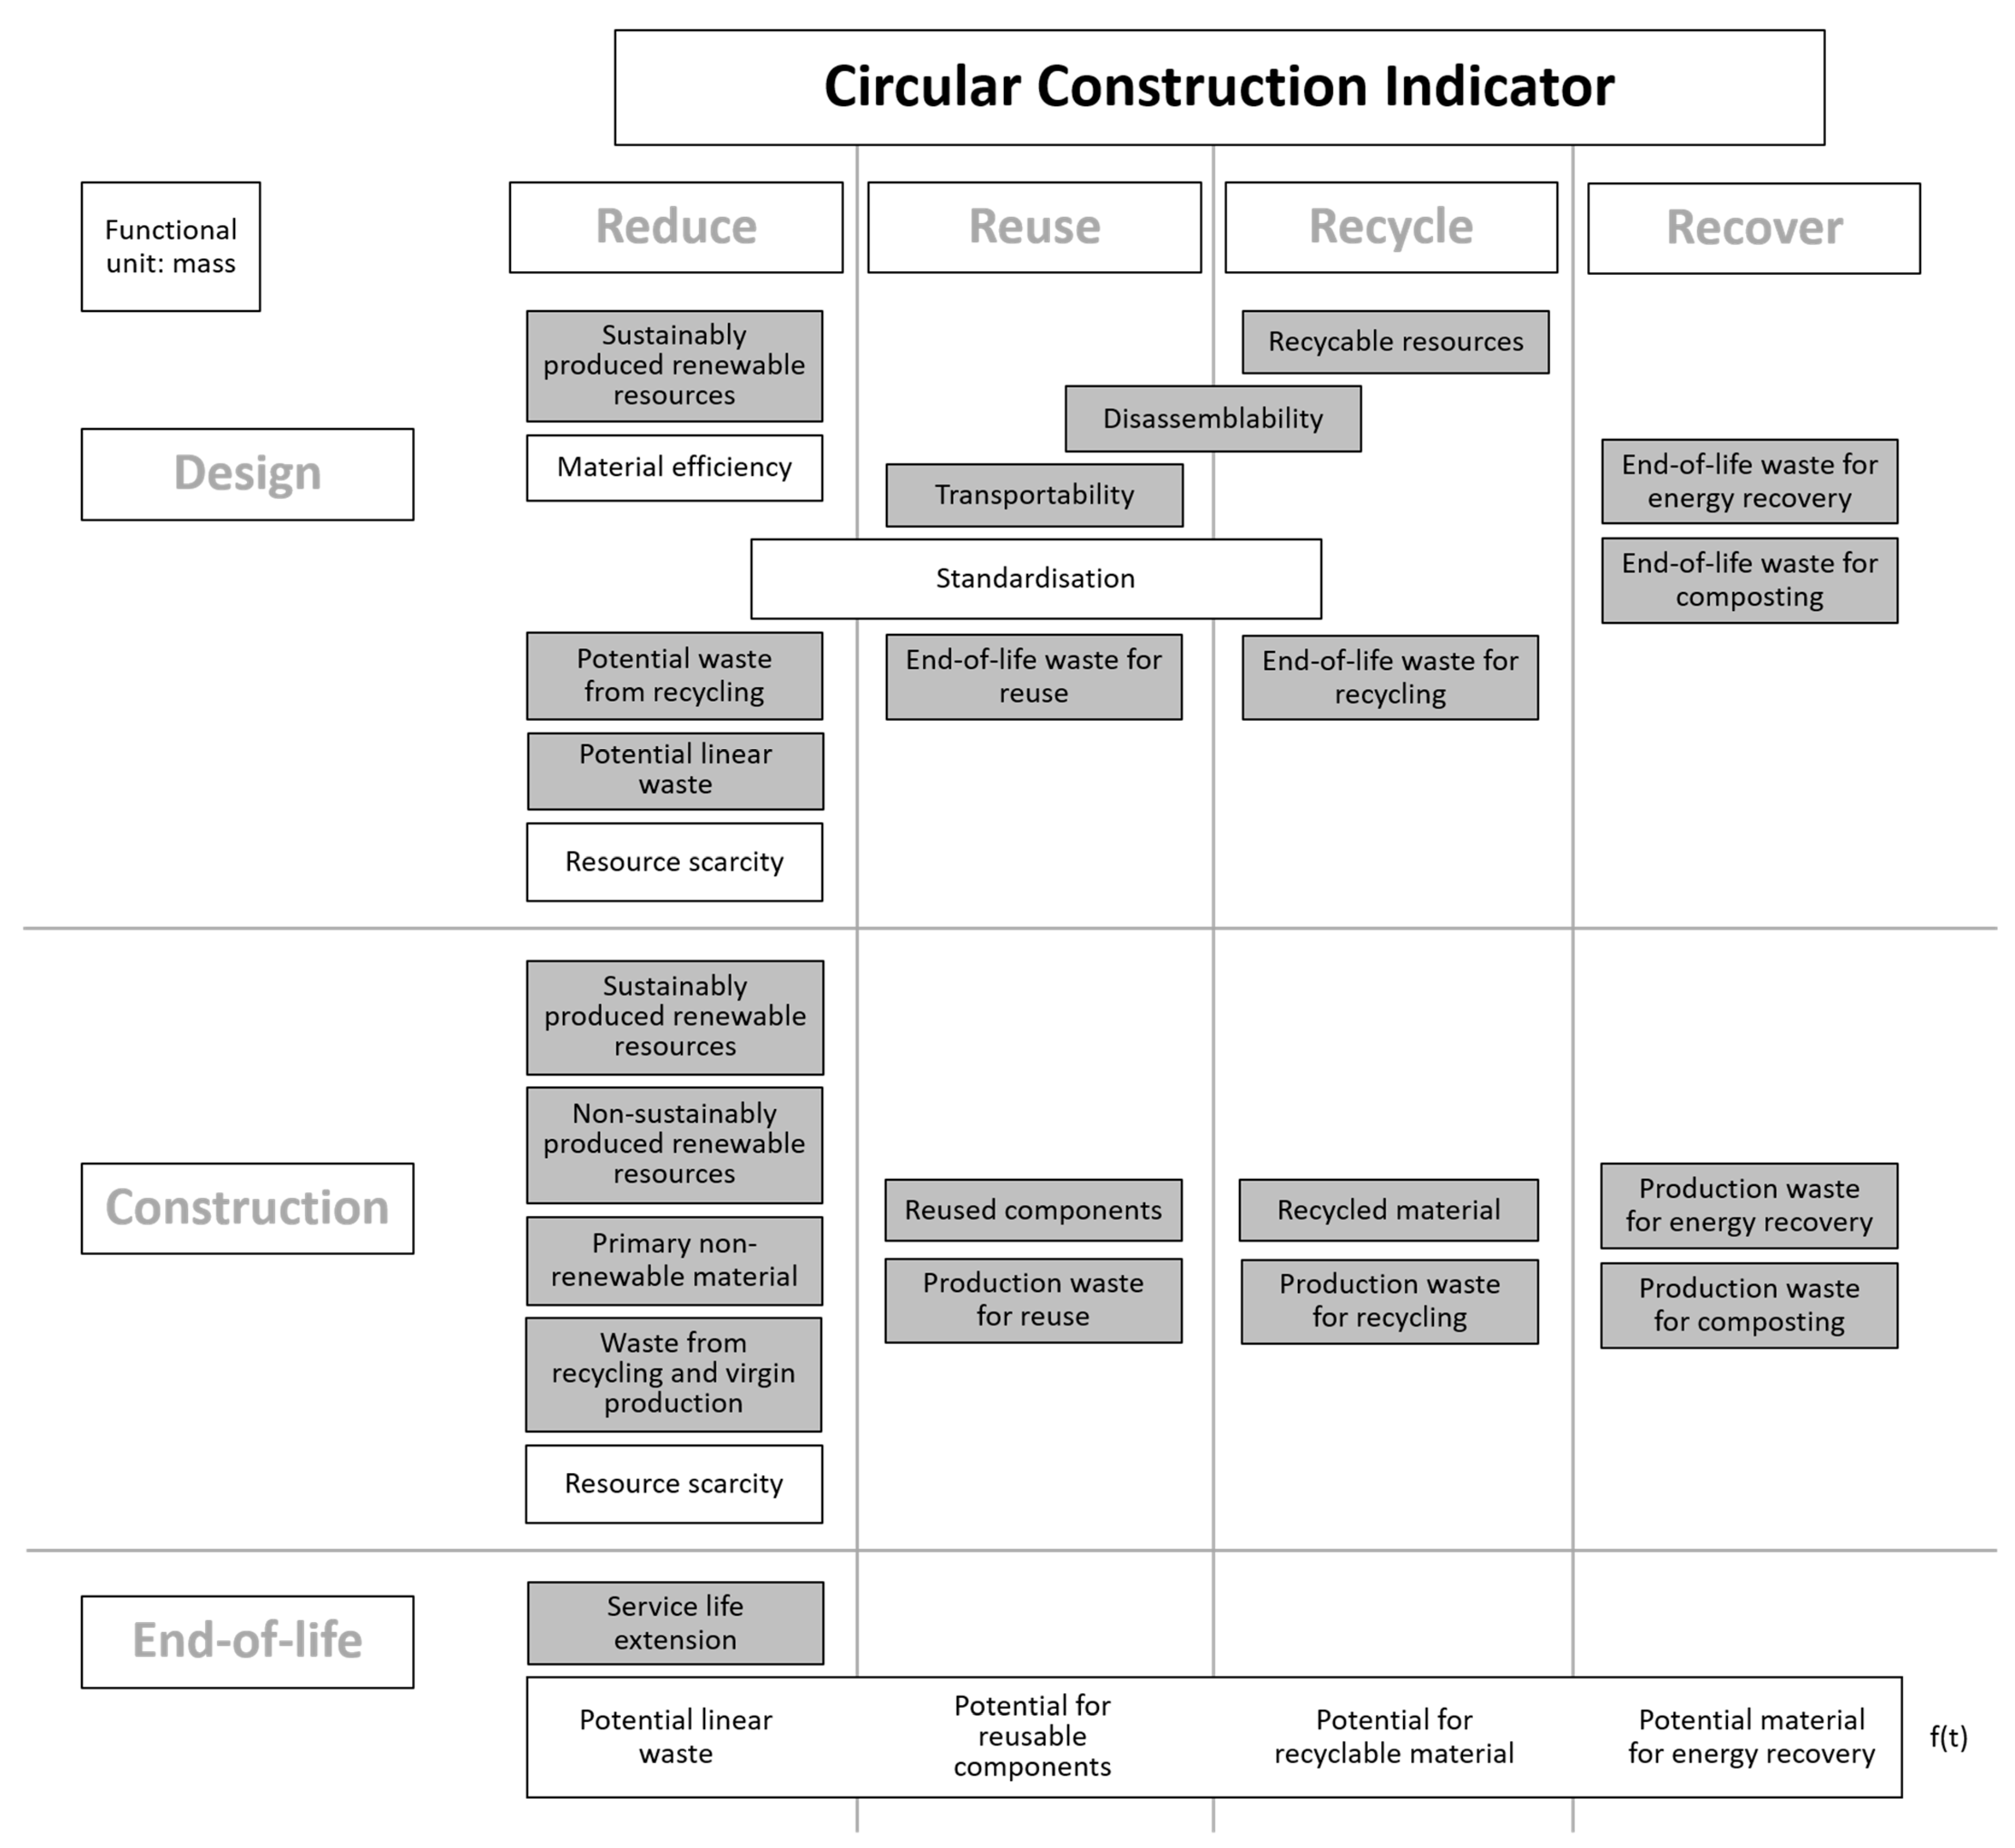
3. Circular Construction Indicator
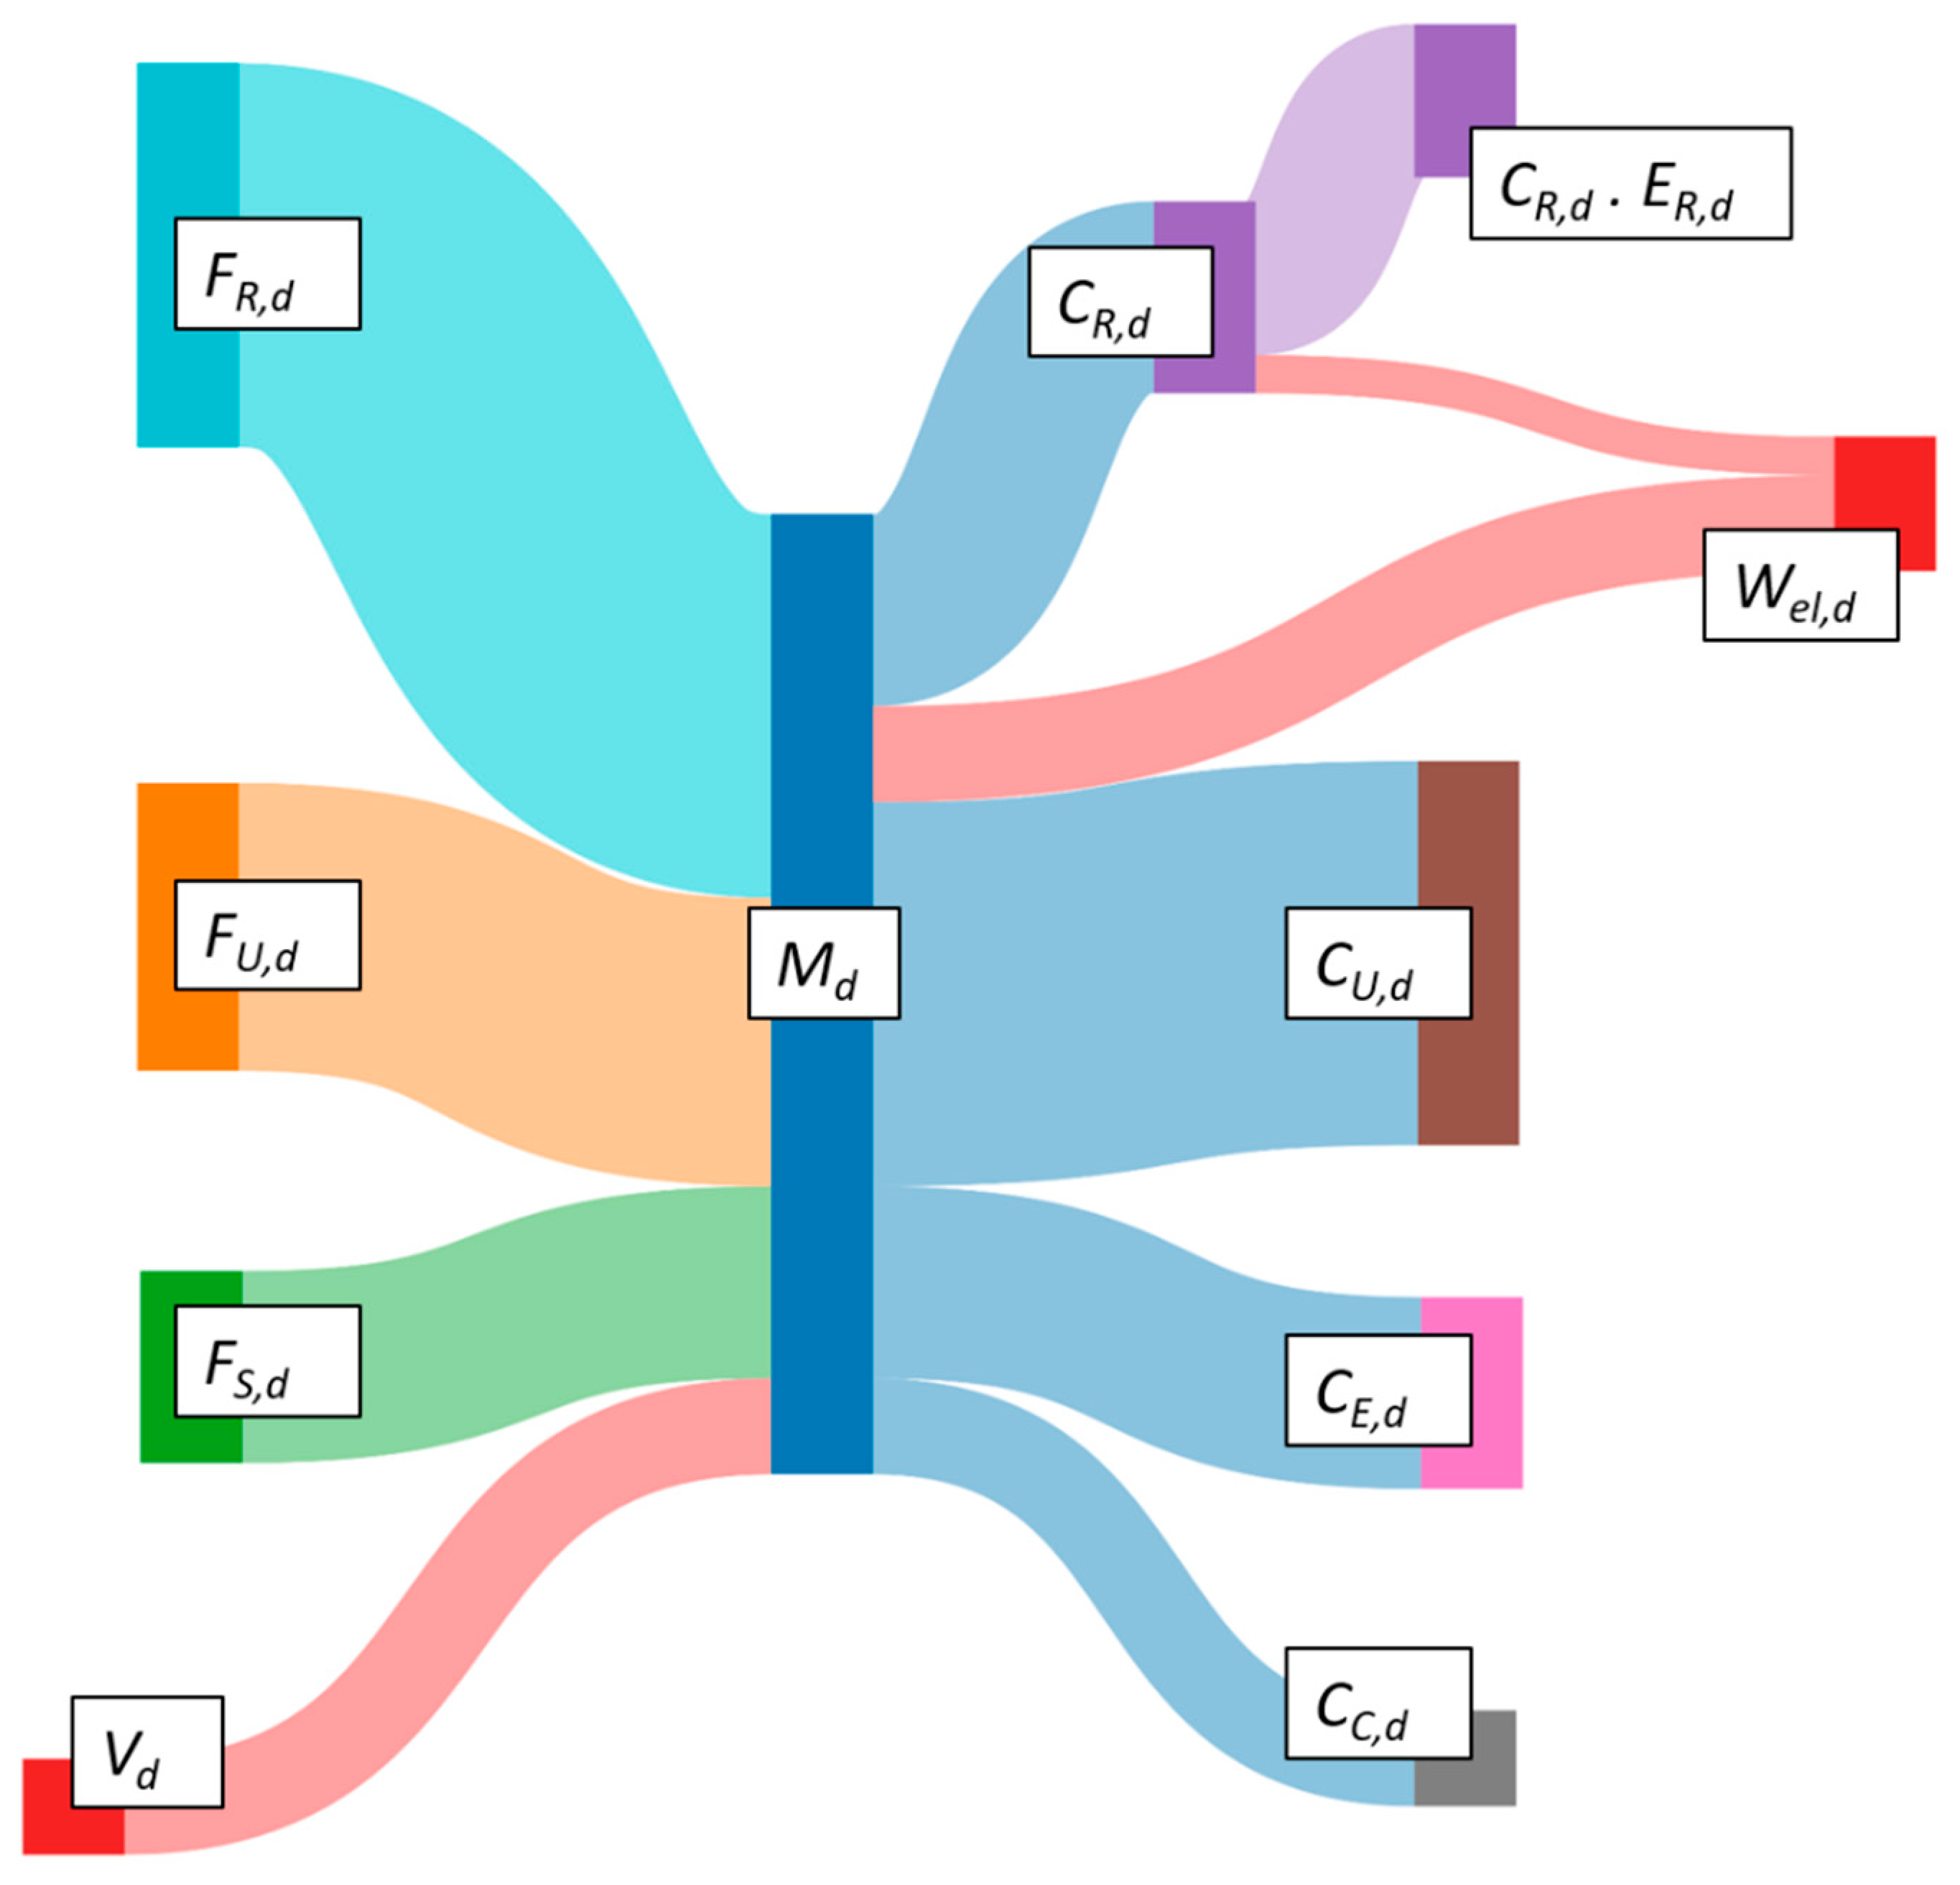
3.1. Design
- Vd: the mass of virgin materials in the element
- Md: the total mass of material in the element
- FR,d: the fraction of feedstock from recycled sources
- FU,d: the fraction of feedstock from reused sources
- FS,d: the fraction of sustainably produced renewable resources
- FV,d: the fraction of virgin, non-renewable feedstock
- FNS,d: the fraction of non-sustainably produced renewable resources
- Wd: the direct waste in the EoL phase
- CR,d: the fraction of material that is collected for Recycling
- CU,d: the fraction of components that is Reused
- CC,d: the fraction of uncontaminated biomaterials that is collected for composting
- CE,d: the fraction of biomaterials that is used for energy Recovery
- fd,q: the fraction of constituent q in the element’s finished material
- SOPq: the Surplus Ore Potential of constituent q
- s: the total number of constituents in the finished material
- ECId,i: the ECId of element i
- Md,i: the design mass of finished element i
- Mr: the combined design mass of the two concerning elements
- Dj: a Disassembly Determining Factor (DDF) for category j
- Lconstruction,d: the construction’s design service life
- Lprod,d: the product’s design service life
- PU,d: the reuse potential indicator
- α: a constant between 0 and 1
- β, γ and δ: weighting factors
- N: the standardisation of the product
- T: the transportability of the product
- x: a minimum value for PU,d
- Mm,g: the mass of product g with PCId,g
- MPS: the weight of the designed primary structure
- Mlim: the reference weight of an optimally designed structural system adhering to the same conditions (i.e., material, span, maximum height)
- LKh: the factor expressing Brand’s shearing layer to which system h with SCId,h belongs
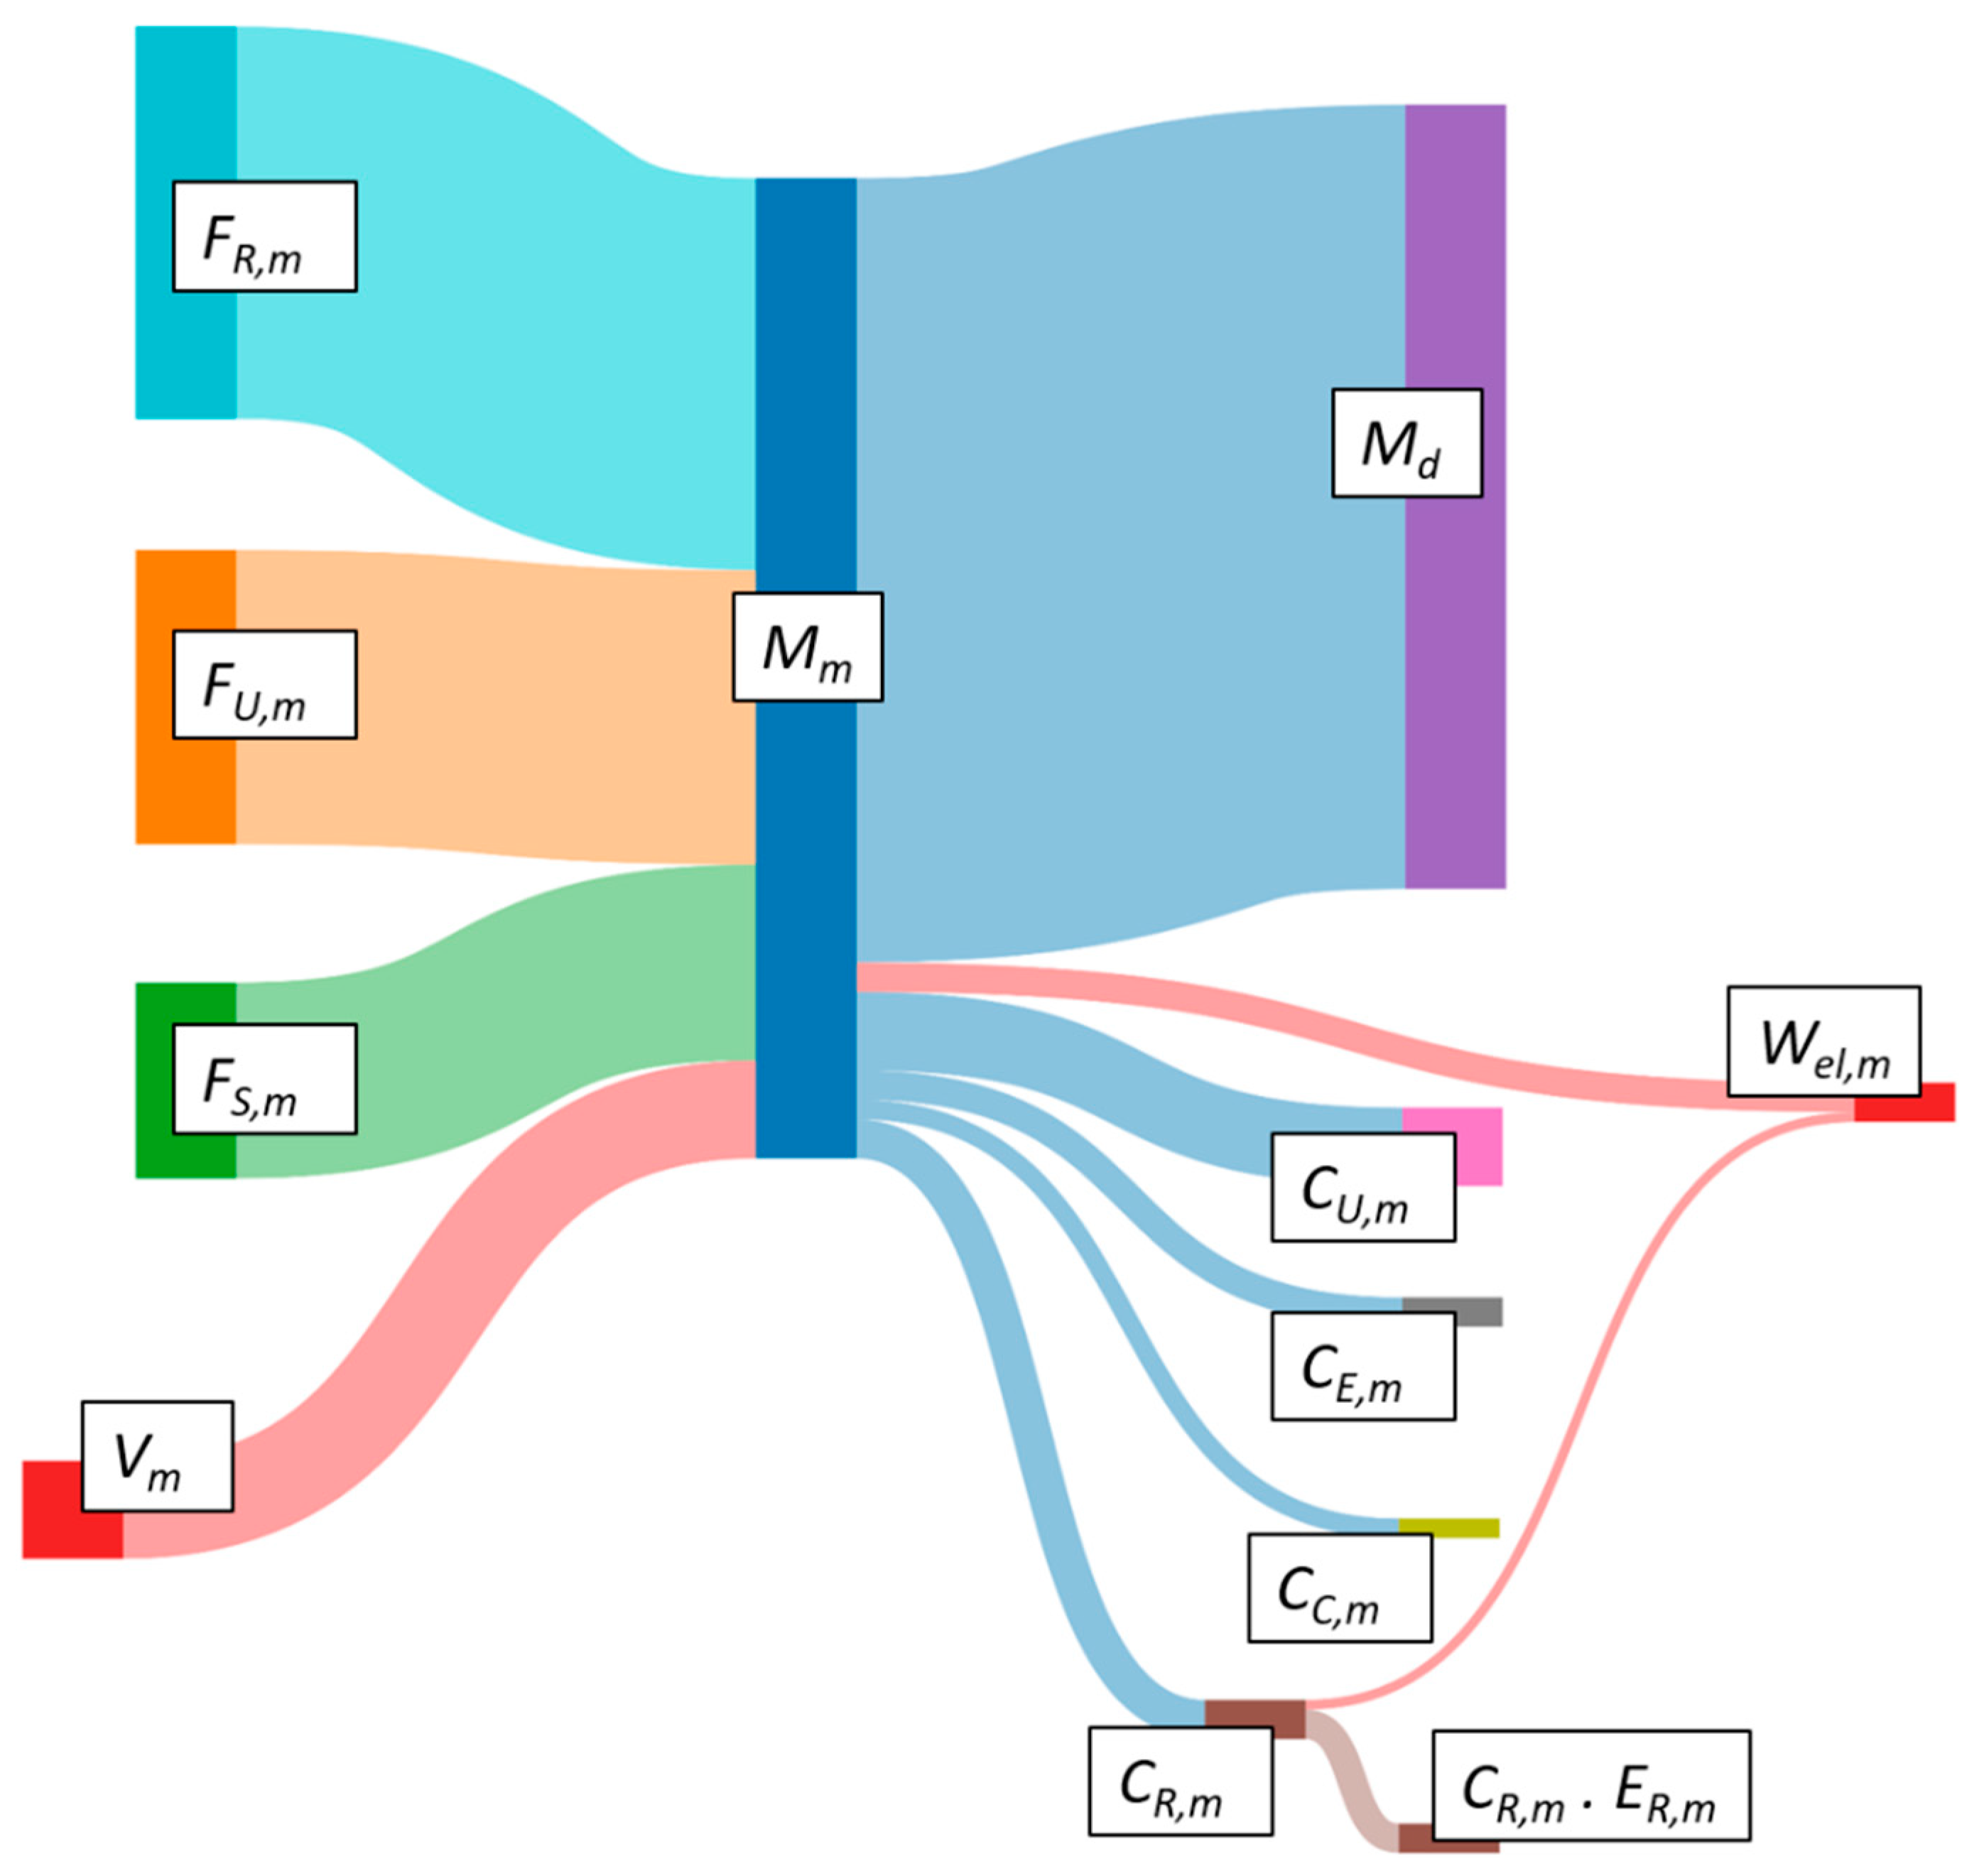
3.2. Construction
- Vc,q: the mass of virgin materials of constituentqneeded to manufacture the element
- Mc: the total mass of material needed to manufacture the element
- fc,q: the fraction of constituentqto manufacture the element
- FR,c,q: the fraction of feedstock from recycled sources
- FU,c,q: the fraction of feedstock from reused sources
- FS,c,q: the fraction of sustainably produced renewable resources
- FV,c,q: the fraction of virgin, non-renewable feedstock
- FNS,c,q: the fraction of non-sustainably produced renewable resources
- Wc,q: the direct waste of constituentqin the manufacturing phase
- Md: the design mass of the finished element
- CR,c,q: the fraction of material that is collected for Recycling
- CU,c,q: the fraction of components that is Reused
- CC,c,q: the fraction of uncontaminated biomaterials that is collected for composting
- CE,c,q: the fraction of biomaterials that is used for energy Recovery
3.3. End-of-Life
- Mn,h: the mass of system h with SCIe,h
4. Discussion
4.1. Design
4.2. Construction
4.3. End-of-Life
5. Conclusions
Author Contributions
Funding
Data Availability Statement
Conflicts of Interest
Abbreviations
| General | |
| 4 R’s | Reduce, Reuse, Recycle, Recover |
| CCI | Circular Construction Indicator |
| CDW | Construction and Demolition Waste |
| CE | Circular Economy |
| CI | Circularity Indicator |
| DDF | Disassembly Determining Factor |
| DfD | Design for Disassembly |
| EoL | End-of-Life |
| f(t) | Function of time |
| LCA | Life Cycle Assessment |
| State-of-the art circularity indicators | |
| 3DR | Design for Disassembly, Deconstruction, and Resilience |
| BCCI | Bridge Circularity Composite Indicator |
| BCI Verberne | Building Circularity Indicator by Verberne |
| BCI van Vliet | Building Circularity Indicator by van Vliet |
| BCI Alba Concepts | Building Circularity Index by Alba Concepts |
| CB’23 | Circular Construction 2023 |
| CBI | Circular Bridge Indicator |
| CI Madaster | Madaster Circularity Indicator |
| CPI | Circular economy Performance Indicator |
| GRI | Global Resource Indicator |
| MCI | Ellen MacArthur’s Material Circularity Indicator |
| MCI Jiang | Material Circularity Indicator by Jiang |
| RPI | Reuse Potential Indicator |
| WLPE | Whole-Life Performance Estimator |
| Design | |
| CR,d | the fraction of material that is collected for Recycling |
| CU,d | the fraction of components that is Reused |
| CC,d | the fraction of uncontaminated biomaterials that is collected for composting |
| CE,d | the fraction of biomaterials that is used for energy Recovery |
| CCId | Circular Construction Design Index |
| Dj | a Disassembly Determining Factor for category j |
| E | material efficiency indicator |
| ER,d | the efficiency of the recycling process |
| ECId | Element Circularity Index in the design phase |
| ECId,i | the ECId of finished element i |
| ECId,relation | Intermediate factor defining whether two connected elements can be easily disassembled |
| fd,q | the fraction of constituentqin the element’s finished material |
| FNS,d | the fraction of non-sustainably produced renewable resources |
| FR,d | the fraction of feedstock from recycled sources |
| FS,d | the fraction of sustainably produced renewable resources |
| FU,d | the fraction of feedstock from reused sources |
| FV,d | the fraction of virgin, non-renewable feedstock |
| Lconstruction,d | the construction’s design service life |
| Lprod,d | the product’s design service life |
| LFId | Linear Flow Index in the design phase |
| LKb | the sum of all LKl,f belonging to all SCId,relation,f that should be considered in CCId |
| LKh | The factor that considers the Brand’s shearing layers of longevity |
| LKl | the sum of the LKh that belong to the two considered systems in SCId,relation |
| Md | the total mass of material in the element |
| Md,i | the design mass of finished element i |
| Mlim | the reference weight of an optimally designed structural system adhering to the same conditions (i.e., material, span, maximum height) |
| Mm,g | the mass of product g with PCId,g |
| Mp | the sum of all Mr,k belonging to all ECId,relation,k that should be considered in PCId |
| MPS | the weight of the designed primary structure |
| Ms | the sum of all Mx,t belonging to all PCId,relation,t that should be considered in SCId |
| Mr | the combined design mass of the two concerning elements in ECId,relation |
| Mr,k | the combined design mass of the two concerning elements in ECId,relation,k |
| Mx | the combined mass of the two concerning products in PCId,relation |
| N | the standardisation of the product |
| PU,d | the reuse potential indicator |
| PCId | Product Circularity Index in the design phase |
| PCId,relation | Intermediate factor defining whether two connected products can be easily disassembled |
| s | the total number of constituents in the finished material |
| Sd | criticality indicator in the design phase |
| SCId | System Circularity Index in the design phase |
| SCId,relation | intermediate factor defining whether two connected systems can be easily disassembled, taking into account the shearing layers of longevity they are part of. |
| SOPq | the Surplus Ore Potential of constituent q |
| T | the transportability of the product |
| Vd | the mass of virgin materials in the element |
| Wd | the direct waste in the EoL phase |
| Wel,d | the total unrecoverable waste on the element level |
| WR,d | waste created during recycling |
| Construction | |
| CC,c,q | the fraction of uncontaminated biomaterials that is collected for composting |
| CE,c,q | the fraction of biomaterials that is used for energy Recovery |
| CR,c,q | the fraction of material that is collected for Recycling |
| CU,c,q | the fraction of components that is Reused |
| CCIc | Circular Construction, Construction Index |
| ER,c,q | the efficiency of the recycling process of constituent q |
| ECIc | Element Circularity Index in the construction phase |
| fc,q | the fraction of constituentqto manufacture the element |
| FNS,c,q | the fraction of non-sustainably produced renewable resources |
| FR,c,q | the fraction of feedstock from recycled sources |
| FS,c,q | the fraction of sustainably produced renewable resources |
| FU,c,q | the fraction of feedstock from reused sources |
| FV,c,q | the fraction of virgin, non-renewable feedstock |
| LFIc,q | Linear Flow Index of constituentqin the construction phase |
| Mc | the total mass of material needed to manufacture the element |
| PCIc | Product Circularity Index in the construction phase |
| Sq | criticality indicator for constituent q |
| SCIc | System Circularity Index in the construction phase |
| Vc,q | the mass of virgin materials of constituentqneeded to manufacture the element |
| Wc,q | the direct waste of constituentqin the manufacturing phase |
| Wel,c,q | the total amount of waste of constituentqproduced in the construction phase on the element level |
| WR,c,q | waste created when recycling constituent q |
| End-of-Life | |
| CR,e | the fraction of material that is collected for Recycling |
| CU,e | the fraction of components that is Reused |
| CC,e | the fraction of uncontaminated biomaterials that is collected for composting |
| CE,e | the fraction of biomaterials that is used for energy Recovery |
| CCIe | Circular Construction End-of-Life Index |
| ER,e | the efficiency of the recycling process |
| ECIe | Element Circularity Index in the end-of-life phase |
| F(X) | utility function |
| LFIe | Linear Flow Index in the end-of-life phase |
| Mb | the sum of all Ml,f belonging to all SCIe,relation,f that should be considered in CCIe |
| Me | the end-of-life mass of the element |
| Ml | the combined mass of the two concerning systems in SCIe,relation |
| Ml,f | the combined mass of the two concerning systems in SCIe,relation,f |
| Mn,h | the mass of system h with SCIe,h |
| PCIe | Product Circularity Index in the end-of-life phase |
| SCIe | System Circularity Index in the end-of-life phase |
| SCIe,relation | intermediate factor defining whether two connected systems can be easily disassembled |
| t | actual service life of the element |
| tav | industry average of the element’s service life |
| We | the direct waste in the EoL phase |
| Wel,e | the total unrecoverable waste on the element level |
| WR,e | waste created during recycling |
| X | service life extension factor |
References
- Circular Flanders. Born in 2010: How Much Is Left for Me? OVAM: Mechelen, Belgium, 2019. [Google Scholar]
- De Wit, M.; Hoogzaad, J.; Ramkumar, S.; Friedl, H.; Douma, A. The Circularity Gap Report—An Analysis of the Circular State of the Global Economy; Circle Economy: Amsterdam, The Netherlands, 2018. [Google Scholar]
- European Commission Construction and Demolition Waste (CDW). Available online: http://ec.europa.eu/environment/waste/construction_demolition.htm (accessed on 25 March 2019).
- Leising, E.; Quist, J.; Bocken, N. Circular Economy in the Building Sector: Three Cases and a Collaboration Tool. J. Clean. Prod. 2018, 176, 976–989. [Google Scholar] [CrossRef]
- International Organisation for Standardisation. Sustainability in Buildings and Civil Engineering Works—Design for disassembly and Adaptability—Principles, Requirements and Guidance; ISO: Geneva, Switzerland, 2020. [Google Scholar]
- Xia, B.; Ding, T.; Xiao, J. Life cycle assessment of concrete structures with reuse and recycling strategies: A novel framework and case study. Waste Manag. 2020, 105, 268–278. [Google Scholar] [CrossRef]
- Cruz Rios, F.; Grau, D.; Chong, W.K. Reusing exterior wall framing systems: A cradle-to-cradle comparative life cycle assessment. Waste Manag. 2019, 94, 120–135. [Google Scholar] [CrossRef]
- Barriball, K.L.; While, A. Collecting data using a semi-structured interview: A discussion paper. J. Adv. Nurs. 1994, 19, 328–335. [Google Scholar] [CrossRef]
- Assefa, G.; Ambler, C. To demolish or not to demolish: Life cycle consideration of repurposing buildings. Sustain. Cities Soc. 2017, 28, 146–153. [Google Scholar] [CrossRef]
- Joensuu, T.; Leino, R.; Heinonen, J.; Saari, A. Developing Buildings’ Life Cycle Assessment in Circular Economy-Comparing methods for assessing carbon footprint of reusable components. Sustain. Cities Soc. 2022, 77. [Google Scholar] [CrossRef]
- Saidani, M.; Yannou, B.; Leroy, Y.; Cluzel, F.; Kendall, A. A taxonomy of circular economy indicators. J. Clean. Prod. 2019, 207, 542–559. [Google Scholar] [CrossRef] [Green Version]
- De Oliveira, C.T.; Dantas, T.E.T.; Soares, S.R. Nano and micro level circular economy indicators: Assisting decision-makers in circularity assessments. Sustain. Prod. Consum. 2021, 26, 455–468. [Google Scholar] [CrossRef]
- Elia, V.; Gnoni, M.G.; Tornese, F. Measuring circular economy strategies through index methods: A critical analysis. J. Clean. Prod. 2017, 142, 2741–2751. [Google Scholar] [CrossRef]
- Kristensen, H.S.; Mosgaard, M.A. A review of micro level indicators for a circular economy—Moving away from the three dimensions of sustainability? J. Clean. Prod. 2020, 243, 118531. [Google Scholar] [CrossRef]
- Lindgreen, E.R.; Salomone, R.; Reyes, T. A critical review of academic approaches, methods and tools to assess circular economy at the micro level. Sustainability 2020, 12, 4973. [Google Scholar] [CrossRef]
- Preisner, M.; Smol, M.; Horttanainen, M.; Deviatkin, I.; Havukainen, J.; Klavins, M.; Ozola-Davidane, R.; Kruopienė, J.; Szatkowska, B.; Appels, L.; et al. Indicators for resource recovery monitoring within the circular economy model implementation in the wastewater sector. J. Environ. Manag. 2022, 304, 103499. [Google Scholar] [CrossRef]
- Khadim, N.; Agliata, R.; Marino, A.; Thaheem, M.J.; Mollo, L. Critical review of nano and micro-level building circularity indicators and frameworks. J. Clean. Prod. 2022, 357, 131859. [Google Scholar] [CrossRef]
- Ellen MacArthur Foundation Material Circularity Indicator (MCI). Available online: https://ellenmacarthurfoundation.org/material-circularity-indicator (accessed on 13 May 2022).
- Ellen MacArthur Foundation. Granta Circularity Indicators—An Approach to Measuring Circularity; Ellen MacArthur Foundation: Isle of Wight, UK, 2019. [Google Scholar]
- Madaster. Madaster Circularity Indicator Explained; Madaster Services B.V.: Utrecht, The Netherlands, 2018. [Google Scholar]
- Jiang, L. Measuring Product-Level Circularity Performance Based on the Material Circularity Indicator: An Economic Value-Based Metric with the Indicator of Residual Value; University of Twente: Enschede, The Netherlands, 2020. [Google Scholar]
- Coenen, T.B.J.; Santos, J.; Fennis, S.A.A.M.; Halman, J.I.M. Development of a bridge circularity assessment framework to promote resource efficiency in infrastructure projects. J. Ind. Ecol. 2021, 25, 288–304. [Google Scholar] [CrossRef]
- Verberne, J.J.H. Building Circularity Indicators—An Approach for Measuring Circularity of a Building; Eindhoven University of Technology: Eindhoven, The Netherlands, 2016. [Google Scholar]
- Van Vliet, M. Disassembling the Steps towards Building Circularity; Eindhoven University of Technology: Eindhoven, The Netherlands, 2018. [Google Scholar]
- Jansen, W. Building Circularity Index [BCI] Meetbaar Maken van Circulair Bouwen! Alba Concepts: Hilversum, The Netherlands, 2018. [Google Scholar]
- Anastasiades, K.; Van Hul, K.; Audenaert, A.; Blom, J. A Circularity Indicator for Pedestrian Bridges: A Work in Progress. In Proceedings of the Winter Global Business Conference, Tignes, France, 25–29 January 2020; pp. 8–22. [Google Scholar]
- Park, J.Y.; Chertow, M.R. Establishing and testing the “reuse potential” indicator for managing wastes as resources. J. Environ. Manag. 2014, 137, 45–53. [Google Scholar] [CrossRef]
- Akanbi, L.A.; Oyedele, L.O.; Akinade, O.O.; Ajayi, A.O.; Delgado, M.D.; Bilal, M.; Bello, S.A. Salvaging Building Materials in a Circular Economy: A BIM-Based Whole-Life Performance Estimator. Resour. Conserv. Recycl. 2018, 129, 175–186. [Google Scholar] [CrossRef]
- Huysman, S.; De Schaepmeester, J.; Ragaert, K.; Dewulf, J.; De Meester, S. Performance indicators for a circular economy: A case study on post-industrial plastic waste. Resour. Conserv. Recycl. 2017, 120, 46–54. [Google Scholar] [CrossRef]
- Adibi, N.; Lafhaj, Z.; Yehya, M.; Payet, J. Global Resource Indicator for life cycle impact assessment: Applied in wind turbine case study. J. Clean. Prod. 2017, 165, 1517–1528. [Google Scholar] [CrossRef]
- Platform CB’23. Meten van Circulariteit. Available online: https://platformcb23.nl/actieteams/archief/meten-van-circulariteit (accessed on 20 February 2023).
- O’Grady, T.; Minunno, R.; Chong, H.Y.; Morrison, G.M. Design for disassembly, deconstruction and resilience: A circular economy index for the built environment. Resour. Conserv. Recycl. 2021, 175, 105847. [Google Scholar] [CrossRef]
- Durmisevic, E.; Brouwer, J. Design Aspects of Decomposable Building Structures. In Proceedings of the CIB TG 39—Design for Deconstruction and Material Reuse, Karlsruhe, Germany, 9 April 2002. [Google Scholar]
- Williams, C.C.; Millington, A.C. The diverse and contested meanings of sustainable development. Geogr. J. 2004, 170, 99–104. [Google Scholar] [CrossRef]
- De Oliveira Neto, G.C.; Pinto, L.F.R.; Amorim, M.P.C.; Giannetti, B.F.; de Almeida, C.M.V.B. A Framework of Actions for Strong Sustainability. J. Clean. Prod. 2018, 196, 1629–1643. [Google Scholar] [CrossRef]
- Vieira, M.; Huijbregts, M.A.J. Mineral Resource Scarcity; LC-Impact: Trondheim, Norway, 2019. [Google Scholar]
- Vieira, M.D.M.; Ponsioen, T.C.; Goedkoop, M.J.; Huijbregts, M.A.J. Surplus Ore Potential as a Scarcity Indicator for Resource Extraction. J. Ind. Ecol. 2017, 21, 381–390. [Google Scholar] [CrossRef]
- Durmisevic, E.; Ciftcioglu, Ő.; Anumba, C.J. Knowledge Model for Assessing Disassembly Potential of Structures. In Deconstruction and Material Reuse, Proceedings of the 11th Rinker International Conference, Gainesville, FL, USA, 7–10 May 2003; CIB: New York City, NY, USA, 2003. [Google Scholar]
- Huijbregts, M.A.J.; Steinmann, Z.J.N.; Elshout, P.M.F.; Stam, G.; Verones, F.; Vieira, M.; Zijp, M.; Hollander, A.; van Zelm, R. ReCiPe2016: A harmonised life cycle impact assessment method at midpoint and endpoint level. Int. J. Life Cycle Assess. 2017, 22, 138–147. [Google Scholar] [CrossRef]
- RIVM LCIA: The ReCiPe Model. Available online: https://www.rivm.nl/en/life-cycle-assessment-lca/recipe (accessed on 9 November 2022).
- Amatek ALLOY 316 & 316L—UNS S31600—WNR 1.4401. Available online: https://www.finetubes.co.uk/products/materials/stainless-steel-tubes/alloy-316-uns-s31600-wnr-14401 (accessed on 2 December 2022).
- Rauta Group Peculiarities of Using Cor-Ten Steel in Construction. Available online: https://rautagroup.com/en/peculiarities-of-using-cor-ten-steel-in-construction/ (accessed on 2 December 2022).
- Merinox Titanium Grade II. Available online: https://merinox.nl/product/titanium-grade-ii/ (accessed on 2 December 2022).
- Van den Berg, M.; Voordijk, H.; Adriaanse, A. Recovering building elements for reuse (or not)–Ethnographic insights into selective demolition practices. J. Clean. Prod. 2020, 256, 120332. [Google Scholar] [CrossRef]
- Anastasiades, K.; Goffin, J.; Rinke, M.; Buyle, M.; Audenaert, A.; Blom, J. Standardisation: An essential enabler for the circular reuse of construction components? A trajectory for a cleaner European construction industry. J. Clean. Prod. 2021, 298, 126864. [Google Scholar] [CrossRef]
- Brütting, J.; Vandervaeren, C.; Senatore, G.; De Temmerman, N.; Fivet, C. Environmental impact minimization of reticular structures made of reused and new elements through Life Cycle Assessment and Mixed-Integer Linear Programming. Energy Build. 2020, 215. [Google Scholar] [CrossRef]
- Anastasiades, K.; Lambrechts, T.; Mennes, J.; Audenaert, A.; Blom, J. Formalising the R of Reduce in a Circular Economy Oriented Design Methodology for Pedestrian and Cycling Bridges. J 2022, 5, 35–50. [Google Scholar] [CrossRef]
- Anastasiades, K.; Audenaert, A.; Blom, J. Predicting material consumption in a Circular Economy oriented design methodology for pedestrian and cycling bridges. In Proceedings of the IOP Conference Series: Earth and Environmental Science, sbe22 Berlin D-A-CH Conference: Built Environment within Planetary Boundaries; IOP Publishing: Berlin, Germany, 2022; Volume 1078. [Google Scholar]
- Van Steirteghem, J. A Contribution to the Optimisation of Structures Using Morphological Indicators; Vrije Universiteit Brussel: Brussels, Belgium, 2006. [Google Scholar]
- Latteur, P. Eléments d’optimisation structurale. In Calculer une Structure: De la Théorie à l’Exemple; L’Harmattan/Academia editors: Louvain-la-Neuve, Belgium, 2016; pp. 411–463. ISBN 9782806102706. [Google Scholar]
- CEN. Eurocode: Basis of Structural Design; CEN-CENELEC Management Centre: Brussels, Belgium, 2002. [Google Scholar]
- ClickDesign ClickDesign. Available online: https://jklewski.github.io/ClickDesignD/ (accessed on 5 October 2022).
- Forest and Wood Products Australia Ltd. TimberLife Educational Software Program. Available online: https://www.woodsolutions.com.au/timberlife-educational-software-program (accessed on 5 October 2022).


| Indicator | Functional Unit | Reduce | Reuse | Recycle | Recover |
|---|---|---|---|---|---|
| MCI [19] | mass | -input of sustainably produced renewable resources -waste generated through the recycling input and output processes -service life extension | -input of reused components -output of reusable components | -input of recycled material -output of recyclable material | -output of material for energy recovery -output of material for composting |
| CI Madaster [20] | mass | -input of rapidly renewable resources -waste generated through the recycling input and output processes -service life extension | -input of reused components -output of reusable components | -input of recycled material -output of recyclable material | |
| MCI Jiang [21] | Economic value/mass | -input of sustainably produced renewable resources -waste generated through the recycling input and output processes -service life extension | -input of reused components -output of reusable components -DfD allowing reuse -residual value indicator determining the deterioration rate of the material | -input of recycled material -output of recyclable material through functional-technical assessment | -output of material for energy recovery -output of material for composting |
| BCCI [22] | mass | -input of sustainably produced renewable resources -scarcity indicator based on Surplus Ore Potential -robustness indicator awards functional overdesign -adaptability indicator | -input of reused components -output of reusable components through their transportability and uniqueness | -input of recycled material -output of recyclable material | |
| BCI Verberne [23] | mass | -input of sustainably produced renewable resources -waste generated through the recycling input and output processes -service life extension | -input of reused components -output of reusable components -DfD allowing reuse | -input of recycled material -output of recyclable material | |
| BCI van Vliet [24] | mass | -input of sustainably produced renewable resources -waste generated through the recycling input and output processes -service life extension | -input of reused components -output of reusable components -DfD allowing reuse | -input of recycled material -output of recyclable material | |
| BCI Alba Concepts [25] | mass | -waste generated through the recycling input and output processes -service life extension | -input of reused components -waste generated through the reuse output processes - DfD allowing reuse | -input of recycled material | |
| CBI [26] | mass | -input of sustainably produced renewable resources -waste generated through the recycling input and output processes -service life extension | -input of reused components -output of reusable components -DfD allowing reuse | -input of recycled material -output of recyclable material | |
| RPI [27] | mass | -potential recyclability of output material | |||
| WLPE [28] | volume | -reuse potential of buildings through functional-technical assessment | -output of recyclable material through functional-technical assessment | ||
| CPI [29] | mass | -potential recyclability of output material -environmental impact of recycling | -potential of output material for energy recovery -environmental impact of energy recovery | ||
| GRI [30] | mass | -scarcity indicator based on Abiotic Depletion Potential -geopolitical availability indicator | -recycling and dispersion to other processes | ||
| CB’23 [31] | mass | -output waste -primary non-renewable material input -input of sustainably produced renewable resources -input of non-sustainably produced renewable resources -physical scarcity indicator -geopolitical scarcity indicator -environmental impact assessment | -input of reused components -output of reusable components through functional-technical and economic value assessment | -input of recycled material -output of recyclable material through functional-technical and economic value assessment | -output of material for energy recovery |
| 3DR [32] | mass | -DfD allowing reuse -output of reusable components through functional-technical assessment |
| Material | Constituent | Fraction [%] |
|---|---|---|
| Aluminium 6063 [41] | aluminium (Al) | 97.650 |
| magnesium (Mg) | 0.900 | |
| silicon (Si) | 0.600 | |
| iron (Fe) | 0.350 | |
| chrome (Cr) | 0.100 | |
| copper (Cu) | 0.100 | |
| manganese (Mn) | 0.100 | |
| titanium (Ti) | 0.100 | |
| zinc (Zn) | 0.100 | |
| stainless steel S316 [41] | iron (Fe) | 61.845 |
| nickel (Ni) | 14.000 | |
| chrome (Cr) | 18.000 | |
| molybdenum (Mo) | 3.000 | |
| silicon (Si) | 1.000 | |
| manganese (Mn) | 0.100 | |
| carbon (C) | 0.080 | |
| phosphorous (P) | 0.045 | |
| sulfur (S) | 0.030 | |
| Corten steel grade A [42] | iron (Fe) | 95.940 |
| nickel (Ni) | 0.650 | |
| chrome (Cr) | 1.250 | |
| copper (Cu) | 0.550 | |
| silicon (Si) | 0.750 | |
| manganese (Mn) | 0.500 | |
| aluminium (Al) | 0.060 | |
| carbon (C) | 0.120 | |
| phosphorous (P) | 0.150 | |
| sulfur (S) | 0.030 | |
| titanium grade II [43] | titanium (Ti) | 99.305 |
| iron (Fe) | 0.300 | |
| nitrogen (N) | 0.030 | |
| carbon (C)C | 0.100 | |
| oxygen (O) | 0.250 | |
| hydrogen (H) | 0.015 |
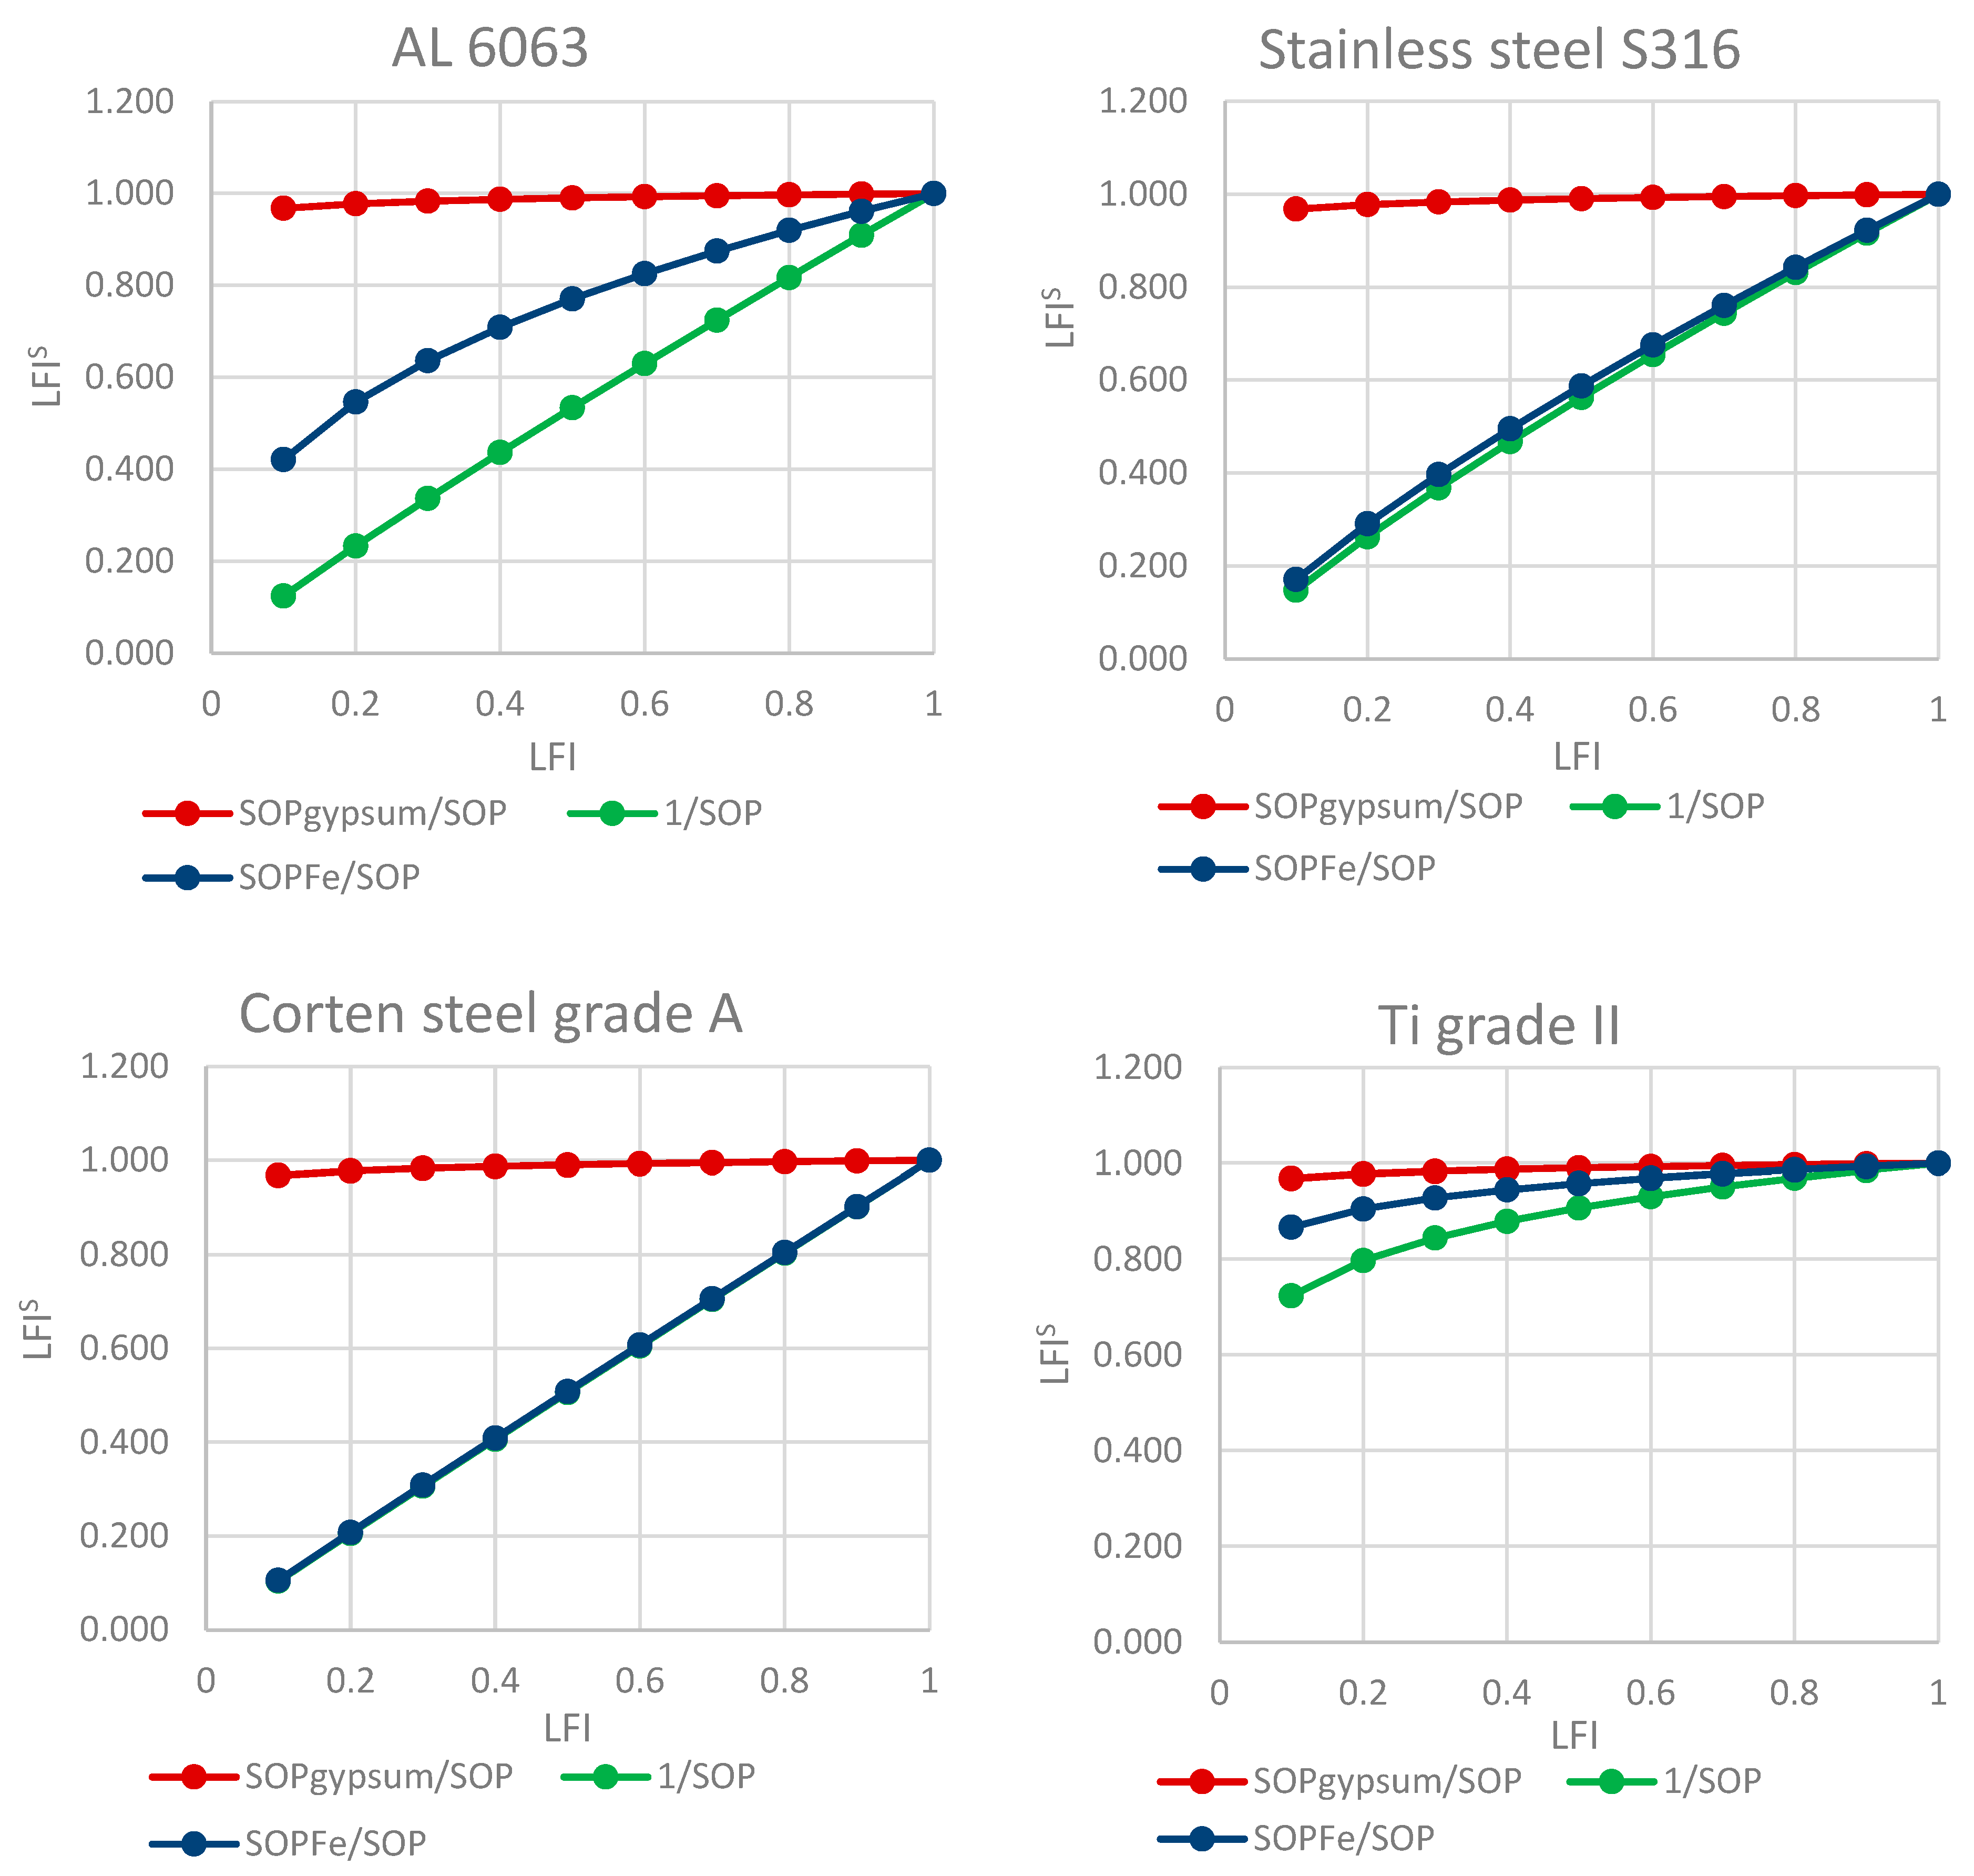
| Material | S = SOPgypsum/SOP | S = 1/SOP | S = SOPFe/SOP |
|---|---|---|---|
| Al 6063 | 0.01 | 0.91 | 0.38 |
| stainless steel S316 | 0.03 | 0.83 | 0.77 |
| construction steel S235 | 0.04 | 1.00 | 1.00 |
| Corten steel grade A | 0.04 | 0.98 | 0.98 |
| Ti grade II | 0.01 | 0.14 | 0.06 |
Disclaimer/Publisher’s Note: The statements, opinions and data contained in all publications are solely those of the individual author(s) and contributor(s) and not of MDPI and/or the editor(s). MDPI and/or the editor(s) disclaim responsibility for any injury to people or property resulting from any ideas, methods, instructions or products referred to in the content. |
© 2023 by the authors. Licensee MDPI, Basel, Switzerland. This article is an open access article distributed under the terms and conditions of the Creative Commons Attribution (CC BY) license (https://creativecommons.org/licenses/by/4.0/).
Share and Cite
Anastasiades, K.; Blom, J.; Audenaert, A. Circular Construction Indicator: Assessing Circularity in the Design, Construction, and End-of-Life Phase. Recycling 2023, 8, 29. https://doi.org/10.3390/recycling8020029
Anastasiades K, Blom J, Audenaert A. Circular Construction Indicator: Assessing Circularity in the Design, Construction, and End-of-Life Phase. Recycling. 2023; 8(2):29. https://doi.org/10.3390/recycling8020029
Chicago/Turabian StyleAnastasiades, Kostas, Johan Blom, and Amaryllis Audenaert. 2023. "Circular Construction Indicator: Assessing Circularity in the Design, Construction, and End-of-Life Phase" Recycling 8, no. 2: 29. https://doi.org/10.3390/recycling8020029