1. Introduction
Cost effectiveness in the production of high-performance batteries is a prerequisite for the commercial success and market acceptance of electric vehicles. Through continuous improvement in the understanding of the individual production steps in the electrode manufacturing process, an improvement in the battery performance has been achieved in recent years despite a simultaneous reduction in the production costs through more efficient process design. Improvements can be achieved, for example, through more energy- or time-efficient processes [
1,
2,
3,
4].
As described by Jaiser et al., the drying process can be seen as the bottleneck for the output of a battery cell production facility. Since a higher drying speed is generally associated with a stronger binder separation, which results in poorer adhesion and performance, throughput can only be increased by increasing the size of the equipment while keeping the drying rate constant [
5].
However, Jaiser et al. have shown that intelligent process control can increase the drying rate without compromising electrode quality [
4]. Such procedures require a high level of process understanding which can be improved by modeling supported by experimental data. Additionally, modeling is a tool to increase process design speed and maturity.
Using a coarse-grained molecular dynamics approach, Forouzan et al. were able to approximate the suspension viscosity, elasticity, and shrinkage rates of the dried film. The virtually generated structures resembled SEM images of the real reference electrodes [
6].
Font et al. developed a method for the prediction of mass transport in the binder phase during the drying process using an advection–diffusion model and were able to match experimental results sufficiently [
7].
In this work, the data generated in a previous publication were used to develop a modeling approach for the establishment of the binder distribution in electrodes during the drying process [
8]. In addition to Font’s approach, thermogravimetrical analysis was used to characterize the mobile share of the binder. A detailed description and discussion of the experimental results has been published previously [
8].
1.1. Drying of Battery Electrodes
During the drying process, the liquid phase within the film evaporates. This only happens if the vapor pressure of the liquid of the film to be dried exceeds the vapor pressure of the surrounding medium. This is achieved, among others, by heating the material to be dried using hot process air. Drying is, therefore, a combination of heat input, to increase the vapor pressure of the film to be dried, and mass transfer of the solvent from the material into the gas phase. During evaporation, the vapor pressure of the liquid in the film is greater than that of the surrounding medium and thus the boiling point is exceeded [
9].
1.2. Course of Drying
The drying process is generally divided into two main drying phases: the first drying phase with a constant drying rate (constant rate period—CRP) and the second drying phase with a decreasing drying rate (falling rate period—FRP). There also may be a pre-drying phase in which an equilibrium is achieved. The pre-drying phase describes both the temporal range and local area between the coating and before drying (CRP) so that this is a practical classification and will be neglected in the theoretical consideration of the drying process. With low-boiling point solvents, drying can already begin here [
10]. Additionally, the suspension and the substrate were preheated in the model experiments.
During the first drying phase (CRP), the drying speed is only influenced by the mass transfer resistance of the drying air (moisture content, temperature, and inflow of the air) since a thin liquid film is present on the film surface and this is maintained by capillary forces. Consequently, the drying rate is constant under the given drying settings and the coating temperature corresponds to the cooling limit temperature. The supplied thermal energy is used directly for the evaporation of the solvent and, therefore, the drying rate also increases with increasing heat input [
9,
10].
If the solvent no longer moves from the inside of the film to the surface in a way that the film is fully covered on the surface, i.e., at least parts of the film surface have dried, the second drying phase starts (FRP). In this second phase, the drying speed is increasingly determined by the transport properties within the film, i.e., within the pore network of the film. The drying rate decreases so that the temperature of the film increases until it matches the temperature of the corresponding drying air [
9,
10].
Finally, the dried film is in balance with the environmental gas phase. For hygroscopic film components, this section is also called the third drying section [
9,
10].
1.3. Structural Formation of Battery Electrodes
After coating the suspension film on the metal foil, the solid components are mobile in the liquid phase. Only in the course of drying are these immobilized and the electrode structure, which determines the application-specific properties of the electrode, is fundamentally formed. As a result, an understanding of the structural formation during drying is of great importance. Nevertheless, only a few publications concentrate on structural formation during the process. The evaporation of the solvent reduces the layer thickness until the final porosity is reached. A strong decrease in film thickness and an overall fast drying process cause a strong rearrangement of the particles, which may lead to an inhomogeneous distribution of the solid components [
6].
When drying battery electrodes, the formation of a top-down consolidation layer of the coating film is described in several publications [
5,
11,
12]. This is understood to be a top-down consolidation of particles on the coating surface at the beginning of the drying process [
13]. This consolidation front moves further down the coating during the drying process and incorporates particles. While an accumulation of both binder and active material particles in the consolidation layer was assumed by Baunach et al. [
11] and Jaiser et al. [
5], Kim et al. [
12] described a consolidation layer of the binder caused by the sedimentation of the active material particles. However, current investigations have shown that no consolidation layer is formed during the drying of battery electrodes but that the distribution of the active material particles over the layer height remains constant during drying [
14]. Furthermore, it has been shown that pores empty out according to the Young–Laplace equation. Accordingly, there is no downward solvent front, as is usually assumed when drying porous materials; the pores empty homogeneously over the coating layer, which shows that the diffusion into the bigger pore channels is the limiting factor over the diffusion out of the main channels to the surface. Further investigations have shown that the pores empty before the end of the film reduction or after the end of the film reduction depending on the particle shape and the drying rate [
15].
1.4. Binder Migration
Binder migration refers to the gradient of the binder over the layer height, which is formed during the drying process. At the beginning of the drying process, a homogeneous distribution of the binder in the suspension layer is assumed. At certain drying parameters, the concentration of the binder in the upper part of the coating increases so that a gradient between this upper part and the lower part of the coating close to the substrate with a low binder content is formed. The binder migration or segregation has been described as independent of the solvent–binder mixture and therefore occurs both in anode and in cathode electrodes. Hagiwara et al. displayed the segregation of SBR for a graphite anode with the binder mixture CMC–SBR for water-based suspensions [
16]. The segregation of PVDF in an NMP-based cathode suspension was investigated within several publications [
5,
14,
17,
18].
Strictly speaking, the sedimentation of solid components in the coating film and the associated deposition of a solvent film with particles of low density or dissolved substances on the surface is not a drying-induced defect. The reason for this is that the evaporation of the solvent does not directly cause this and therefore this cannot be controlled to a significant extent by the drying process. In fact, the sedimentation results from an unstable suspension with a high proportion of plastic plasticity. For battery electrodes, the sedimentation of active material particles in the coating film was observed as a cause of segregation during the drying process [
12,
19,
20,
21,
22]. These results were obtained with suspensions with low solids content and associated low viscosity and insufficient stability [
12,
19,
20,
21,
22]. Furthermore, Stein et al. described segregation by sedimentation after drying times greater than 16 h [
22]. Despite the use of stable slurries, a binder gradient can be formed in the coating. It has been shown that the binder migration increases with increasing drying temperatures [
11,
16,
23]. The flow of process air into the coating film is also decisive [
5,
23]. Thus, an increase in the air velocity leads to the formation of a binder gradient, as does an increased drying temperature. On the basis of these investigations, a correlation of binder migration with the drying rate can be assumed. The higher the drying rate, the more pronounced the binder gradient.
Binder migration has been described in a large number of publications. A distinction is made between detection by spectroscopic and mechanical methods.
Spectroscopic methods allow the direct detection of the binder. A particularly noteworthy feature is the representation of a gradient of PVDF over the fluorine content using a secondary electron microscope (SEM) and energy-dispersive X-ray spectroscopy (EDX), as described by Müller et al. [
18]. This method is used both to visualize the fluorine content in the coating cross-section [
18] and to show the changes on the surface and the coating side facing the substrate [
5]. Jaiser et al. extended this method and illustrated the drying process on freeze-dried anode samples using Cryo-SEM [
14]. Hagiwara et al. detected the distribution changes of SBR in freeze-dried anodes by Raman spectroscopy [
16]. Using a fluorescence microscope, the accumulation of fluorescent latex particles on the top of the film can be detected [
12]. In addition, the binder gradient can be determined indirectly via the mechanical strength of the coating. With increasing binder migration, the adhesive force between the substrate and coating as well as the cohesive force in the area of the coating close to the substrate is reduced. The degree of segregation can be derived by analyzing the adhesive strength. In the literature and in industry, both 90° peel-off tests and face peel tests are used [
5,
15,
23].
The mechanical consequences of binder migration on adhesion strength, as described above, may mean that a higher binder content must be used to ensure mechanical integrity during subsequent processing steps. This can negatively affect the power and energy density of the battery cell. Further mechanical consequences are described by Westphal et al. [
23] who explain the changes in elastic and plastic deformability. Furthermore, a binder gradient affects the electrical and electrochemical properties. For example, Westphal et al. determined increased electrical resistances at segregated electrodes, as established by conductivity analysis [
23]. In addition, the influence on impedances determined by electrochemical impedance spectroscopy was shown [
17,
22]. This, in turn, is reflected in the electrochemical performance, which deteriorates with increasing binder gradients due to the worsening of electron and charge transfer at the active material particle to electrolyte interface area, which can be attributed to the insulating nature of the binder [
5,
17,
22]. At the same time, analogous to the binder migration, a segregation of the conductive carbon black can be assumed and thus a depletion of carbon black in the lower region of the electrode leads to a deterioration in the electrical conductivity [
24].
1.5. Modeling of Binder Migration
The authors are aware of two approaches to model binder migration during the drying of lithium-ion electrodes.
The 1D model of Font et al. [
7] describes the transport processes during drying with the help of a convection term, describing the shrinkage of the wet film, and a diffusion term. The diffusion term is based on the determination of the diffusion coefficient using the Einstein–Stoke equation and the effective diffusion coefficient using the Bruggeman approach [
25].
Font et al. were thus able to map differently-pronounced binder gradients for different drying speeds. The modeling ends as soon as the final layer thickness is reached. This leads to an inaccuracy of the model, since Jaiser et al. have shown that even after the final layer thickness is reached, binder transport still takes place, which can increase or decrease segregation depending on the drying rate [
5,
14,
15].
In addition to the approach of Font, there is the molecular dynamic approach of Lombardo et al. [
26]. This allows 3D spatial resolution of the inactive materials. This methodology is based on a particle-based mapping of the electrode in which carbon black binder replacement particles (CBD) are used in addition to active material particles. In the course of drying, these CBD particles shrink to represent the evaporation of the solvent. Shrinkage occurs faster near the electrode surface. The attractive, interparticle forces of the CBD particles are enhanced depending on how much solvent has already been removed in that particular area. Capillary suction towards the electrode surface and thus binder migration can be imaged. With the help of this approach, it was also possible to map the influence of complex drying profiles, as in the experimental work of Jaiser et al. [
4].
2. Materials and Methods
A detailed description is available in a previous publication [
8].
The reference anode consists of 90 wt % active material, overall 5 wt % binder, and 5 wt % conductive agent. The active material has a particle median size of x50 = 19 μm and of 3 m2 g−1 in a specific surface area. The used binder was 50% Na-CMC (Walocel CRT 2000 PA, Dow Wolff, Bomlitz, Germany) and 50% SBR (Lipaton SB 521, Synthomer, Harlow, England). Carbon black, with a primary particle size of x50 = 40 nm and a specific surface of 63 m2 g−1 (C-Nergy Super C65, Imerys, Bodo, Switzerland), was used. Apart from the SBR binder, all materials were premixed dryly with a shaker mixer (Turbula T2F, Willi A. Bachofen, Muttenz, Schwitzerland) until a homogeneous mixture was achieved. The dispersion step was performed with a dissolver (Dispermat C A60, VMA-Getzmann, Reichsdorf, Germany) in which the premixed materials were mixed with deionized water at a circumferential speed of 9 m/s for 60 min. The SBR binder was added at the end of the mixing procedure as it is being shear sensitive. The slurry had a solids content of 48 wt %. The electrode was created via a doctor blade coating process with a discontinuous device (ZAA 2300, Zehntner, Sissach, Switzerland) which uses a heating plate to dry the electrode. The slurry and the copper foil substrate were preheated to compensate a slow heating-up. Laser triangulation was used to measure the film thickness (LK-H052, Keyence Germany GmbH, Neu-Isenburg, Germany) and the temperature was measured with a thermocouple (type K). By removing the coating throughout the drying and measuring the solid content, the evaporation was analyzed. The sodium within the cross section of the electrode was measured with by energy dispersive X-ray spectroscopy (EDX, Q455 CFlash 5030/300, Bruker AXS, Karlsruhe, Germany).
3. Convection–Diffusion Equation
In general, the mass transport of a species consists of a convective and a diffusive material flow and a reaction term together [
27], see Equation (1).
with the time
t, distance
x, concentration
c, diffusion coefficient
D, and velocity
v.
S represents a reaction term which can be neglected in the context of the drying of battery electrodes.
The diffusive term underlies Brownian molecular motion and is undirected. The change in concentration caused by this is proportional to the concentration, see
Section 3.1. The convection term stands for a directional movement caused by system changes applied from outside. A change in the pore diameter distribution leads approximately to a convective flow according to the Kelvin equation, compare
Section 3.2.
3.1. Diffusion and Tortuosity
The diffusive mass flow
is proportional to the change in concentration of the substance and results from the amount of particles that pass through area A per time unit due to diffusive mass transport, described by Fick’s first law in Equation (2). The proportionality factor is called the diffusion coefficient
D [
9,
27,
28].
In order to be able to calculate
D, several models are available. The Stokes-Einstein equation (see Equation (3)) with the Boltzmann constant
kb, the temperature
T, and the dynamic viscosity
η are used to calculate
D, of disperse or dissolved substances, with radius
r [
27,
29].
This equation allows an estimation of the diffusion coefficient for large spherical molecules in dilute solutions but for an engineering estimation of
D, the use at concentrations up to 10 mol% is acceptable [
29]. Thus, the Stokes-Einstein equation is also used to calculate the diffusion coefficient in battery suspensions [
11,
12].
In porous systems,
D is reduced due to the extended paths through the pore network. The tortuosity of the pores is called
τC and is composed of the ratio of the effective path length through a porous layer
heff and the direct path length, i.e., the layer height
h. In some cases,
τC is represented as the square ratio of these two path lengths [
30,
31,
32]. For the description of the effective diffusion coefficient
Deff, different models have been developed which include porosity and/or tortuosity [
33,
34]. The model shown in Equation (4) is often used to calculate
Deff via the ratio of porosity
ε to
τC [
31,
35].
This equation has become accepted for the description of
Deff for battery electrodes so that many publications refer to it [
36,
37,
38,
39,
40,
41]. The porosity can be determined, for example, by mercury intrusion, see [
8]. Tortuosity, on the other hand, is usually developed using models that use porosity. The fact that the tortuosity is not clearly defined is often superfluous in that in most publications,
τC is estimated using the same models based on porosity. The most common model for estimating
τC describes Equation (5) with the Bruggeman coefficient
αC [
25,
32].
The Bruggeman coefficient is specified for spherical particles with
αC = 1.5 and for cylindrical particles with
αC = 2 [
25,
32]. Due to the relevance of the tortuosity of the electrodes for the electrochemical performance of the battery cell with respect to the pores taking up the electrolyte, a large number of publications concentrate on the verification of the Bruggeman coefficient for application in lithium-ion battery electrodes. Hutzenlaub et al. find a good agreement for
αC = 1.5 for cathodes with LiCoO
2 (LCO) as active material [
42] whereas Lim et al. detects
αC > 2 for LCO cathodes [
43]. Ebner and Wood can also show good agreement for spherical cathode materials (NMC, LCO) even if
αC is slightly above 1.5 [
30]. Bruggeman coefficients in the range of 1.5 <
αC < 1.7 were found to be correct by Yu et al. for cathodes with LiFePO
4 as an active material at porosities 0.4 <
αC < 0.6 [
44]. Also, for cathodes with LiFePO
4, Thorat et al. found a good agreement with
αC = 1.5 but the Equation (5) was extended by a factor of 1.8 [
40]. Bruggeman coefficients were simulated by Kehrwald et al. for electrodes with low porosity (
αC < 0.17), namely slightly below
αC < 2 [
45]. Furthermore, Du et al. simulated a good agreement of Equation (5) for
αC = 1.68 for ellipsoidal particles [
46]. For graphite particles, a strong dependence of the investigated axis was found so that in the x and y directions
αC < 2 but in the z direction
αC < 3 was determined.
3.2. Capillarity
For a three-phase system, as is the case for drying with the process air, the solvent and the film are to be dried; the relationship between the ratio of the prevailing pressure
p, the saturation vapor pressure
p0, and the mean radius of a cylindrical pore idealized here is expressed with the Kelvin equation (Equation (6)) [
47].
with the density difference in the liquid and gaseous phase (
ρl − ρg),
R is the universal gas constant,
T is the temperature, γs
urface is the surface tension of the liquid surface, and the contact angle
θ.
rm is the average radius of curvature of the liquid meniscus which correlates with the pore radius. The equation describes the state in equilibrium so that a radius
rm (critical radius) results under given boundary conditions. In a closed system, there cannot be different capillary pressures in equilibrium due to the Kelvin stability. If the equilibrium is disturbed, e.g., due to the extraction of the solvent, and different capillary pressures are present, mass transport takes place until the equilibrium is restored [
48].
3.3. Péclet Number
The Péclet number (
Pe) represents the ratio of the convective to the diffusive material or heat flow. It describes which transport mechanism is the dominant one and governs the transport. In the general form, Pe is derived from
v the velocity,
L the characteristic length, and
D the diffusion coefficient [
27,
49].
If
Pe is used to describe the transport processes during drying, the rate of film reduction or the initial evaporation rate of the solvent is used for the velocity
v [
22,
50,
51]. The characteristic length
L is the wet film thickness. If mass transfer takes place in a porous system, the effective diffusion coefficient
Deff must be used which is lower than
D due to the tortuosity of the layer [
27], as described in
Section 3.1.
In publications, the magnitude of Pe varies with respect to the distinction between a purely diffusive and a purely convective dominated transport. For laminar dispersions in capillaries, Ananthakrishnan et al. gave purely diffusive dominated transport for
Pe < 5 [
52]. A purely convectively dominated transport mechanism is further specified as
Pe > 650. Stein et al., on the other hand, described convection as the dominant transport mechanism for
Pe >> 1, which is accompanied by segregation of the binder [
22]. If Pe is clearly below 1 (
Pe << 1), a homogeneous layer structure is present.
3.4. Influencing Factors of the Binder Migration
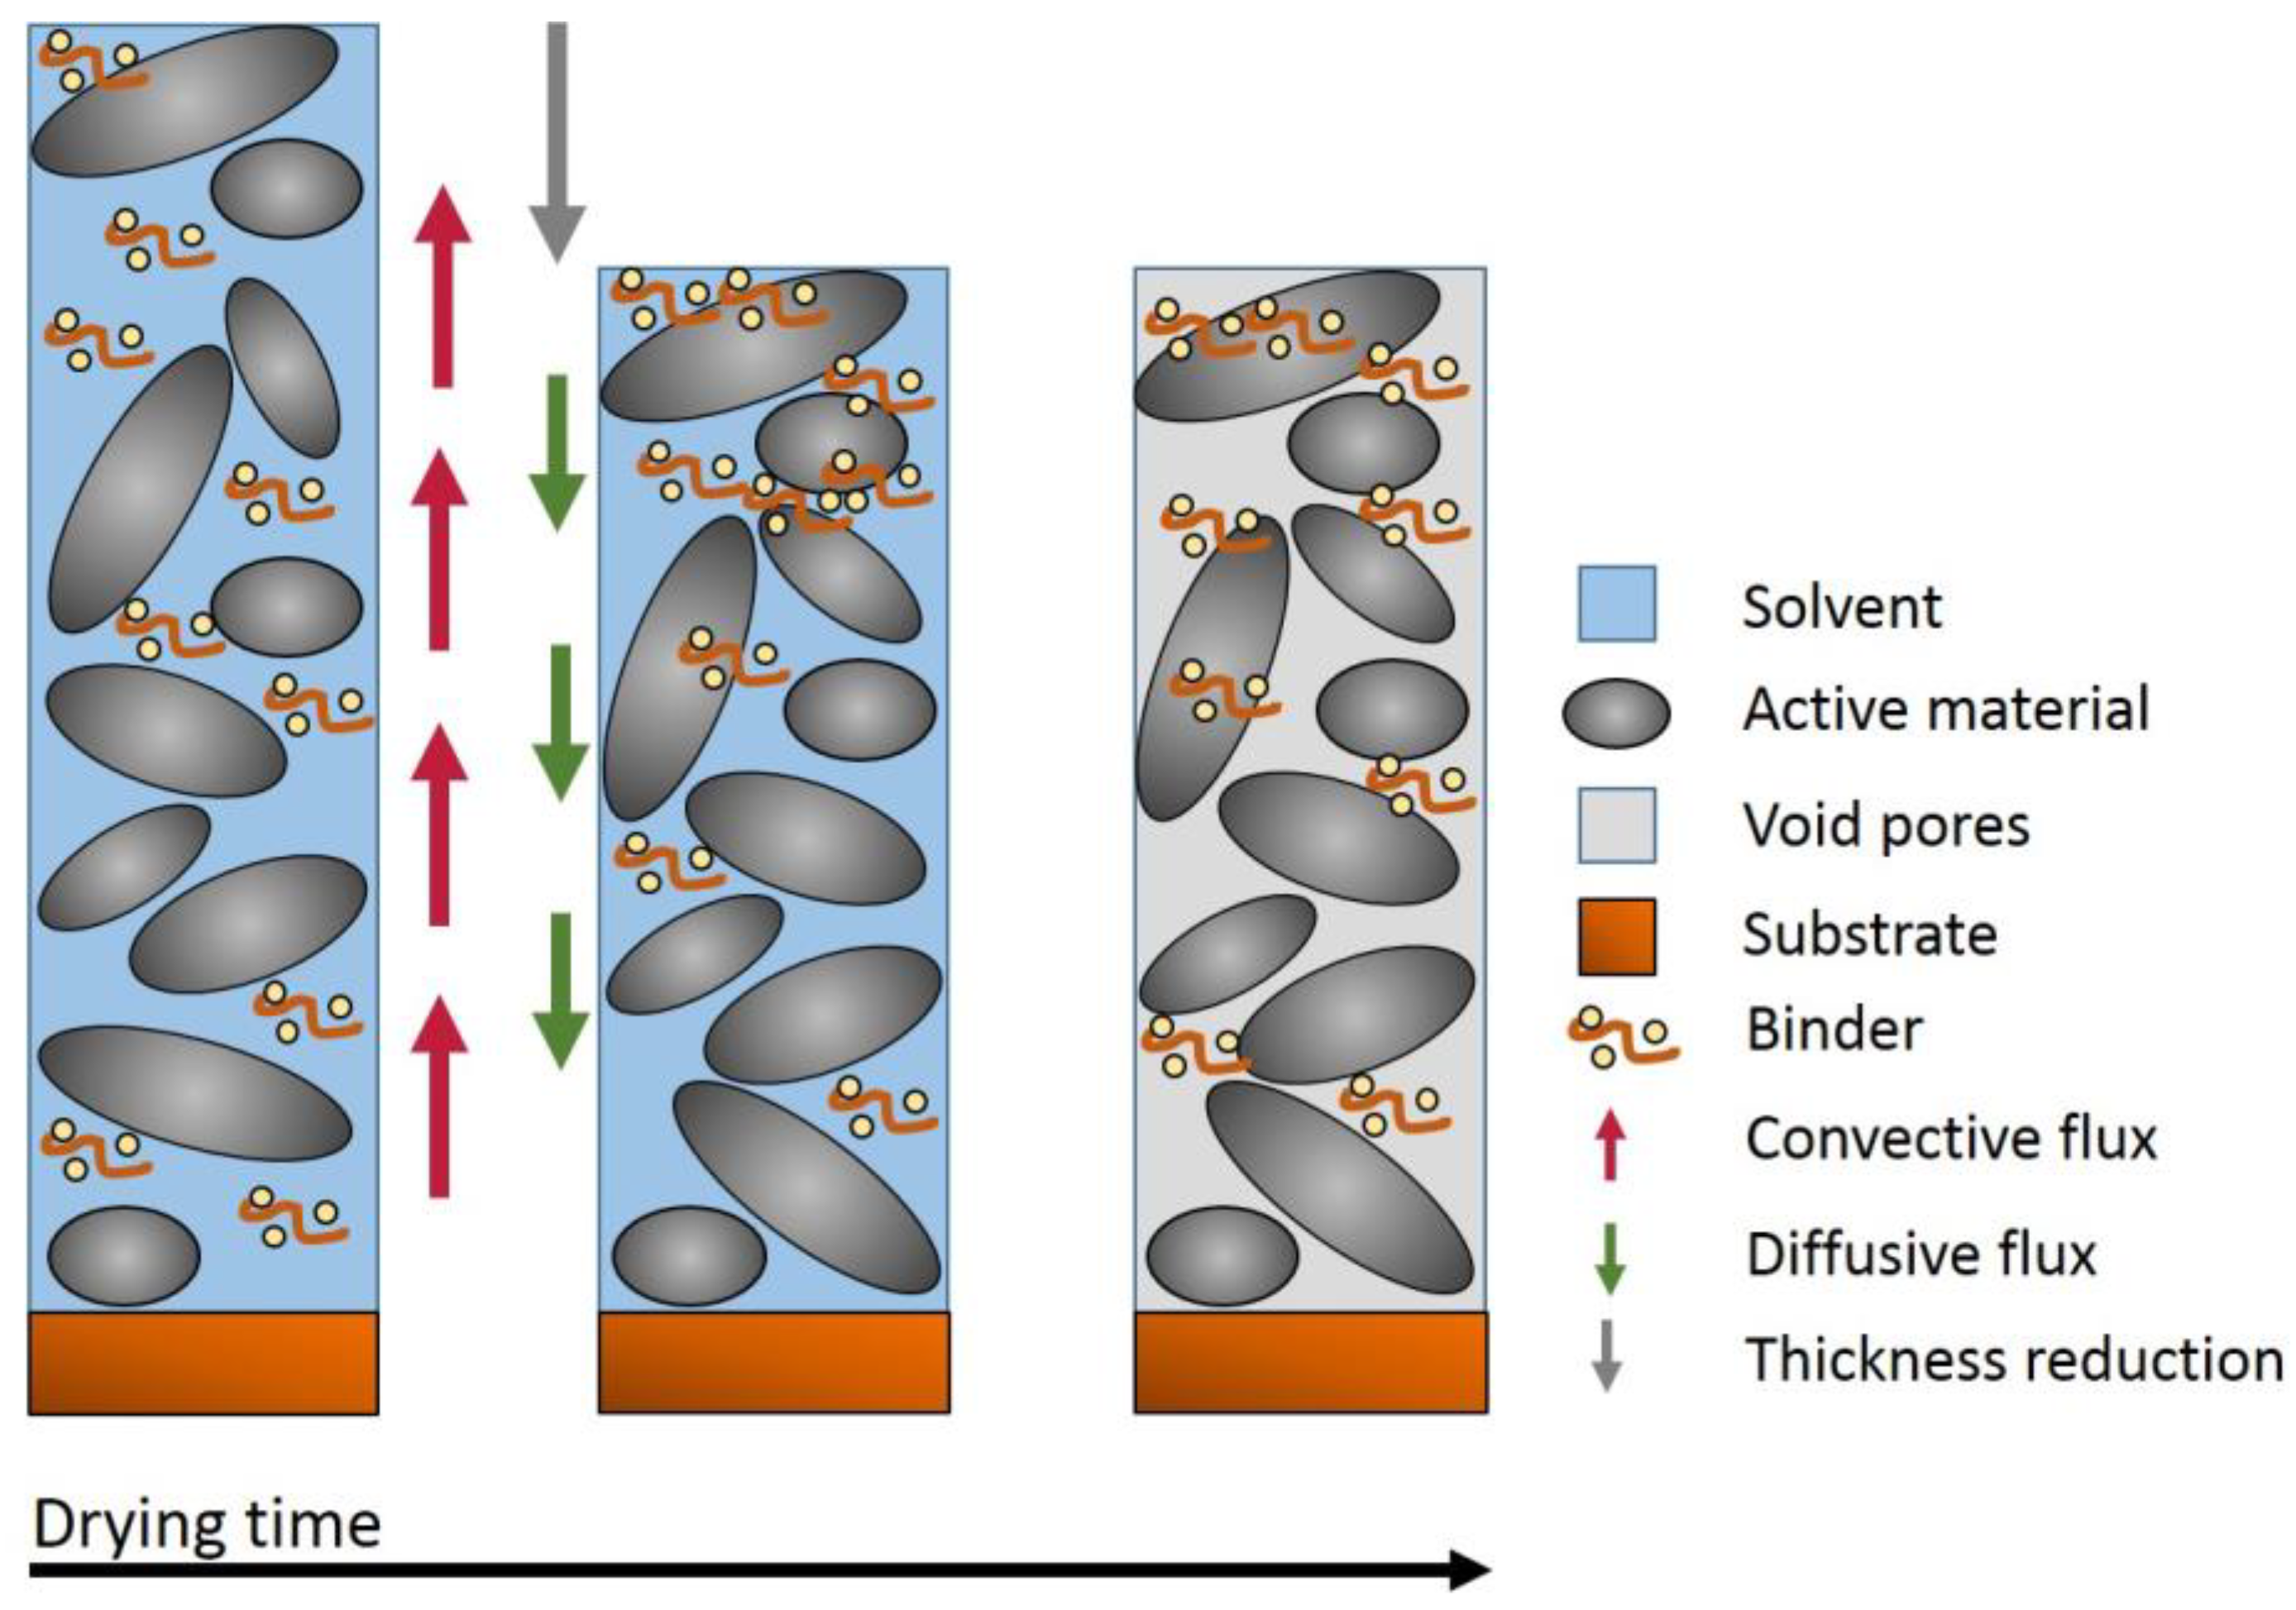
The calculation of the binder distribution is based on the convection–diffusion equation (Equation (1)). Since a binder is neither formed nor dissolved, S = 0 can be estimated. As a result, the binder transport depends on the diffusive and convective mass transport within the porous network of the battery electrode, which is illustrated in
Figure 1.
Accordingly, the migration of the binder during drying is influenced by the following factors:
Convective material flow rate;
Diffusive material flow rate;
Structure of the pore network;
Fraction of pores which are filled with solvent.
Due to the low thickness-to-area ratio of electrodes, it is possible to neglect edge areas. It is assumed that over the length and the width of the coating, a balanced material distribution is reached so that the simulation of the binder migration can focus on the change in binder concentration along the coating height.
Therefore, the binder transport simulations were carried out under the following assumptions:
The particles of the active material define the pore network in which the solvent and the binder are present. Consequently, the active material particles shape the porosity and the layer thickness which decrease during drying;
When the pore radius r is reduced, the ascending height due to capillary forces increases according to h ∝ 1/r. This means that the change in coating thickness results in a movement of the solvent–binder mixture;
The convective material flow of the solvent–binder mixture depends on the velocity of the film reduction and the associated reduction in pore size. The average velocity of the binder matrix is unidirectional and the flow is directed towards the coating surface;
The convective flow ends when the layer thickness is fixed at the time tEoS. Balancing flows within the coating directed to smaller pores continue to take place even after the volume is fixed. Since these pores are distributed homogeneously over the coating thickness, it is assumed that the average velocity of these convective streams is undirected and can be neglected.
The pore network influences the diffusion of the binder. Since the emptying of the pores of the solvent is exclusively pore size dependent, the binder fraction of the solvent is initially reduced in the bigger pores so that the solvent is only present in smaller pores with increasing drying time. It is assumed that a material transport of the binder is only possible if the diameter of a pore is at least 1 µm. Therefore, the diffusive material flow only ends if pores with a diameter of less than 1 µm are filled with solvent.
3.5. Representation of the Model
The simulation of the binder migration is based on the convection–diffusion equation (see Equation (1)). The modified Equations (8)–(10) can be derived [
53].
For the bulk section with 1 >
i >
N:
for the edge region with
i = 1:
for the edge region with
i =
N:
where
u(i) is the calculated binder concentration of the increment i at the time t;
u0(t) is the binder concentration of the increment i at the time t − 1;
Cx is the Courant number, which indicates how many cells a certain quantity moves per timestep at the maximum;
Rx is equivalent to the diffusion coefficient and is explained in
Section 3.7.
The calculation is based on the layer thickness δb, which is divided into N = 100 increments (dx), and on the drying time t.
3.6. Convective Binder Flow
The convective material flow is calculated by
Cx, which is calculated based on the velocity v according to the following equation:
The velocity
v equals the shrinkage rate of the layer thickness ψ and is determined from the experiments carried out in a previous publication [
8], so that the value of 0.16 µm/s > ψ > 2.5 µm/s is used. Since the convective flow goes along with the reduction in layer thickness, this term is only relevant at the beginning of the drying process and becomes irrelevant when the final layer thickness is reached.
3.7. Diffusive Flow of the Binder
The diffusive flow equals the following equation:
The effective diffusion coefficient
Deff is calculated according to Equations (4) and (5) with α
C = 1.5. Furthermore, for the calculation of the diffusion coefficient
D according to Equation (3), a binder radius of
r = 0.1 µm is used which equals the particle size of the binder SBR. In
Section 4.3 and
4.4, a binder radius of r = 0.01 µm is used for the purpose of the elucidation of the influence of the diffusion.
The porosity ε is calculated under the assumption that the porosity decreases linearly from the original value to the final value, which is measured by mercury intrusion and is set to 0.52 for the following calculations. Since the porosity changes during the drying process, Deff is calculated each time step.
To take care of the change in the dynamic viscosity
η and the density ρ dependent on the temperature
T, the following equations for water were used [
54]:
3.8. Mobile Binder Fraction
Due to increasingly emptied pores and binder, which are already bound to the solid materials, the entirety of the binder is not subject to the convective and diffusive flows but remains immobile, distributed over the layer thickness.
In the following equation,
uoverall represents the overall share of the binder;
ufixed represents the immobile share of the binder, which is bound the solid material from the beginning of the drying process; and
uemptiedpores represents the share of immobilized binder due to solvent-free pores, which increases during the drying process.
3.9. Bound Binder Share
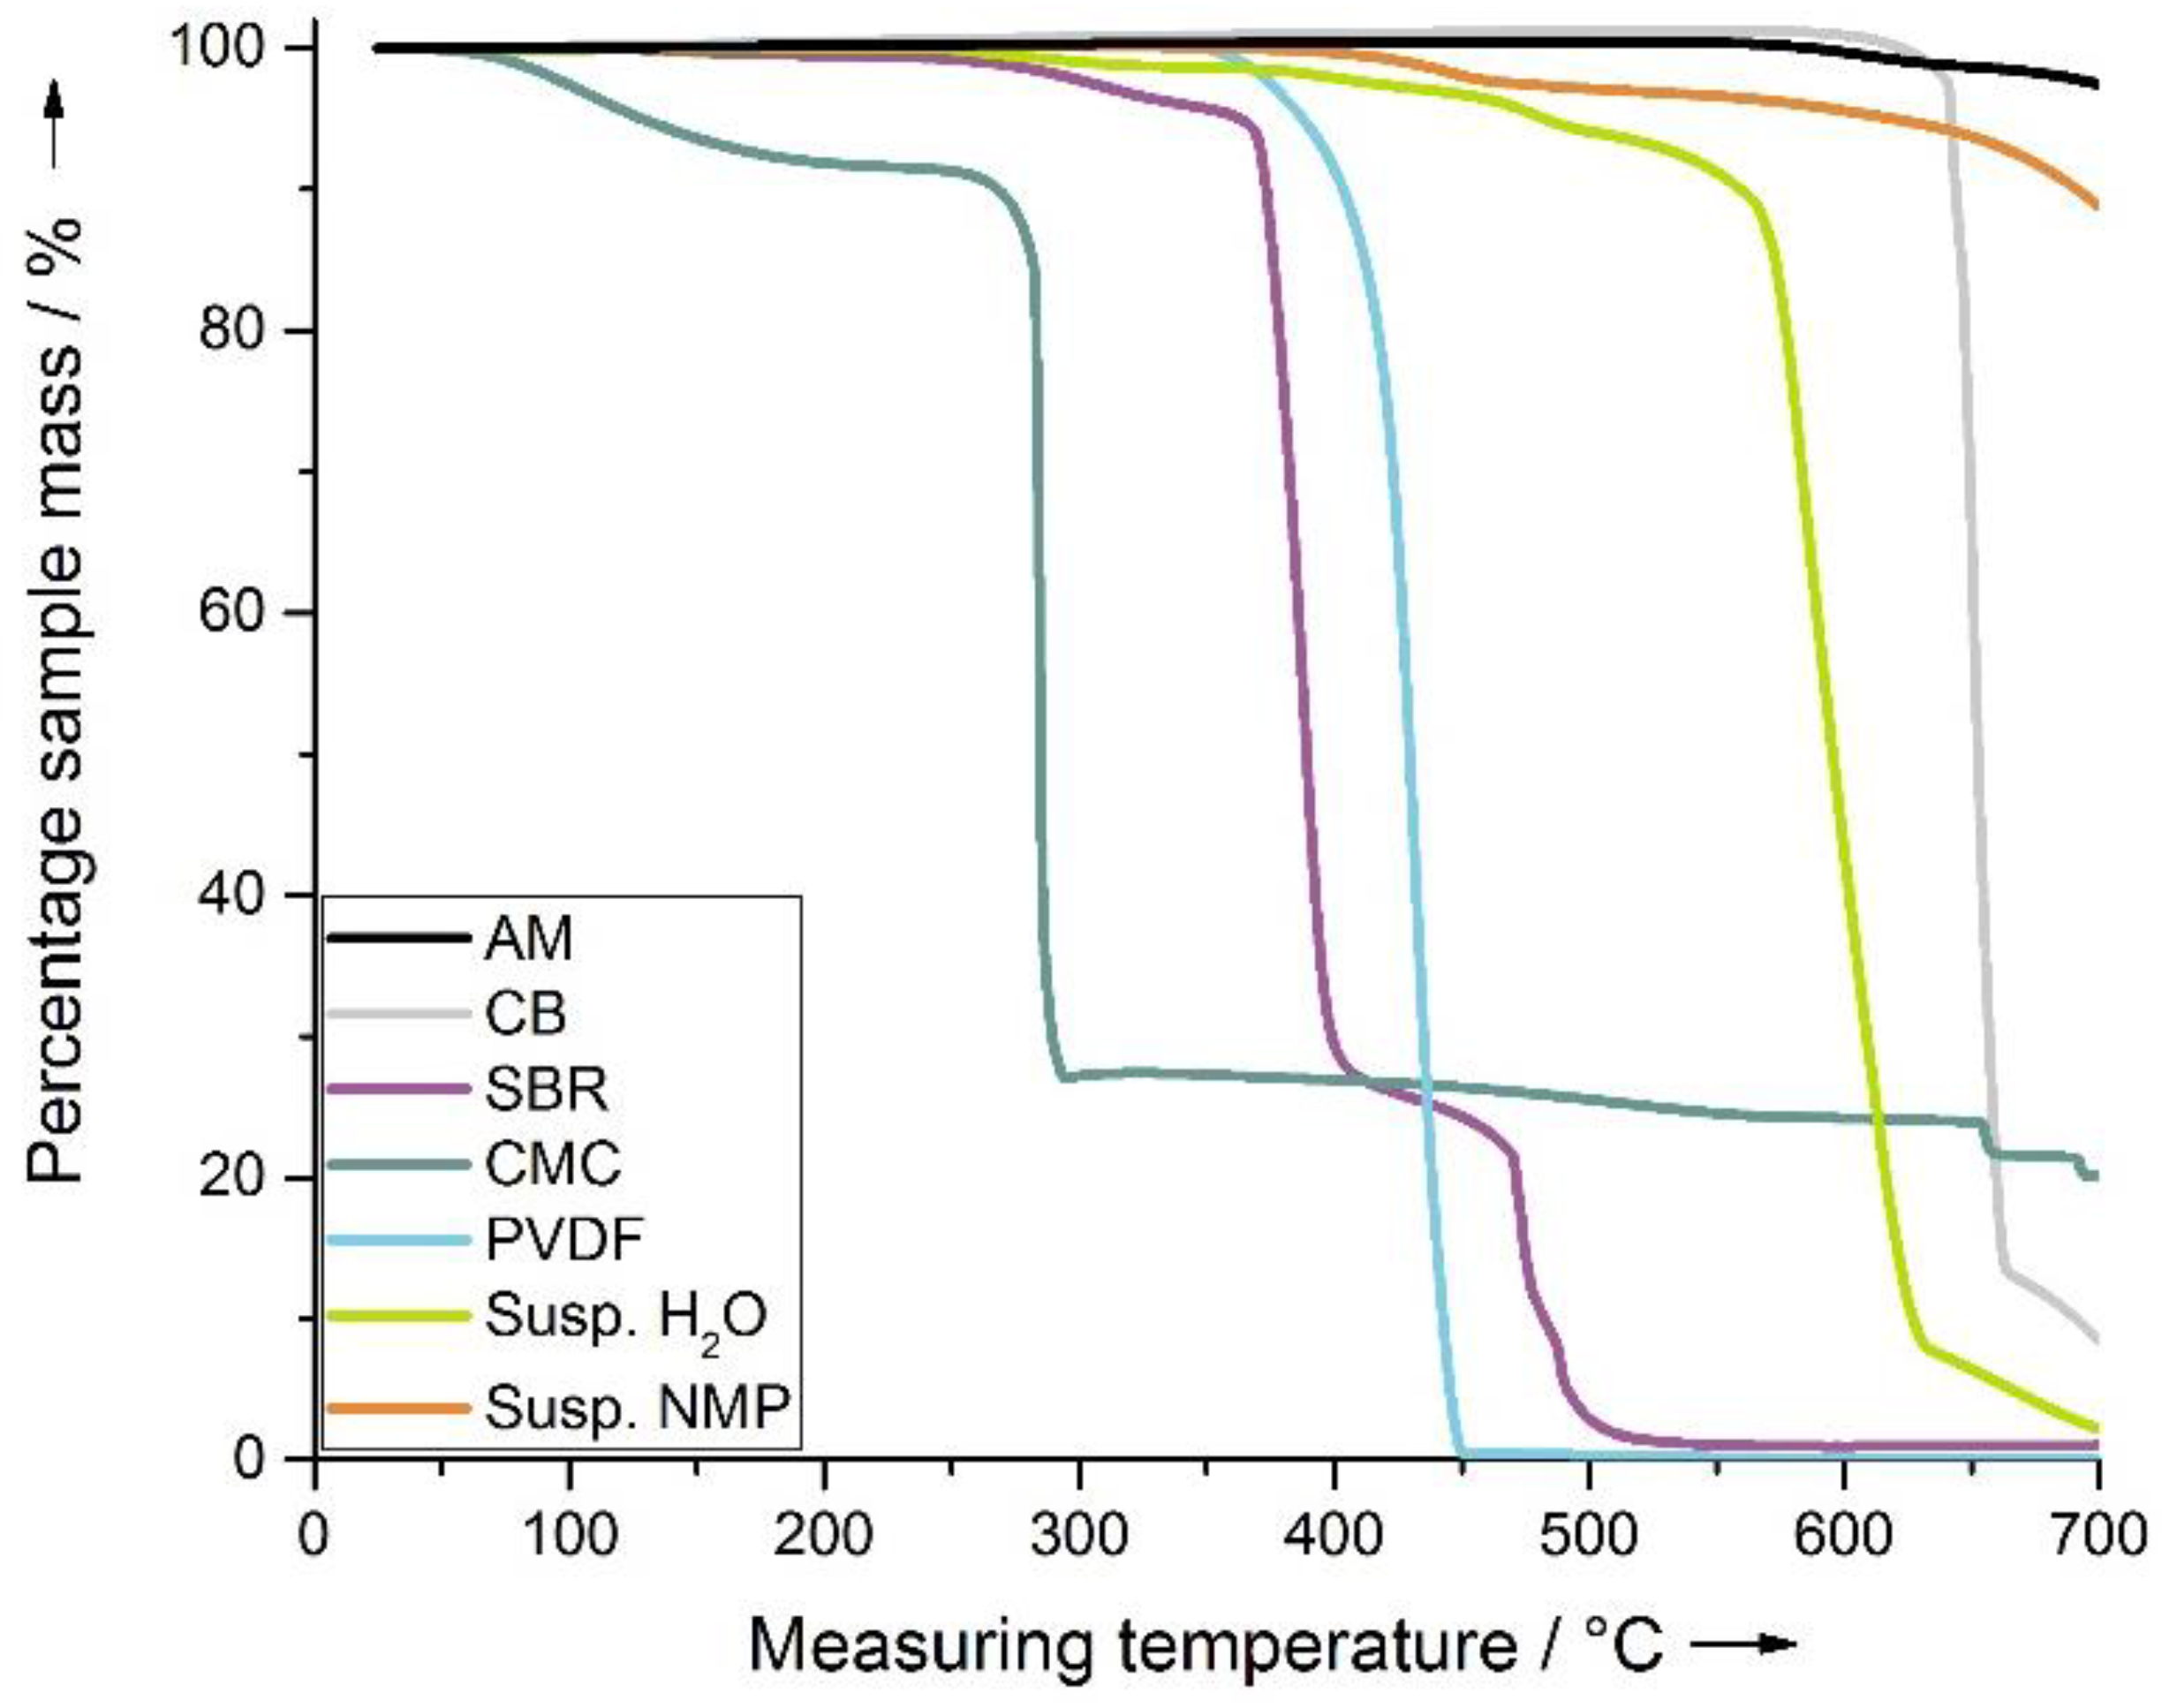
It can be assumed, that the binding of the binder molecules to the graphite and carbon black surface partly takes place before drying, i.e., during dispersion, degassing, and coating. The portion of binder that is already bound before drying is not mobile in the layer and does not migrate during the drying process. To determine what proportion of binder is available in the layer, water-based and NMP-based suspensions were centrifuged and the sediment was measured via thermogravimetric analysis, see
Figure 2. The changes in the sample weights of the suspensions were compared to the curves of the pure components so that a quantitative state on the proportion of mobile binder could be archived.
The carbon-based materials active material (AM) and carbon black (CB) are gravimetrically stable until a measuring temperature of 580 °C or 590 °C. While CB decomposes at a measuring temperature of 640 °C, the decomposition of AM was not achieved even at the highest measuring temperature used. The sample weight of CMC reduces by 8.5% in the measuring temperature range from 50 °C to 230 °C which can be attributed to the release of water. This was verified by Karl Fischer titration. In the temperature range from 260 to 293 °C, the sample weight drops to 27% and remains in this weight range. SBR shows a 5% weight reduction up to a measuring temperature of 365 °C, followed by a two-stage reduction to 1.5% at 520 °C.
The binder PVDF used in the organic solvent decomposes almost completely at a measuring temperature of approximately 350 °C to 450 °C. When evaluating the results, the slight increase in the pure substances PVDF, CB, and AM is not taken into account for the calculation of the remaining binder content as the suspension samples did not show any increase in sample weight. Hence, only significant weight changes are used in the following.
For the NMP-based slurries, the sample weight after the decomposition of PVDF has to be evaluated. At a measuring temperature of 450 °C, the percentage weight of the sample is 98%. With a binder fraction of 5% relative to the dry powder mixture, 40% of the binder is contained in the centrifugation sediment after the centrifugation.
The determination of the amount of binder remaining in the sediment during the water-based slurry is much more challenging since the sedimentation mass decomposes at about 570 °C, even though the active material decomposes much later when measured individually. Thus, a catalytic reaction due to the binder used has to be assumed and the mobile and fixed amount of binder for water-based slurries cannot be sufficiently detected. For the following modeling simulation, a mobile binder content of ~50% is estimated and, furthermore, a study of the mobile binder content is performed in
Section 4.5.
3.10. Termination Criteria
If there are only pores left that are smaller than 1 µm, it can be assumed that no more binder exchange can take place over the layer height as these pores are mainly carbon-black-induced. Via an analysis of the pore radius distribution, it is deduced that 24% of the pores are so small that no diffusion can take place over the layer height [
8]. For the calculations, this means that with a porosity of 24% at solvent-filled pores ε
full the calculation is aborted and the binder distribution is set as final.
4. Calculation of Binder Distribution in Battery Electrodes
The binder distribution is calculated as a proportion over increments so that the sum of all N increments equals one and so that the sum stays constant even with a change in layer thickness. For our calculation, we used 100 increments (N = 100) so that every calculation starts with a binder share of 0.01 in each increment. Even though the calculation of the binder distribution is performed using N, a representation of the layer thickness is preferred as this allows the change in the layer thickness to become apparent over the drying time. For all the two-dimensional diagrams, the binder distribution at the end of the drying process is shown, i.e., that which prevails in the dry electrode.
4.1. Calculation of the Binder Distribution Based on Experiments with Water-Based Anodes at Varied Drying Durations
The model experiments with water-based anodes are fully described in a previous publication [
8]. The alteration rate of the layer shrinking speed ψ and the change in solvent content w
1 is taken directly from the respective experiments for the calculations. The temperature T
Dry, that was set for the heat plate, was not used for the calculations; instead, the measured coating temperature TC was used. The mass loadings FB, layer thicknesses δb, and porosities ε are taken into account by using an average of the respective experiments. The results of the calculations are given as a proportion similar to a percentage with a summed up amount of one.
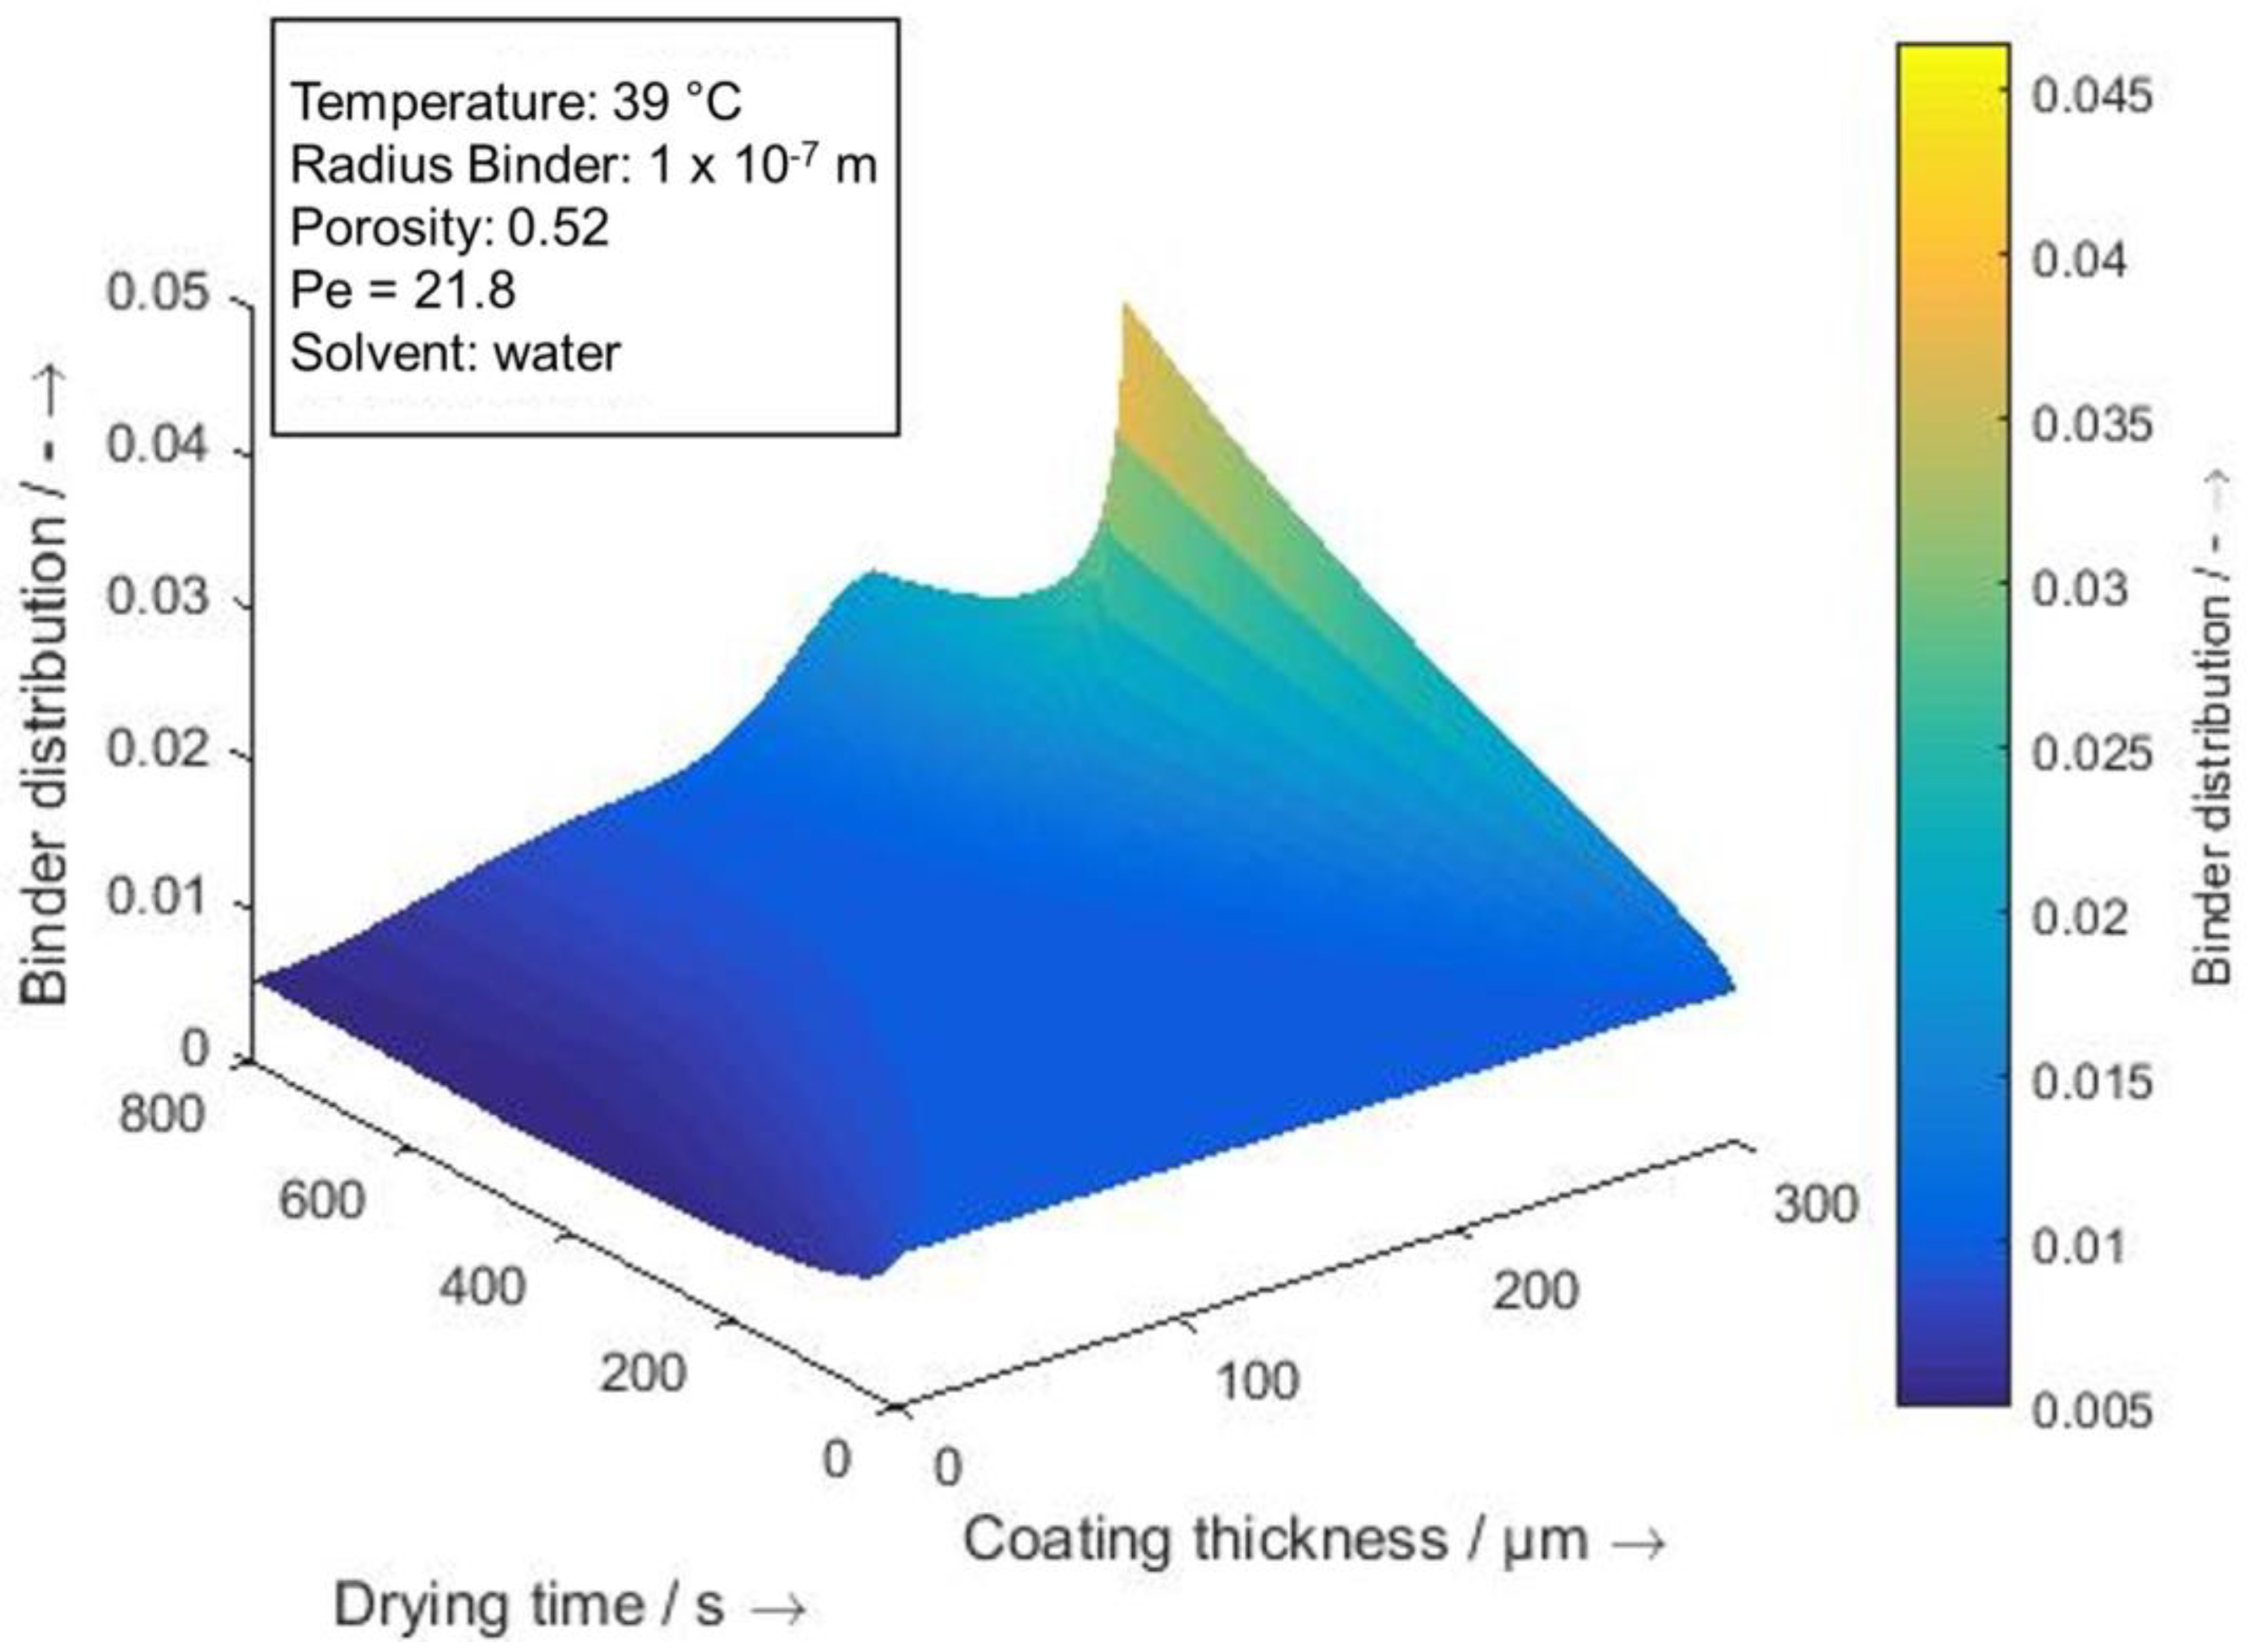
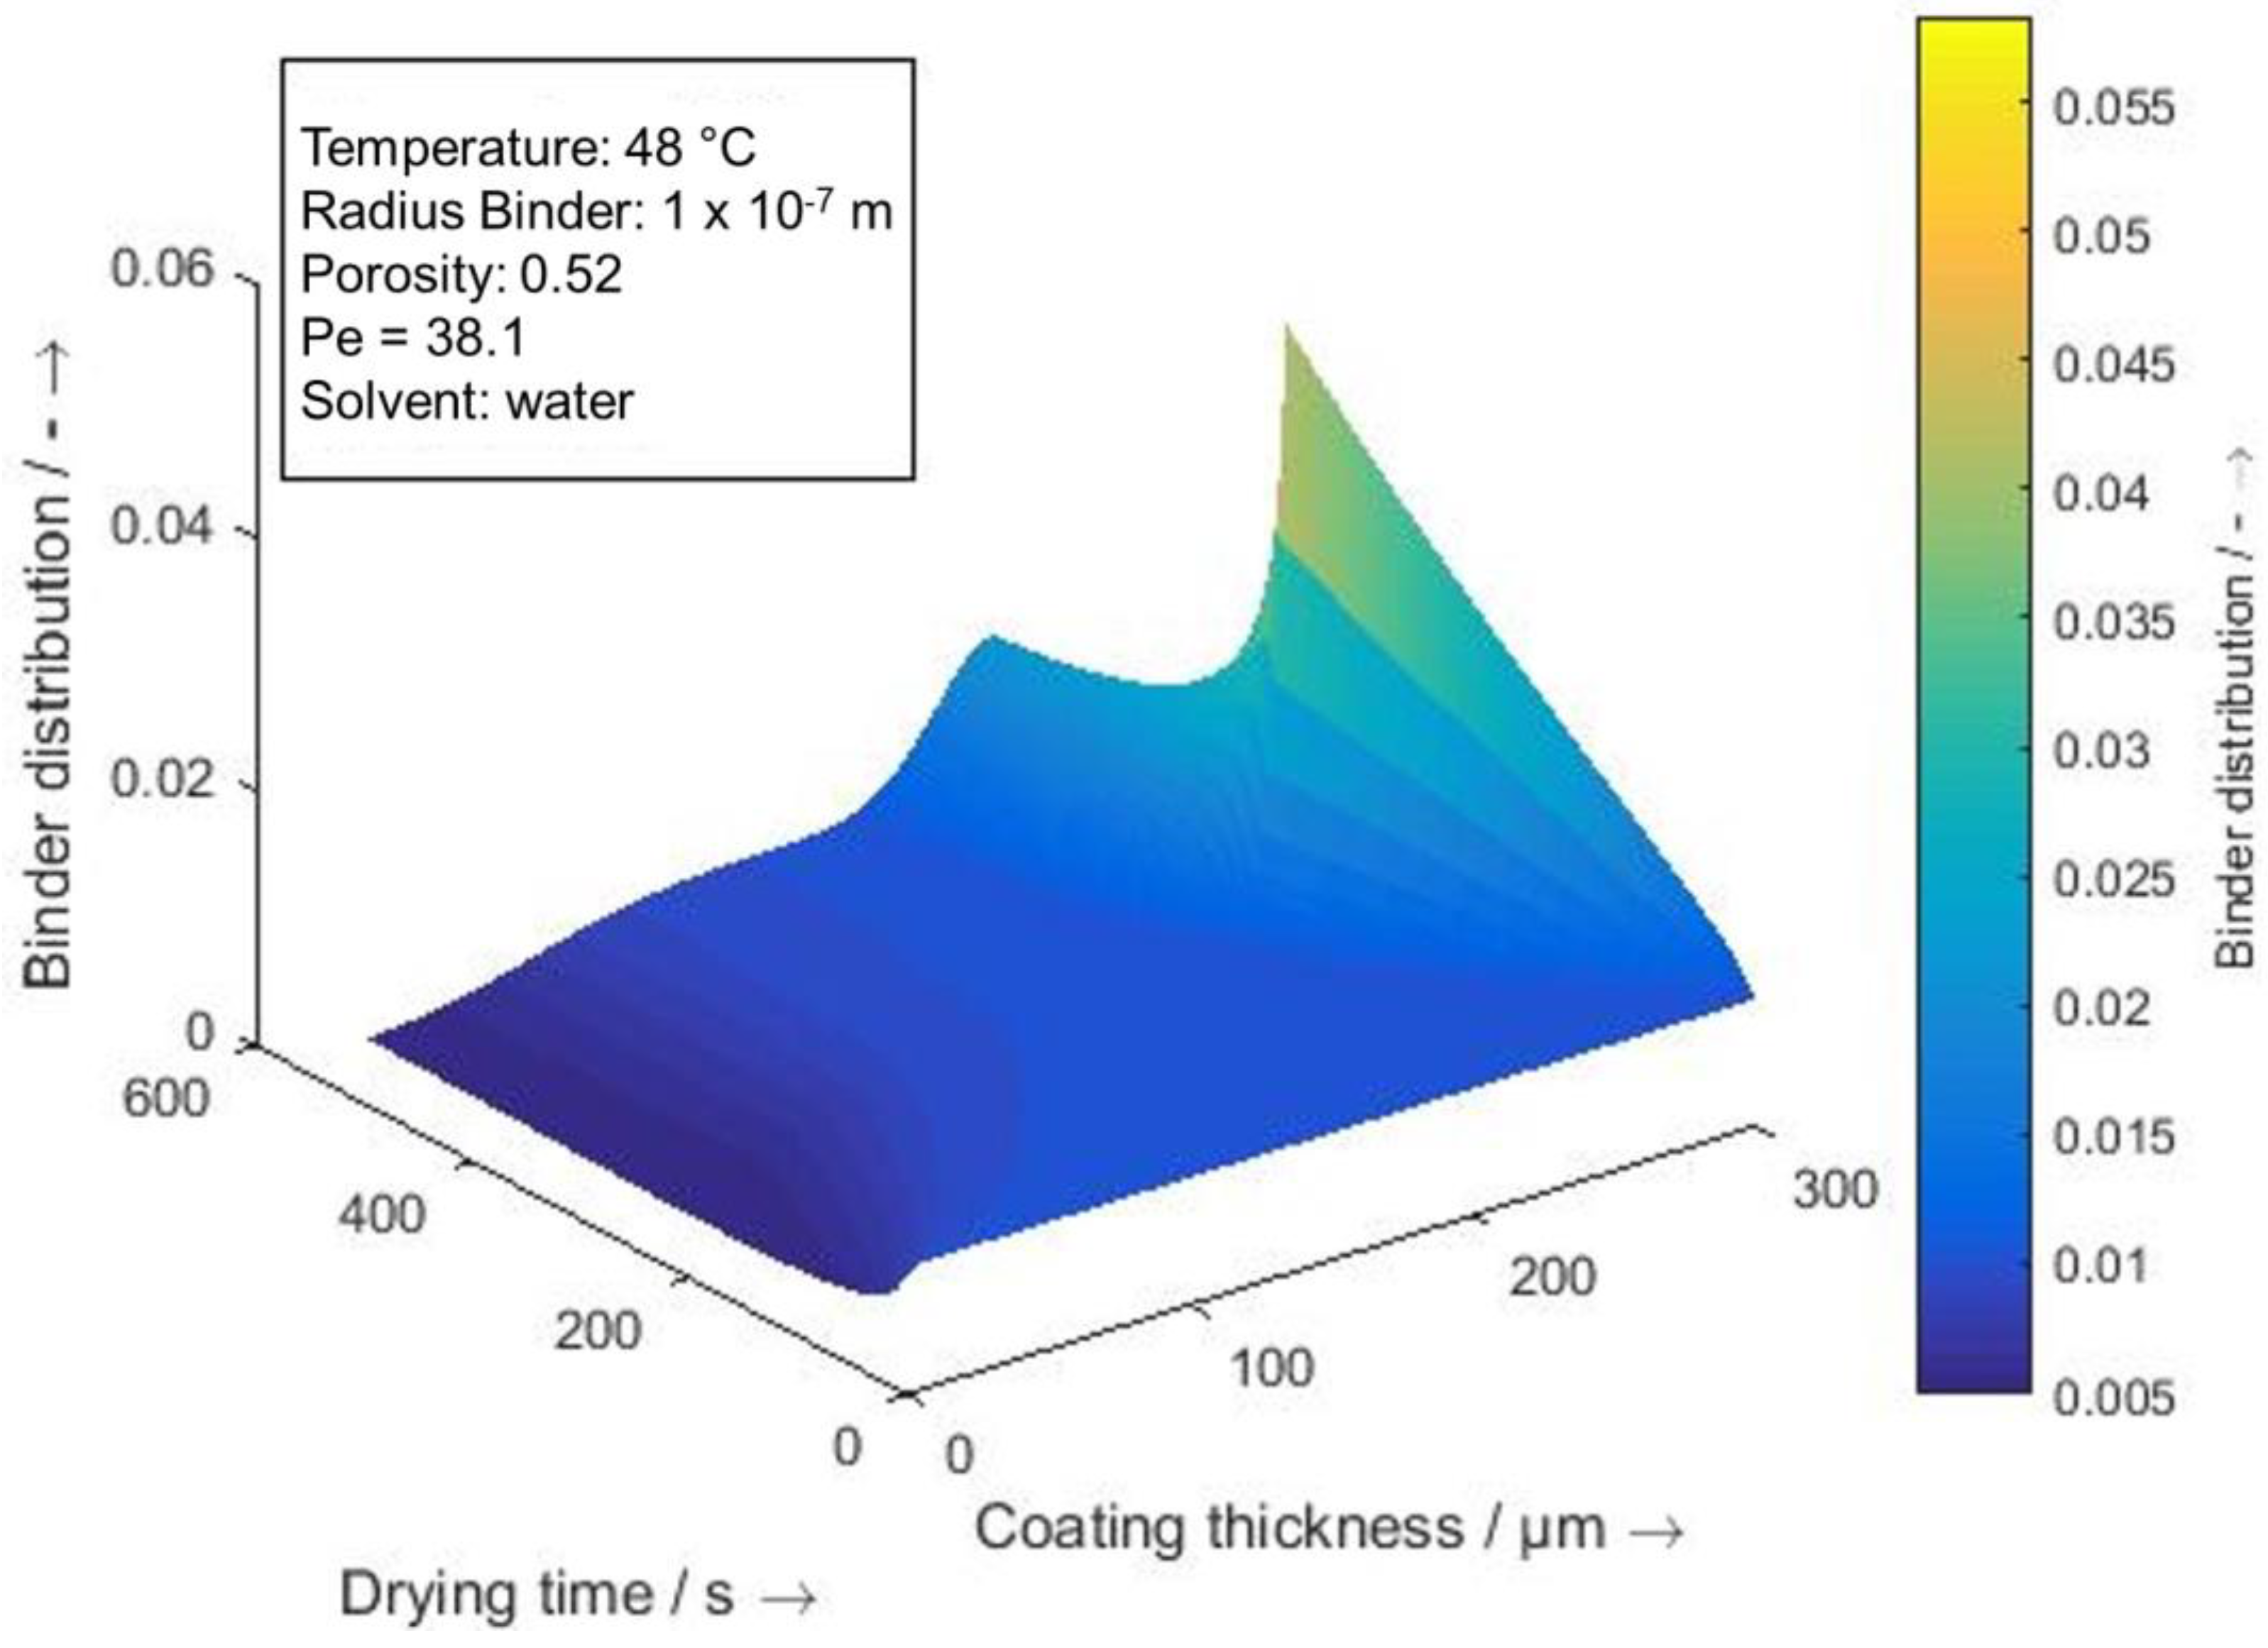
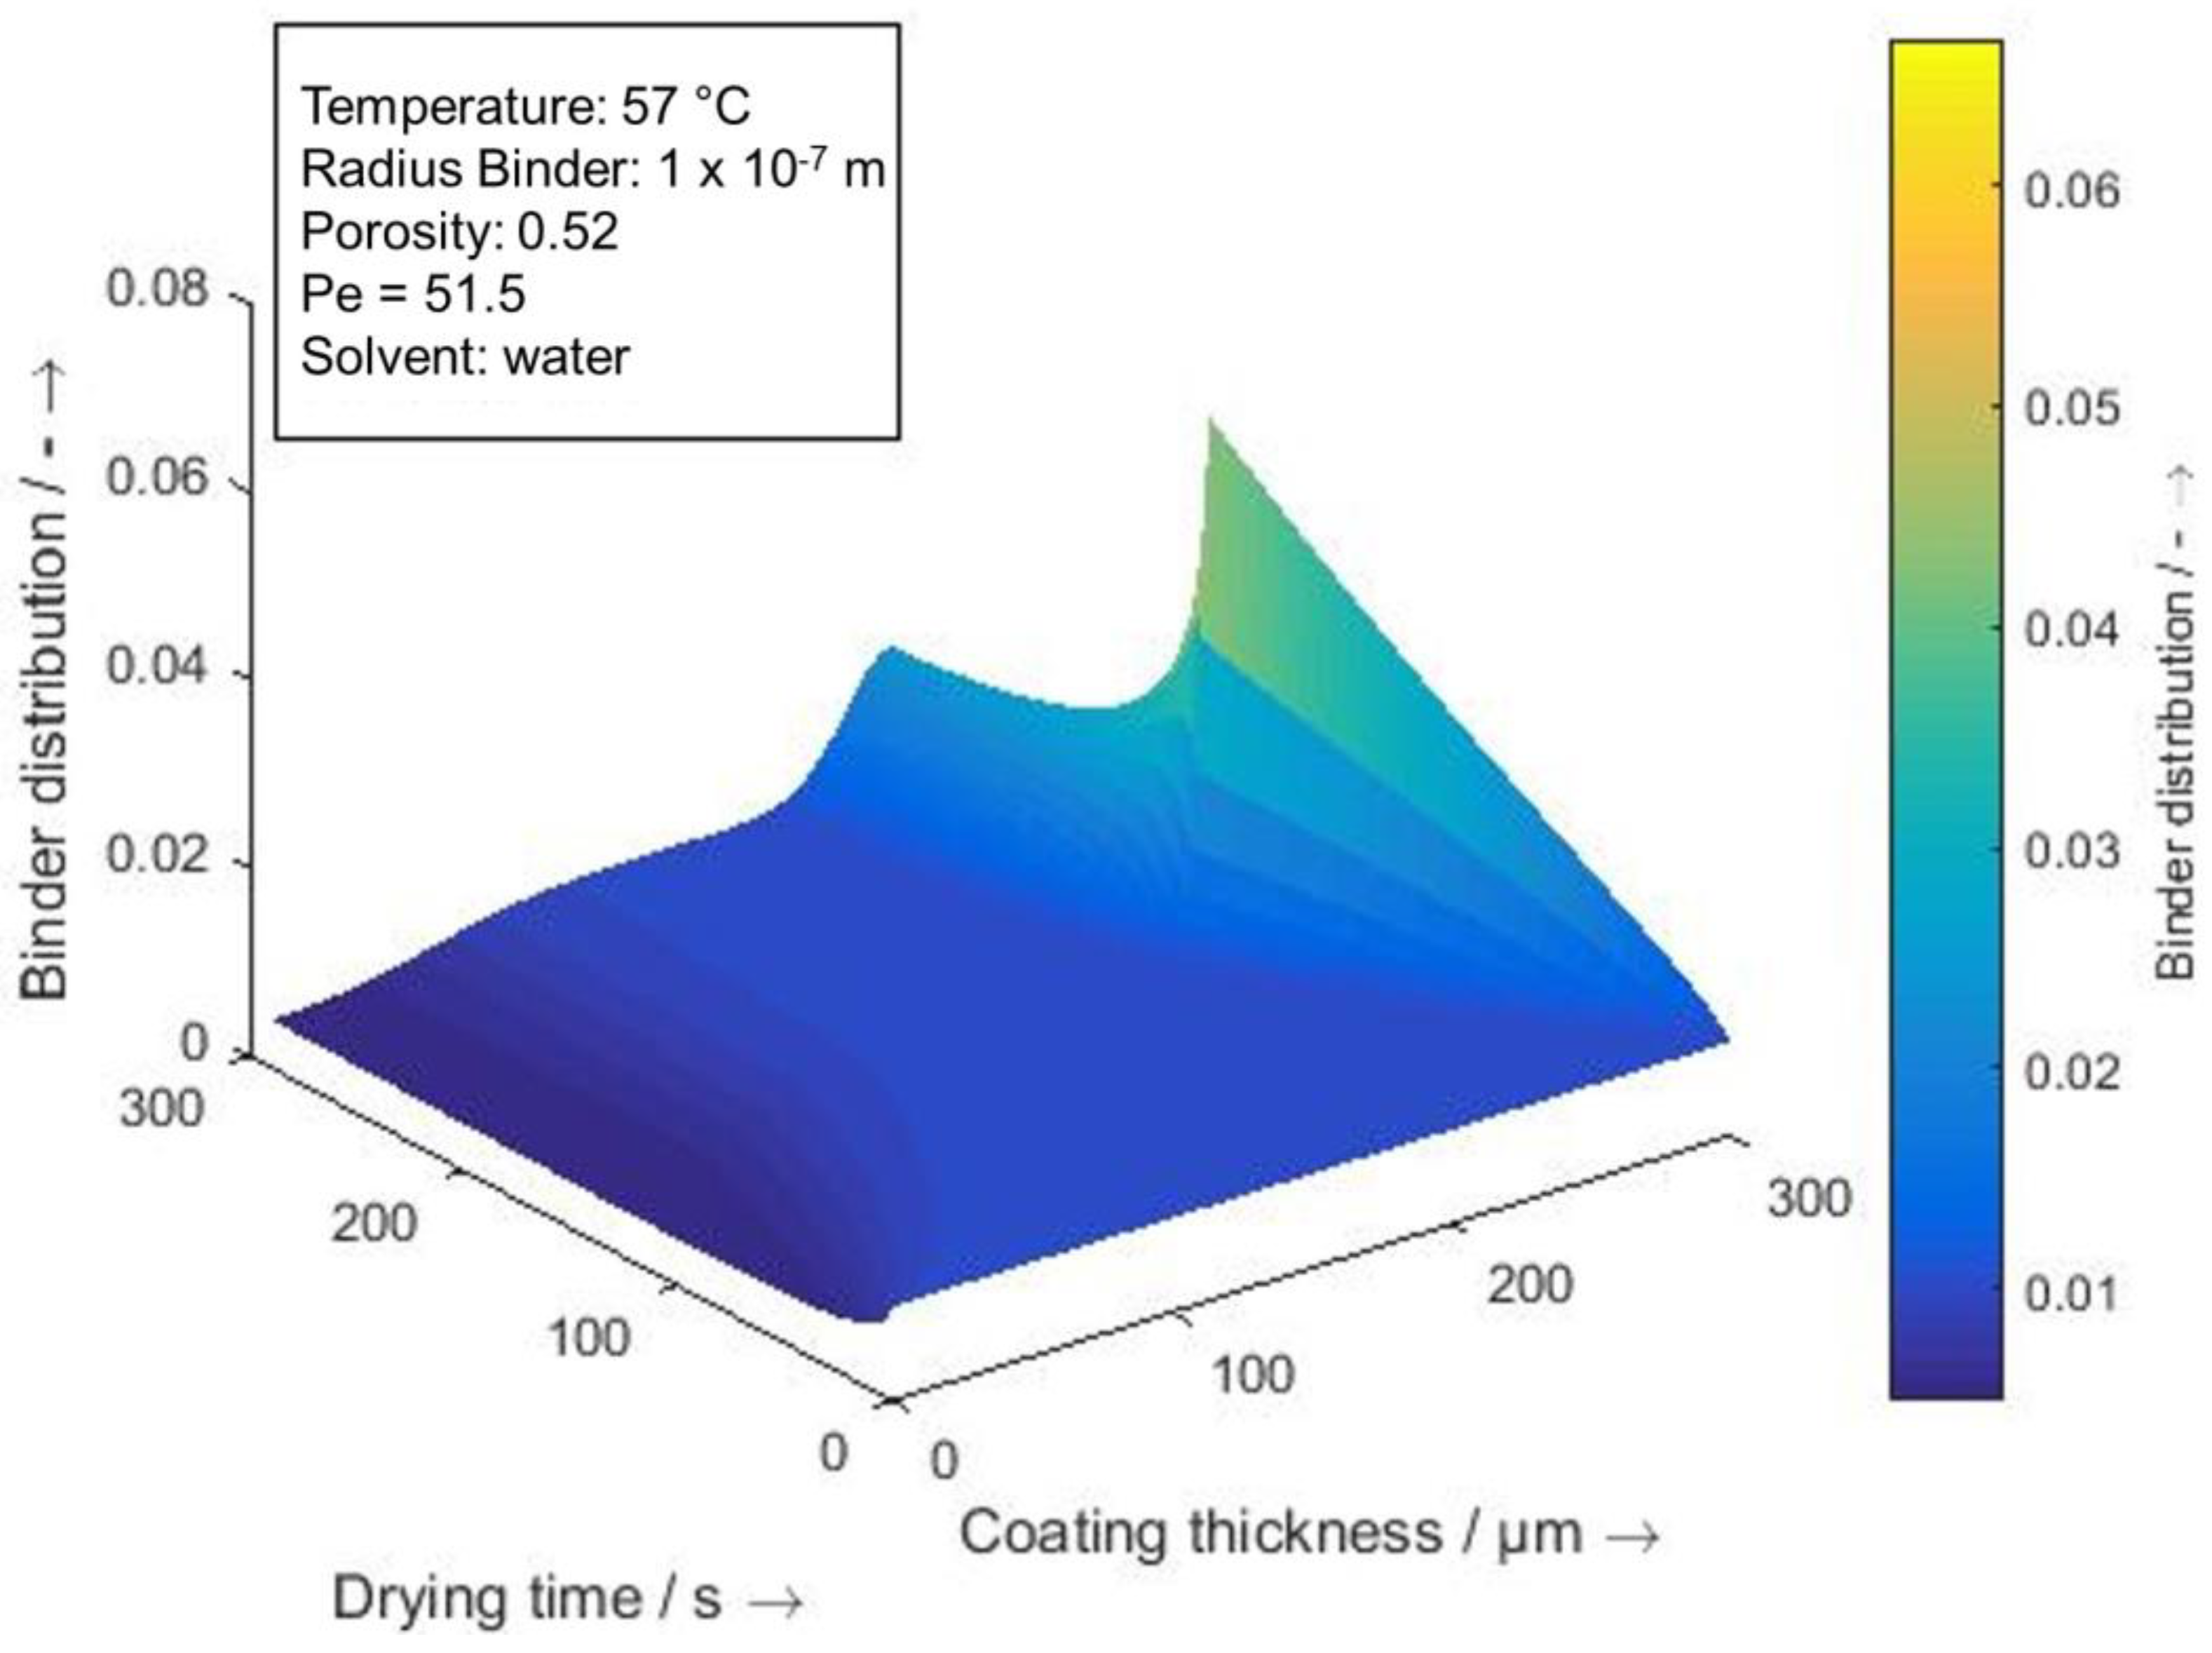
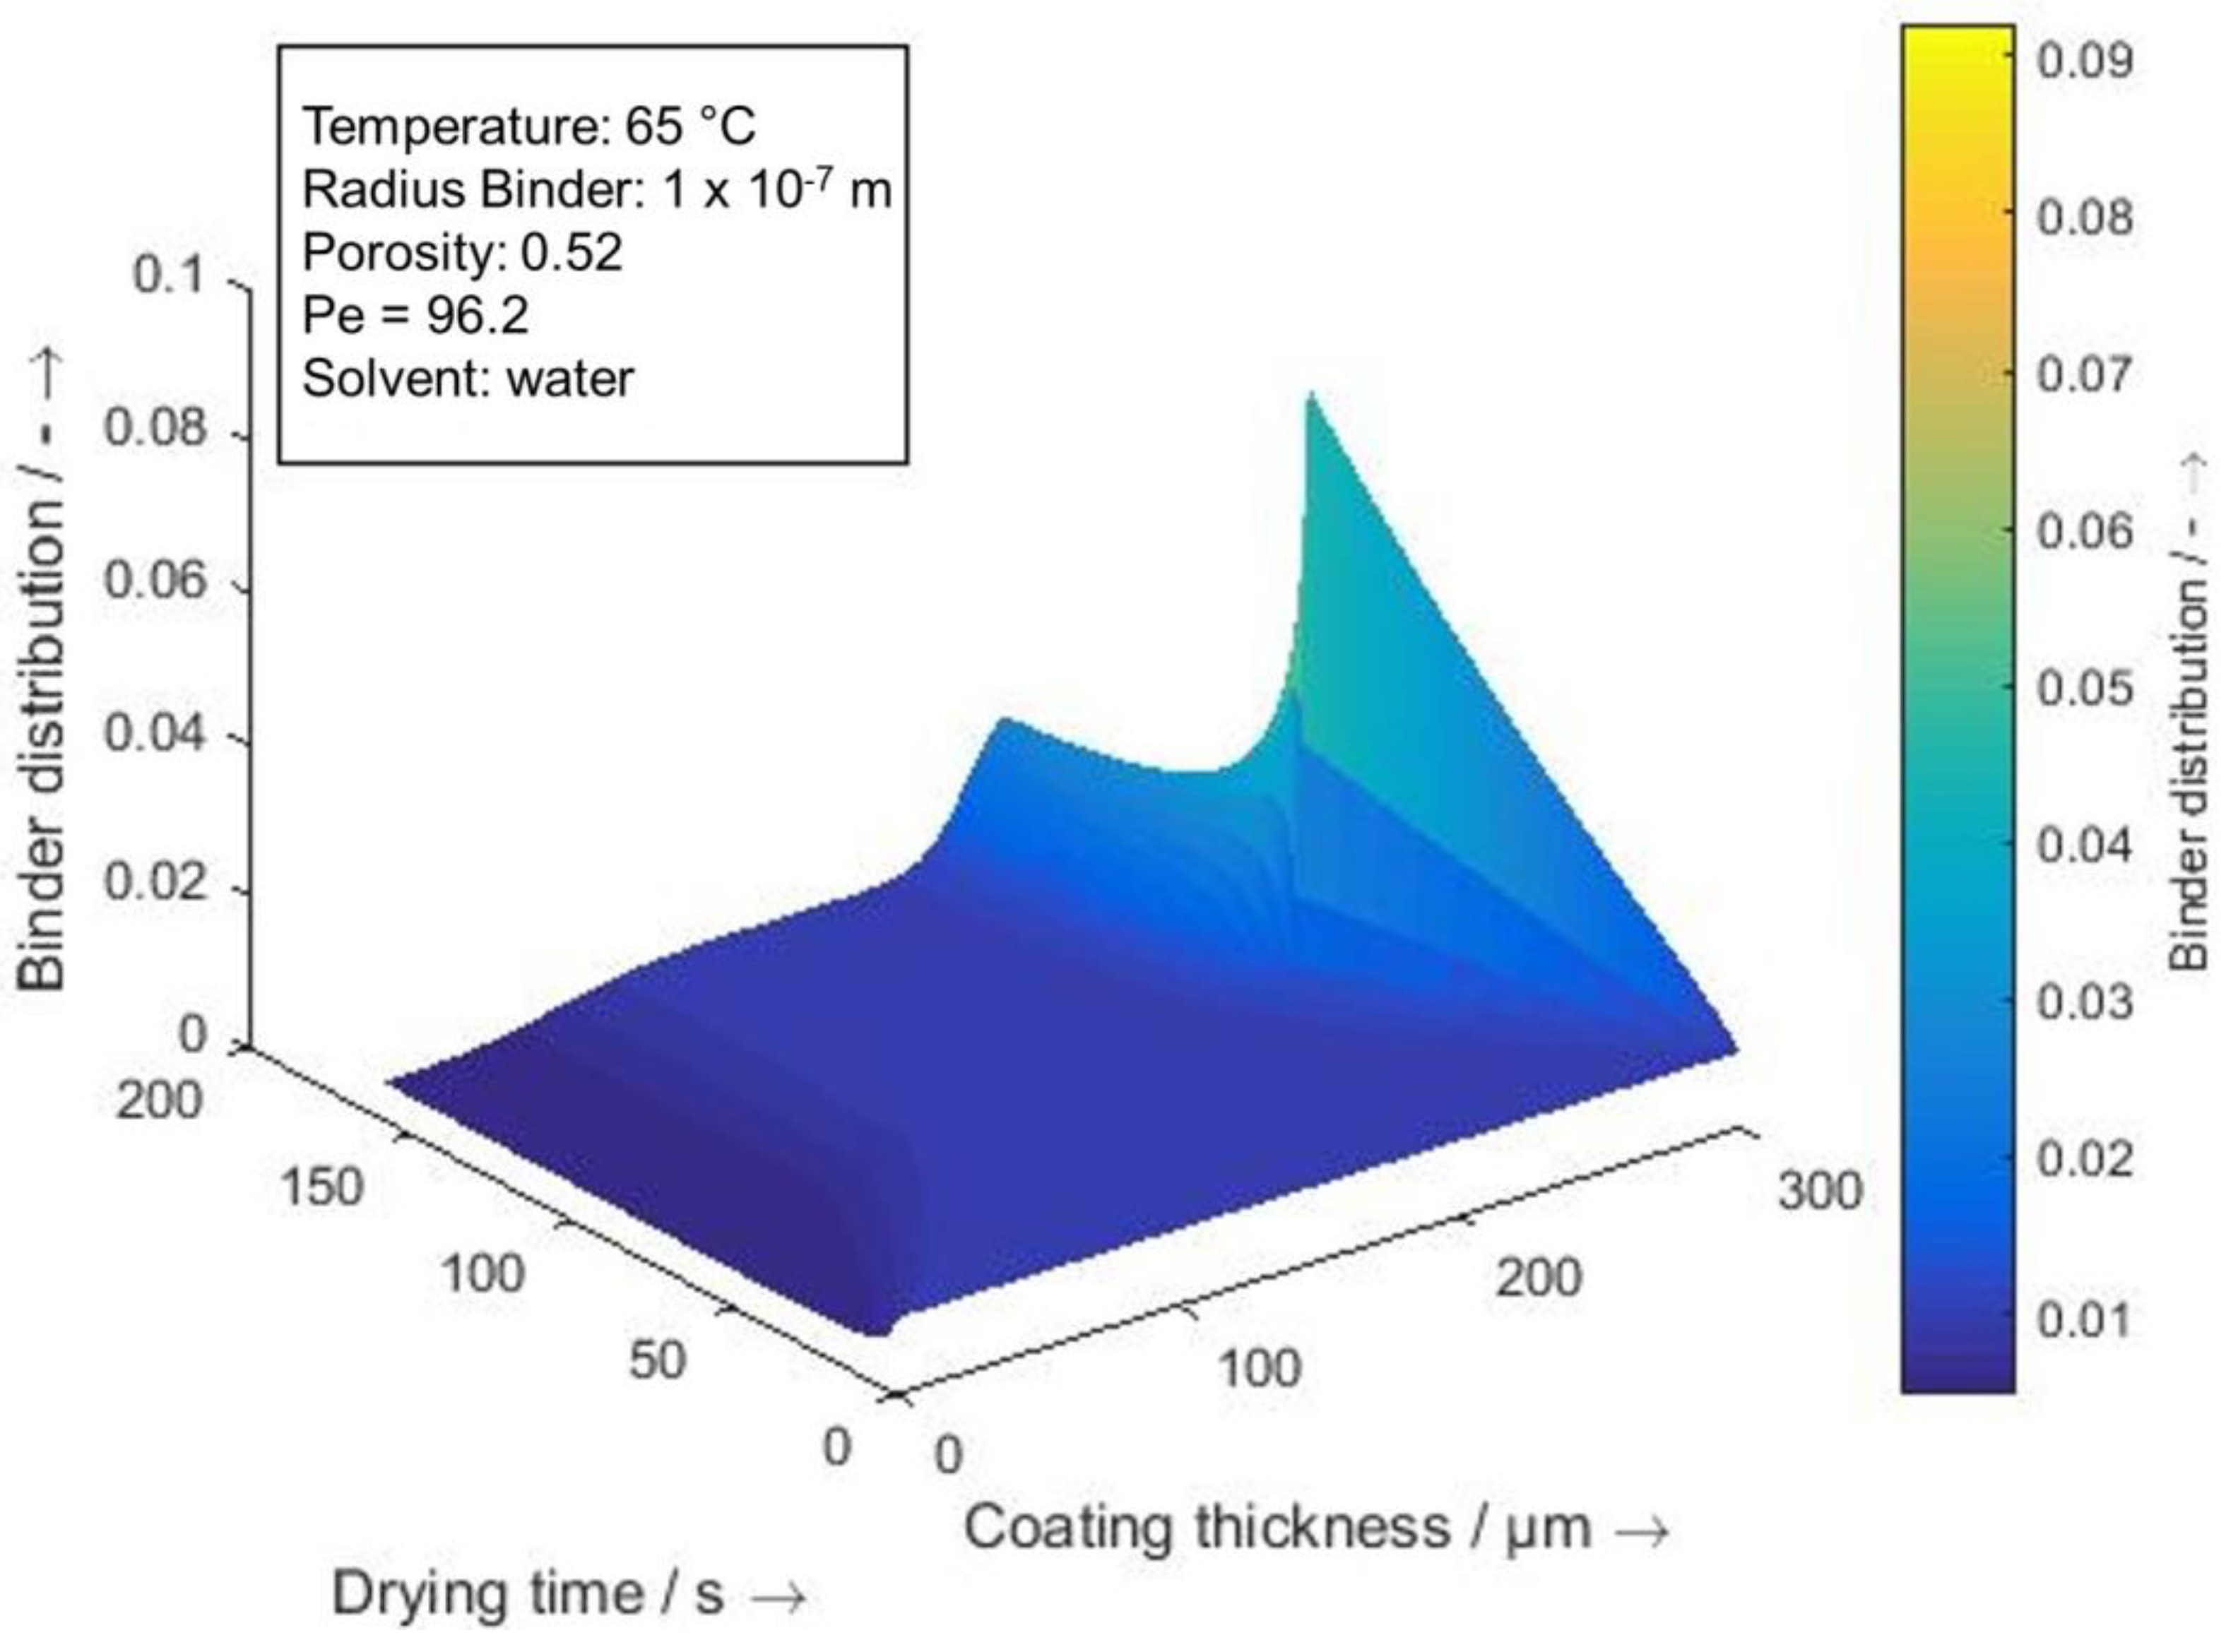
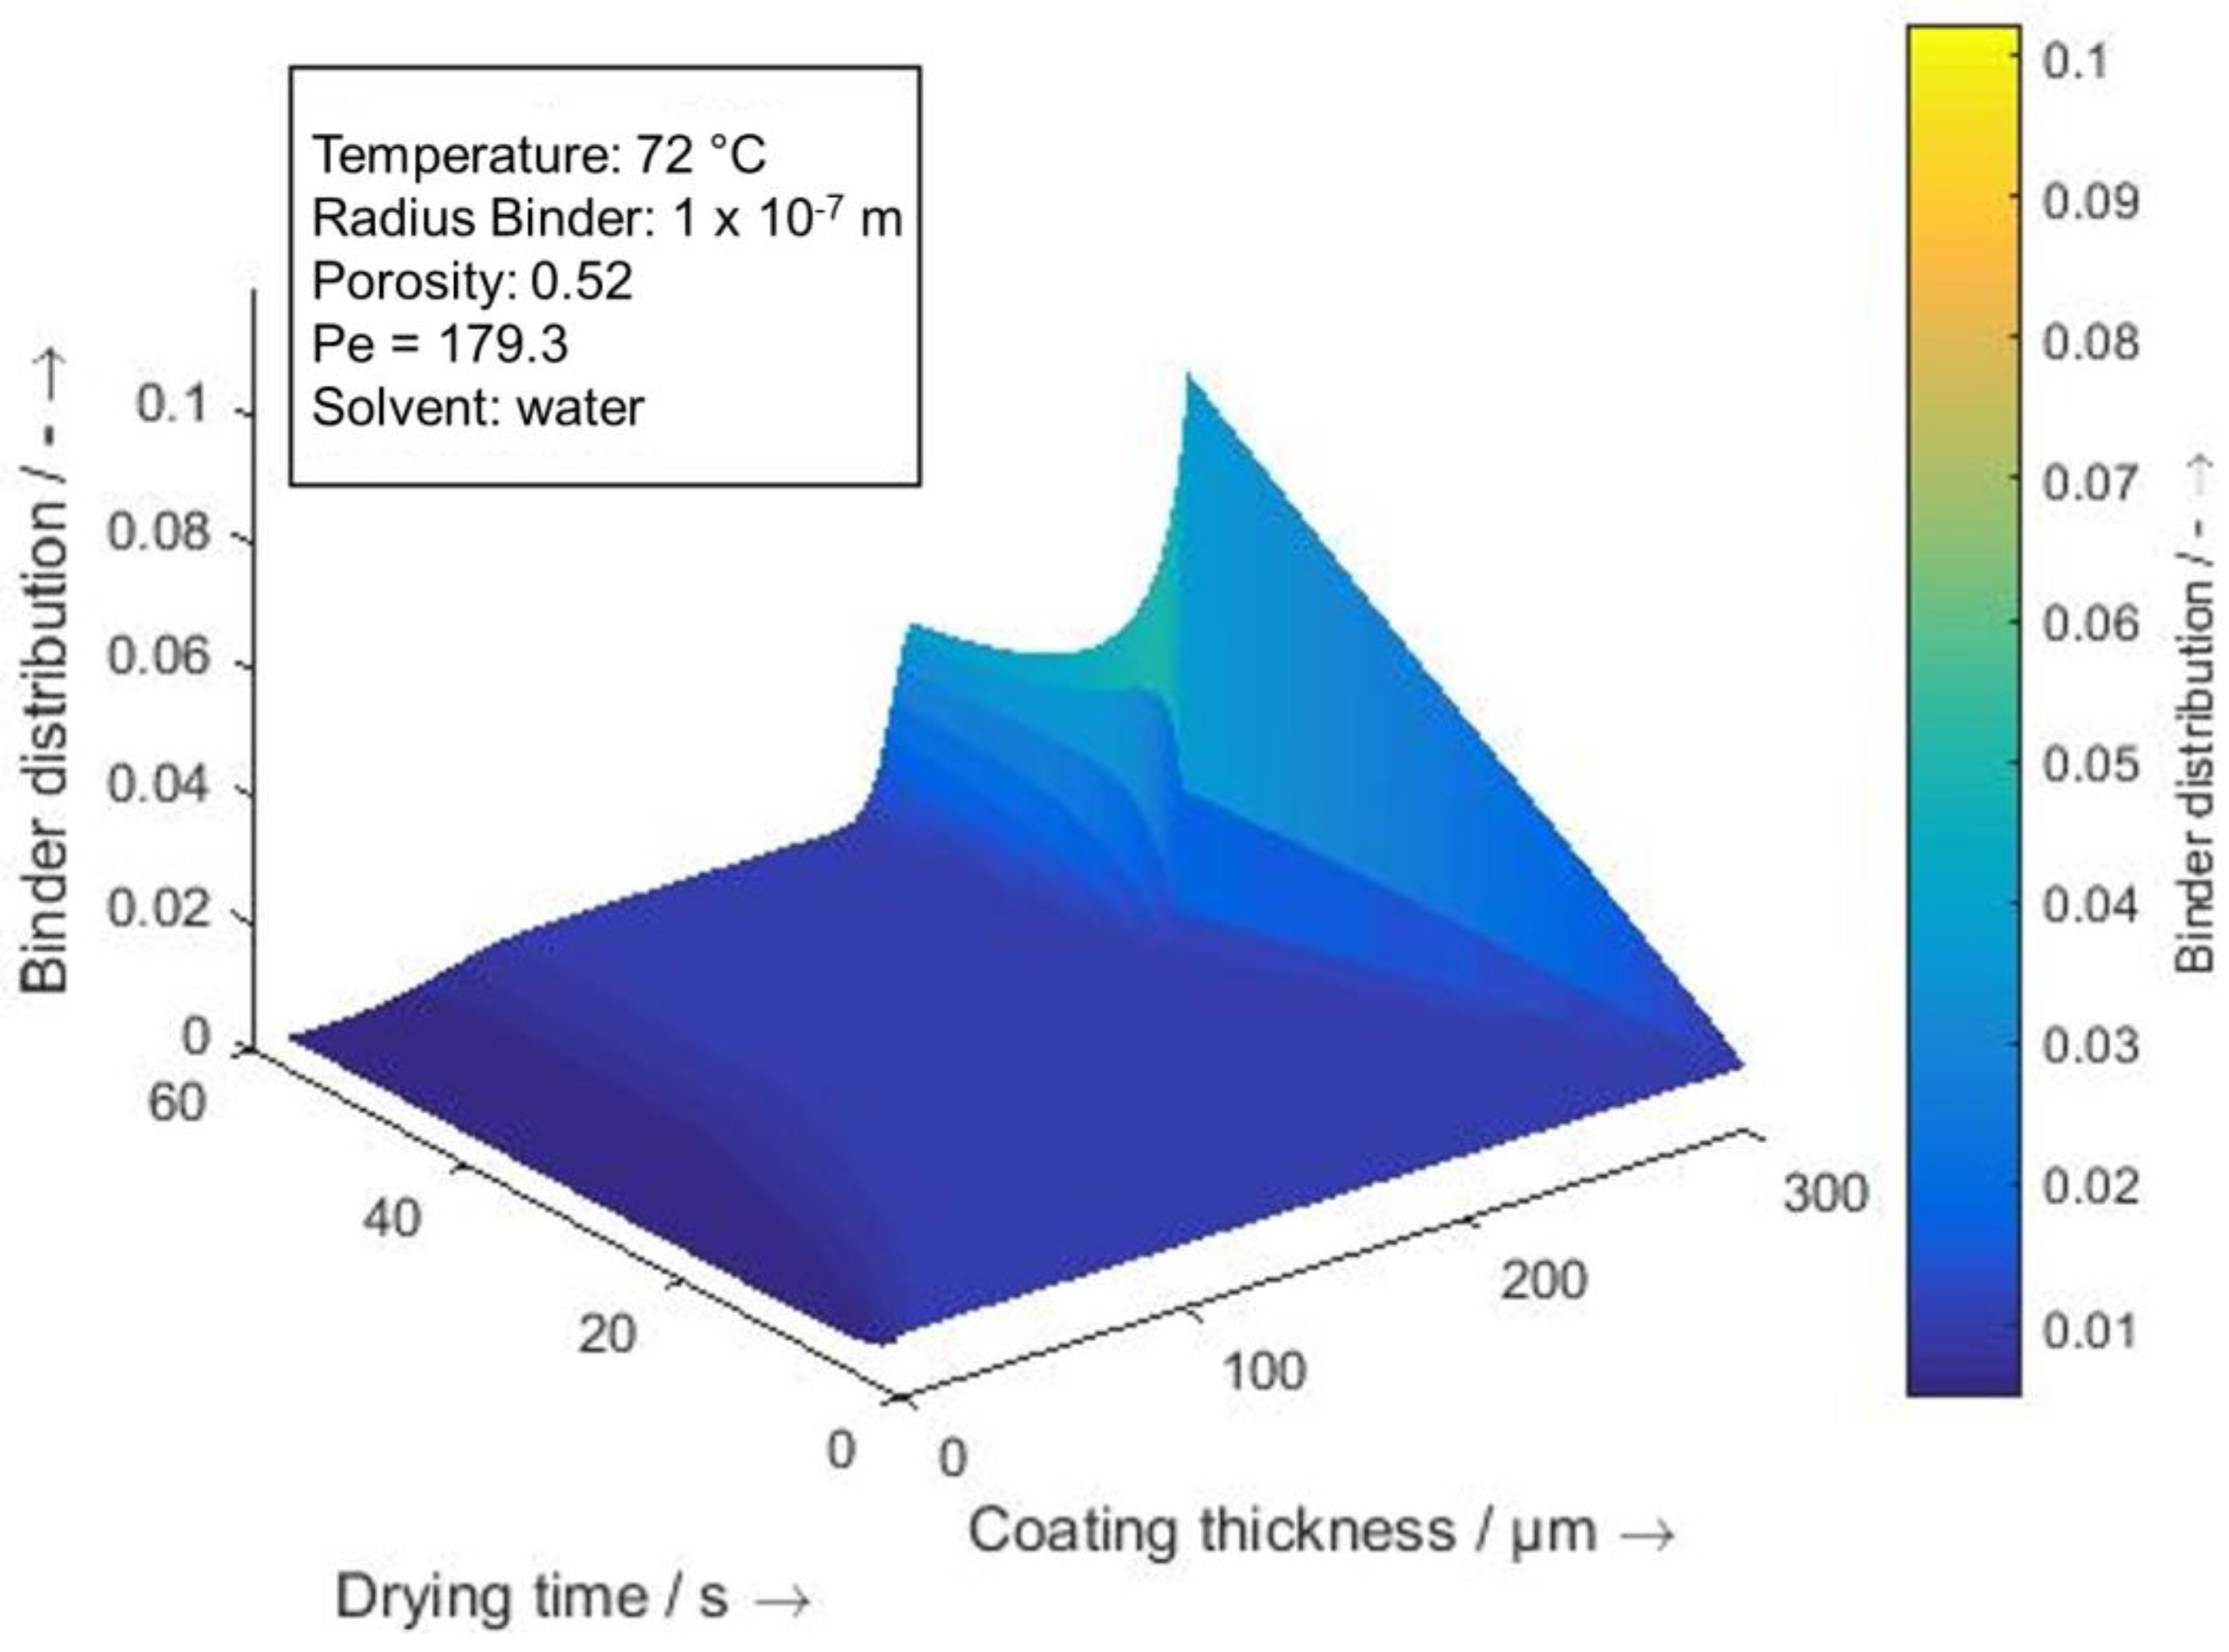
When considering the binder distribution over the layer thickness and the time (
Figure 3,
Figure 4,
Figure 5,
Figure 6 and
Figure 7), it should be emphasized that the layer thickness up to t
EoS, for all drying temperatures, drops from 300 µm to 220 µm. In this first drying stage, the convective term is dominant so that a binder migration can be observed at all temperatures, which has its peak when the layer thickness reaches its final height at t
EoS, with the subscript
EoS for the end of shrinkage. At t t
EoS, the layer thickness is fixed and the convective term becomes zero. Since pores are still at least partially filled with solvent, the diffusive term still can be effective. With increasing time, more pores dry out and more binder becomes immobile, which reflects in an increase in u
emptied pores.
The calculation of the Péclet number is carried out with the initial parameters of the simulation (δb and ψ) and the effective diffusion coefficient, which are influenced by the porosity and the tortuosity. When the layer thickness reduces, ε, τ, and the effective diffusion coefficient are reduced, which leads to a higher Péclet number.
With an increasing drying temperature TDry, the Péclet number rises, which indicates that with conductive drying, the convection-influencing size ψ grows more strongly than the diffusively influencing sizes can compensate.
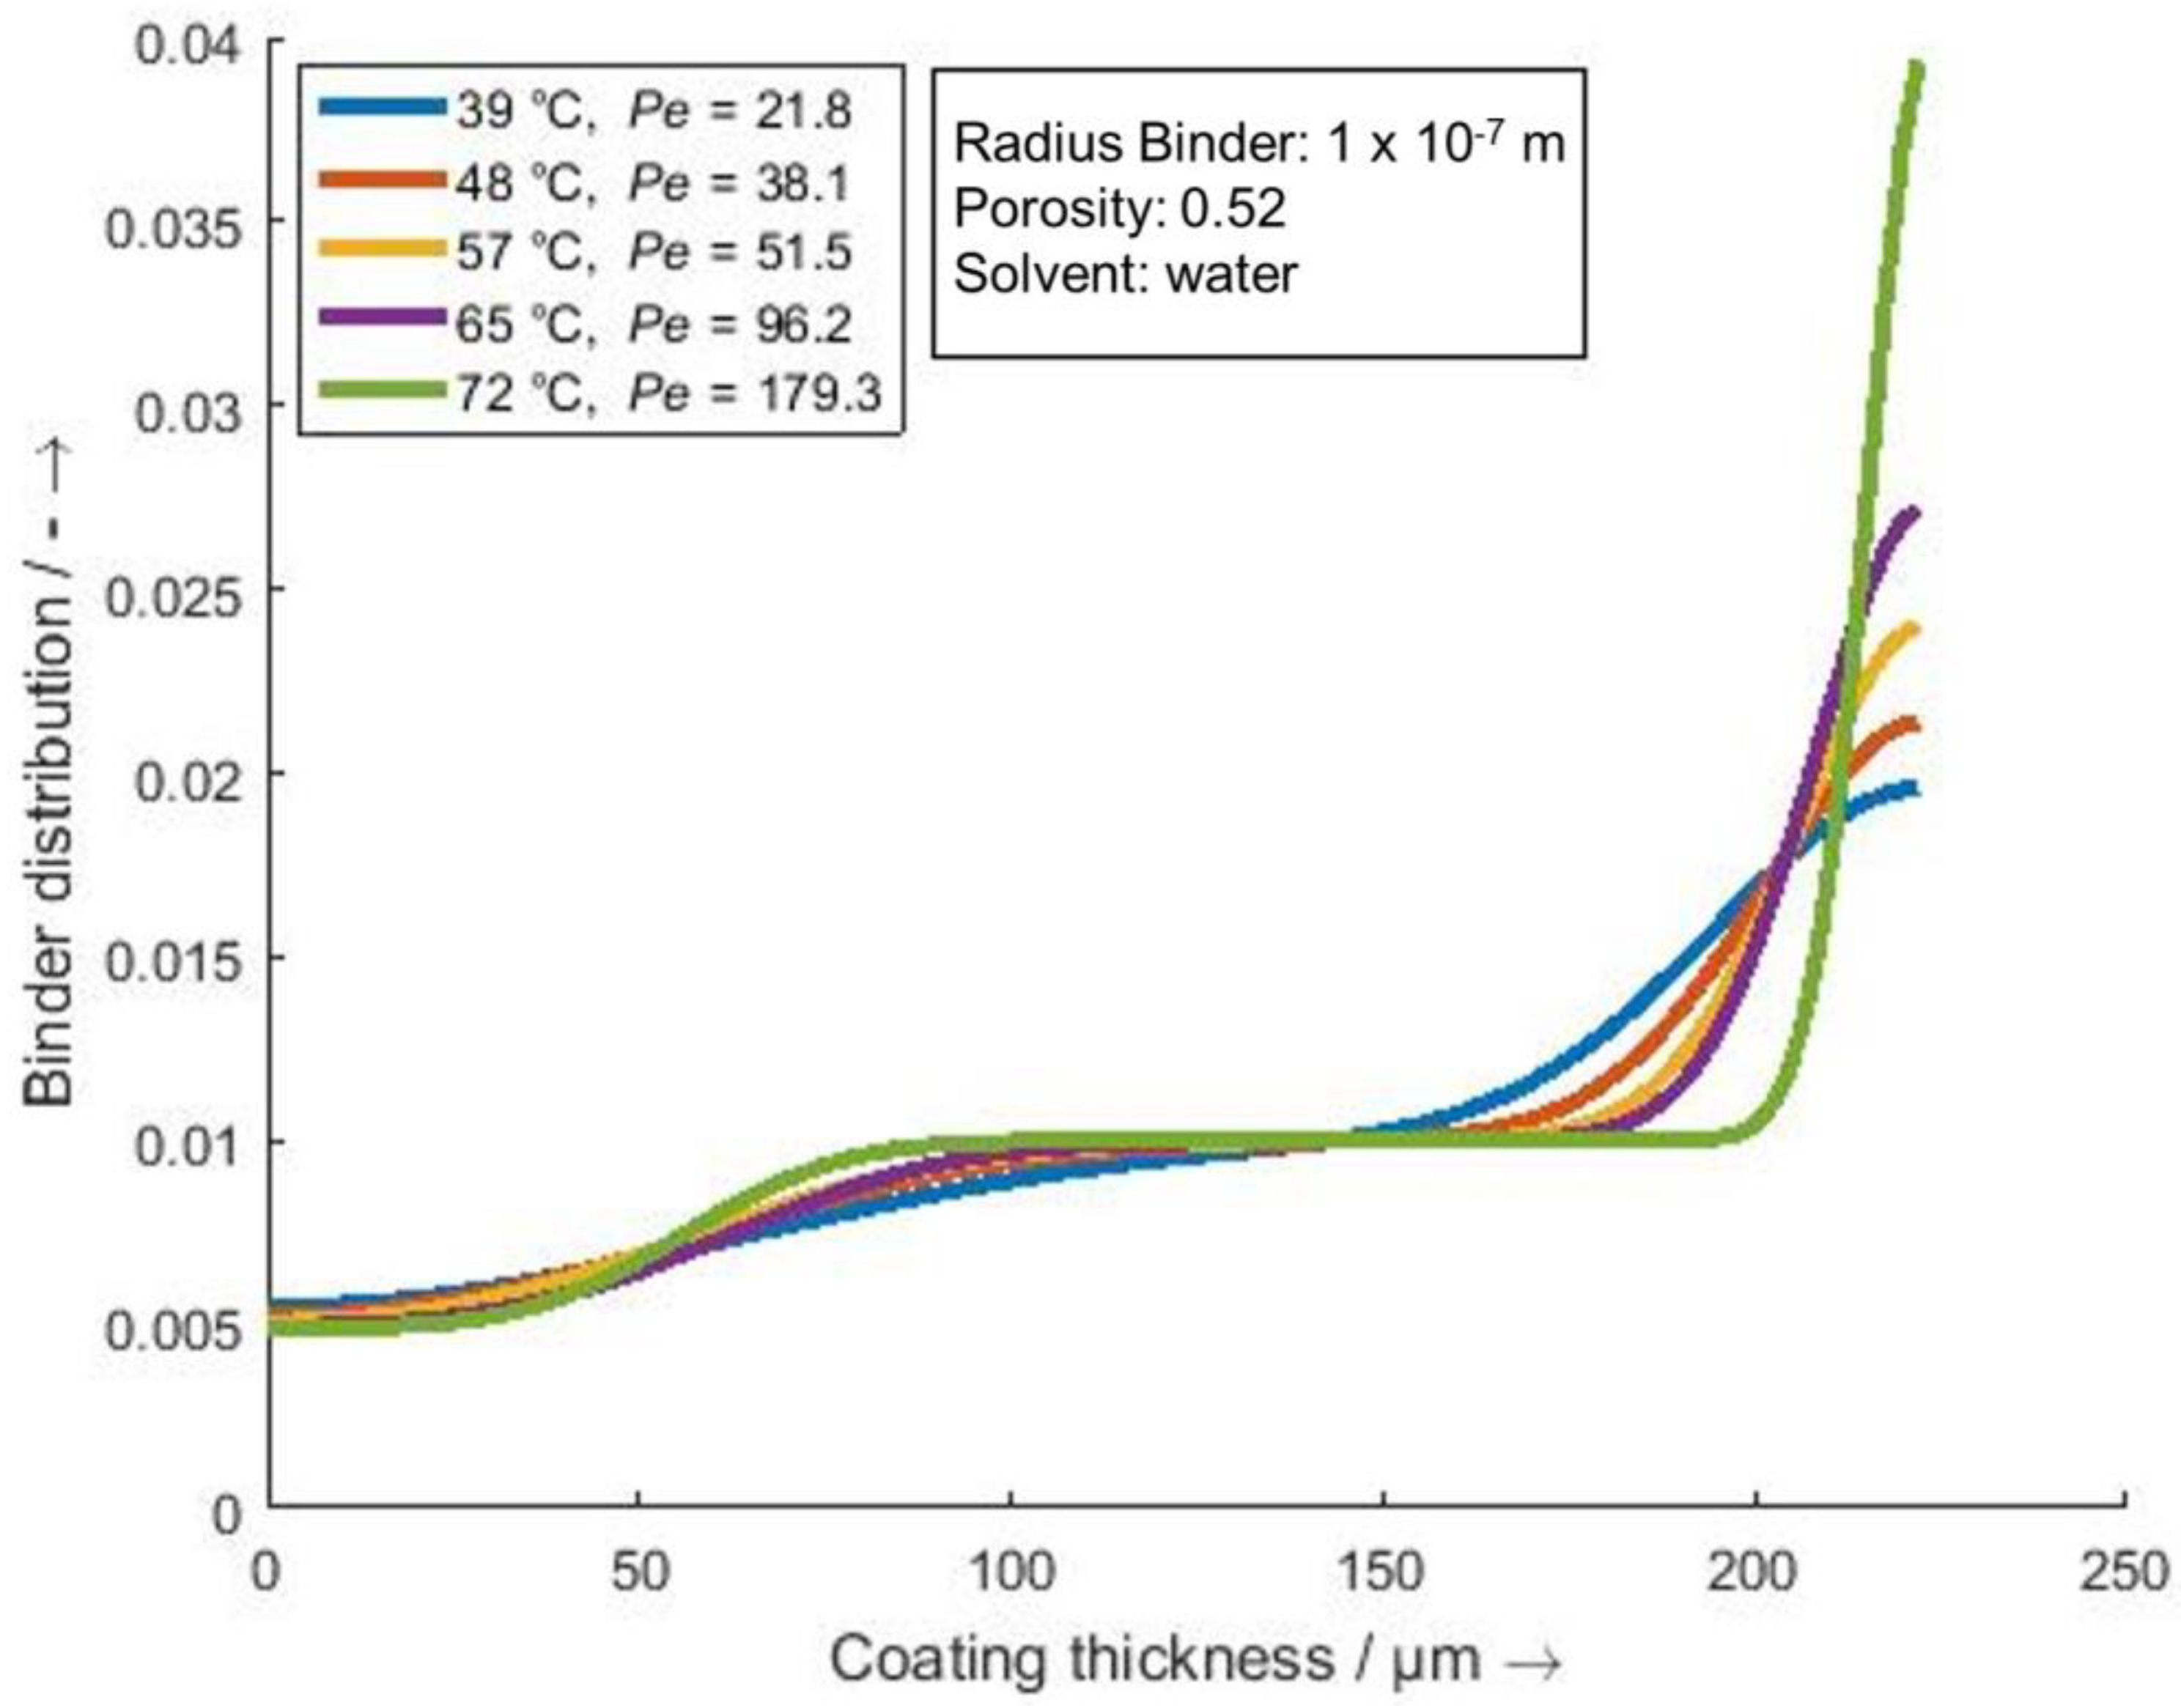
Figure 8 compares the binder demixing at the end of the drying process for the different drying temperatures. With higher temperatures as well as higher Péclet numbers, the segregation is stronger.
When comparing
Figure 3 with
Figure 6, all curves show the same trend considering standard deviations. Nevertheless, the calculated distribution at T
Dry = 40 °C is more homogeneous than expected based on the EDX measurements and the adhesion tests. Since a reduction in the layer thickness is measured directly and is not subject to any further assumptions, the cause for these deviations is assumed to be in the diffusion-influencing variables. On the one hand, it would be possible that the emptying takes place earlier than expected and therefore the homogenization after t
EoS can only take place to a lesser extent. On the other hand, the calculation of the effective diffusion coefficient, where several assumptions were made, could have led to a higher value than is realistic for lower drying temperatures. For example, because of the interaction with the binder, the viscosity could be higher than calculated.
4.2. Layer Thickness
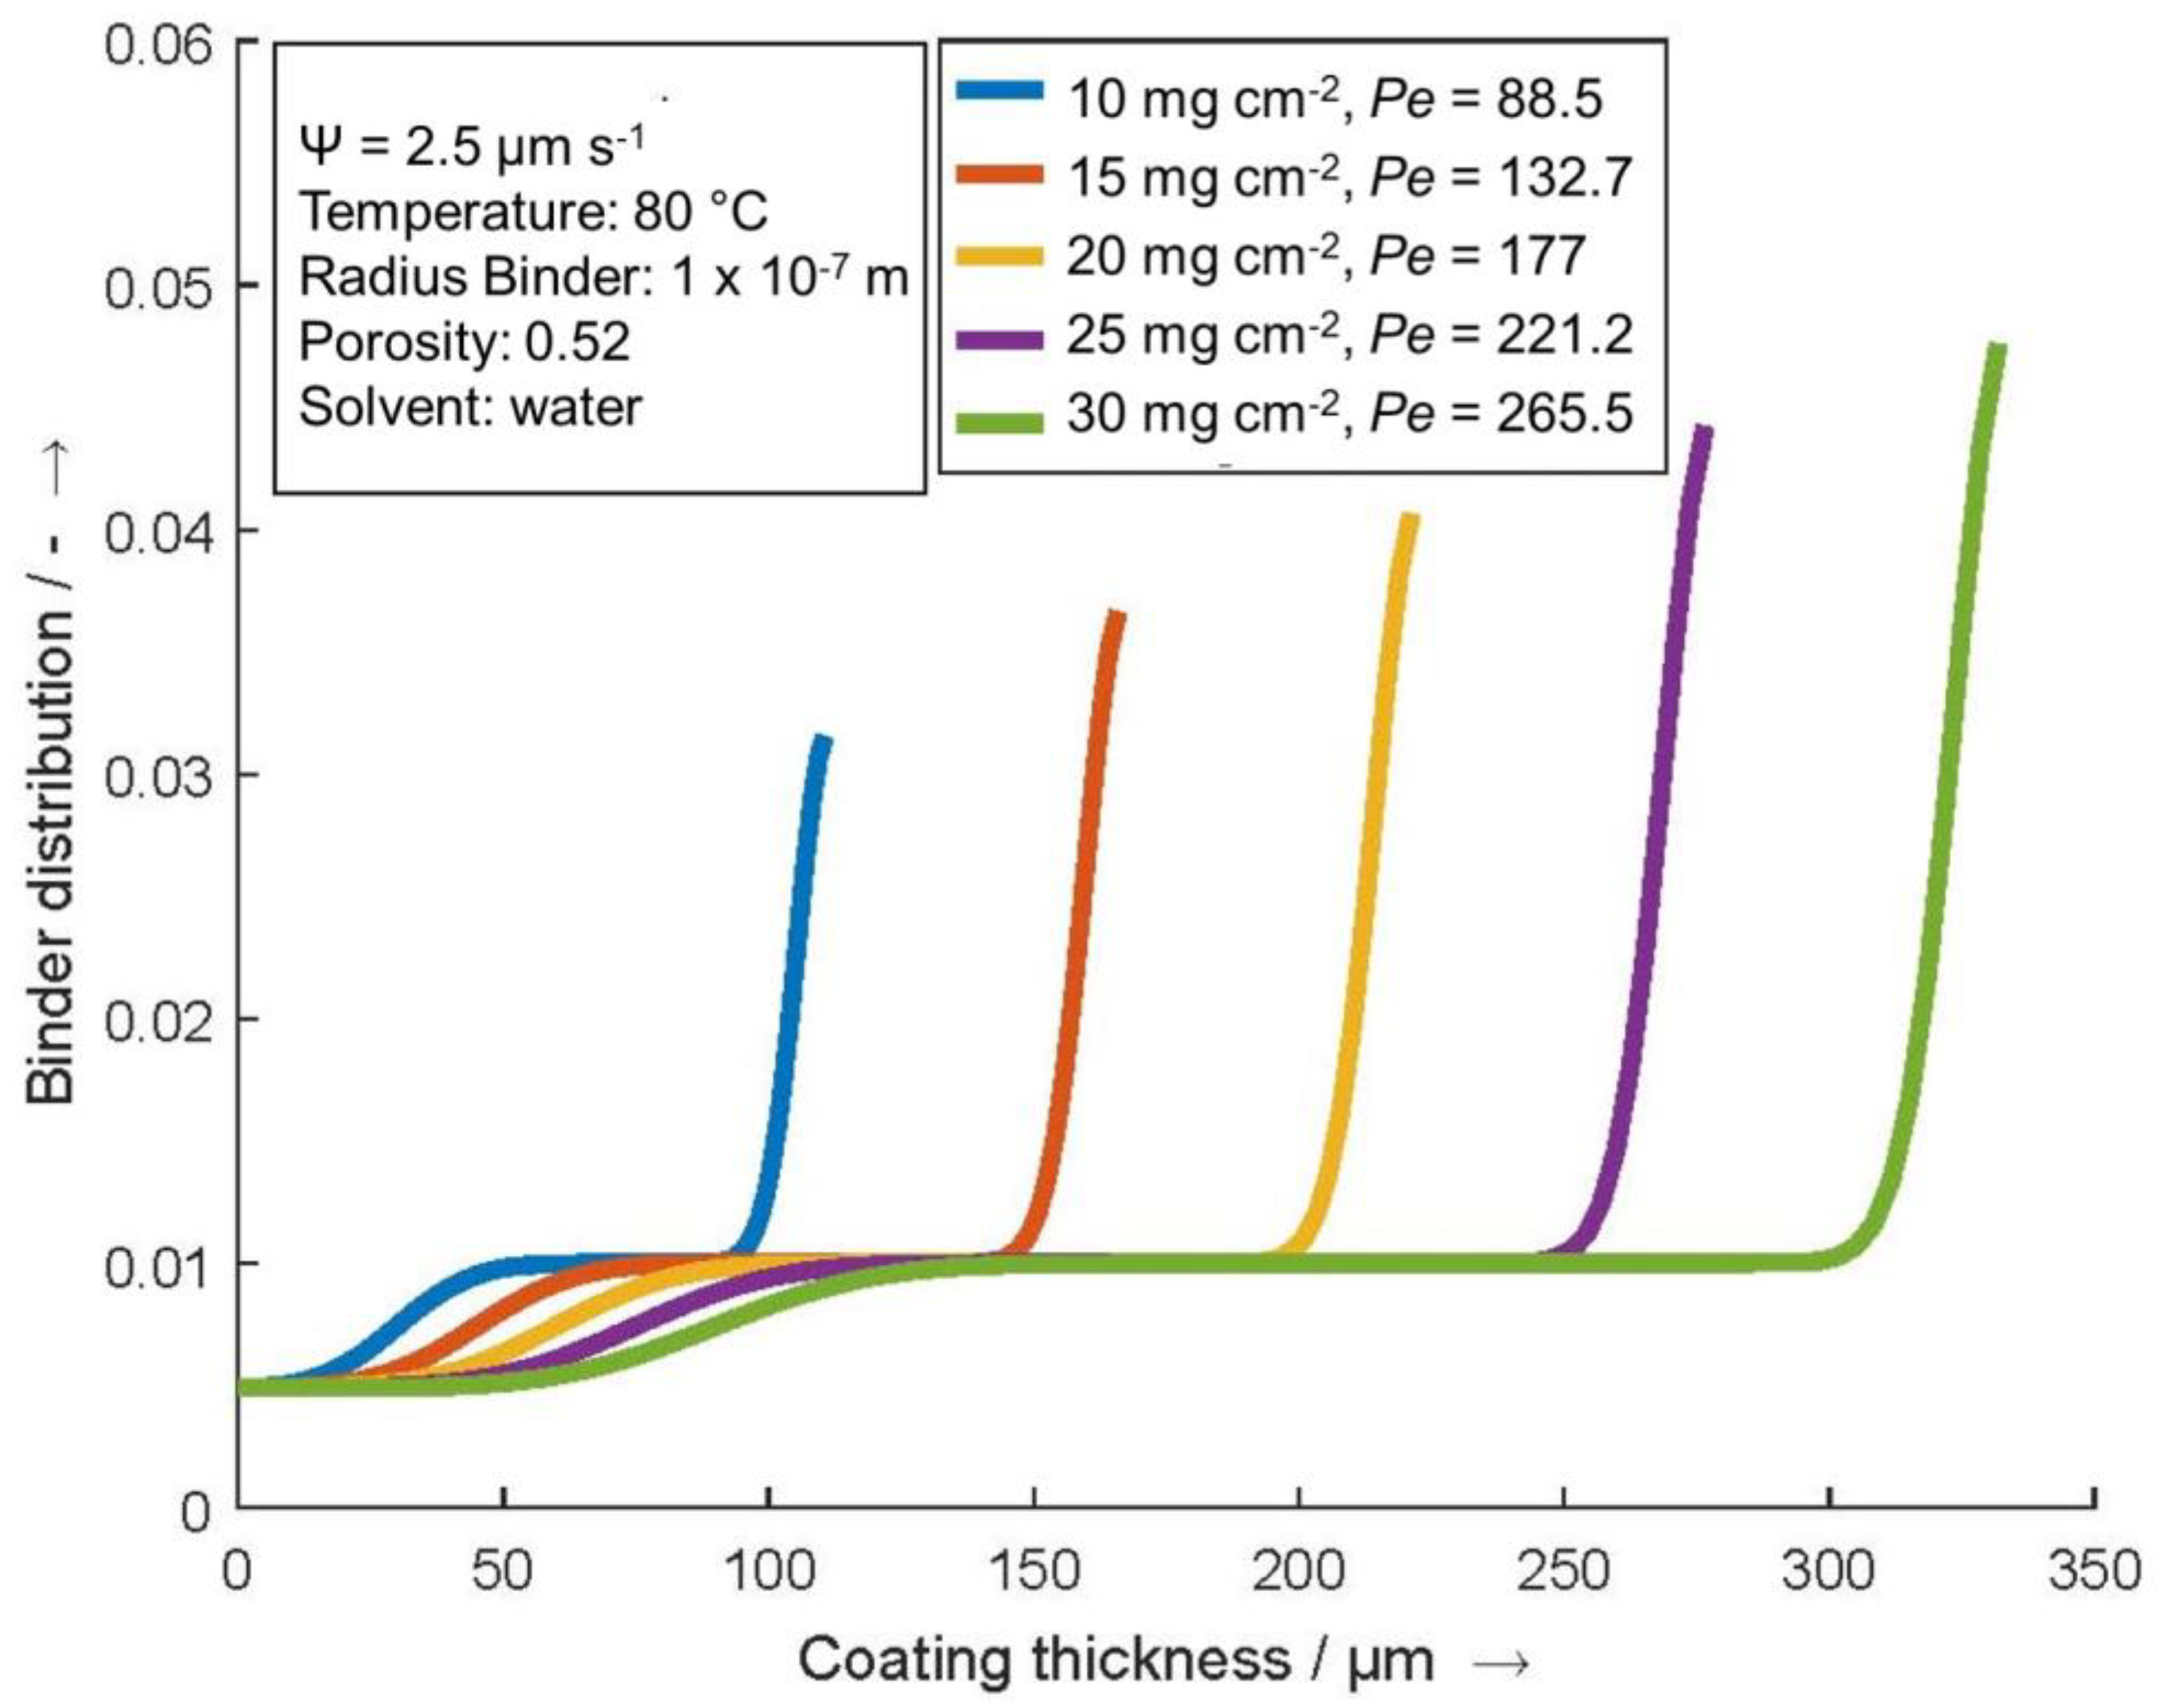
A higher layer thickness or loading has a negative effect on the distribution of the binder, as seen in
Figure 9. For the calculation, the mass loading was varied between 10 mg/cm
2 and 30 mg/cm
2 at a constant ψ = 2.5 µm/s.
Since an increment number of N = 100 is used independently of the mass loading, the binder distribution over the layer thickness can be compared quantitatively. It can be stated that the results of the experiments could be reproduced by the simulation and that higher mass loadings lead to higher binder migration.
In the calculation of the Péclet number, the size to be adjusted is the characteristic length L for which the wet film thickness is used. Consequently, the Péclet number increases with increasing area loading. The simulation reflects the increase in surface loading, in particular due to a longer effective time of the convection term, which increases with increasing area loading due to a higher tEoS.
This confirms the hypothesis that a binder migration at high mass loadings can hardly be avoided, in particular with the consideration of necessary high drying rates in the series production of battery electrodes.
4.3. Temperature Influence at a Constant Shrinking Rate
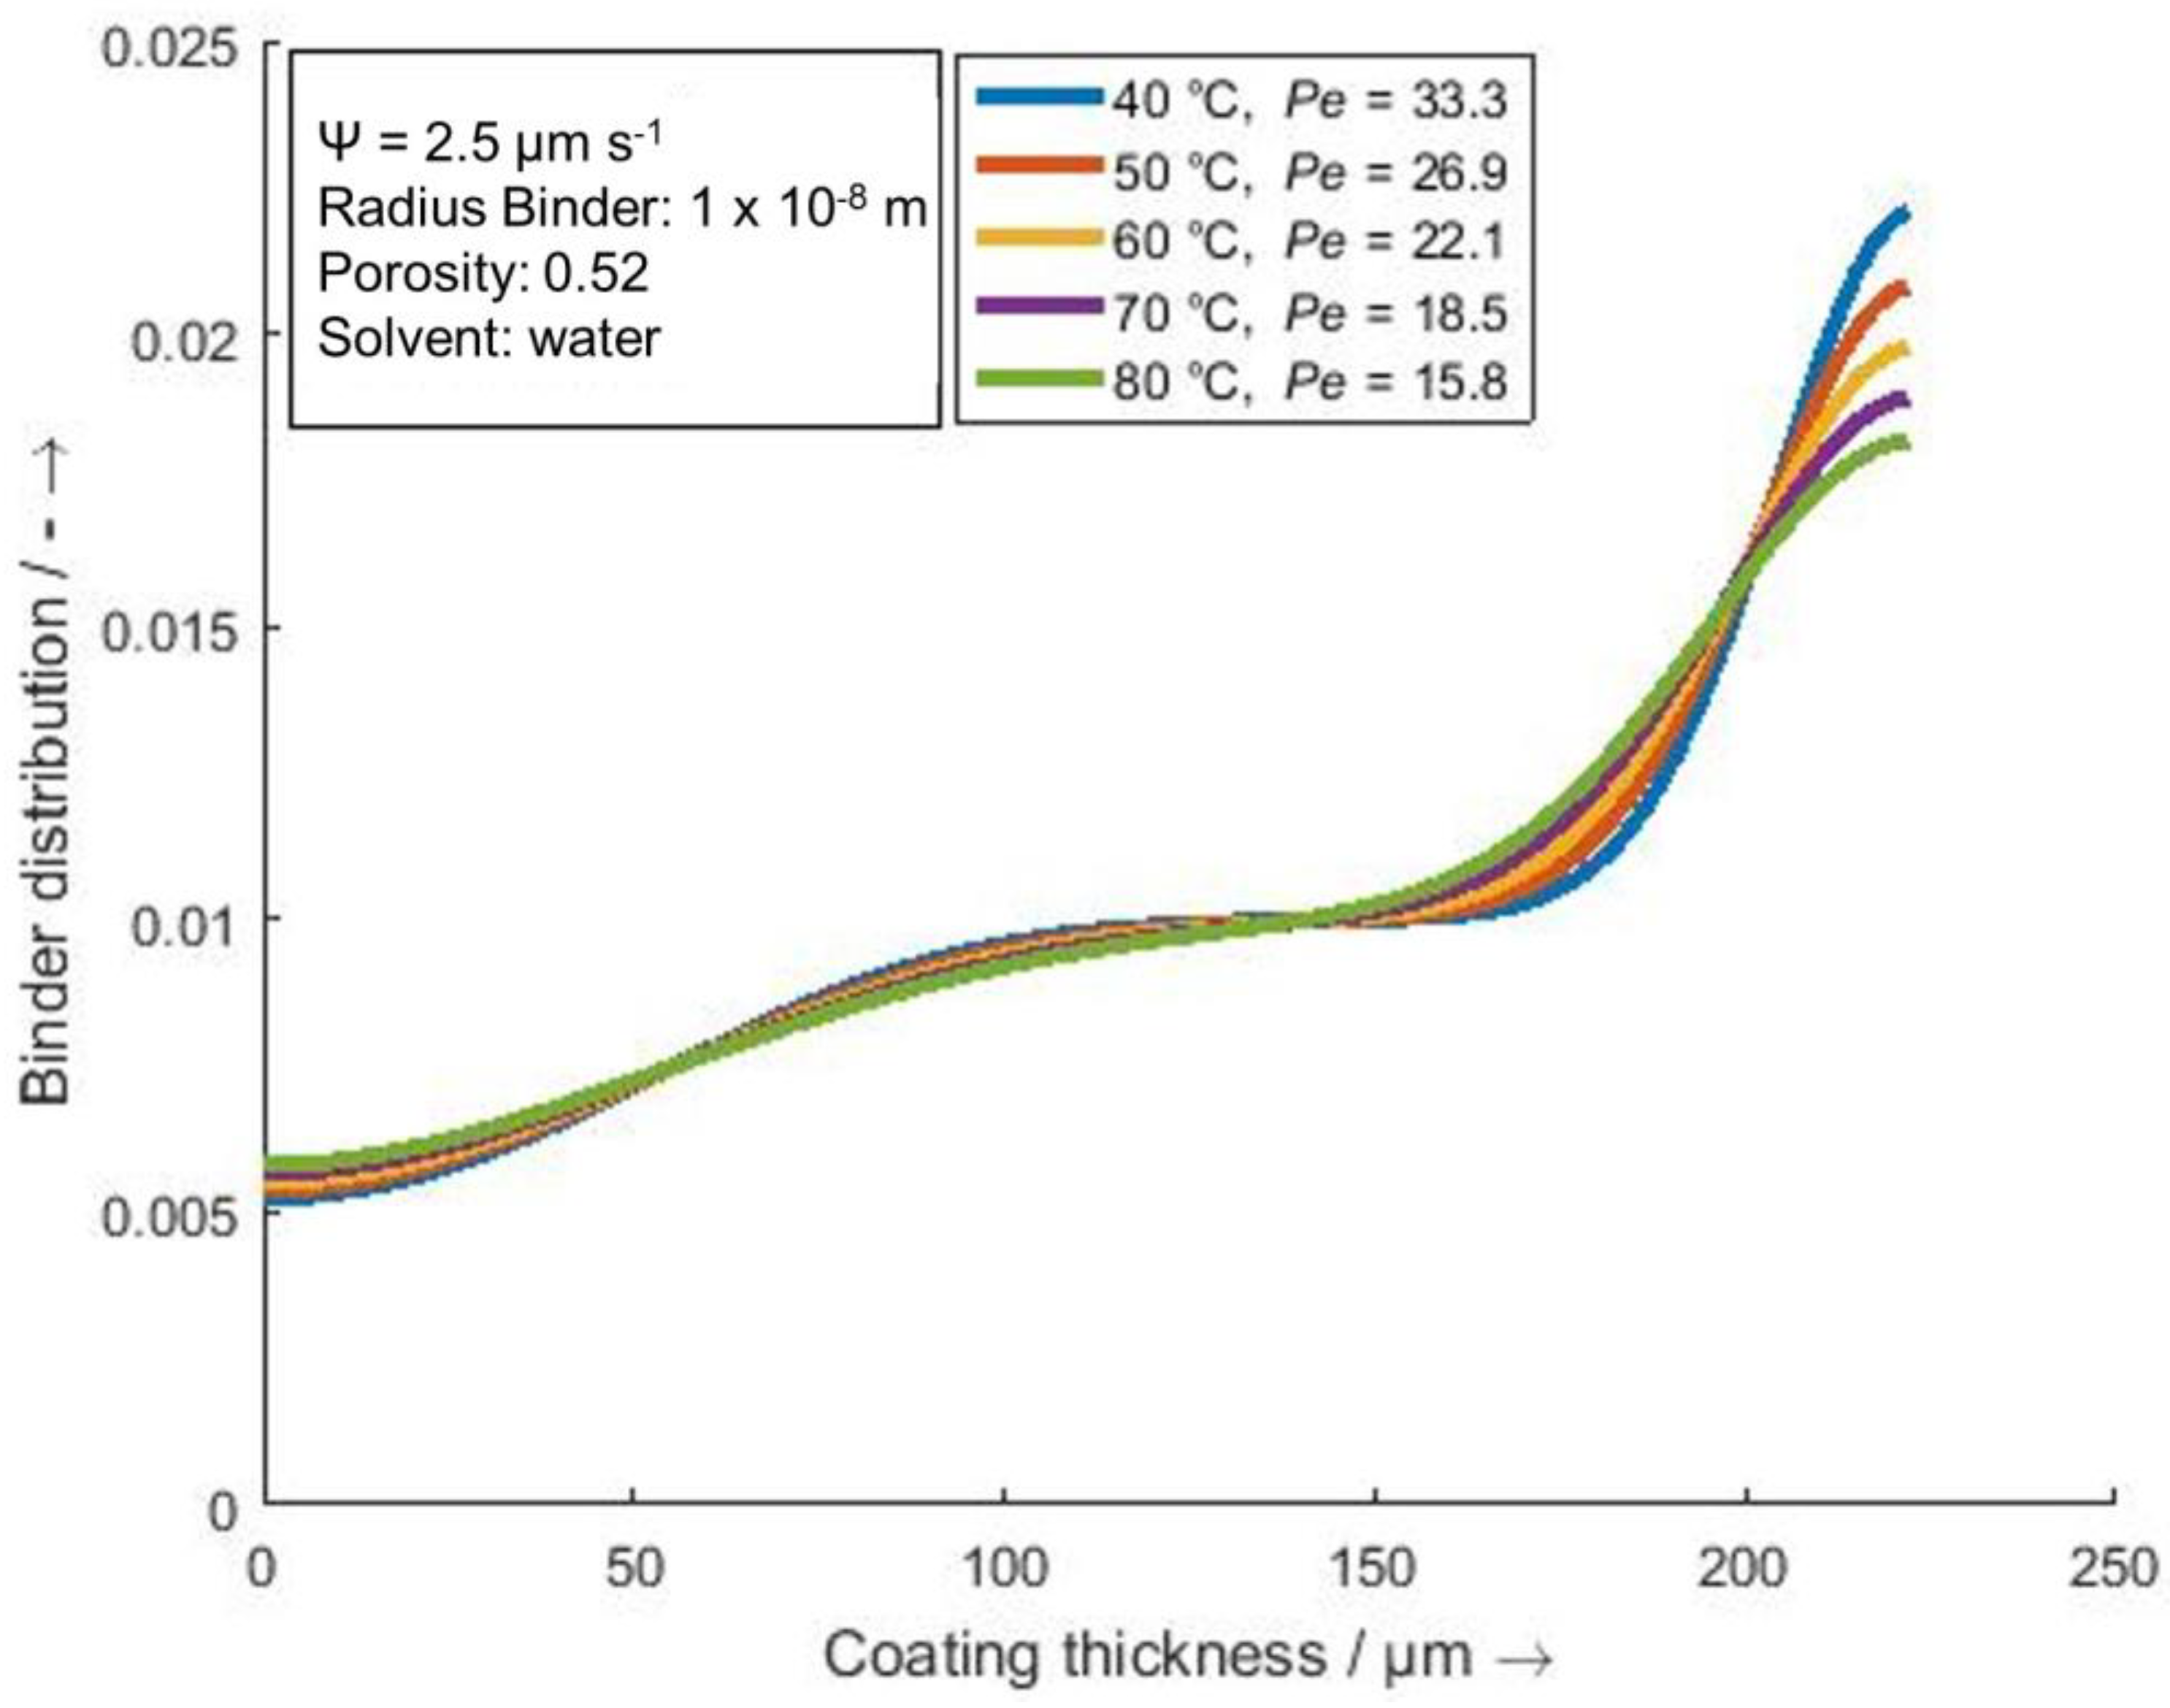
In the following calculation (
Figure 10), the coating temperature is varied while the shrinkage rate ψ remains constant at 2.5 µm/s. In practice, this occurs when the drying temperature is increased and the heat transfer coefficient is simultaneously reduced. It should be noted that an increase in temperature is not fully dependent on the rate of decrease in the layer thickness and the drying temperature cannot be used directly as the coating temperature since the coating temperature will be decreased by evaporation cooling.
The binder radius was reduced to r = 0.01 µm instead of r = 0.1 µm to make changes more prominent.
It can be seen that with higher temperatures the homogeneity of the binder distribution increases and thus the most homogeneous distribution is achieved at the highest temperature at 80 °C. Since the temperature has an influence on the effective diffusion coefficient, the influence on the diffusive term of the convection–diffusion equation increases. This can also be seen in the Péclet number which is at its highest at 40 °C with 13.7 and at its lowest at 80 °C with 6.8. Hence, at low temperatures, the convection becomes more influential.
When transferring this knowledge into practice, it makes sense to use high temperatures but low heat transfer coefficients. This can be achieved, for example, by ensuring the flow of hot drying air from below to the substrate inside.
4.4. Temperature Gradient along the Layer Thickness
There are many internal and external factors which can lead to the formation of a temperature gradient along the layer thickness during the drying process. An example of an internal factor is evaporation cooling, which leads to lower temperatures at the layer surface. An external factor could be a difference in the temperature of the upper and lower air of the dryer.
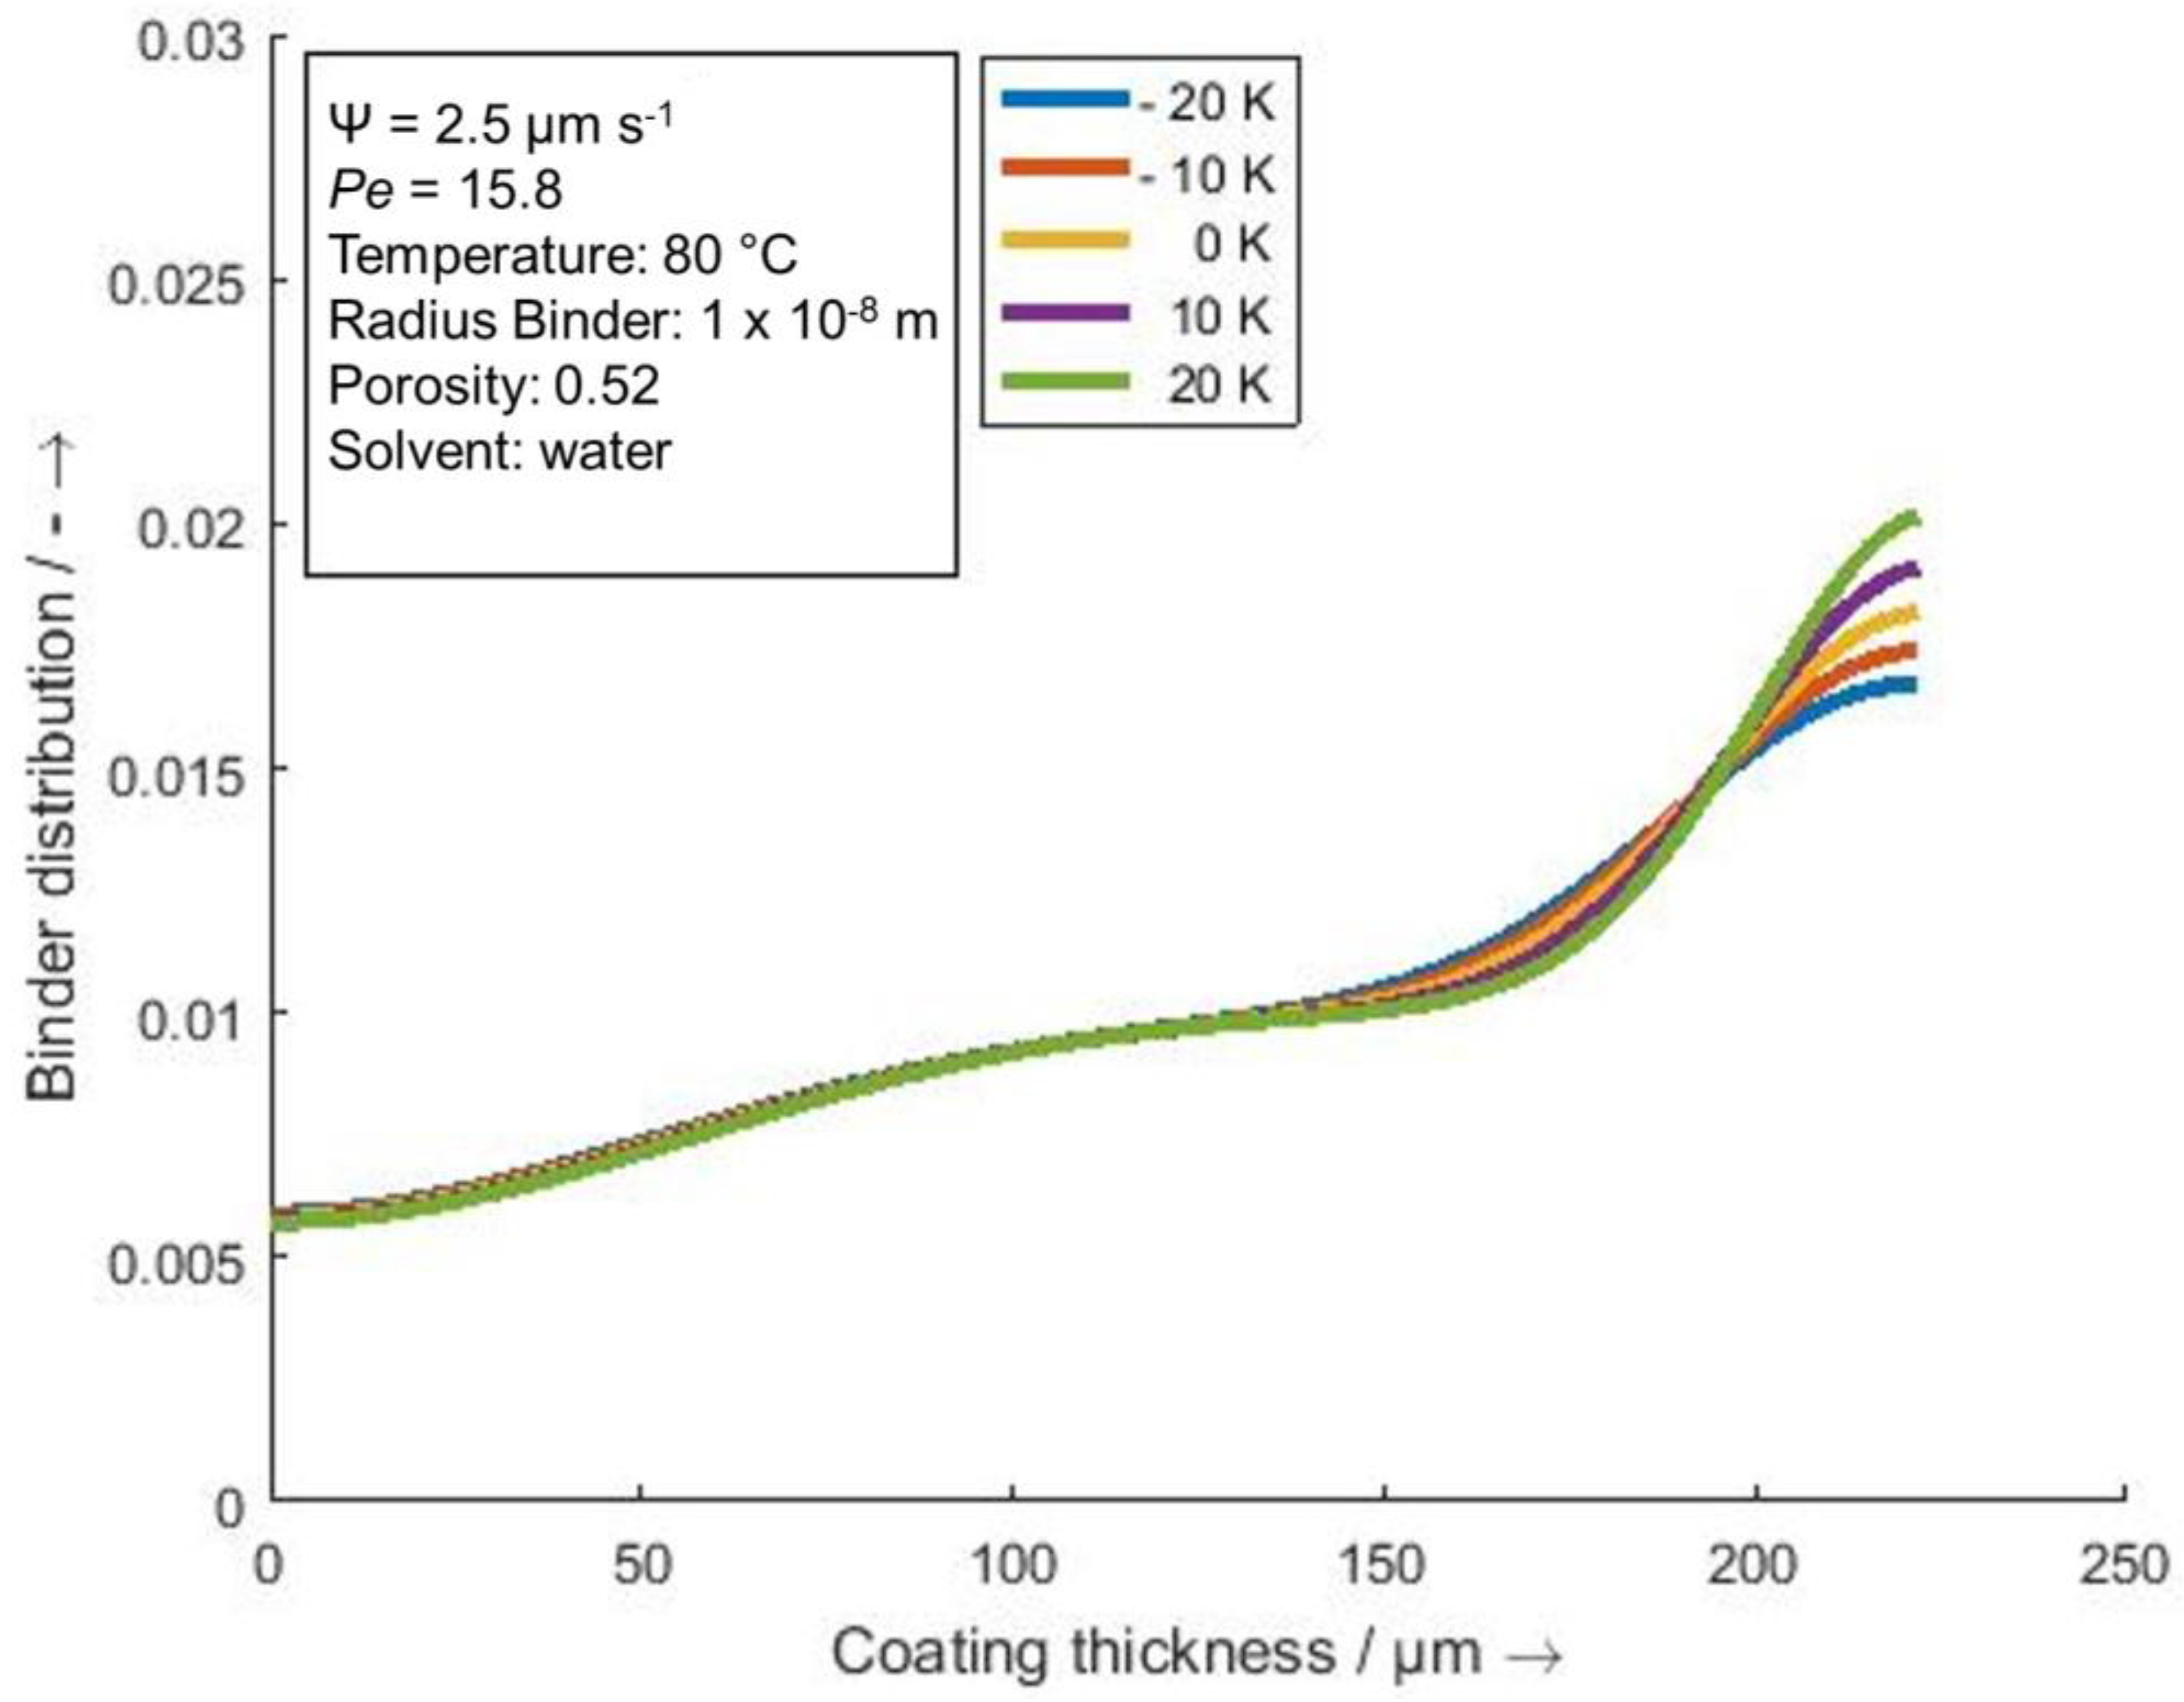
In
Figure 11, the binder radius was set to 0.01 µm to pronounce the effect of a temperature gradient on the diffusive term. In the respecting simulations, the temperature at the lower side (substrate) is set constant at 80 °C. To the top, the temperature decreases successively to 60 °C (−20 K), stays constant, or increases to 80 °C (+20 K). The temperature differences +10 K and −10 K complete the set.
Due to the almost identical temperatures on the substrate side, only minimal changes occur in the binder distribution in the lower half of the coating. In the upper half, positive temperature gradients lead to a more homogeneous binder distribution while negative gradients lead to stronger binder migration. Negative temperature gradients arise intrinsically from the evaporation cooling so that this effect can only be contained to a limited extent.
In relation to production, for dryers with separately adjustable temperatures for the flow from above and below, it can be concluded that it would be advantageous to use warmer air masses from above and to avoid the usage of hot air from below. However, it must be emphasized that it is only with an inflow of hot dry air from below that it is possible to achieve high coating temperatures combined with a moderate drying rate, which has been shown to be advantageous in order to achieve a homogeneous binder distribution. The extent to which infrared radiation can be used in the context of this insight is still to be investigated.
4.5. Mobile Binder Percentage
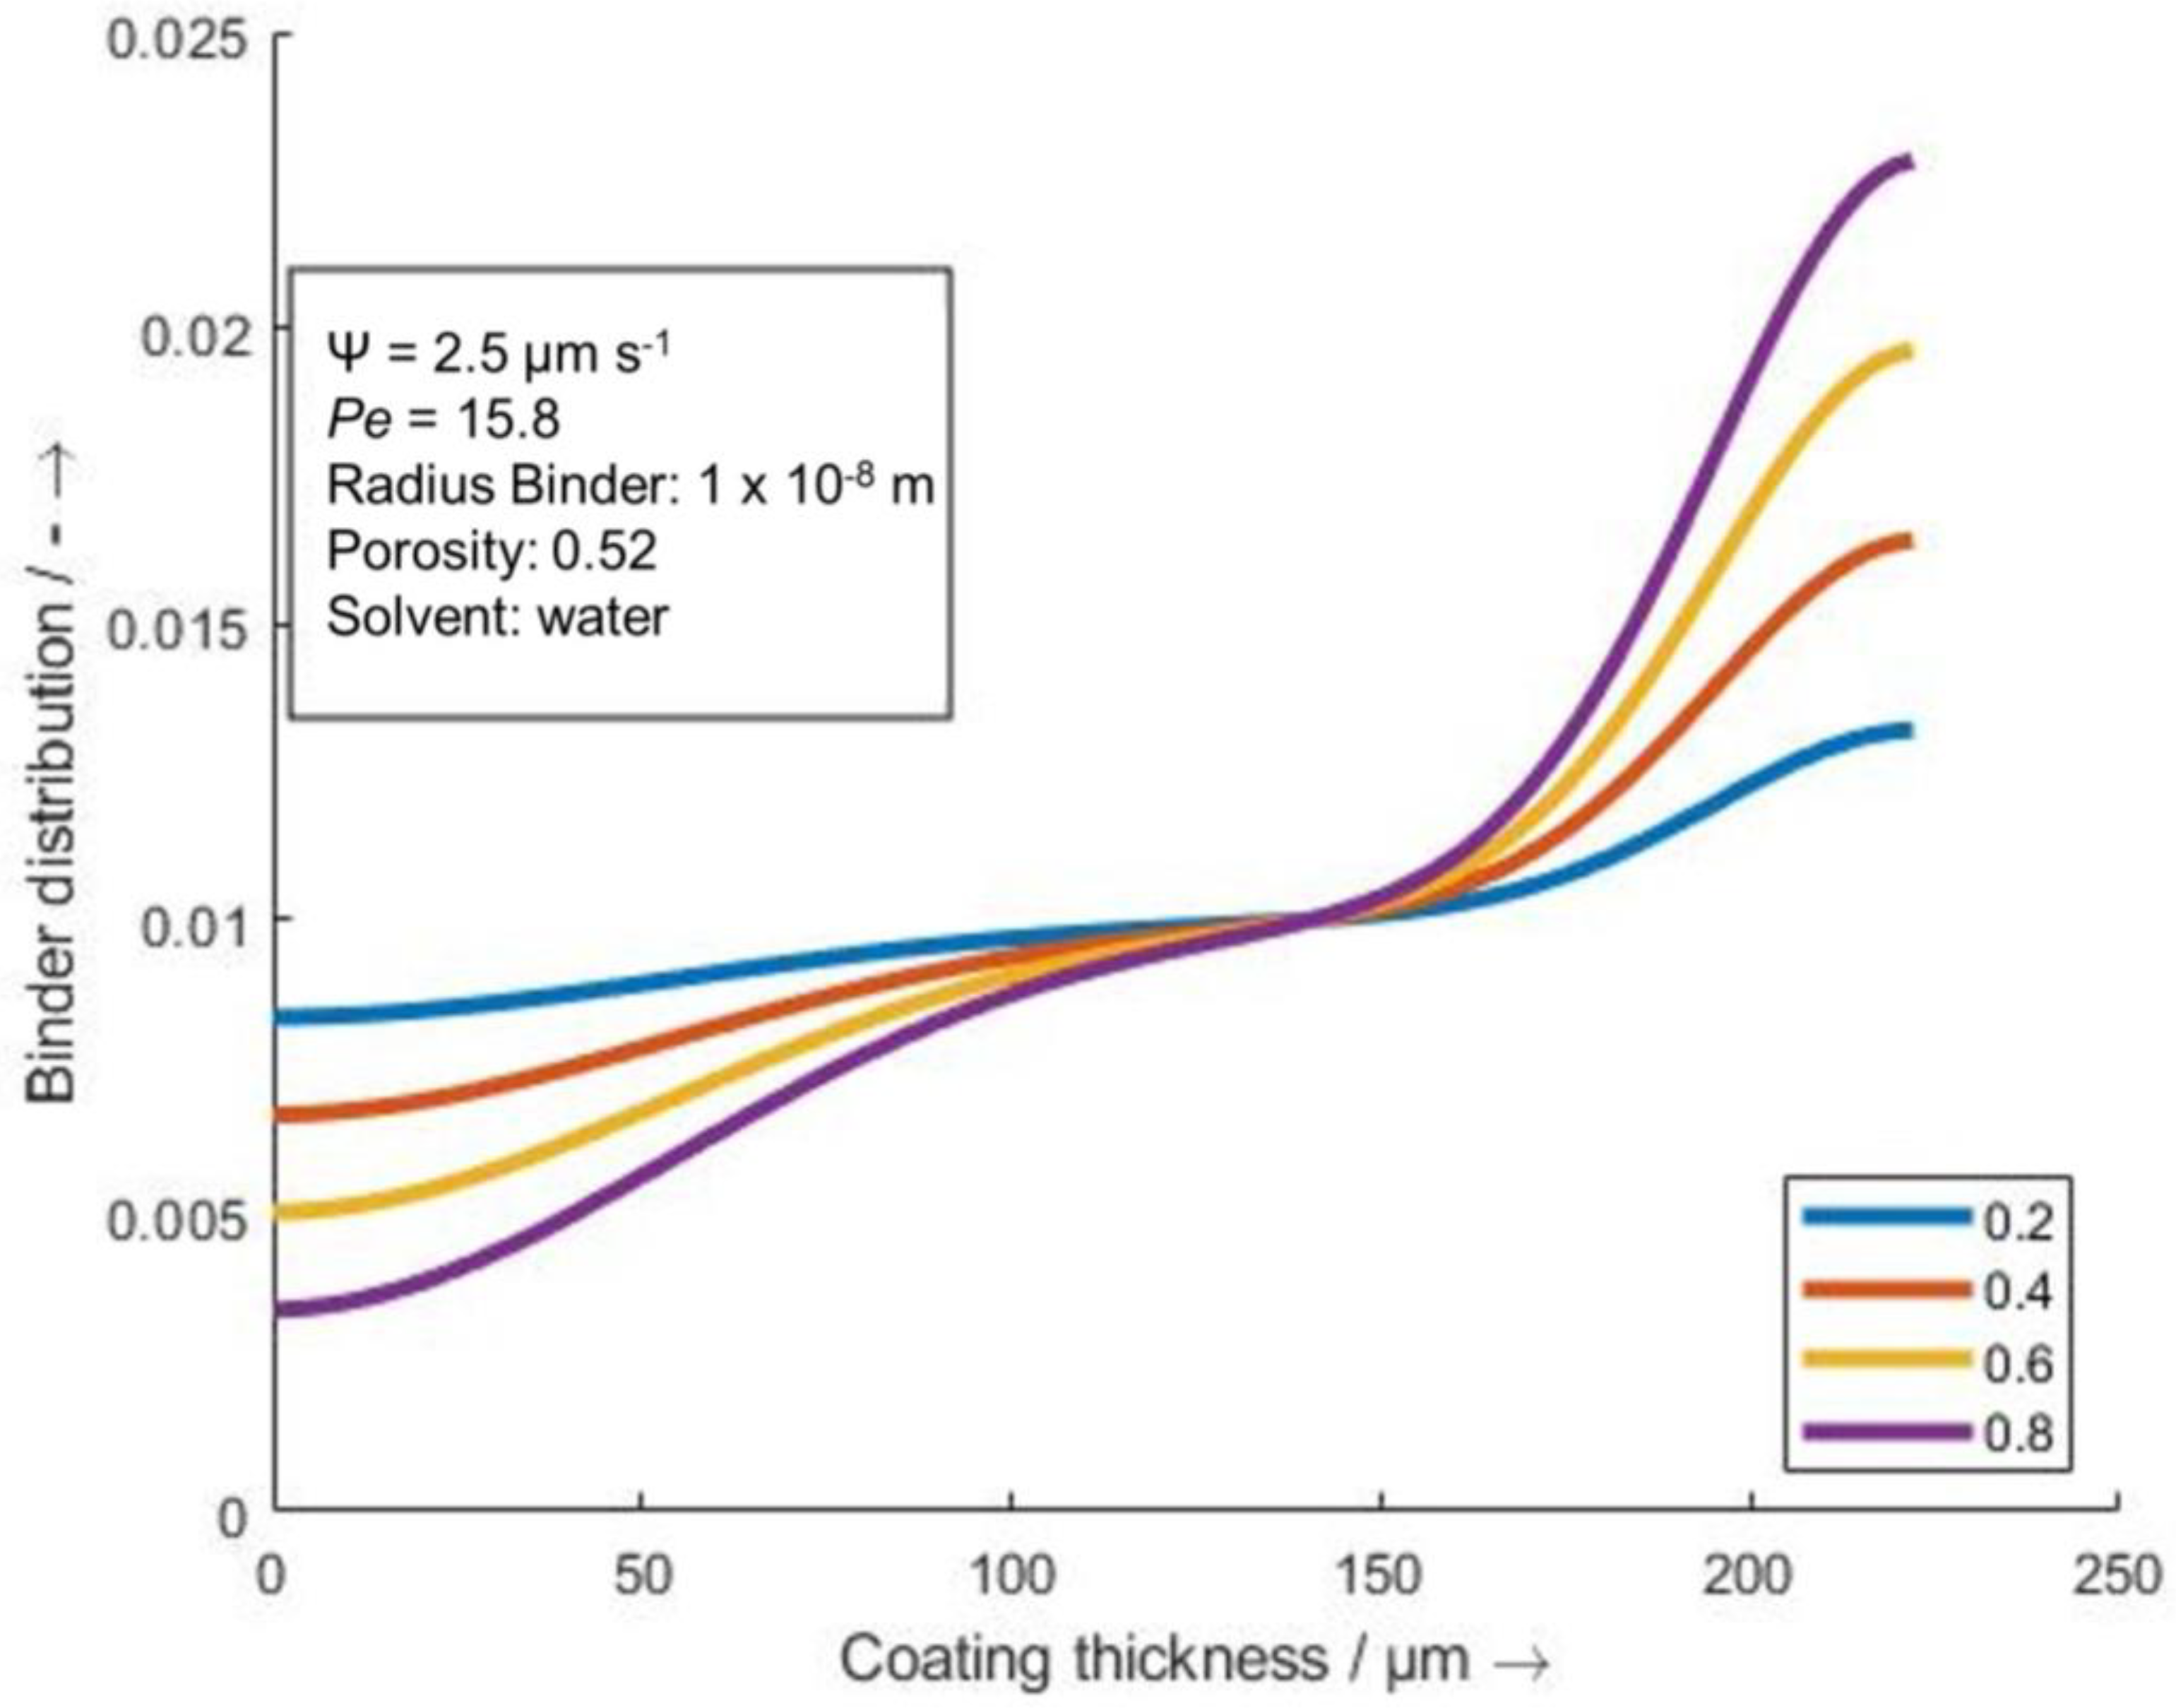
In order to shed light on the influence of the mobile binder content, how different proportions of the content affect the binder distribution of the dry electrode was modeled. For this purpose, the binder content was varied between 20 and 80% in
Figure 12. It can be seen that the gradient is clearly more pronounced when the binder gradient is higher. While on the film the binder content is determined almost one-to-one by the percentage acceptance of the binder, an even more pronounced shift can be seen for the surface of the electrode while the central area of the electrode is only slightly different between the variants. This clearly shows that in electrode production, it is important to optimize the formulation and the mixing process so that a high binding of the binder can be achieved before the drying process.
5. Conclusions
In this publication, the binder migration during the drying process of lithium-ion battery electrodes has been calculated over the drying time and layer thickness using the convection–diffusion equation. It was shown that convective-induced binder migration is influenced by the shrinkage of the coating as part of the evaporation of the solvent and reduction in porosity. Counteracting the convective movement of binder is the diffusive term which has an equalizing effect on the migration but is limited by time until the pores dry out. By calculating the binder migration over time and coating thickness, it was shown that the state of maximum demixing is at the time where the shrinkage of the coating and, therefore, the convective binder transport ends. The coating temperature TC has been varied between 39 °C and 72 °C with Péclet numbers of 21.8 and 179.3, respectively. Although the convective-induced binder migration has a higher rate with increased temperature, the overall transport is the same for electrodes with an identical start and end coating thickness, irrelevant of the drying temperatures. Stating this, the different severity of binder migration is mainly decided by the drying time, which is much shorter with higher drying temperatures. An increased diffusion due to higher temperature cannot compensate for the short drying time. This leads to severe binder migration in the surface near areas with twice as much binder from the lowest to highest temperature. Furthermore, the mass loading has been varied with intermediate stages from 10 mg cm−2 to 30 mg cm−2, with Péclet numbers between 88.5 and 265.5. Since higher loading levels have an overall longer time to reach the end of the shrinkage phase, the convective movement is more significant. With the same diffusion properties of these electrodes, the binder migration will be more severe, especially in the transition areas towards the substrate and the surface of the coating.
By applying high moisture conditions within the dryer, the drying conditions can be adjusted in a way such that the drying rate, which is herein represented by the shrinkage rate, can be held constant, even though the drying temperature is increased. This results in a decrease in the Péclet number from 33.3 at 40 °C to 15.8 at 80 °C and leads to a more homogeneous binder distribution with higher drying rates as the diffusive term is increased but the convective movement is constant.
To account for the cooling effect on the surface of the electrode during drying due to evaporation cooling, a gradient within the coating was applied in the calculations. A lower temperature at the surface of the coating has a negative effect on the binder migration in the upper half of the layer. This effect can only be constrained to a limited extent in terms of the practical use. Furthermore, the binder migration in regard to a mobile binder percentage of 20 to 80% was calculated. The less a binder is in a mobile state and is being moved by the convective flow within the coating, the less severe the binder migration is. In this regard, the mixing process is particularly relevant as it is believed that the mobile fraction of the binder is affected by the mixing procedure, but this will have to be studied further.
In further work, the model could be applied, for example, to investigate the influence of IR drying and other alternative heat input methods which have shown promising initial results [
55]. In addition, coupling with other simulations that looked at other aspects of the drying process, such as those by Lippke et al., will be explored to provide a holistic view of the drying process [
56].


