Article

Battery SOH Prediction Based on Multi-Dimensional Health Indicators

1
College of Automation, Harbin University of Science and Technology, Harbin 150080, China
2
System Integration Engineering Research Center, School of Electrical and Electronic Engineering, Harbin University of Science and Technology, Harbin 150080, China
*
Author to whom correspondence should be addressed.
Batteries 2023, 9(2), 80; https://doi.org/10.3390/batteries9020080
Submission received: 22 December 2022 / Revised: 16 January 2023 / Accepted: 20 January 2023 / Published: 24 January 2023
(This article belongs to the Special Issue Battery Energy Storage in Advanced Power Systems)

Abstract

:
Battery capacity is an important metric for evaluating and predicting the health status of lithium-ion batteries. In order to determine the answer, the battery’s capacity must be, with some difficulty, directly measured online with existing methods. This paper proposes a multi-dimensional health indicator (HI) battery state of health (SOH) prediction method involving the analysis of the battery equivalent circuit model and constant current discharge characteristic curve. The values of polarization resistance, polarization capacitance, and initial discharge resistance are identified as the health indicators reflective of the battery’s state of health. Moreover, the retention strategy genetic algorithm (e-GA) selects the optimal voltage drop segment, and the corresponding equal voltage drop discharge time is also used as a health indicator. Based on the above health indicator selection strategy, a battery SOH prediction model based on particle swarm optimization (PSO) and LSTM neural network is constructed, and its accuracy is validated. The experimental results demonstrate that the suggested strategy is accurate and generalizable. Compared with the prediction model with single health indicator input, the accuracy is increased by 0.79%.

1. Introduction

Under the burden of the energy crisis, the hunt for safe, clean, and efficient energy conversion and storage technologies has risen to the forefront of the scientific research community. As a storage and conversion carrier of electrical energy [1], lithium-ion batteries are extensively employed in electronic devices and systems because of their advantages of high safety, many-cycle lifespan, low pollution, and low self-discharge rate. However, during the cycling process, the battery’s internal structure will change with the accumulation of battery uses, increasing the battery’s internal resistance [2] and the capacity decay degradation. Aging lithium-ion batteries can cause a decline in the functionality of electronic devices and bring safety hazards. Battery health status is an important indicator that reflects the degree of battery deterioration and aging and that may be used as a reference indicator for the replacement and recycling of deteriorated batteries so that the system can continue to work properly and avoid incidents [3].
Current lithium-ion battery health state prediction research has made significant strides, and several novel methodologies and techniques have been developed that can effectively improve the accuracy of lithium-ion battery health state prediction. Battery health state prediction methods are divided into two major categories [4], namely, model-based prediction methods [5,6,7] and data-driven prediction methods [8,9,10]. Data-driven prediction methods for lithium-ion battery SOH are the most widely used prediction methods at home and abroad; the data-driven methods include Support Vector Machine (SVM) [11,12], Gaussian Process Regression (GPR) [13,14,15], Relevance Vector Machine (RVM) [16,17,18], and neural network methods [19,20,21], etc. The data-driven prediction methods based on the complicated chemical processes occurring within the battery do not need to be considered and are more generic.
The degradation of lithium-ion batteries is often expressed by a drop in battery capacity as the number of charge/discharge cycles increases, and the remaining battery capacity can serve as an indicator of the battery’s health. However, battery capacity data is typically impossible to collect directly online; hence, indirect health indicators are derived to predict the battery’s remaining capacity and reflect the battery’s health status. Wei et al. [22] selected battery capacity as the variable indicating the battery’s health status and used a support vector regression-based method to estimate the battery’s SOH. However, battery capacity is difficult to measure directly, and the metric lacks real-time capability. Hu et al. [23] selected the sample entropy of discharge, voltage sample entropy, as the health indicator and Huang et al. [24] selected equal voltage rise interval as the health indicator, but extracting the health indicator only from a single scale does not reflect the different battery health states well and is insufficient to predict complex capacity changes.
The data-driven prediction method does not need to consider complex electrochemical characteristics but instead pulls health parameters that indicate the deterioration trend from raw data, learns through intelligent algorithms, and predicts SOH. Li et al. [25] extracted characteristic parameters from the capacity increment curve and established a model for estimate and prediction using the Gaussian process regression technique. However, the hyperparameter adjustment of the GPR algorithm is more complicated and involves many matrix inversion operations. The algorithm’s complexity is quite high and its size is huge; there is a limit to the quantity of training samples, and modeling is challenging. Zhang et al. [26] proposed using the accelerated particle swarm optimization algorithm to extract six new features from the cyclic charge and discharge cycle and develop an adaptive multi-core correlator SOH prediction model. However, due to the high sparsity of RVM, the prediction method based on RVM is often not stable enough; limited by its structure, the model is only good in short-term prediction. Tian et al. [27] proposed a method for extracting the temperature difference curve in the constant charging process as a health factor and using the SVM to establish a SOH model, but the SVM algorithm has limitations, in that it is difficult to select a kernel function, and it is difficult to handle when the data scale is too large.
With the rapid advancement of machine learning and deep learning, neural networks are increasingly employed to predict battery SOH. Guo et al. [28] proposed a deep-learning-based lithium-ion battery capacity estimation method using recurrent neural network (RNN) to learn to predict the discharge voltage sequence of the battery. However, RNN suffers from intractable long-term reliance and restricted data input. Yin et al. [29] proposed a technique for a combined online estimate of battery SOC and SOH based on long- and short-term memory neural networks, the construction of LSTM neural network models, and the incorporation of stage SOH averages into the calculation of SOC to accomplish joint estimation. However, the LSTM prediction parameters are too many, and empirical parameter selection makes it difficult to properly leverage the LSTM’s prediction capabilities.
In the existing field of battery health state prediction, the selection strategy of health factors greatly impacts the prediction model’s accuracy. In the current research, however, there are issues such as single health factor indications and long-term dependence on the algorithm. The battery’s intricate internal construction makes it difficult to measure SOH directly. Therefore, this paper proposes a method for analyzing constant current discharge characteristics to extract multi-dimensional health indicators, including the extraction of health factors through the equivalent model of lithium-ion batteries and constant current discharge curves and the application of the e-GA algorithm to optimize the voltage drop segment of the TAB. Finally, four health factors are obtained as model input, and the hyperparameters of the LSTM model are optimized to predict the health status of the lithium-ion battery.

2. PSO Algorithm and LSTM Neural Network

2.1. LSTM Neural Network [30]

The decline of Li-ion batteries is a long-term continuous process, the state of the battery is correlated with between each charge/discharge cycle, and the relationship between the changes in the time series during the decline of battery should be fully considered when data-driven methods are used. Some existing methods only rely on the measurement data under the current cycle of the battery to evaluate the state of battery, without considering the change of battery state. Differently, LSTM recurrent neural network is a kind of neural network that takes the sequence data as input and recurs in the evolution direction of the sequence. Also, the model can be used to make prediction for long sequence data, which solves the problem that RNN is prone to gradient explosion or disappearance.
The key for LSTM neural network to solve the long-term dependence problem is to add a complex “gate” structure to the normal RNN neural network to filter the redundant information and decide to perform an update or discard operation for each data. The sigmoid function is used as the activation function, and the output data in the sigmoid ranges between “1” and “0” (1 means complete retention and 0 means complete discard). The basic structure of LSTM is shown in Figure 1. A typical LSTM neuron consists of a forgetting gate f t , input gate i t , and output gate o t .
The forgetting gate determines how much of the cell state from the previous moment is retained to the current moment cell state, and this information is processed by the sigmoid function. The forgetting gate is calculated as follows:
f t = σ ( W f [ h t 1 , x t ] + b f )
The input gate is capable of selecting the key information to be stored in the internal state. The key information consists of two parts, and the first part determines the information to be updated.
i t = σ ( W i . [ h t 1 , x t ] + b i )
The second part adds the new information generated by the current input to the cell status and then updates the cell status.
C t ~ = tanh ( W c . [ h t 1 , x t ] + b c )
C t = f t * C t 1 + i t * C t ~
The output gate calculates the current moment’s information output and retains the next hidden information.
o t = σ ( W o . [ h t 1 , x t ] + b o )
h t = o t * tanh ( c t )
where x t is the input at moment t ; h t 1 is the output of the hidden layer at moment t 1 ; C ˜ t is the amount of information brought by the new input; W f , W i , W c , and W o are the weight matrices of f t , i t , C ˜ t , and o t , respectively; and b f , b i , b c , and b f are b o their bias terms, respectively.

2.2. Particle Swarm Optimization Algorithm [31]

The particle swarm optimization algorithm is a typical swarm intelligence optimization algorithm. Similar to most swarm intelligence optimization algorithms, this algorithm initializes a group of solutions (particles) randomly and then updates them iteratively. This makes the whole population develop in the direction of better adaptive value, so as to find the optimal solution to the problem in a limited number of iterative steps.
PSO initializes its state as a group of randomly generated particles, and then the position of the particles is iteratively changed to find the optimal solution. The mathematical model of the particle swarm is as follows: Let the search space of the particle swarm be D-dimensional, and the number of particles is n. A population X = x 1 , x 2 , , x m is constituted, and any one X i d = x i 1 , x i 2 , , x i D is selected in this population; at this time, the velocity vector is V i = { v i 1 , v i 2 , v i D ) ; the individual optimal position is P i d , p b e s t = p i 1 , p i 2 , p i D ; and the population optimal position is P d , g b e s t = p 1 , g b e s t , p 2 , g b e s t , p D , g b e s t . The velocity and position change of each particle are shown as follows.
v i j ( k + 1 ) = w . v i j ( k ) + c 1 r 1 [ p i j ( k ) x i j ( k ) ] c 2 r 2 [ p g j ( k ) x i j ( k ) ]
x i j ( k + 1 ) = x i j ( k ) + v i j ( k + 1 )
where c 1 and c 2 are learning factors as well as positive constants; w is the inertia weight; k is the number of iterations; and p i j and p g j are the current particle population local optimal position and global optimal position, respectively.
Since the decline of the lithium battery’s lifetime is a continuous process as well as a time series data, the LSTM model produces excellent results in time series prediction. However, the hyperparameters in the LSTM algorithm have a significant impact on the accuracy of load prediction. Therefore, PSO is used to optimize the hyperparameters of LSTM.

3. SOH Prediction Feature Health Factor Extraction

The internal chemical reaction of lithium battery aging and aging will be accompanied by the changes in capacitance and resistance, while the changes in resistance and capacitance are often not quantifiable. Therefore, in practice, the battery capacity is reflected by direct or indirect health indicators. The health indicator can be the battery capacity, resistance, and other inherent parameters of the battery. Alternatively, it can be the time variation of the iso-voltage difference, the capacity increment curve, and the time when the battery temperature reaches its peak. In this paper, the selected health indicator is used as the input of the battery prediction model to build the battery SOH prediction model.

3.1. First-Order RC Equivalent Model for Lithium Batteries

The lithium battery equivalent circuit consists of an ideal voltage source, a resistor and n RC loops. The first-order and second-order RC equivalent circuit models are more accurate and reliable than other models. When the HPPC experimental environment is not needed, the first-order RC equivalent circuit is advantageous in speed and in the outcome of identification. The MAE and RMSE of terminal voltage and open circuit voltage as estimated by different models are shown in Table 1 [32].
The first-order RC equivalent circuit model of a lithium battery is shown in Figure 2 [33]. This model consists of a resistor, an ideal voltage source, and an RC loop.
According to the equivalent model shown in Figure 2, the equivalent equation of the circuit can be obtained according to the Kirchhoff voltage and current law and other relevant knowledge:
V d = V o c v I R 0 V 1
V 1 = 1 R 1 C 1 V 1 + 1 C 1 I
where R 0 is the battery ohmic internal resistance, R 1 is the battery polarization internal resistance, C 1 is the battery polarization capacitance, V d is the battery terminal voltage, V o c v is the battery open circuit voltage, V 1 is the battery polarization voltage, and I is the battery charge and discharge current.
By analyzing the change of terminal voltage in the three stages of discharge, it can be established that the discharge of lithium battery is the zero-step response stage when the terminal voltage V d changes over time, as shown in Equation (11).
V d = V o c v I R 0 I R 1 ( 1 e t R 1 C 1 )
The static stage after the discharge is the zero-input response stage. At this time, the formula of terminal voltage calculation is shown in Formula (12) and Formula (13), from which it can be seen that it will gradually decay to 0 after a period of time as the polarization reaction diminishes [34].
V d = V o c v V 1 ( 0 ) e t R 1 C 1
V 1 ( 0 ) = I R 1

3.2. Selection of Health Indicators

Based on the equivalent circuit model of the lithium battery, the external characteristics of the lithium battery, as indicated by the discharge curve of the terminal voltage, are analyzed and fitted. The polarization reaction of the lithium battery is closely related to the SOH of the battery, and the polarization resistance and capacitance of the battery will change with the cycle. The increase in the number of times shows a regular change. The initial discharge internal resistance, polarization internal resistance, and polarization capacitance of the battery are taken as important indicators to map the SOH of the lithium battery, so as to predict the actual capacity of the battery according to its partial discharge characteristics. Therefore, the initial discharge internal resistance, polarization internal resistance, and polarization capacitance of the battery are regarded as the health indicators of the battery’s capacity. Also, the initial discharge internal resistance value T A B as an important manifestation of battery degradation is also regarded as one of the health indicators.

3.2.1. Using Parameter Identification to Extract R 1 and C 1

According to the constant current discharge characteristics of the battery, the primary discharge process is divided into three parts: before discharge (before point a), during discharge (from point b to point c) and after discharge (after point d). It can be seen that after the completion of discharge, there will be a period of voltage rise when the battery is left standing for a short period of time. The reason for this phenomenon is that the battery’s discharge is accompanied by a polarization reaction. The polarization reaction is manifested as a voltage change of the battery. In case of high-current discharging, the voltage drop will be large. When the discharging stops, the battery polarization stops, and the battery’s voltage will rise significantly. According to Equations (12) and (13), the rebound curve after discharge at point d is a function curve expressed as I R 1 ( 1 e 1 R 1 C 1 ) in Figure 3, which provides a basis for the next round of parameter identification. In this paper, the curve parameter identification and the least squares method are used.
The B0005 battery data of a NASA lithium battery is selected as the research object. This is the most used public dataset in the current research in this field. A constant temperature box is used to eliminate the influence of external temperature. However, there are only a few battery samples in this data set, each battery sample corresponds to a single battery, and the sample points of each battery sample are relatively small. Also, the battery capacity degradation curve will show a phenomenon of short-term capacity regeneration. Among them, the B0005 battery data provided by NASA has a total of 168 cycles. In order to identify health factors through the discharge recovery phase, the terminal voltage recovery curve during 168 discharges is sorted out as shown in Figure 4. The starting point in the figure is point c in Figure 3. Since the terminal voltage values have time intervals, the actual voltage curve shows a certain distortion. Therefore, curve fitting is performed to infer the position of point d in the theoretical curve, which is the work of the subsequent preparation for identification.
In order to find the position of point d, the polyfit function in MATLAB is used to fit the remaining points in each cycle recovery voltage curve except the first point based on the fifth degree polynomial fitting through the least square method, where the polyfit function is the minimum used in MATLAB. The function of quadratic method parameter estimation for curve fitting can be called by command statement, and the output is the coefficient line. The fitting results are shown in Figure 5. For each cycle, point d is taken as the origin of the coordinate axis, and the recovery curve of the polarization reaction is drawn, as shown in Figure 6.
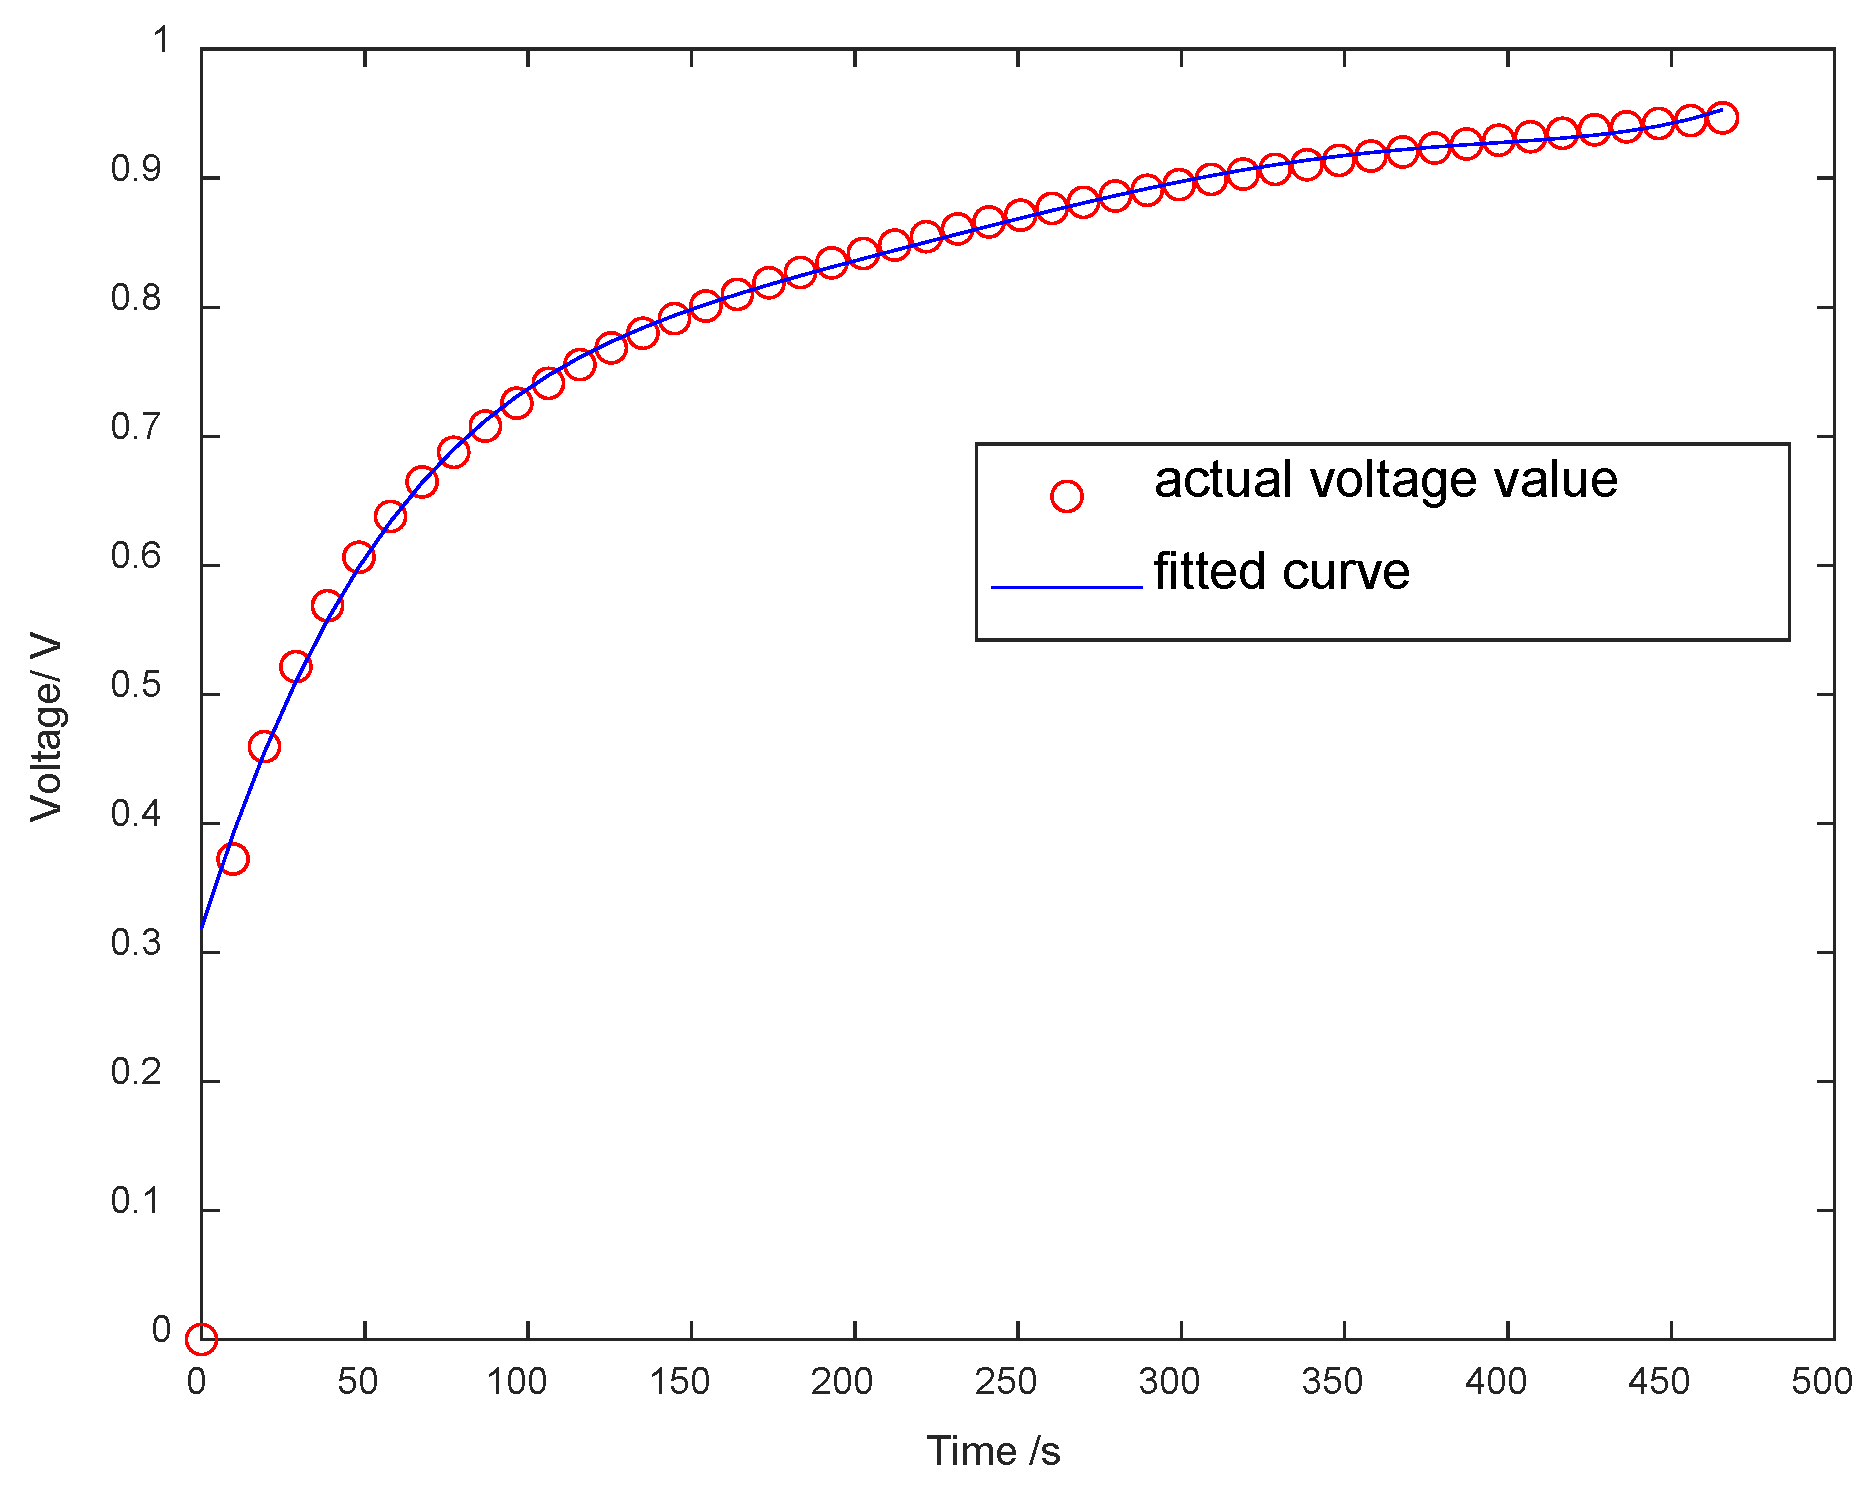
According to Equations (12) and (13) after the end of the discharge polarization reaction formula, it can be deduced that the polarization reaction formula in Figure 4 is as follows:
V 1 = I R 1 ( 1 e t R 1 C 1 )
where the values of the parameters are unknown. The process of identifying curve parameters by using the least squares method is shown in Figure 7. Specifically, Figure 7a shows the identification result of the entire cycle, the blue points represent the actual voltage values, and the red curve represents the identification curve of the polarization formula, while Figure 7b present the identification results of several cycles.
Finally, the polarization internal resistance and polarization capacitance are identified as shown in Figure 8. It can be seen from the figure that the polarization resistance and capacitance change regularly with the increase in the number of cycles [35], and R 1 and C 1 are feasible as the health factors of the battery to map the battery SOH.

3.2.2. Modified Discharge Curve Extraction R 01

The initial stage of discharge is the ohmic polarization stage, the voltage drop is caused by the internal resistance of each part of the battery connection, and the value of voltage drop follows Ohm’s law. Since the terminal voltage curve is not displayed in real time, the position of point b in Figure 9 on the actual voltage curve can be estimated by calculation. Also, the value of R 1 and C 1 can be obtained, while Equation (11) can be used to estimate the position of point b. Then, the value of corresponding discharge initial internal resistance R 01 can be obtained through the ratio of the voltage difference and the discharge current between point a and point b as shown in Figure 9. Figure 10 shows the curve of discharge initial resistance changing with cycle.

3.2.3. Extracting T A B under Constant Current Working Condition

Under the context of constant current, the discharge capacity C A B is obtained by multiplying the equal voltage drop discharge time series T A B by the discharge current, and the comparison curve between C A B and actual capacity of B0005 lithium battery is obtained by selecting a fixed voltage drop range of 3.8–3.5 V. As can be seen clearly from Figure 11, the connection with the actual capacity of the battery is very close. The feasibility of equal pressure drop discharge time as an indirect health indicator is verified. Among them, the actual capacity of the battery is measured by the ampere-hour method from the current curve of the battery in the process of discharging from the fully charged state to the cut-off voltage.
According to Equation (11), the effect of the polarization reaction on the end voltage will gradually decline or even disappear rapidly as the discharge process proceeds. Therefore, the end voltage can be taken as a simple internal resistance model equation, as shown in Equation (15) for most of the time in the discharge process [36].
V d = V o c v I R 0 I R 1 ( 1 e t R 1 C 1 ) V o c v I R 0 I R 1

3.3. Optimization of Health Indicator Based on e-GA

Although equal pressure drop discharge time is widely used as a health indicator for battery health state prediction, the T A B obtained by selecting different discharge voltage drop fragments varies, and the accuracy of prediction results produced by using them often varies significantly. To select a suitable health indicator, three discharge voltage drop segments (3.8–3.5 V, 3.5–3.2 V, and 3.0–2.7 V) are selected for comparison by examining the correlation between the iso-voltage drop and the actual capacity for different intervals. In the existing studies, there is a gray correlation analysis conducted to analyze the relationship between the extracted equal voltage drop discharge time and the actual discharge capacity [37], but the algorithm is computationally intensive. Therefore, the Pearson product distance correlation coefficient is used to verify the correlation between the different iso-voltage drop discharge time and the actual capacity. The calculation equation is shown as Equation (16).
r = i = 1 n ( x i x ^ ) ( y i y ^ ) i = 1 n ( x i x ^ ) 2 i = 1 n ( y i y ^ ) 2
where x and y are the comparison sequences with the sequence length n, and r is the Pearson correlation coefficient between the two sequences. The sequences generated by the R 01 ,   R 1 ,   C 1 , and T A B with the number of cycles are x, and the battery capacity sequence is y. When r > 0, the x and y sequences show positive correlation. When r < 0, the x and y sequences show negative correlation. The correlation relationship between the four health indicators and the actual capacity is obtained as follows.
As shown in Table 2, the correlations of the health indicators R 01 , R 1 , and C 1 are moderate or weak, but the correlation coefficient of T A B is related to the selection of the pressure drop interval. Therefore, the commonly used voltage interval for battery discharge is delineated, and the span of the voltage drop interval is constrained. The genetic algorithm based on the elite selection model is used to optimize the voltage drop segment. With the Pearson correlation as the fitness function of the e-GA algorithm, the pressure drop segment with the best correlation of T A B is selected.
The elite retention strategy is adopted to optimize GA. The individual with the highest level of fitness in the current generation is retained as an elite individual, and the remaining individuals are subjected to genetic operations such as random selection, crossover, and mutation. The steps of the algorithm include population initialization, fitness function setting, selection, crossover and mutation, and elite retention strategies. The voltage drop interval selected by the model ranges between 0.1 V and 0.2 V. Considering that the commonly used SOC range is from 80% to 30%, the search range for the optimal voltage drop interval of the B0005 battery V A is 3.85–3.10 V, e-GA. The algorithm has a step size of 0.01 V and 0.05 V. The model parameters are set as follows: the number of individuals in the initial population n = 20, the number of evolution k = 100, the crossover rate P c     = 0.4, and P m = 0.1.
The flowchart of model algorithm is as follows:
Step 1: Population initialization, which is to randomly generate the initial population P(t) of n individuals through binary coding of the selected pressure drop sequence.
Step 2: Fitness function, where the Pearson product-distance correlation coefficient is used to calculate individual fitness.
Step 3: Selection operator, which is used to obtain the individual fitness according to the fitness function, with n individuals randomly selected from the population (each individual has the same probability of being selected) for the population individual gambler.
Step 4: Crossover operator, with single-point crossover used and population individuals randomly paired. After successful pairing, a crossover bit is randomly selected by single-point crossover according to the crossover probability, the binary code exchange of the crossover bit is performed, and two new individuals will be obtained. Then, the new individual is tested. If the test is successful, the mutation operator is entered; otherwise, the cross position is re-selected until the test is successful.
Step 5: Mutation operator, where the individual is a binary coded string and the basic mutation method is used to mutate the individual. According to the mutation rate P m , the compiled bit is randomly selected, the binary character corresponding to the bit is reversed, and the fitness of the compiled individual is verified. If the verification is successful, then we proceed to get a new generation of individuals; otherwise, they will be re-selected and compiled until the verification is successful.
Step 6: Elite retention strategy, where the optimal individual with the optimal fitness value searched in the evolution of the population is saved as an elite individual. Also, the individual with the lowest fitness is replaced in the next generation, so as to avoid the loss and destruction of the best genes in the current population.
Step 7: It is determined whether the termination condition is satisfied. If the evolutionary count is reached, the pressure drop fragment with the optimal fitness is outputted; otherwise, the evolutionary count is increased by one before returning to step 2.
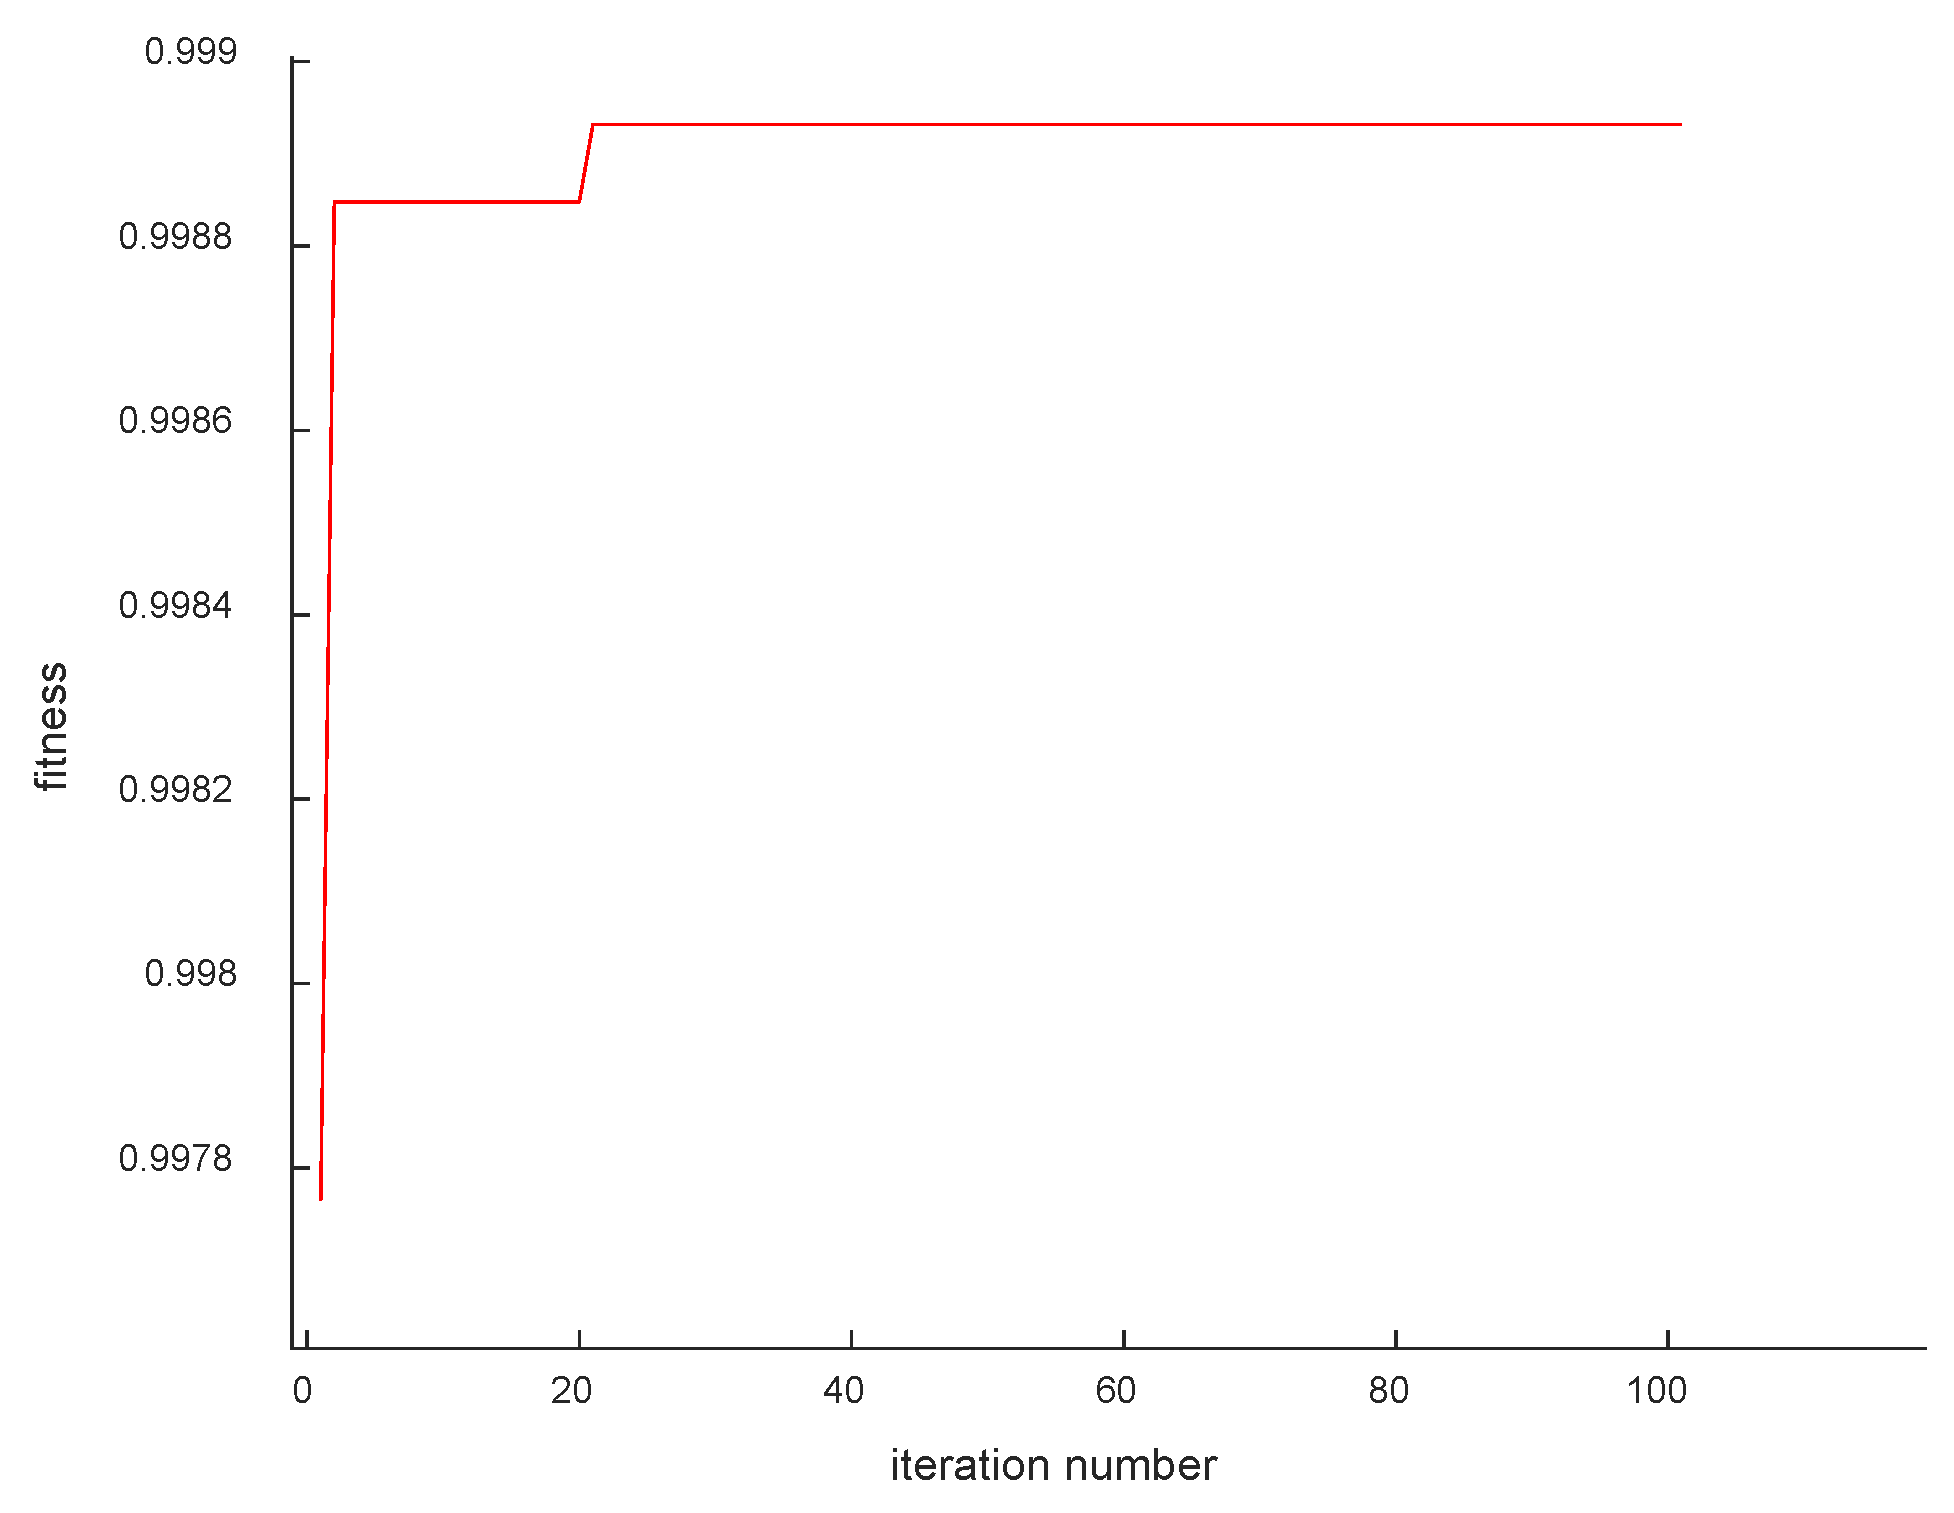
The optimized adaptation curve is obtained using the e-GA model, as shown in Figure 12. A total of 168 cycles of the B0005 cell correlation optimal correlation correspond to the interval of equal pressure drop ranging from 3.65 V to 3.45 V, and the optimal individual adaptation is 0.9989, which improves the correlation coefficient by 0.0027 compared to the interval of 3.8 V–3.5 V. Also, the measurement time is reduced by about 200 s according to the comparative test.

4. PSO-LSTM Network Model

Although the LSTM network can be used to solve the long-term dependence problem that RNN cannot handle, the introduction of the gate structure increases the number of hyperparameters. If the selection of hyperparameters is unreasonable, the accuracy of prediction will be insufficient. Therefore, PSO is used to optimize the hyperparameters of the LSTM network and to build a PSO-LSTM lithium-ion capacity prediction model. Considering the training time of the neural network and the need for the PSO algorithm to repeatedly obtain the error of the verification set as the fitness value, the LSTM network with a single-layer structure is selected. Thus, there are three hyperparameters to be configured: learning rate ε , training times k and hidden layer neuron number L 1 . The structure of the PSO-LSTM algorithm model is shown in Figure 13. The three hyperparameters of LSTM are used as the parameters to be optimized for PSO, and the fitness function is the mean absolute percentage error (MAPE) outputted by the model, as shown in Equation (17):
F ( X ) = min ( M A P E )
where MAPE is calculated as shown in (18).
M A P E = 1 n i = 1 n y n ^ y n y n
where y n is the actual value of the remaining capacity, y n ^ is the predicted value of the remaining capacity, and n denotes the number of predicted load points.
The combined model algorithm process is as follows:
Step 1: Data processing, where the battery degradation data is obtained from the NASA Li-ion battery data set, with the B0005 battery data divided into training set, validation set, and test set at a ratio of 6:1:3. Specifically, the first 100 cycles comprise the training set data, cycles 101 to 118 comprise the validation set, and cycles 119 to 168 comprise the test set. The health indicators ( R 1 , C 1 , R 01 , T A B ), as described in the previous section, are extracted and normalized.
Step 2: Optimization of the LSTM hyperparameters through PSO.
(1) With the learning rate, the number of training times, and the number of neurons in the hidden layer in the LSTM model as the optimization objects, their search ranges are determined. Based on the actual training volume and experience, the learning rate range of the solvable space is selected as [0,0.2], the range for the number of neurons in the hidden layer is [1,50], and the range of training time is [100,500]
(2) The PSO parameters are initialized, with the particle dimension set as 20, the population set as 100, the minimum value of particle velocity V m i n = [0.001,1,10], the maximum value V m a x = [0.05,10,50], the number of iterations M = 100, the learning factor is c 1 = c 2 = 1.2 , and the inertia weight is w = 0.8, taking into account the variation of neural network hyperparameters, randomly generated search point velocity and position in the search range and position, where the randomly generated particle position is a multiple of V m i n .
(3) The fitness value of PSO is calculated. The fitness value of each particle is calculated, the LSTM model is constructed with the corresponding parameters of each particle, the LSTM model is built using the training set, the verification set data are predicted, and the error of the verification set prediction result is calculated as the fitness value of each particle. The fitness formula is shown in Equation (17), and the particle individual extremum p b e s t and global extremum g b e s t are updated.
(4) Position and speed are updated. The search speed and position of hyperparameters are updated according to Equations (7) and (8). In order to prevent the particles from exceeding the search range and jumping out of the solution space at the time of search, it is replaced with the boundary value if the speed exceeds the boundary.
(5) It is judged whether the algorithm meets the criterion of termination. If this criterion is met, the population history optimal solution is ended and outputted; otherwise, we return to step 3.
Step 3: Model training, with the global optimal parameters searched in step 2 configured into the LSTM network model. Besides, four health indicators obtained from the first 118 cycles are used as input for model training, so as to obtain the PSO-LSTM battery capacity prediction model.
Step 4: Model testing, with the standardized data of the health indicator of the 50 cycles inputted into the prediction model after the test set to obtain the capacity prediction results.

5. Example Results and Analysis

5.1. Experimental Data and Pre-Processing

The experiments conducted in this paper will use the lithium-ion battery data set published by NASA PCoE, and select the B0005 and B0018 battery data describing constant current charge and discharge cycles at room temperature. The experimental equipment of NASA PCoE mainly includes commercial 18,650 lithium-ion batteries, programmable four-channel DC electronic load, programmable four-channel DC power supply, voltmeter, ammeter, thermocouple sensor kit, custom EIS equipment, thermostat, PXI chassis-based data collection and test console, and MATLAB-based test control. The positive electrode material of the 18,650 lithium-ion battery is potassium cobaltate, the negative electrode material is graphite, and the main material of the electrolyte is potassium hexafluorophosphate. The preparation method of the electrode is as follows: the active material phosphoric acid lithium iron, conductive agent, and binder are uniformly mixed in a certain proportion to make a slurry which is evenly coated on the current-collector, and the electrode sheet is obtained after drying, rolling, and shearing. Table 3 shows an overview of properties of the electrodes and separator built into 18,650 cells [38].
The battery cycle experiment of NASA PCoE is detailed as follows:
(1) Charge the battery with a constant current of 1.5 A until the voltage of the battery rises to 4.2 V, then switch to constant voltage charging, and end the charging phase when the current drops to 20 mA.
(2) Put the battery aside, conduct EIS impedance measurement during the period, and measure the internal resistance parameters of the battery with an electrochemical impedance tester at a frequency of 0.1 HZ~5 Hz.
(3) Discharge the battery with a current of 2 A, and end the discharge stage after the battery discharge cut-off voltage is reached. The discharge cut-off voltage of B0005 is 2.7 V, the electrical cut-off voltage of B1008 is 2.5 V, and the discharge cut-off voltage is 2.5 V.
(4) Put the battery on hold, and perform the EIS impedance measurement at the same time.
The above steps are repeated until the actual capacity of the battery drops to 70% of the rated capacity, from 2 Ah to below 1.4 Ah. In the experiment, B5 obtained a total of 168 sets of experimental data, and B1008 obtained 132 sets of data.
Since the two batteries belong to the same model and are charged and discharged at a constant current, the SOH prediction model trained by the B0005 battery data is applied to the B0018 battery with different cut-off voltages, thereby verifying the accuracy and generalization of the model.
According to the discharge data of 132 cycles of B0018, the proposed HI selection strategy and method, the voltage curves of the post-discharge stage and the initial discharge stage, as well as curve fitting and parameter identification, the four health factor curves shown in Figure 14 are obtained. Figure 14a shows a CAB of 3.65–3.45 V. The discharge range is selected using e-GA for optimization, and the discharge amount obtained by multiplying TAB and the discharge current is CAB. Figure 14b shows the results of initial internal resistance identification. By correcting the discharge curve, the position of the end point of the ohmic polarization phase is obtained. Then, the corresponding discharge initial internal resistance value R01 can be obtained through the ratio of the voltage difference between the start and end points of the ohmic polarization phase and the discharge current. Figure 14c,d shows the polarization resistance and polarization capacitance. The time-domain expression of the discharge process is obtained through the analysis of the equivalent circuit, and the curve fitting is carried out in combination with the discharge curve of the external characteristics of the lithium battery, that is, the terminal voltage. Also, parameter identification is performed to obtain polarization resistance and polarization capacitance.
Based on the discharge data of 132 cycles of B0018, the proposed HI selection strategy and method, the voltage curves of the post-discharge stage and the initial discharge stage, as well as curve fitting and parameter identification, four health indicator curves as shown in Figure 14 are obtained.
It is also necessary to normalize the four health indicators extracted through the above process, and the normalization equation is expressed as follows:
x = x x min x max x min
where x is the normalized value, x is the data value, x m i n is the minimum value of the data, and x m a x is the maximum value of the data.

5.2. Experimental Results and Analysis

5.2.1. Model Evaluation Indicators

To evaluate the accuracy of the Li-ion battery SOH prediction model based on the extraction of multidimensional health indicators, the mean absolute percentage error and mean-square error (MSE) are used to assess the prediction effect of the model, and the MAPE and MSE are calculated, as shown in Equations (18) and (20).
M S E = 1 n i = 1 n ( y ^ n y n ) 2
where n indicates the length of the test sample, y n denotes the true value and y n ^ denotes the predicted value. 𝑀𝐴𝑃𝐸 and 𝑀S𝐸 have smaller values, indicating that the model performs better in prediction.

5.2.2. Analysis of Results

Since the LSTM used in this paper is an improved neural network, the BP neural network model is introduced for comparison. The basic idea of the BP algorithm is as follows. The learning process consists of two steps: the forward propagation of the signal and the reverse propagation of the error. The error output is calculated in the direction from input to output, and the weight and threshold are adjusted from the output-to-input direction. The PSO-BP model optimizes the BP neural network for the PSO algorithm, and selects the optimal hyperparameters. However, based on the modification to the weight principle based on the error gradient descent, the result inevitably suffers problems such as local minima, slow convergence speed, and shocks. Consequently, there are certain defects in the prediction of the remaining capacity of the battery. As an effective method of time series analysis, LSTM produces a better effect in the prediction of remaining capacity.
The cyclic charge/discharge data of two types of batteries are extracted from the NASA dataset, while single health indicator ( T A B ), multiple health indicators ( R 1 , C 1 , R 01 , T A B ) and optimized multiple health indicators ( R 1 , C 1 , R 01 , T A B ) are selected as model inputs. Then, two algorithm models, PSO-BP and PSO-LSTM, are built for comparison.
Among them, the unoptimized T A B voltage drop range is 3.8–3.5 V, and the optimized T A B voltage drop range is 3.65–3.45 V. The amount of charge and discharge data of NASA lithium batteries is small. The B0005 lithium battery contains 168 charging cycles. The first 100 cycles are used as the training set, and the last 68 cycles are used as the test set. While B0018 contains only 132 charging cycles, with the first 80 cycles used as the training set and the last 52 cycles used as the test set. The SOH prediction results of the 18,650 Li-ion battery for B0005 and B0018 are shown in Figure 15, Figure 16 and Figure 17.
According to Figure 15, Figure 16 and Figure 17, the prediction results obtained from the multidimensional health index combined with the PSO-LSTM algorithm model as proposed in this paper are more accurate than the other five groups of comparative experiments, and the prediction results almost match the actual results. Among them, the black solid line indicates the actual capacity of the battery, and the blue dashed line indicates the prediction result of the model, together with the number of cycles. Also, the single health indicator prediction shows a trend of degradation with the increase of training times. Table 4 and Table 5 show that, overall, the prediction effect of the LSTM network is better than that of the BP network, while in the same network, the optimized multi-HI strategy has the best prediction effect. Also, the multi-HI strategy with fixed pressure drop fragment T A B and the single-HI strategy perform slightly worse in prediction. The prediction model achieves a 99.76% accuracy in B0005 with high precision, and the model achieves a 98.65% accuracy in B0018 with good generalization ability.
The method as studied in this paper compares other health factors combined with data-driven SOH prediction methods. The comparison of prediction models is shown in Table 6. According to the comparison of prediction result errors of multi-dimensional health factors combined with PSO-LSTM algorithm in Table 4, the estimated error based on GWO-LSTM algorithm is 1.86%, the estimated error based on EKF-GPR algorithm is 0.26%, and the error based on GA-SVR algorithm is 0.71%. The prediction error based on Elman algorithm is 0.89%, and the error based on CNN-LSTM algorithm is 0.33%. It can be concluded that the multidimensional health factor combined with PSO-LSTM method has higher accuracy and better effect.

6. Conclusions

To address the problems like the insufficient fitting of a single health indicator and the difficulty in online measurement of a battery’s internal resistance, this paper proposes a method to extract multidimensional health indexes based on constant current discharge characteristics. Firstly, polarization resistance and capacitance are extracted based on the least squares method for discharge curve parameter identification. Secondly, initial discharge resistance is extracted by correcting the discharge curve, and then the equal voltage drop time series is taken as an indirect health indicator by e-GA. Finally, the e-GA is used as the indirect health indicator to optimize the time series, and a combined PSO-LSTM neural network SOH prediction model is established based on the extracted health indicators.
The experimental results show that the optimized multidimensional health indicator represents an improvement of 0.79% compared with the single health indicator in the prediction of the SOH prediction model, as established for the PSO-LSTM neural network. In addition, for the B0005 lithium-ion battery, the accuracy of the PSO-LSTM model as established based on the extraction of multidimensional health indexes for constant current conditions reaches 99.76%, and the mean square error is 0.0000147, which verifies that the model has high accuracy and is more accurate for the B0018 battery.

Author Contributions

Conceptualization, Z.Y.; methodology, R.L.; writing—original draft preparation, N.L.; writing—review and editing, N.L.; supervision, Y.Z. and L.Q.; funding acquisition, R.L. All authors have read and agreed to the published version of the manuscript.

Funding

This work was supported by the Joint Fund Project of the Ministry of Education of China (No. 8091B022133), the Natural Science Foundation of Heilongjiang Province, China (No. LH2022E08)”.

Data Availability Statement

The data that support the findings of this study are available from the corresponding author upon reasonable request.

Conflicts of Interest

The authors declare no conflict of interest.

References

  1. Bruno, S.; Jürgen, C. Lithium batteries: Status, prospects and future. J. Power Sources 2010, 195, 2419–2430. [Google Scholar]
  2. Liu, D.T.; Song, Y.C.; Wu, W.; Yang, C.; Peng, Y. Review of estimation of state of health of lithium-ion battery packs. Chin. J. Sci. Inst. 2020, 41, 1–18. [Google Scholar]
  3. Tian, H.X.; Qin, P.L.; Li, K.; Zhao, Z. A review of the state of health for lithium-ion batteries: Research status and suggestions. J. Clean. Prod. 2020, 261, 120813. [Google Scholar] [CrossRef]
  4. Ding, X.; Xue, J.H.; Chen, Z.Y.; Ma, Q. Research on performance decline and capacity prediction model of lithium iron phosphate battery. Chin. J. Power Sources 2019, 43, 1013–1016. [Google Scholar]
  5. Liu, F.; Shao, C.; Su, W.X.; Liu, Y. Online joint estimator of key states for battery based on a new equivalent circuit model. Journal of Energy Storage. J. Energy Storage 2022, 52, 104780. [Google Scholar] [CrossRef]
  6. Bian, X.L.; Liu, L.C.; Yan, J.Y.; Zou, Z.; Zhao, R.K. Online joint estimator of key states for battery based on a new equivalent circuit model. J. Power Sources 2020, 448, 227401. [Google Scholar] [CrossRef]
  7. Xiong, R.; Tian, J.P.; Mu, H.; Wang, C. A systematic model-based degradation behavior recognition and health monitoring method for lithium-ion batteries. Appl. Energy 2017, 207, 372–383. [Google Scholar] [CrossRef]
  8. Shen, S.; Sadoughi, M.; Li, M.; Wang, Z.D.; Hu, C. Deep convolutional neural networks with ensemble learning and transfer learning for capacity estimation of lithium-ion batteries. Appl. Energy 2020, 260, 114296. [Google Scholar] [CrossRef]
  9. Shu, X.; Li, G.; Shen, J.; Lei, Z. A uniform estimation framework for state of health of lithium-ion batteries considering feature extraction and parameters optimization. Energy 2020, 204, 117957. [Google Scholar] [CrossRef]
  10. Zenati, A.; Desprez, P.; Razik, H.; Rael, S. A Methodology to Assess the State of Health of Lithium-Ion Batteries Based on the Battery’s Parameters and a Fuzzy Logic System. In Proceedings of the 2012 IEEE International Electric Vehicle Conference, Greenville, SC, USA, 4–8 March 2012. [Google Scholar]
  11. Chen, Z.; Sun, M.; Shu, X.; Xiao, R.; Shen, J. Online state of health estimation for lithium-ion batteries based on support vector machine. Appl. Sci. 2018, 8, 925. [Google Scholar] [CrossRef] [Green Version]
  12. Deng, Y.W.; Ying, H.J.; Er, J.Q.; Zhu, H.; Wei, K.X.; Chen, J.W.; Zhang, F.; Liao, G.L. Feature parameter extraction and intelligent estimation of the State-of-Health of lithium-ion batteries. Energy 2019, 176, 91–102. [Google Scholar] [CrossRef]
  13. Yu, J. State of health prediction of lithium-ion batteries: Multiscale logic regression and Gaussian process regression ensemble. Reliab. Eng. Syst. Saf. 2018, 174, 82–95. [Google Scholar] [CrossRef]
  14. Richardson, R.R.; Osborne, M.A.; Howey, D.A. Gaussian process regression for forecasting battery state of health. J. Power Sources 2017, 357, 209–219. [Google Scholar] [CrossRef]
  15. Wang, P.; Fan, L.F.; Cheng, Z.; Cheng, Z. A Joint State of Health and Remaining Useful Life Estimation Approach for Lithium-ion Batteries Based on Health Factor Parameter. Proc. IEEE Inst. Electr. Electron. Eng. 2022, 42, 1523–1534. [Google Scholar]
  16. Song, Y.C.; Liu, D.T.; Hou, Y.D.; Yu, J.X.; Peng, Y. Satellite Lithium-Ion Battery Remaining Useful Life Estimation with An Iterative Updated RVM Fused with the KF Algorithm. Chin. J. Aeronaut. 2015, 31, 31–40. [Google Scholar] [CrossRef]
  17. Hu, X.; Che, Y.; Lin, X.; Onori, S. Battery Health Prediction Using Fusion-Based Feature Selection and Machine Learning. IEEE Trans. Transp. Electrif. 2021, 7, 382–398. [Google Scholar] [CrossRef]
  18. Li, H.; Pan, D.; Chen, C.L.P. Intelligent prognostics for battery health monitoring using the mean entropy and relevance vector machine. IEEE Trans. Intell. Transp. Syst. 2014, 44, 851–862. [Google Scholar] [CrossRef]
  19. Khumprom, P.; Yodo, N. A Data-Driven Predictive Prognostic Model for Lithium-ion Batteries based on a Deep Learning Algorithm. Energy. 2019, 12, 660. [Google Scholar] [CrossRef] [Green Version]
  20. Ren, L.; Dong, J.B.; Wang, X.K.; Meng, Z.H.; Zhao, L.; Deen, M.J. A data-driven auto-cnn-lstm prediction model for lithium-ion battery remaining useful life. Int. J. Elec. Power 2020, 17, 3478–3487. [Google Scholar] [CrossRef]
  21. Chu, Y.; Chen, Y.F.; Mi, Y. A CNN-LSTM lithium battery health state estimation based on attention mechanism. J. Power Sources 2022, 46, 634–637+651. [Google Scholar]
  22. Wei, J.W.; Dong, G.Z.; Chen, Z.H. Remaining useful life prediction and state of health diagnosis for lithium-ion batteries using particle filter and support vector regression. IEEE Trans. Ind. Electron. 2017, 65, 5634–5643. [Google Scholar] [CrossRef]
  23. Hu, X.S.; Jiang, J.C.; Cao, D.P.; Egardt, B. Battery health prognosis for electric vehicles using sample entropy and sparse Bayesian predictive modeling. IEEE Trans. Ind. Electron. 2015, 63, 2645–2656. [Google Scholar] [CrossRef]
  24. Huang, Y.S.; Qin, L.L.; Wu, G. State of Health Estimation Based on Constant Current Charging Profiles. In Proceedings of the 2021 40th Chinese Control Conference (CCC), Shanghai, China, 26–28 July 2021. [Google Scholar]
  25. Li, X.; Wang, Z.; Yan, J.; Egardt, B. Prognostic health condition for lithium battery using the partial incremental capacity and Gaussian process regression. J. Power Sources 2019, 421, 56–67. [Google Scholar] [CrossRef]
  26. Zhang, Y.; Guo, B. Online capacity estimation of lithium-ion batteries based on novel feature extraction and adaptive multi-kernel relevance vector machine. Energies 2015, 8, 12439–12457. [Google Scholar] [CrossRef] [Green Version]
  27. Tian, J.P.; Xiong, R.; Shen, W.X. State-of-health estimation based on differential temperature for lithium ion batteries. Energies 2015, 8, 12439–12457. [Google Scholar] [CrossRef]
  28. Guo, B.J.; Li, J.Q.; Ma, X.L.; Wang, F. Capacity estimation of power lithium-ion battery based on deep learning. Batteries 2022, 52, 517–521. [Google Scholar]
  29. Yin, C.J.; Wang, Y.N.; Li, P.F.; Xiao, D.; Zhao, Q. Joint online estimation of SOC and SOH of energy storage battery based on LSTM. J. Power Sources 2022, 46, 541–544. [Google Scholar]
  30. Zhang, Y.Z.; Xiong, R.; He, H.W.; Wang, M.G. Long short-term memory recurrent neural network for remaining useful life prediction of lithium-ion batteries. IEEE Trans. Veh. Technol. 2018, 67, 5695–5705. [Google Scholar] [CrossRef]
  31. Yu, Z.H.; Xiao, L.J.; Li, H.Y.; Zhu, X.L.; Huai, R.T. Model parameter identification for lithium batteries using the coevolutionary particle swarm optimization method. IEEE Trans. Ind. Electron. 2017, 64, 5690–5700. [Google Scholar] [CrossRef]
  32. Chen, Y.S. State of Charge Estimation of Lithium Iron Phosphate Power Battery Cells. Master’s Thesis, University of Science and Technology of China, Hefei, China, 24 May 2021. [Google Scholar]
  33. He, H.W.; Xiong, R.; Guo, H.Q.; Li, S.C. Comparison study on the battery models used for the energy management of batteries in electric vehicles. Energy Convers. Manag. 2012, 64, 113–121. [Google Scholar] [CrossRef]
  34. Li, Y.; Zhu, H.; Zhu, J.; Zheng, J.; Chen, Y. A Multivariate Regression Method for Battery Remaining Capacity Based on Model Parameter Identification. In Proceedings of the 2021 3rd International Academic Exchange Conference on Science and Technology Innovation (IAECST), Guangzhou, China, 10–12 December 2021. [Google Scholar]
  35. Sun, T.; Gong, G.Q.; Chen, Y. Lithium battery Simscape model analysis based on parameter identification. J. Power Sources 2019, 43, 1316–1318+1362. [Google Scholar]
  36. Huang, W.N.; Song, Y.F.; Zhang, W.G.; Chen, A.C.; Ding, P.R. A Thermal Co-simulation Framework Based on Temperature Correction for Lithium-ion Battery. Proc. CSEE 2020, 60, 4013–4024. [Google Scholar]
  37. Pang, J.Y.; Ma, Y.T.; Liu, D.T.; Peng, Y. Indirect prediction method of remaining life of lithium-ion battery. Sci. China Technol. SC 2014, 9, 28–36. [Google Scholar]
  38. Waldmann, T.; Scurtu, R.G.; Richter, K.; Margret, W.M. 18650 vs. 21700 Li-ion cells–A direct comparison of electrochemical, thermal, and geometrical properties. J. Power Sources 2020, 472, 228614. [Google Scholar] [CrossRef]
  39. Shi, M.Z. Research on Lithium-ion Battery Remaining Useful Life Prediction Method Based on Improved LSTM Network. Master’s Thesis, Shaanxi University of Science and Technology, Xi’an, China, May 2021. [Google Scholar]
  40. He, Y.J.; Shen, J.N.; Shen, J.F.; Ma, Z.F. State of Health Estimation of Lithium-Ion Batteries: A Multiscale Gaussian Process Regression Modeling Approach. AIChE J. 2015, 61, 1589–1600. [Google Scholar] [CrossRef]
  41. Liu, H.; Hu, M.X.; Zhu, Y.H.; Yu, D.J. Prediction for state of health of lithium-ion batteries by genetic algorithm and support vector regression. J. Nanjing Univ. Sci. Technol. 2018, 42, 329–334+351. [Google Scholar]
  42. Li, L.B.; Zhu, Y.Z.; Tian, Y.J.; An, Z.T.; Wang, L.L. RUL indirect prediction of lithium-ion battery based on Elman neural network. J. Power Sources 2019, 43, 1027–1031. [Google Scholar]
  43. Chen, C.Y.; Chen, D.W. Research on indirect prediction of lithium battery RUL based on CNN-LSTM. J. Power Sources 2021, 45, 589–594. [Google Scholar]
Figure 1. LSTM structure diagram.
Batteries 09 00080 g001
Figure 2. Equivalent circuit model.
Batteries 09 00080 g002
Figure 3. Variation curve of terminal voltage discharge process.
Batteries 09 00080 g003
Figure 4. Rising voltage curve of each cycle.
Batteries 09 00080 g004
Figure 5. Fitting the recovery curve to find the d point.
Batteries 09 00080 g005
Figure 6. Rising voltage curve of each cyclic polarization reaction.
Batteries 09 00080 g006
Figure 7. Results of parameter identification of polarization response curve. (a) All loops; (b) Partial loop.
Batteries 09 00080 g007
Figure 8. Polarization identification results. (a) Polarization resistance vs. cycle number; (b) Polarization capacitance vs. cycle number.
Batteries 09 00080 g008
Figure 9. Position of point b in discharge curve.
Batteries 09 00080 g009
Figure 10. Curve of the relationship between R 01 and cycle times.
Batteries 09 00080 g010
Figure 11. C A B and battery capacity comparison curve.
Batteries 09 00080 g011
Figure 12. Optimization process of e-GA algorithm.
Batteries 09 00080 g012
Figure 13. PSO-LSTM algorithm model.
Batteries 09 00080 g013
Figure 14. Four HIs of B0018 battery (a) CAB (3.65–3.45); (b) Initial internal resistance identification results; (c) Polarization resistance identification results; (d) Polarized capacitance identification results.
Batteries 09 00080 g014
Figure 15. Prediction results of three HI strategies in the PSO-BP network. (a) Single health indicator; (b) Multiple health indicator; (c) Optimized multi-health indicator.
Batteries 09 00080 g015
Figure 16. Prediction results of three HI strategies in the PSO-LSTM network. (a) Single health indicator; (b) Multiple health indicator; (c) Optimized multi-health indicator.
Batteries 09 00080 g016
Figure 17. SOH prediction results of the B0018 battery.
Batteries 09 00080 g017
Table 1. The correlation between different health indicators and capacity.
First-Order RC ModelSecond-Order RC Model
MAEV0.000340.00033
RMSEV0.000590.00057
MAEOCV0.021760.02728
RMSEOCV0.042580.07310
Table 2. The correlation between different health indicators and capacity.
SequenceCorrelation Coefficient
R 01 0.4101
R 1 0.2561
C 1 −0.3071
T A B (3.8–3.5 V)0.9962
T A B (3.5–3.2 V)−0.6221
T A B (3.0–2.7 V)−0.9833
Table 3. Overview of properties of the electrodes and separator built into 18,650 cells.
AnodeCathode
Active materialgraphiteLiXNi0.33Co0.33O2
Electrode thicknesses (double side coat)126 µm125 µm
Current collector foil thicknesses10 µm (Cu)20 µm (Al)
Areal capacity5.00 m Ah/cm24.12 m Ah/cm2
N/P 1.21
Separator thickness 16 µm
Table 4. Hyperparameter configuration results and error table.
AlgorithmHI Selection StrategyNumber of TrainingsNumber of NeuronsLearning RateMSE
(e-05)
MAPE
(%)
PSO--BPSingle health indicator390490.0444.59801.558756
Multiple health indicator200340.0843.68701.535629
Optimized multi-health indicator170180.1420.89900.993734
PSO-LSTMSingle health indicator320120.1825.85901.024413
Multiple health indicator300200.208.572370.636016
Optimized multi-health indicator470500.171.474690.231071
Table 5. SOH prediction error analysis of the B0018 battery.
Battery Serial NumberMSE (e-05)MAPE (%)
B001867.8461.35178
Table 6. Prediction effect of SOH model established by other models.
Network Models Built in the LiteratureHI Selection StrategyMAPE (%)
GWO-LSTM [39]Battery capacity for the previous cycle1.86
EKF-GPR [40]Fragment charging time0.26
GA-SVR [41]Average discharge voltage and average temperature 0.71
Elman [42]TAB (3.7–3.5 V)0.89
CNN-LSTM [43]TAB (3.8–3.5 V)0.33
Disclaimer/Publisher’s Note: The statements, opinions and data contained in all publications are solely those of the individual author(s) and contributor(s) and not of MDPI and/or the editor(s). MDPI and/or the editor(s) disclaim responsibility for any injury to people or property resulting from any ideas, methods, instructions or products referred to in the content.

