Article

Influence of Switching on the Aging of High Energy Lithium-Ion Cells

Technische Hochschule Ingolstadt, Research Group Electromobility and Learning Systems, D-85049 Ingolstadt, Germany
*
Author to whom correspondence should be addressed.
Batteries 2023, 9(2), 139; https://doi.org/10.3390/batteries9020139
Submission received: 6 January 2023 / Revised: 11 February 2023 / Accepted: 14 February 2023 / Published: 17 February 2023
(This article belongs to the Section Battery Performance, Ageing, Reliability and Safety)

Abstract

:
An AC-battery or multilevel inverter used to increase safety and flexibility is realizable by switching the cells and modules on and off in a defined way and thus can replace the bidirectional converter. Assessing possible additional aging due to switching, the results of a previous study for a high-power optimized cell showed no influence on the current rates or the switching. In this paper, a highly energy-optimized LG 18650-cell is investigated to discuss the influence of switching during the charge and discharge process, respectively, as well as combining both processes together with clear performance differences when applying higher charge and discharge currents. Moreover, the influence of switching is discussed for the two frequencies (50 Hz and 10 kHz) and different duty cycles. The aging is analyzed by capacity loss and resistance increase, by dV/dQ analysis, and by electrochemical impedance spectroscopy. We found no clear negative influence of switching but a positive effect if the cells are switched during charge. The best performance is found for switching during charge as well as during discharge. The cell aging during switching is clearly determined by the average and not the maximum current applied. This work shows no negative effects of multilevel inverter applications on the tested cells.

1. Introduction

Multilevel inverters (MLI) become more and more important in the field of batteries. With MLI, an improved signal quality of the voltage output is achievable compared with state-of-the-art 2-level inverters, which enable bidirectional charging. Especially the low efficiency of inverters used in partial-load situations can be improved by MLI [1,2]. Furthermore, the presence of switches makes the battery more flexible by switching-off critical cells with respect to safety and enables charging at any charge point, independent of charge strategy and applied voltage [3,4].
During use of an MLI in a battery application, the cells in the battery need to be modulating varying frequencies, duty cycles, and current rates over time [5]. The findings of other researchers regarding modulation-induced aging showed up until now contradictory results. Uno et al. [6] investigated 24 2Ah LiCoO2/Graphite high-energy cells with a square wave current profile with an amplitude of ±1 A and varying the frequency from 0.001 to 100 kHz. They obtained no impact if the pulsing frequency was above 10 Hz, as at higher frequencies, microcycles are omitted. Chang et al. [7] tested several 3-Ah-NMC/Graphite cells optimized for high energy at switching frequencies of 2 and 10 kHz and measured no additional aging considering resistance and only a small increase in capacity loss of 1–2% until end of life. Qin et al. [8] published a review starting with basic Li-metal deposition and ending with real-world applications to stabilize the grid or achieve fast charging but failed to include reference tests to assess positive or negative effects.
Considering similar applications and phenomena such as the influence of current ripples and fast charging pulsing in the kHz range, the findings are very contradictory, showing negative [9], no significant [10], or positive [11] effects on aging, with unfortunately very poor information about the capabilities of the cells with respect to their power. Korth Pereira Ferraz et al. [12] found dependence of depth-of-discharge (DOD) with an impact on cell aging for a lower DOD for a cell that is optimized for high energy. The influence of the modulation on the cells was investigated by ourselves in a previous publication [13]. In this publication, we investigated a high-power optimized NCA/Graphite 18650 cell for the influence of switching during charge, discharge, and charge/discharge for two frequencies and compared the results with reference tests varying the current magnitude. The aging of the cells was independent of the level of charge and discharge current during tests and showed no impact of switching compared with the reference cells. Thus, a comprehensive understanding of the impact of pulsing and quick current changes is still lacking, and we will fill the scientific gap by testing the influence of switching, especially for a high-energy cell, including well-designed reference tests.
In this paper, the influence of switching is analyzed using a high-energy optimized cell, as this is closer to the reality of mobile applications where the energy density is increased as much as possible and, furthermore, a higher sensitivity to the magnitude of charge and discharge current is achieved. To be able to compare the results of high-power and high-energy cells, the test conditions are kept the same as in our previous paper [13], and only the C-rates of the high-energy cells are adapted due to datasheet limitations.
The paper is organized, starting with discussing the temperature impact in Section 3.1. Section 3.2 presents the reference test results for varying magnitudes of charge and discharge currents. The reference tests are compared in the next step to the results obtained from switching during charge, discharge, and charge/discharge at a frequency of 50 Hz in Section 3.3 by analyzing capacity, pulse resistance, dV/dQ analysis, and electrochemical impedance spectroscopy. The obtained results are finally compared with switching tests at 10 kHz in Section 3.3, with additional tests to assess the impact of duty cycle.

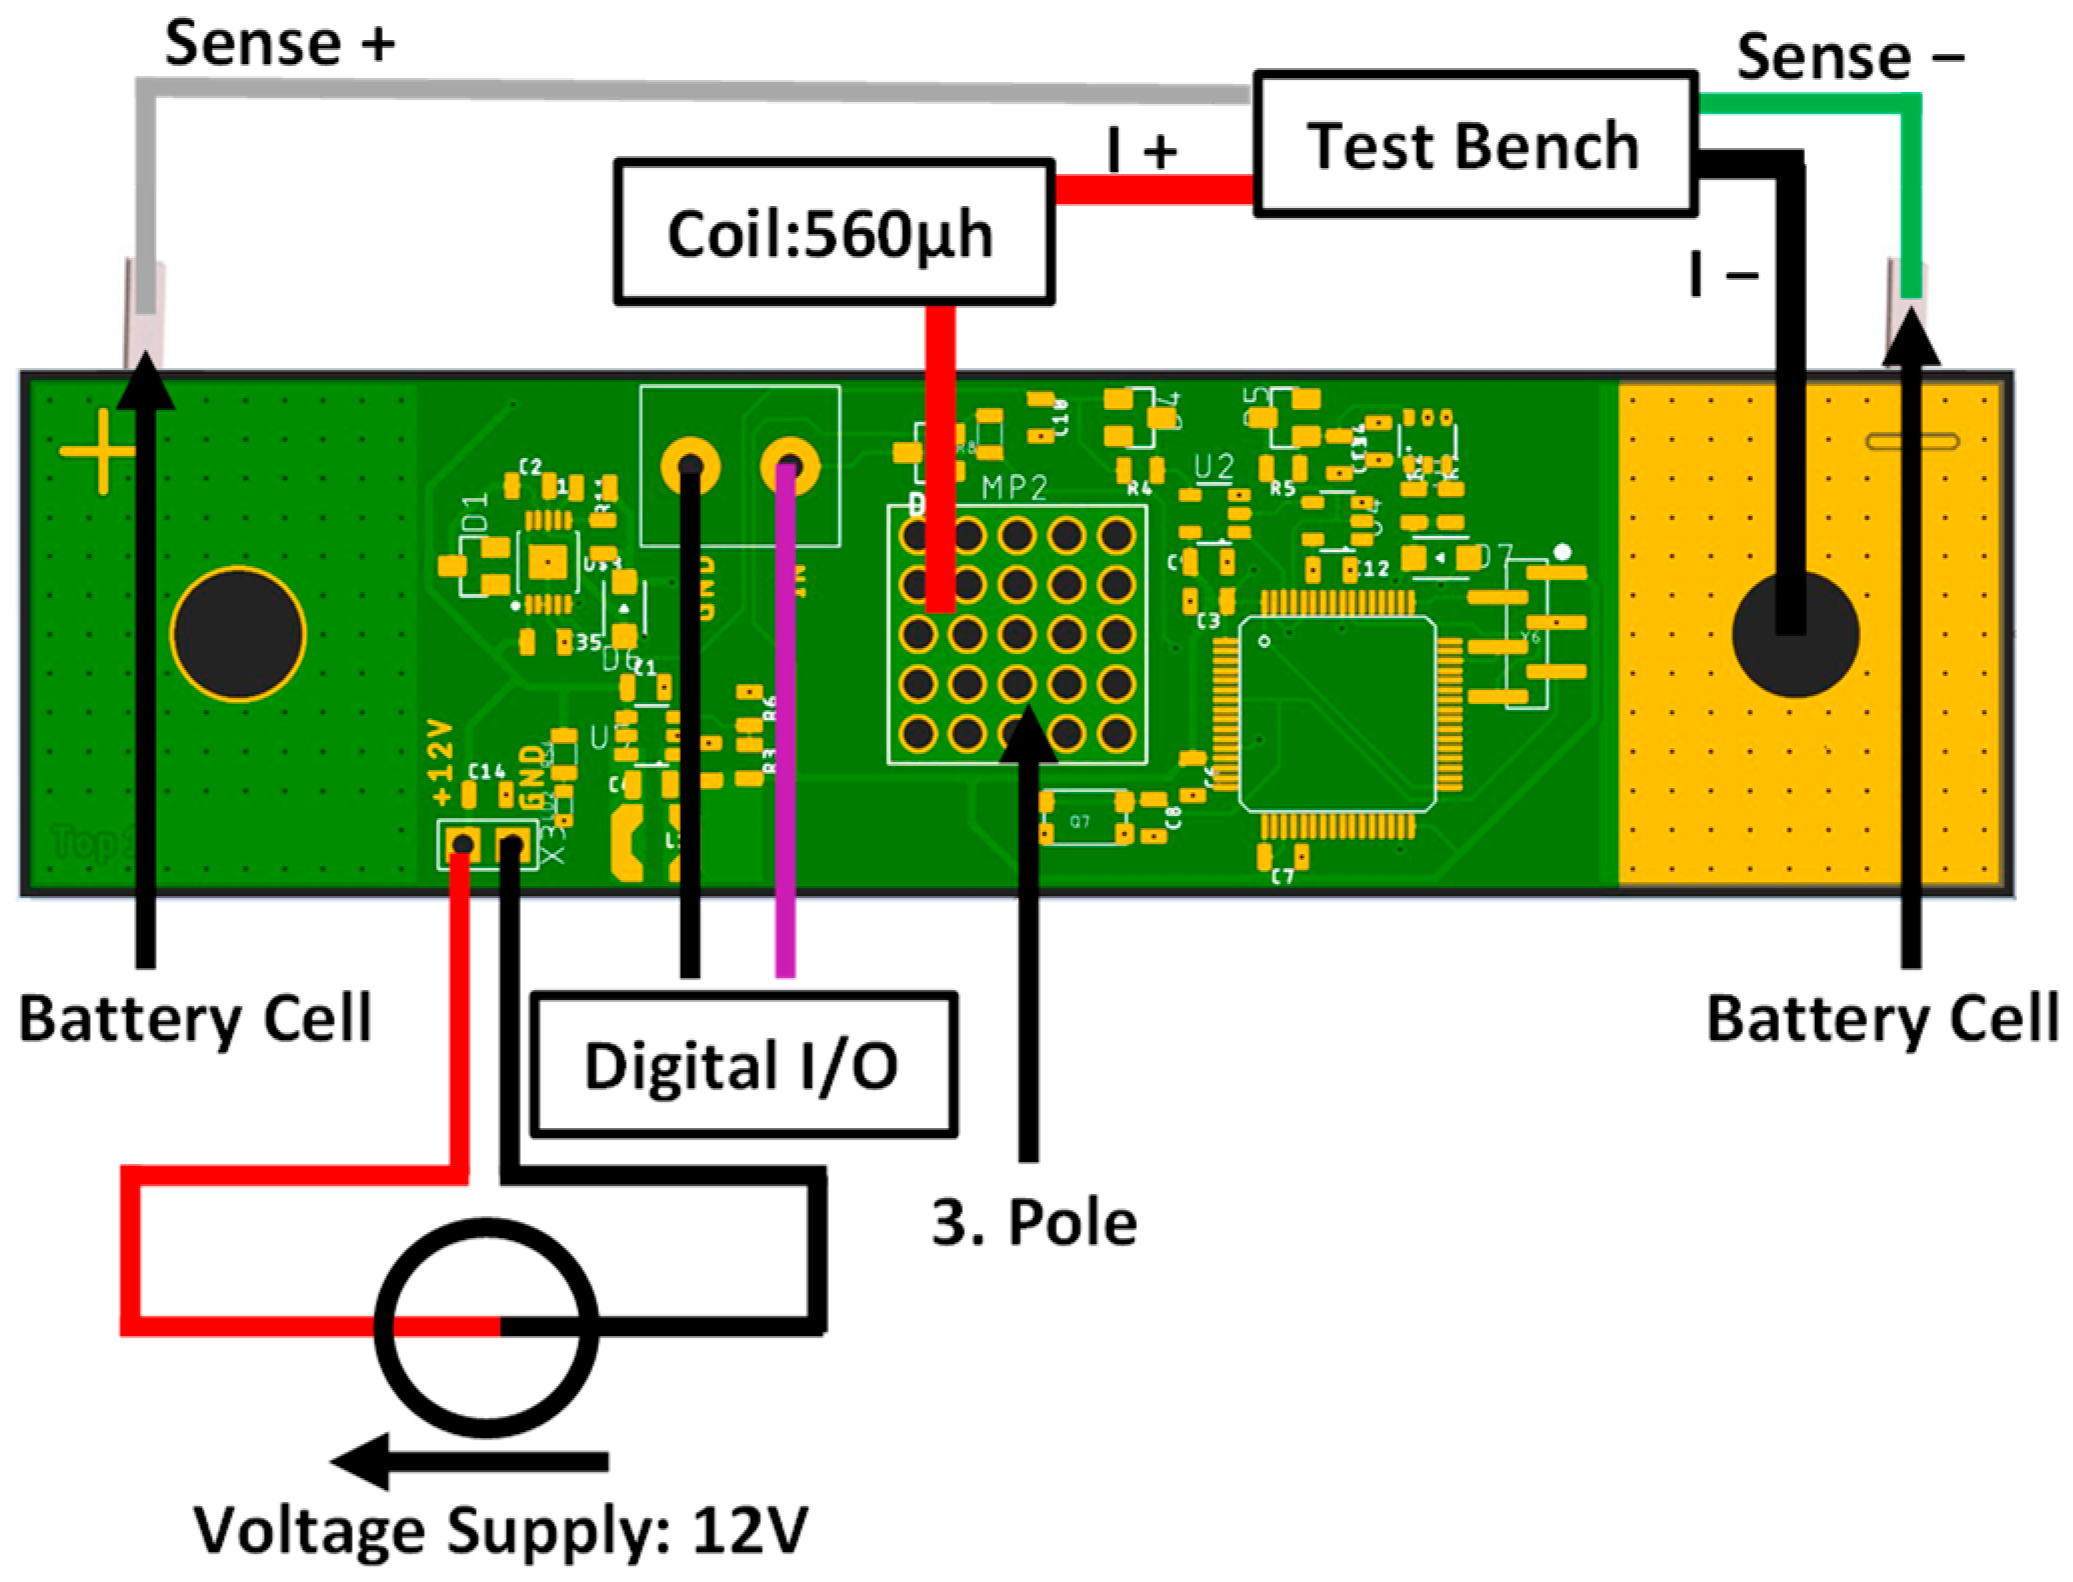
2. Materials and Methods

For this test campaign, 43 cylindrical 18650 cells of the type LG INR18650 MJ1 with a Ni-rich cathode and Si-graphite anode are investigated. The specifications are given in Table 1. This cell type was already examined by, e.g., Sturm et al. [14] and Heenan et al. [15]. Two different 0–5 V battery cyclers from Arbin Instruments are used: The LBT21084 system has a maximum current of 60 A, while the LBTa2030 is limited to 5 A. The cells are placed in a temperature chamber (Binder, KB 115). All tests are performed at a constant chamber temperature of 30 °C, as Ref. [16] proposed strong nonlinearities of aging at lower temperatures.
The test cells pass the following test: Firstly, the checkup begins with a CCCV (constant current, constant voltage) charge at 0.5 C up to 4.2 V until the current is lower than 0.34 A (0.1 C). After a pause of 15 min, a 0.5 C (1.7 A) discharge to 2.5 V is carried out, followed by another 15 min pause before the cell is recharged with a 0.5 C CCCV up to 4.2 V. After another 15 min pause, the cells are discharged and charged at 0.1 C (0.34 A). Next, the pulse resistances are determined by two pulse tests at 4.2 V and 3.7 V. The pulse resistance is assessed after 10 s of a 3.4 A pulse. At the end of the checkup, the cells are fully discharged at 0.1 C down to 2.5 V.
Additional electrochemical impedance spectra (EIS) were obtained for the test at 50 Hz, and reference cells were measured at 100% SOC in the frequency range of 80 mHz to 5 kHz. For the analysis, the generalized distribution of relaxation times (GDRT) was deployed, which is available in the EC-Idea tool [17]. The GDRT enables us to analyze a superposition of different processes with similar excitation frequencies that cannot be distinguished in Nyquist representation. The GDRT includes RC-elements and RL-elements and can be applied without the need for preprocessing the impedance spectra.
The cells are cycled as depicted in Table 2. The charge is performed at Imax(cha) until the cut-off voltage. The cells are then charged in a derating phase with a lower current rate of 0.2 C (0.68 A), avoiding a constant voltage phase that would be less suitable for an MLI application. The discharge is carried out at Imax(dsc) only. The bold numbers refer to the currents accompanied by switching. To assess the importance of the maximum and average currents for aging, four different reference tests are performed. Therefore, Table 2 covers the maximum and average discharge and charge currents.
The reference tests are conducted to assess aging at the maximum current (Ref1) and close to the average currents for three different test scenarios: pulsed discharging (Ref2), pulsed charging (Ref3), and pulsed charging/discharging (Ref4), as depicted in Table 2. Every 50 cycles, the checkup is repeated.
The impact of switching is investigated for frequencies of 50 Hz and 10 kHz. A frequency of 50 Hz and 50% duty cycle are the limits that can be achieved with the Arbin test cyclers used alone, which enable us to measure electrochemical impedance spectroscopy (EIS). The tests at 10 kHz are performed with varying duty cycles for charge, discharge, and charge/discharge. Therefore, we developed a board to perform the switching, which is controlled by a digital I/O. The switching board is placed on top of another board connecting the cell. Compared with our previous version in [13], the pull-up resistor is now integrated into the board. The layout of the circuit board with the connected cycler via the voltage and current sensors and the auxiliary board is graphically shown in Figure 1. For more information, we refer to our previous paper [13].
With an oscilloscope and a current probe CP030A, the current passing the cell during pulsing was detected. In order to avoid current peaks clearly higher than the maximum current of 5 A caused by the dynamic control behavior of the Arbin test bench when the cell is switched on and off by the switching board, an inductor is included. A coil with an inductance of 560 µH is found to be optimum and is included in the test setup. In Figure 2, the measured currents obtained for coils with 0, 100, and 560 µH using 10 kHz are given for the representative example of a 75% duty cycle.

3. Results and Discussion

3.1. Influence of Temperature

For all test conditions, the maximum temperature of the cell varies from 36 to 46 °C, mainly depending on the magnitude of the discharge current. In each test condition, the variation is within 3 K, which might be caused by the quality of the contact with the housing and the position in the temperature chamber. During constant current charge, the temperature drops to a value of 31–32 °C and reaches the chamber temperature of 30 °C during derating phase. For all test conditions, including reference and switching, the average temperature range during cycling is 32–35 °C, which is why the average temperature is not expected to have a high impact on the aging process and no significant heat production due to switching operation itself is observed. Only the heat peaks during discharge at higher rates are expected to have a stronger influence.

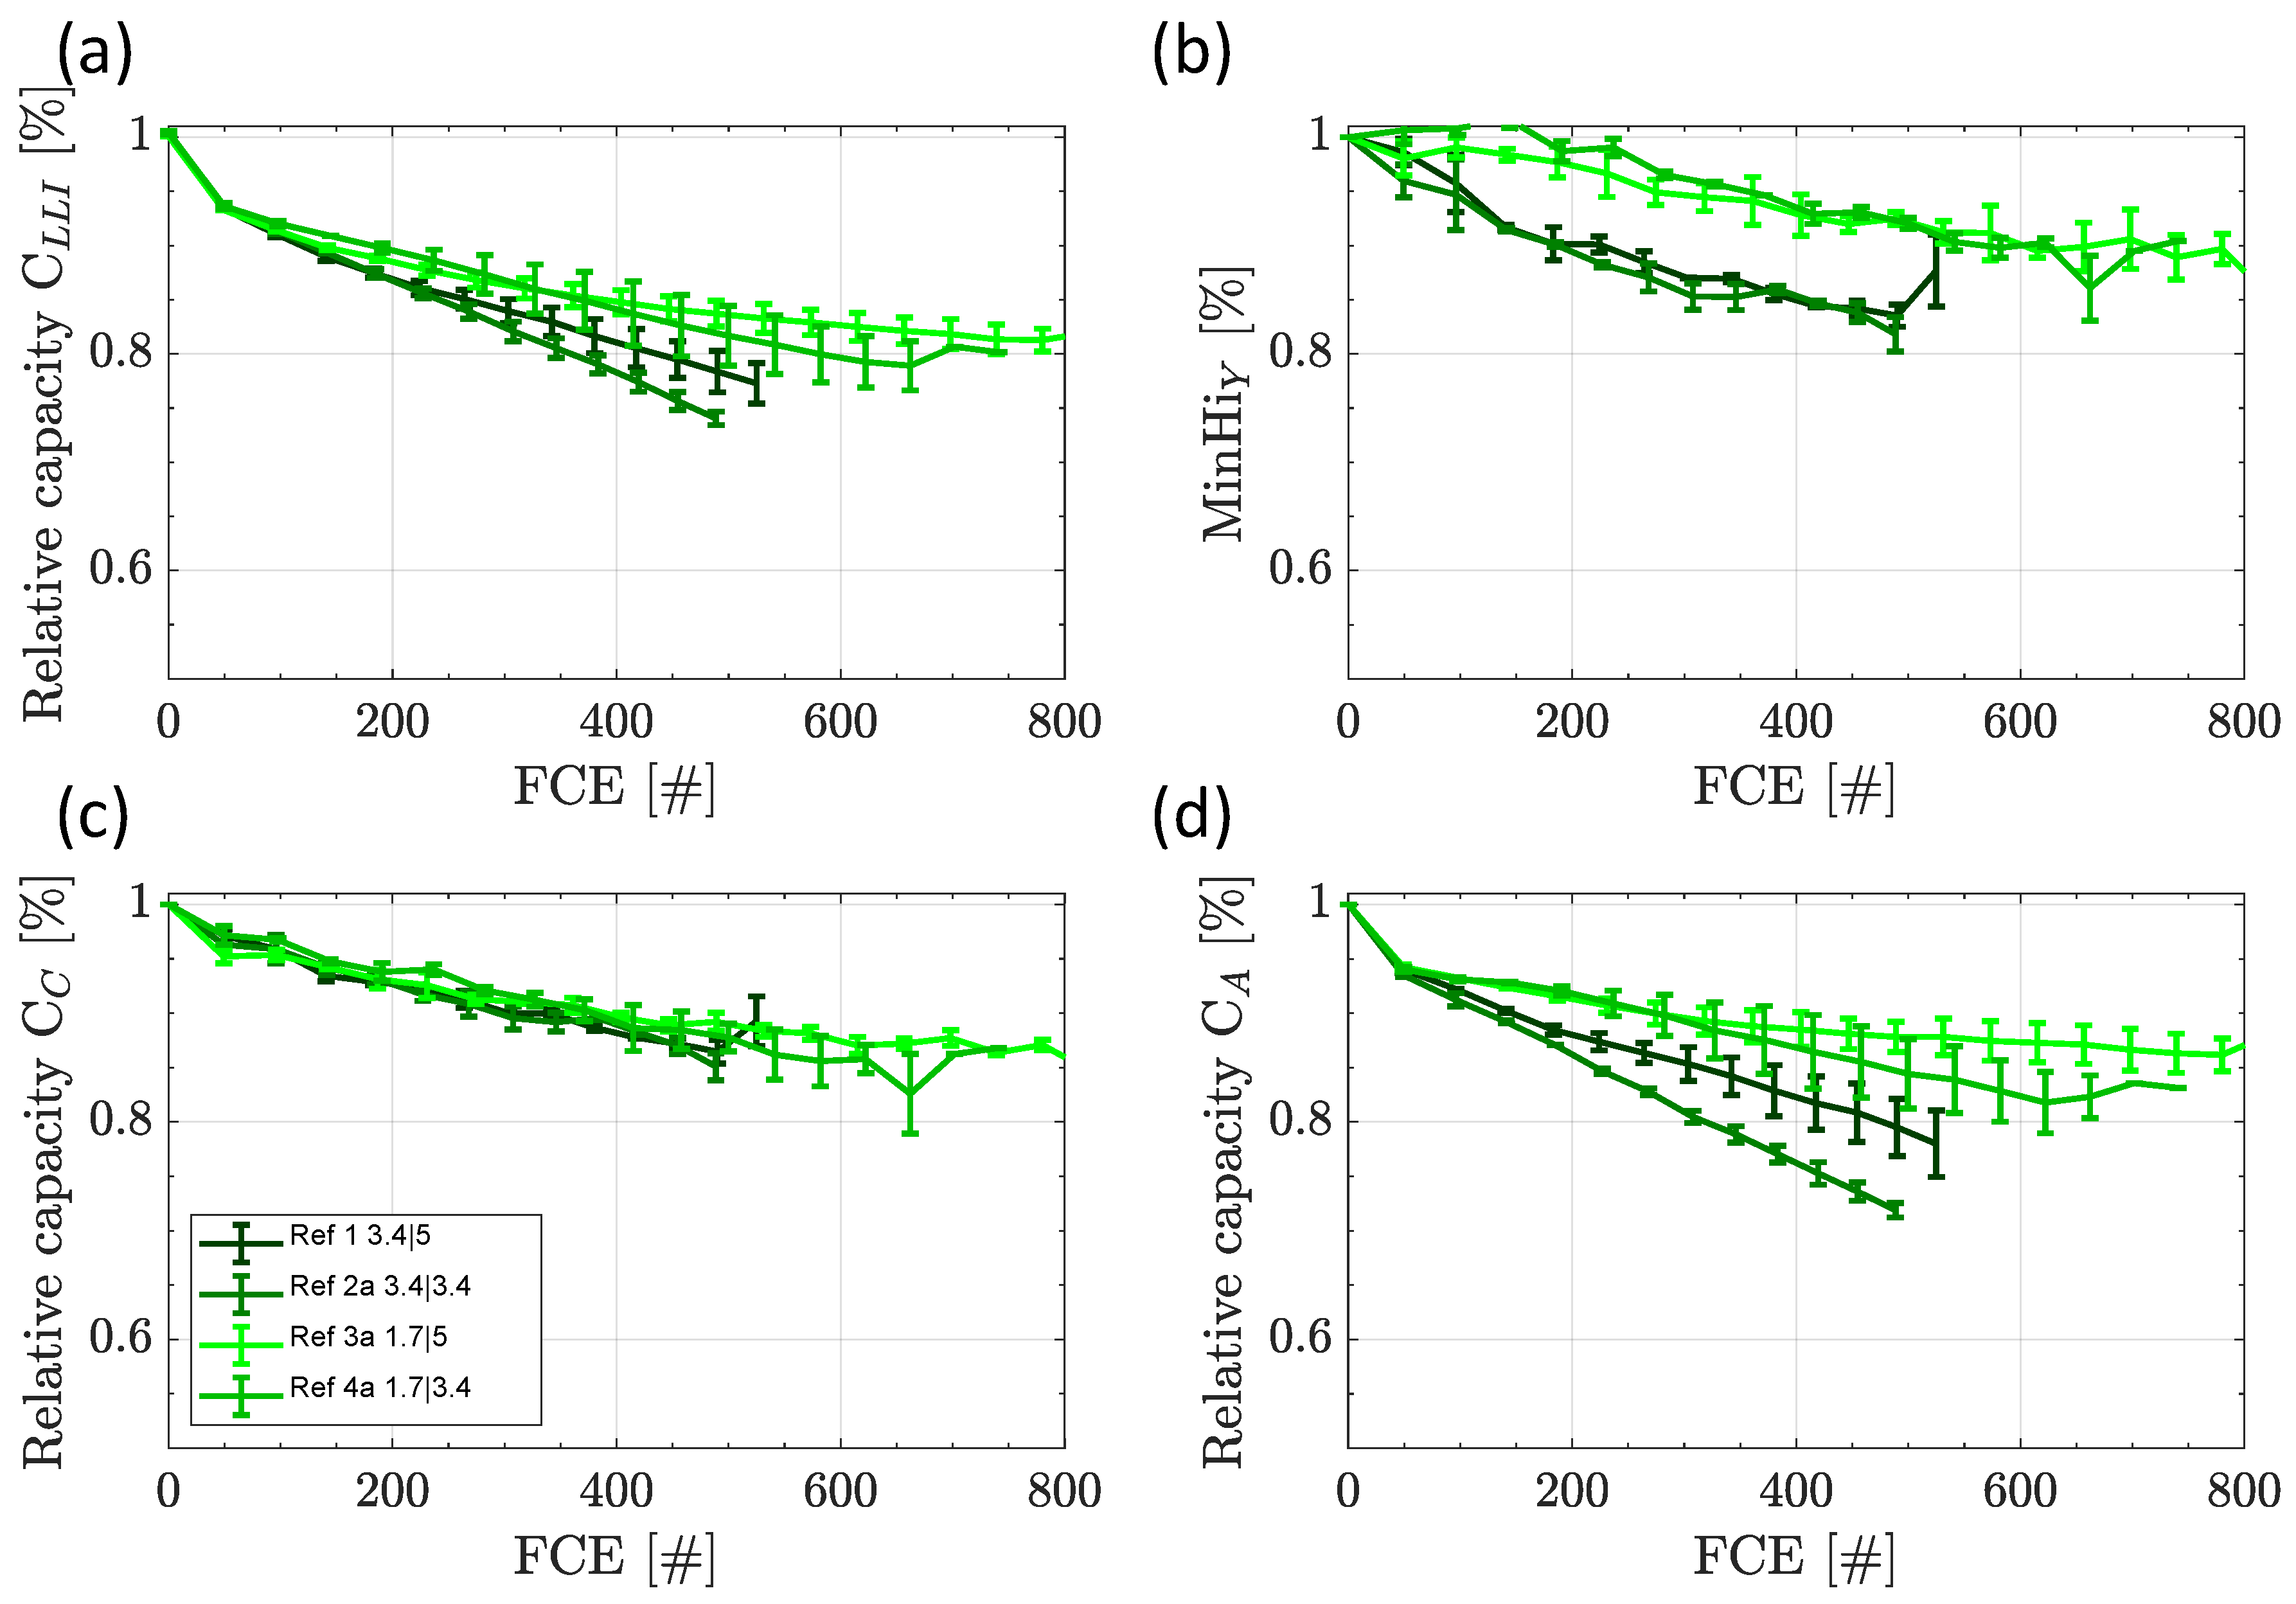
3.2. Reference Tests

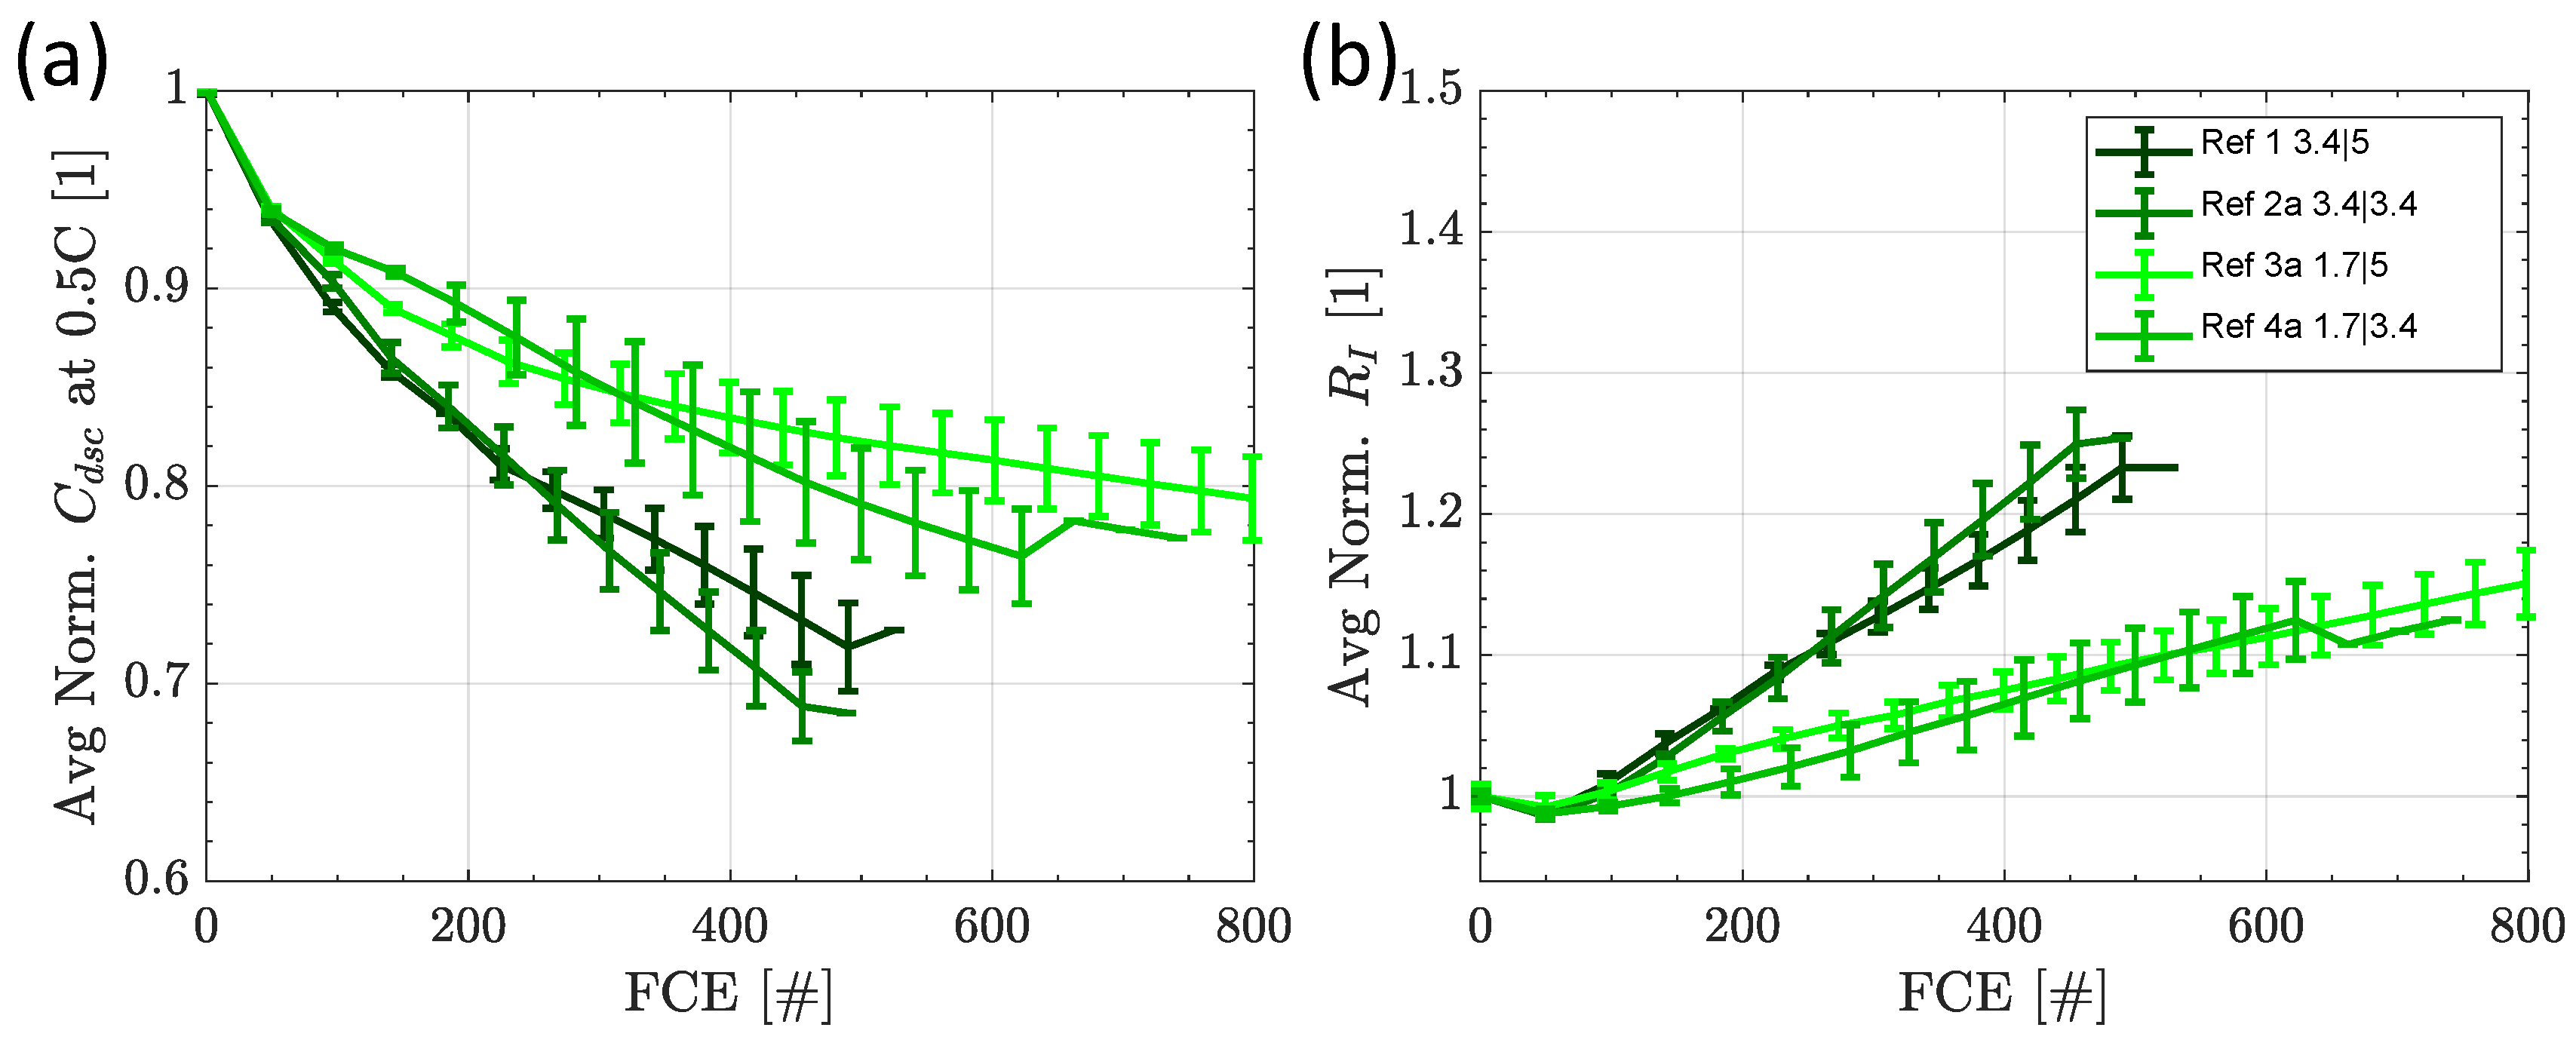
3.2.1. Capacity and Internal Resistance

The relative discharge capacity at 0.5 C and the relative internal resistance are presented in Figure 3 as a function of the full cycle equivalents (FCE) for the reference tests. The reference tests vary in charge and discharge current rate, and each test condition is evaluated for two cells, respectively. The curve represents the average capacity loss/resistance increase, while the error bar represents the highest and lowest value within the specific test condition. The first entry states the average charge, and the second the average discharge current during cycling.
From the 1st to the 2nd checkup, there is an initial capacity drop for all cells and test conditions that is mainly influenced by the reversible effect of the anode overhang [18,19], as the average SOC of 50% during cycling is higher than the SOC of 33% the cell was delivered at (Table 1). As all test conditions are the same regarding chamber temperature and average SOC during cycling, this initial part is the same for cells and test conditions and can therefore be neglected for the influence of aging or switching. After an initial drop, the impact of aging becomes dominant. The capacity drop is largely determined by the charging current, with higher currents leading to faster aging. Typically, higher charge currents, especially for high-energy cells, increase the risk of plating lithium on the graphite anode [20]. A higher discharge current, however, leads to a lower capacity fade. This is explainable by the lower resistance at higher temperatures that reduces aging during cycling, as was reported, e.g., by [21]. This is the case for reasonable high currents that generate significant resistive heat. In the event that a low discharge current is slightly increased, this effect will not be observed.
The internal resistance shows comparable behavior to the capacity loss. Only the influence of discharge currents is less pronounced for lower charge currents. This is rather typical for high-energy cells with comparable allowed C-rates, as it is reported, e.g., [22,23], for NMC and NCA cells.
We conclude that this cell is strongly sensitive to charge currents and less sensitive strong to discharge currents. This is in contrast to our previous paper [13] with comparable aging tests for a high-power cell type. Thus, we can now attribute the aging during switching either to the maximum or to the average aging value.

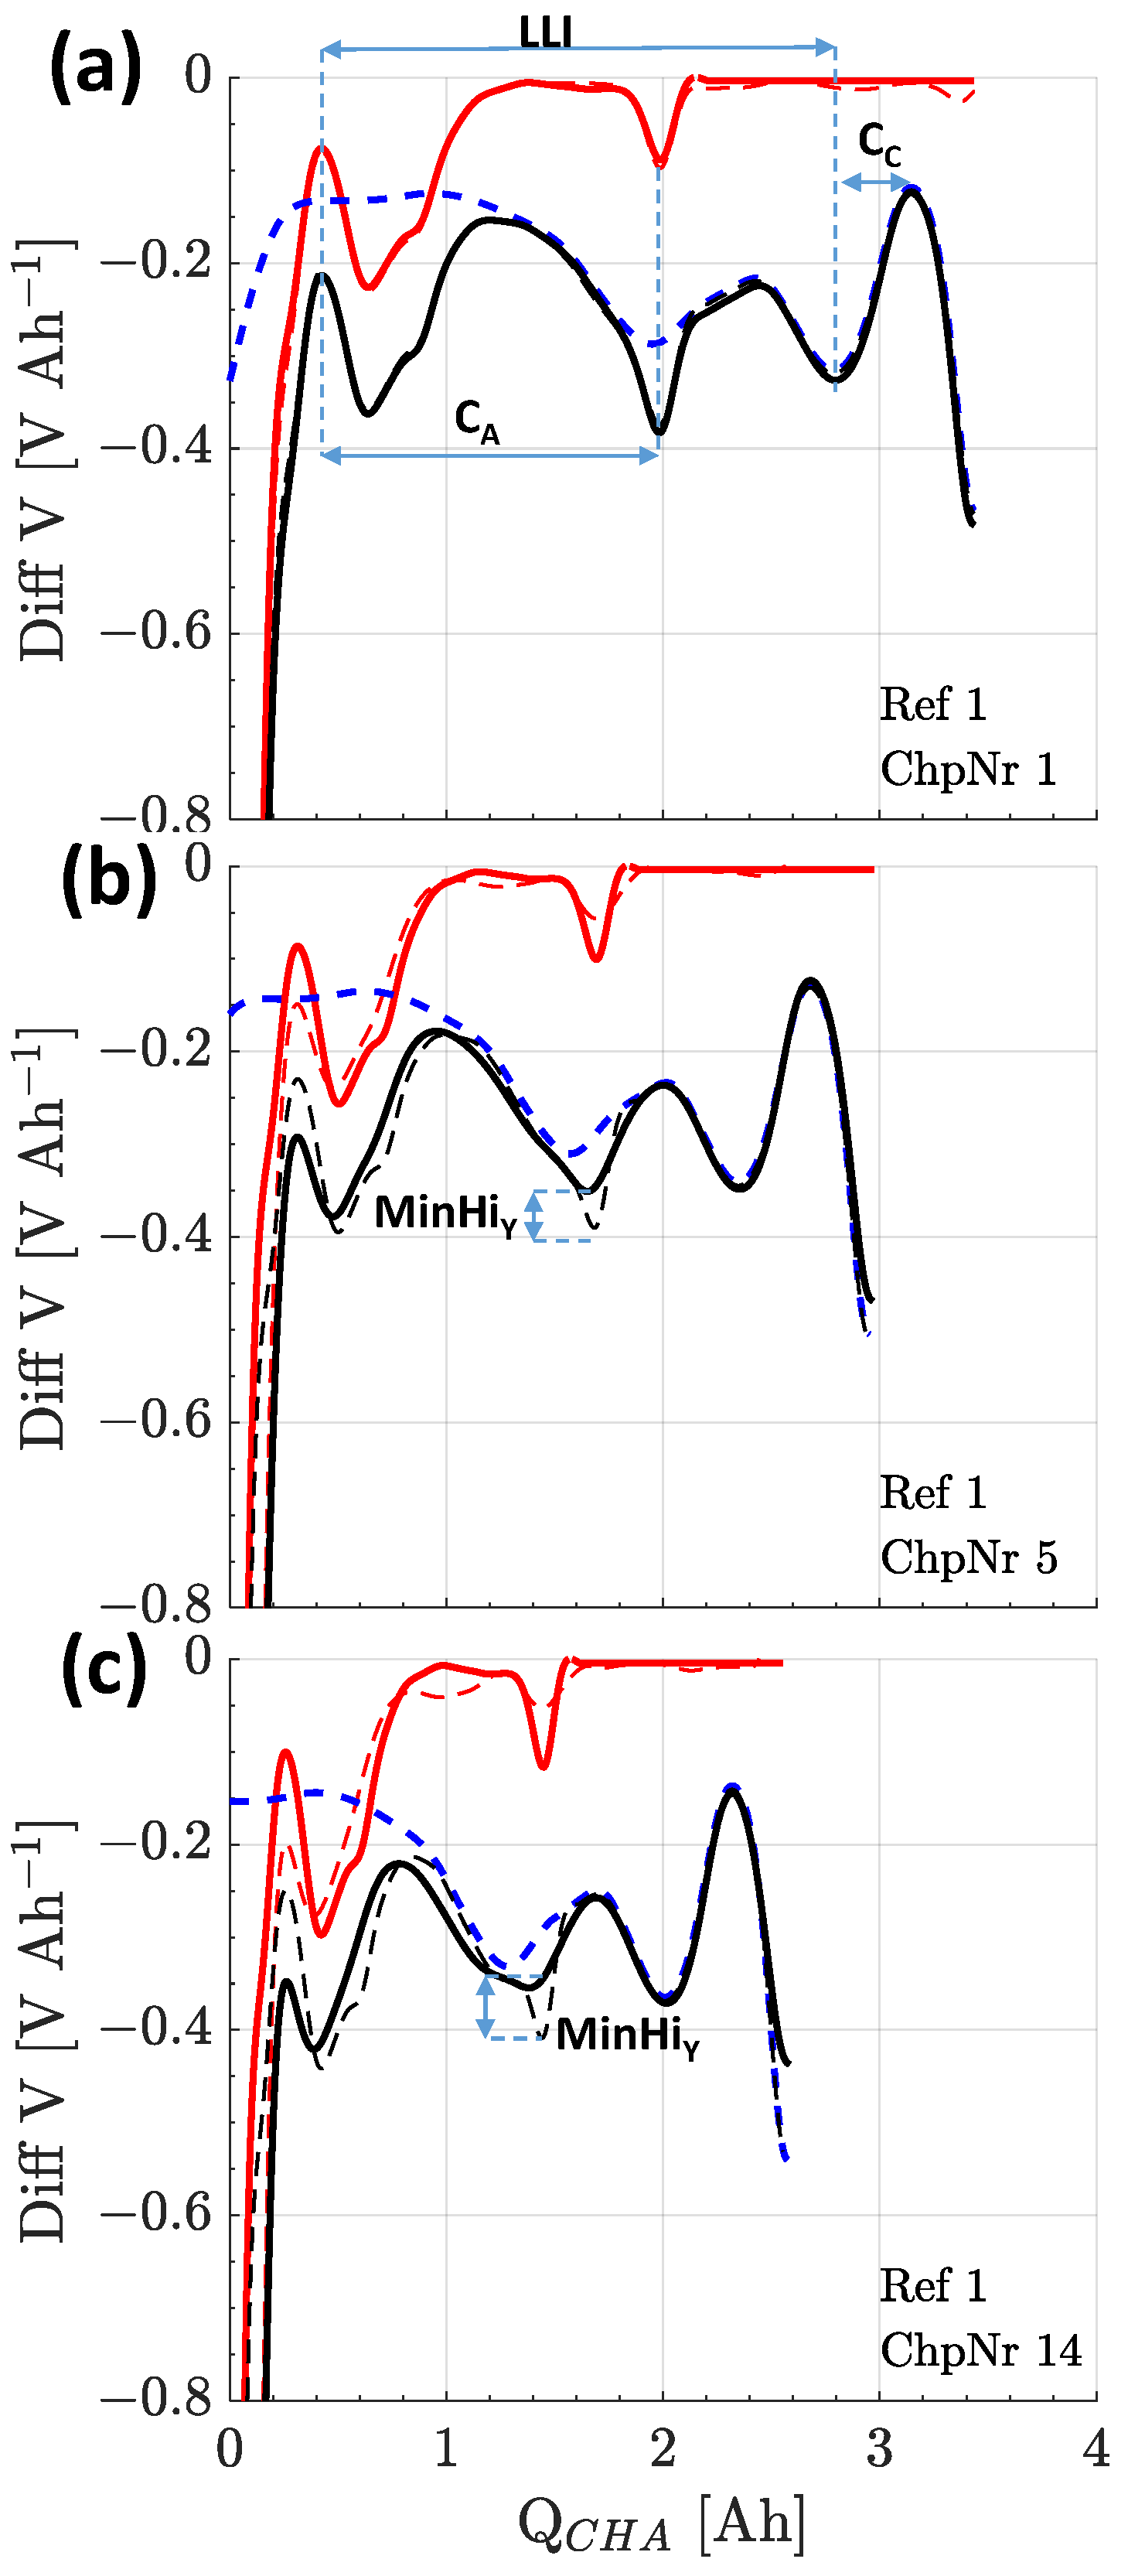
3.2.2. Differential Voltage Analysis

The aging behavior of the cells is evaluated phenomenologically using differential voltage analysis (DVA) of the charging sequence at 0.1 C. The DVA is plotted in Figure 4 at the beginning of the test (a), at an intermediate step at checkup 5 (b), and at the end of the test (c). The measured full-cell DVA is shown in solid black. The DVA shows several characteristic points, of which we focus on four. Two belong to the graphite anode and two to the NMC811 cathode. Comparing the DVA with the results of our previous paper with high-power optimized cells, the features are less pronounced, and there is a shoulder at the first rise on the left, which is an indicator for silicon in the cell [24]. This further supports the high-energy character of the tested cell here.
The respective half-cell curves are shown dashed in blue for the cathode and solid in red for the anode. The shape of half-cell curves is derived from half-cell measurements. To include geometry and pressure effects in the original cell, we estimated the cathode curve and calculated the anode curve from the difference of the measured full cell and the estimated cathode curve. This method is verified by simple calendar aging leading to a shift of the anode and cathode, preserving the shape of both half-cell curves. By stretching and shifting the half-cell curves, the DVA is obtained by matching the characteristic peaks of the full-cell and half-cell curves. The loss of active material from the graphite anode CA can be determined by the distance between the first peak on the left and the minimum in the center (LiC12). Silicon cannot be included for capacity loss on the anode, as it shows no features in a half-cell curve [25]. For the cathode, the loss of active material CC is determined by measuring the distance between the minimum and the maximum on the right side. The loss of lithium inventory (LLI) is given by the distance between anode and cathode peaks. The normalized distances are plotted over the FCE.
With advancing cycling, the shape of the dV/dQ trend starts to flatten, losing its characteristic shape. This is illustrated by the deviation between the solid and dashed black curves, of which the latter is the sum of the original anode and cathode half-cell curves in Figure 4b,c. As already mentioned in [13], the shape loss is caused by a lower homogeneity of lithium distribution (HLD) over the area of the electrode, as already reported by Lewerenz et al. [18,26]. This lowered HLD can be explained by an inhomogenous and stable SOC distribution caused by high current cycling [27,28,29]. An alternative explanation is e.g., the deposition of a dense µm-thick covering layer caused by slow lithium plating that passivates over time [30]. One possibility to measure the HLD is to compare the ratio of the current peak height MinHiy at approx. 2 Ah (solid line) with the expected peak height taking into account the shift and stretching of the half-cell curves (dashed line). Hence, MinHiy is on the one side a measure for HLD and, on the other, an indicator for the reliability of the fit results for the aging parameters. The dashed red line is obtained by comparing the full cell curve and cathode curve. This gives additional insights as the cathode remains rather stable over aging in our experiments while the anode loses homogeneity. At the end of the test, the second peak of the graphite is barely detectable and may not be evaluated. The deviations on the right in the almost fully charged state exhibit a smaller slope of the measured curve compared with the theoretically shifted and compressed cathode curve, which is an indicator for resistance rise in this SOC region. The curve shapes and the progress are in general comparable for switched and reference tests, and mainly the speed of aging and curve deformation are changing.
The total loss of active lithium (also known as lithium inventory (LLI)), quantified by slippage between cathode and anode curves, is given in Figure 5a. The homogeneity of lithium distribution (HLD) or lateral coherence of SOC over the electrode area during charge is shown in Figure 5b. The normalized loss of active material is displayed in Figure 5c for the cathode and in Figure 5d for the anode.
Looking at LLI, the same pattern and nearly the same values are visible as we already observed for the capacity fade in Figure 3a. Regarding losses on the cathode active material, there is a smooth decline down to 85% after 600 FCE, and this trend is not significantly influenced by different charging and discharging currents. The main reason therefore will be that for all test conditions the same derating phase at the end of charge is performed. Therefore, this derating phase essentially defines the time at high cell voltages. The strong impact of a low current phase or CV phase at the end of charge regarding aging was also highlighted by Kannan et al. [31]. More sensitive indicators are loss of anode active material and homogeneity of lithium distribution on the anode. While MinHiY shows lower homogeneity for higher charge currents, discharge currents seem to have no impact on this measure. Comparable observations as for LLI results are found for anode active material losses CA, with a negative influence of higher charge currents and positive effects of higher discharge currents. Zilberman et al. [24] found in their work for the same cell type a large portion of CA losses during calendar aging.
As a conclusion, MinHiY is sensitive mainly to charge currents and CA and LLI to charge and discharge currents. CC is no sensitive indicator for magnitude of charge or discharge current and is rather influenced by calendar aging by average and maximum SOC and temperature.

3.3. Switching Tests at 50 Hz and 50% Duty Cycle

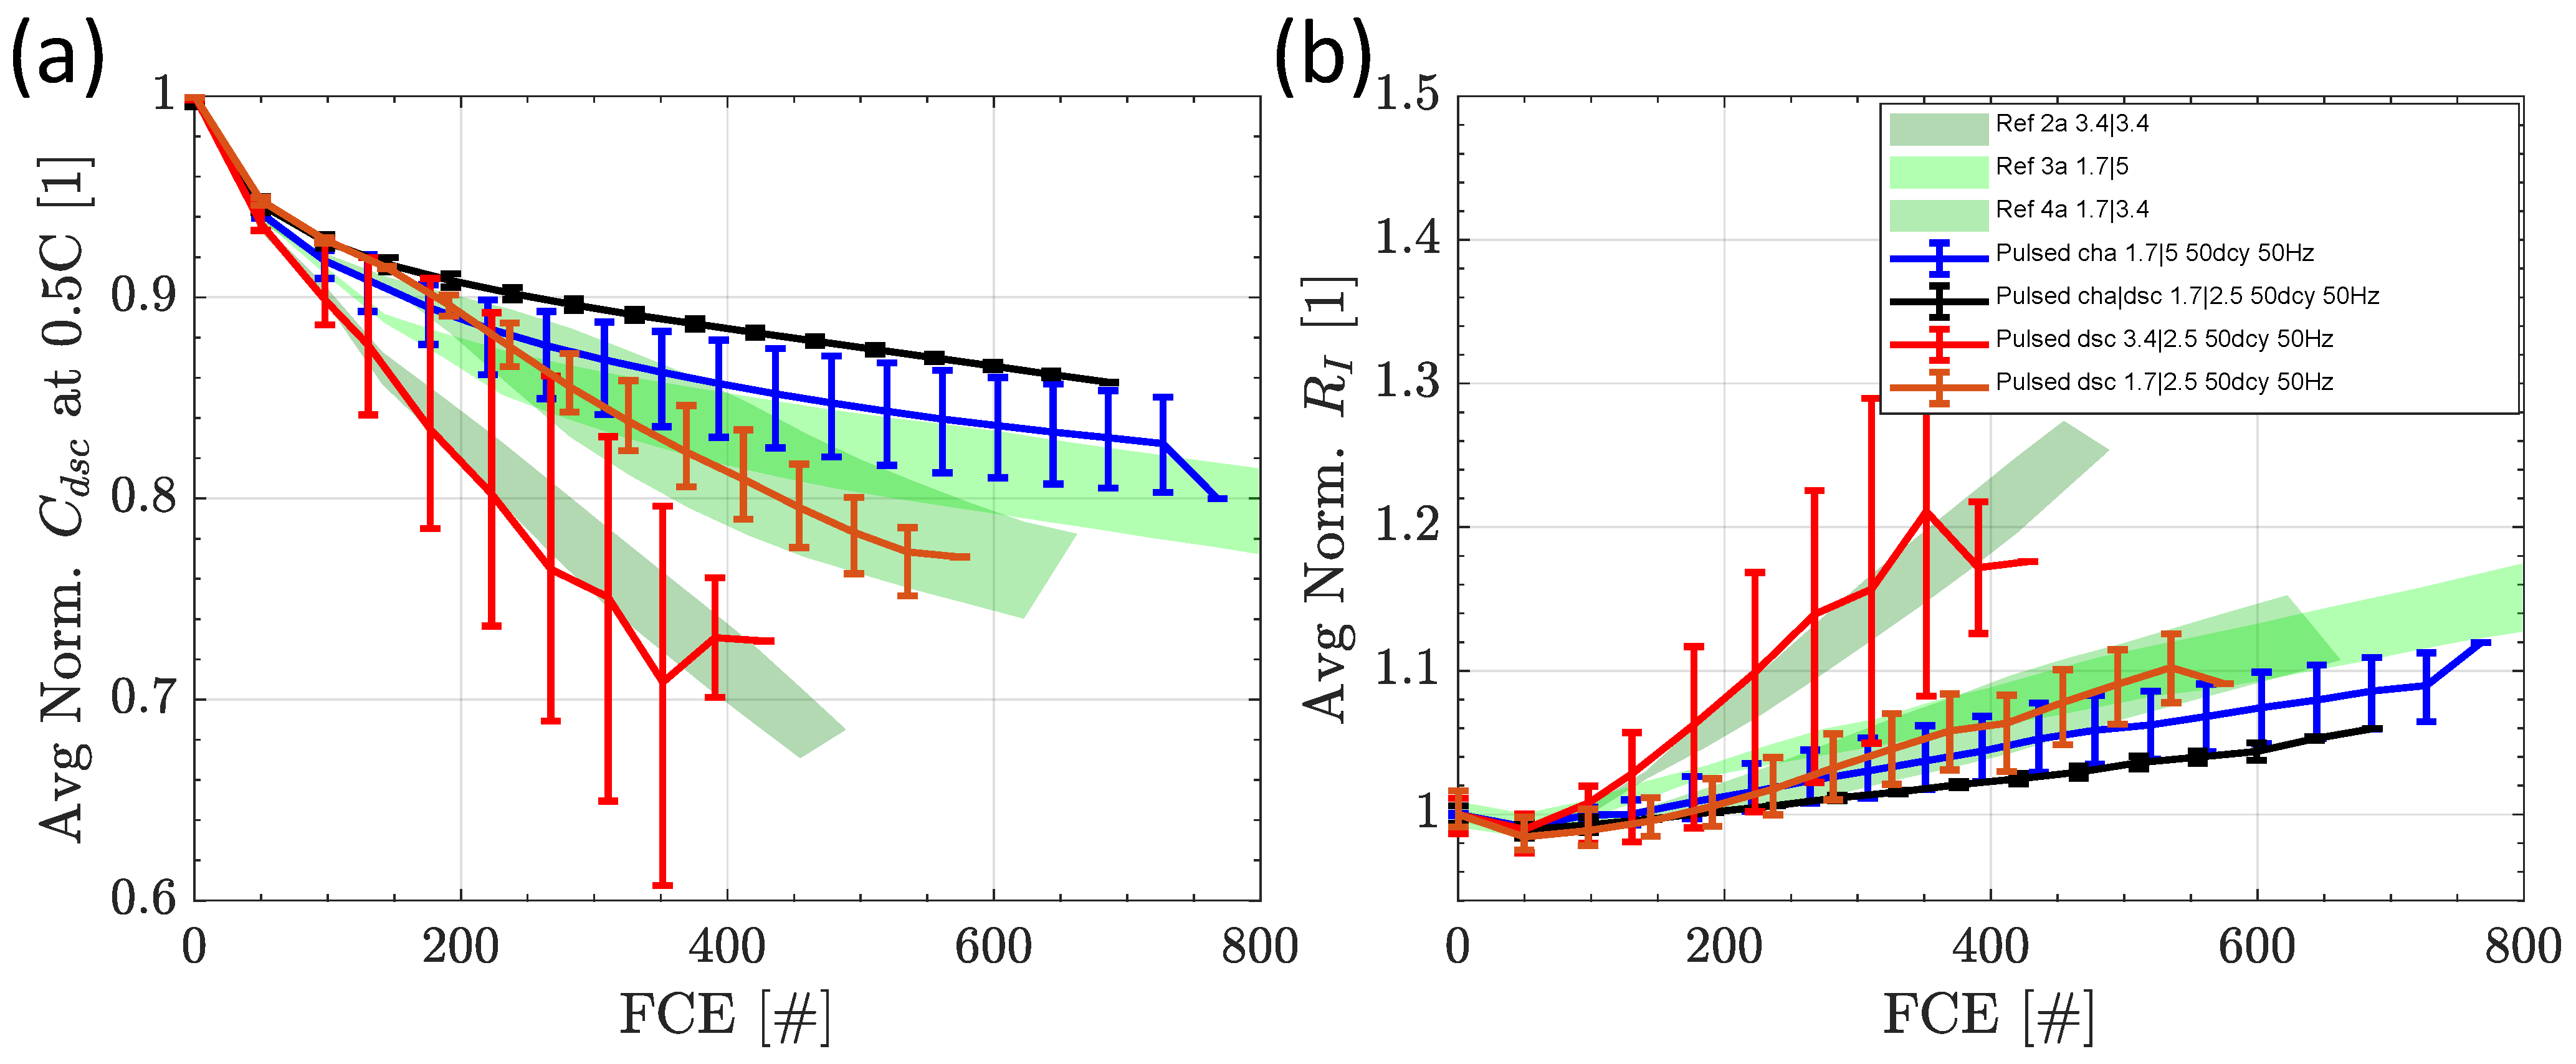
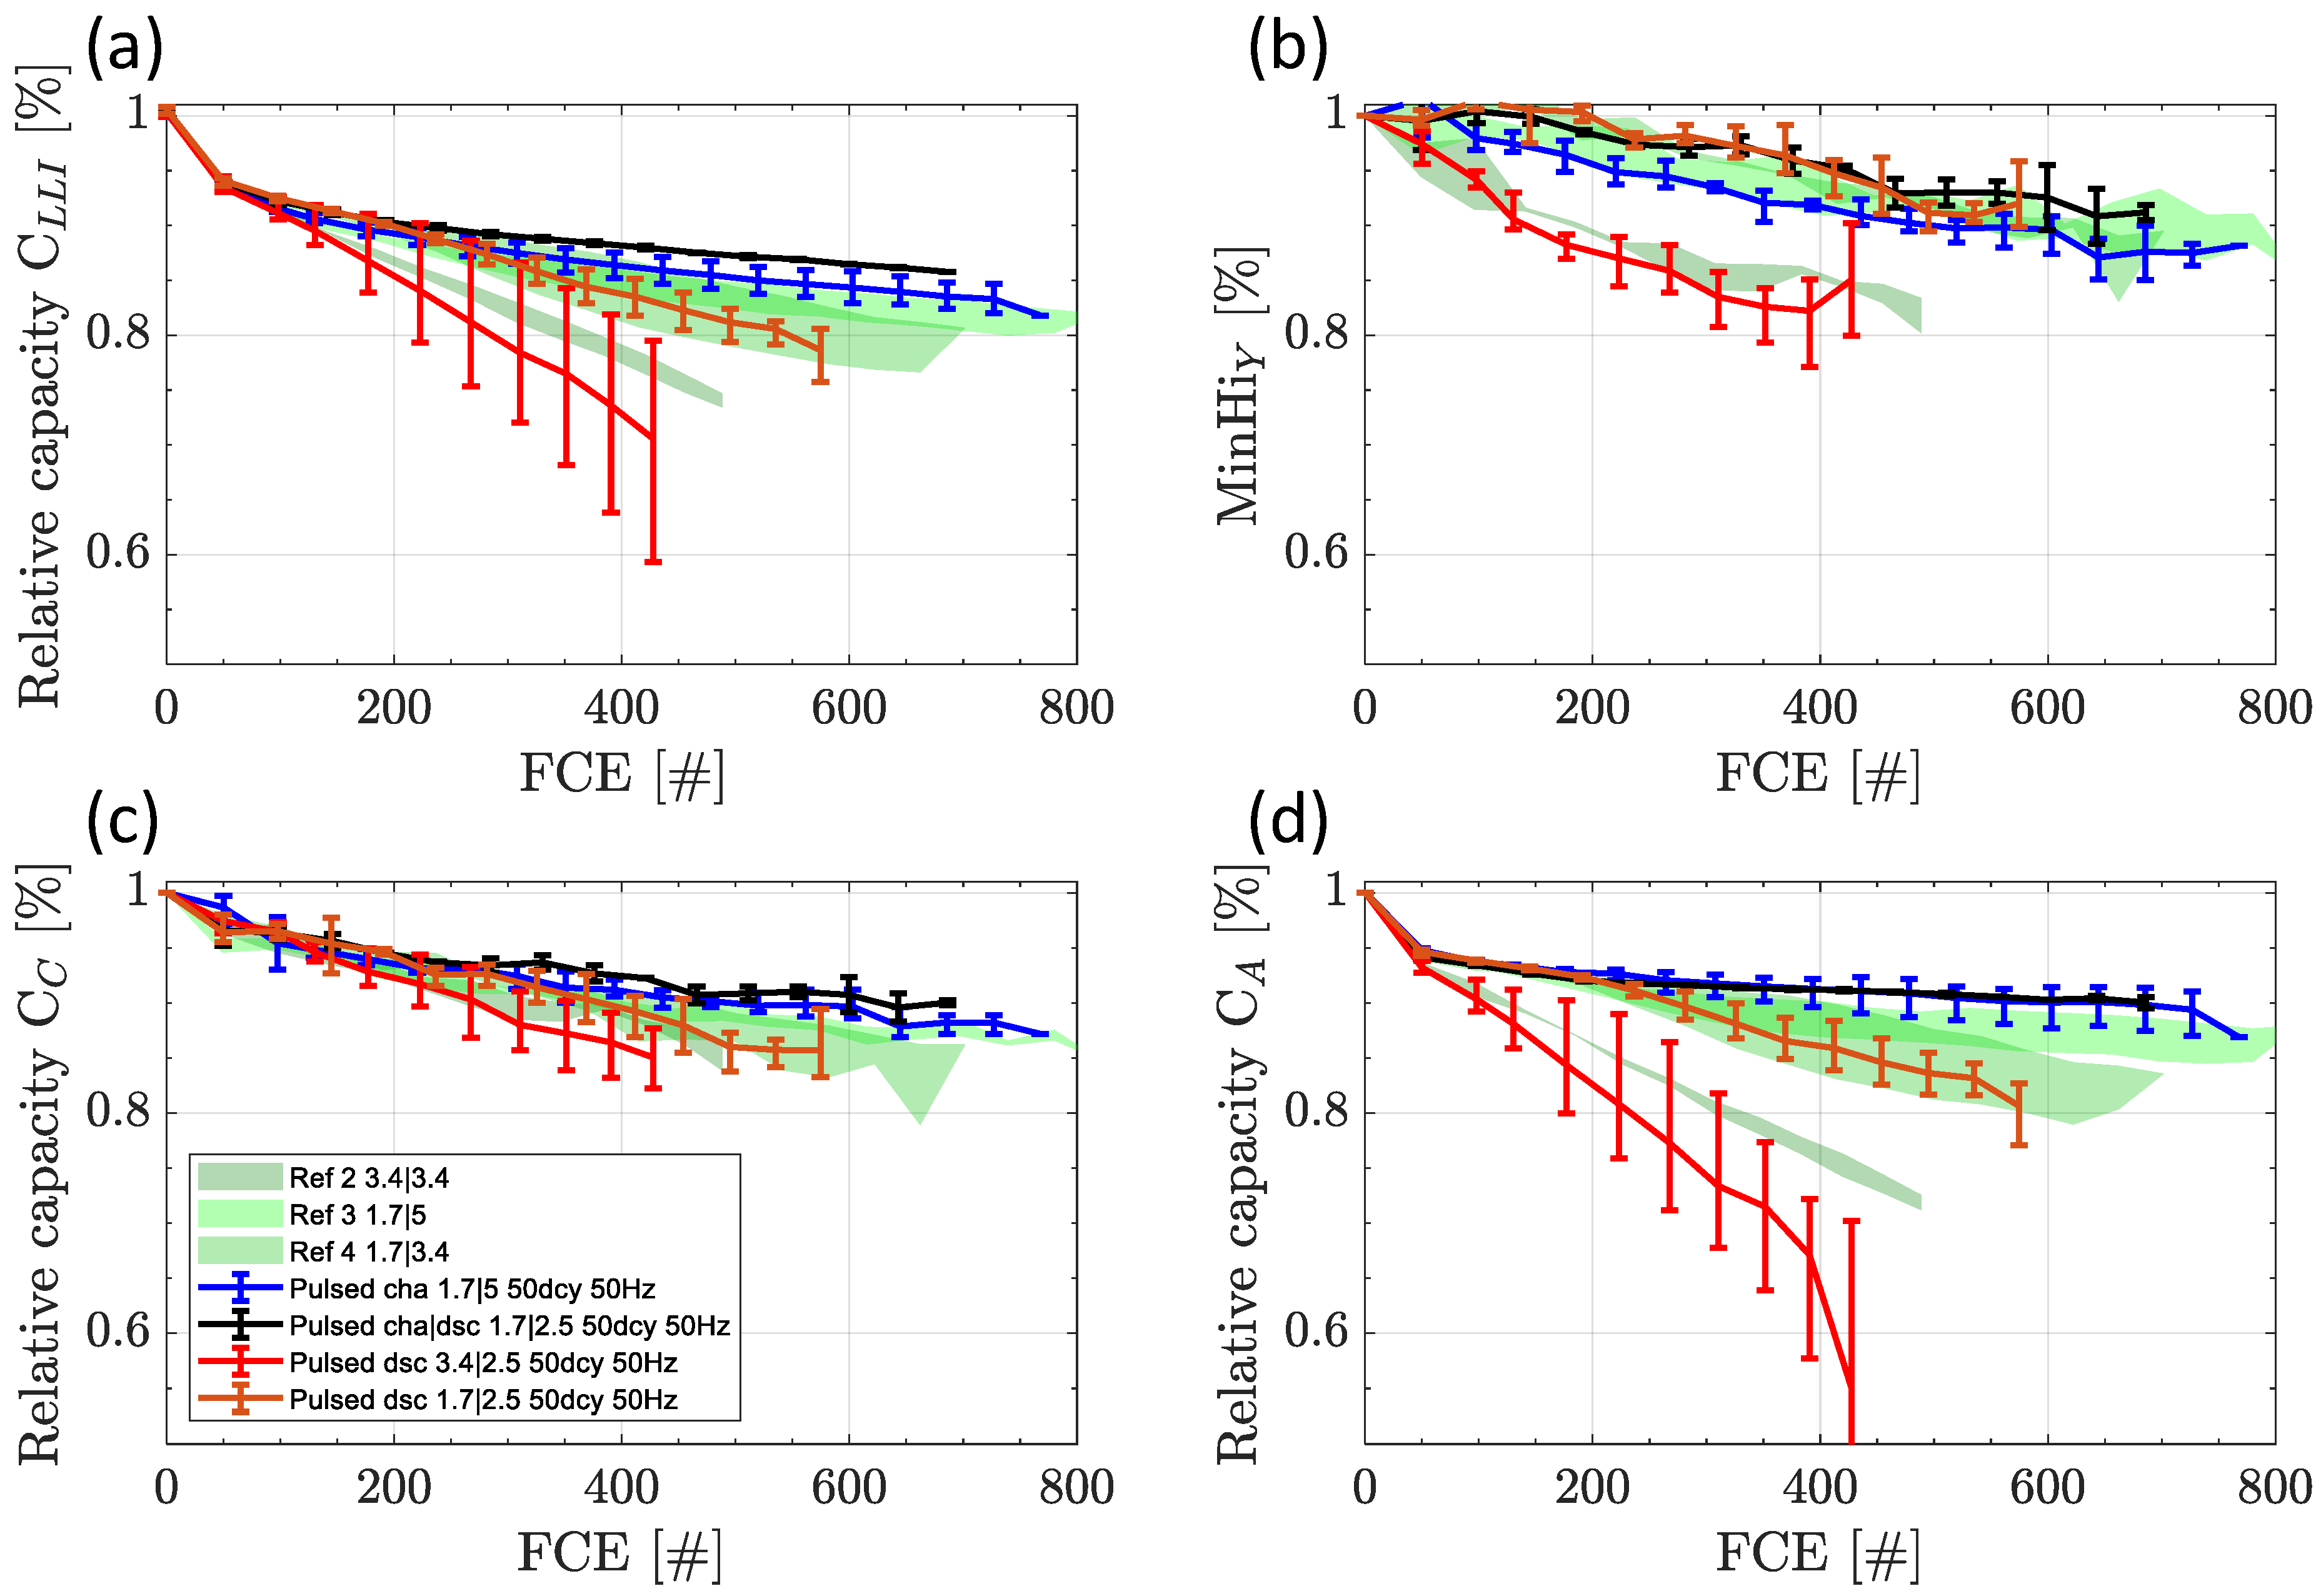
3.3.1. Capacity and Internal Resistance

In Figure 6, additionally to the reference cells, the relative discharge capacity at 0.5 C (a) and relative internal resistance (b) are presented for the switched cells operated at 50 Hz. Besides the reference cells from Figure 3 shown as colored areas, the cells are presented for switching during charge/discharge (black), charge (blue), and discharge (red). The least aging is obtained for charge|discharge (cha|dsc), with the lowest cell-to-cell variance and the lowest capacity losses, followed by charge (cha), and the highest variance is found for switching during discharge (dsc). We learned from reference cell behavior that the charge current is most sensitive to aging. To ensure that outliers are meaningful for this behavior, additional cells were tested under these conditions. Since the trends are evenly distributed, an error in the test conditions can be excluded. Since the charge current is twice as high for dsc compared with cha and cha|dsc, a higher aging is to be expected. To ensure a fair comparison, a test of dsc at low charge currents is added in brown. Although the course is clearly better than for the red curves (dsc), the brown curve (dsc low charge) still performs worse than cha and cha|dsc.
Comparing the reference results with switching tests, the cha|dsc are performing better than any reference, highlighting that the average discharge current of 2.5 A is lower than the 3.4 A of Ref4. Even though the average currents for cha and Ref3 are exactly the same, cha shows a lower average capacity loss. For dsc at low charge currents (brown), the comparison with Ref4 shows a good correlation with a tendency for higher capacity loss during switching. This is still the case even though the discharge current is 2.5 A lower than the 3.4 A for Ref4. The dsc at a higher charge rate (red) shows the same tendency but a higher capacity loss than Ref2, with the same charge current but a discharge current of 3.4 A instead of 2.5 A. Eye-catching is a very strong cell-to-cell variation for dsc at high charge currents, with significantly worse but also better performing cells.
Mirror image results are obtained for the resistance of the cells, as we already observed for the reference cell tests.
We conclude that the maximum current has no obvious influence on the aging trends, while the average current is mainly the crucial parameter for the switched cells. Unexpected results were obtained for the evaluation of switching directions compared with the reference tests. The switching during discharge exhibits a negative influence on the aging parameters, while they are improved by switching during charge. The combination of both leads to the best performance over aging, showing that the effect cannot be simply added. Moreover, switching alone during discharge increases the cell-to-cell variation. The very low cell-to-cell variation for the combined switching of charge and discharge could be explained by the lowest average charge and discharge currents in all tests. Even after an excessive literature review, we could not find a similar experimental design to make a useful comparison of the obtained findings.
In the following, we will further analyze the results for DVA and EIS to understand this behavior better.

3.3.2. Differential Voltage Analysis

The DVA results are illustrated in Figure 7. CLLI and CA show comparable results (Figure 6). CC are quite independent of the switching strategy; only the switching during discharge (dsc) has a slightly worse trend. The homogeneity, determined by MinHiY, shows the clear dependence of the charge current as already stated for the reference cells. Hence no contribution of the switching is found for MinHiY.
The cells switched during cha|dsc are performing best in all categories, followed by cha, and cells switched during dsc are worst, especially at higher charge rates (red), as shown before in Figure 6. Switching during dsc at a low charge rate behaves such as the reference cells, while the cha and cha|dsc perform better than the reference cells.
We conclude that switching is not increasing aging and may be beneficial considering LLI, the anode, and the cathode if the cell is switched during charge. Only at high charge currents combined with switching during discharge does the cell-to-cell variation increase.

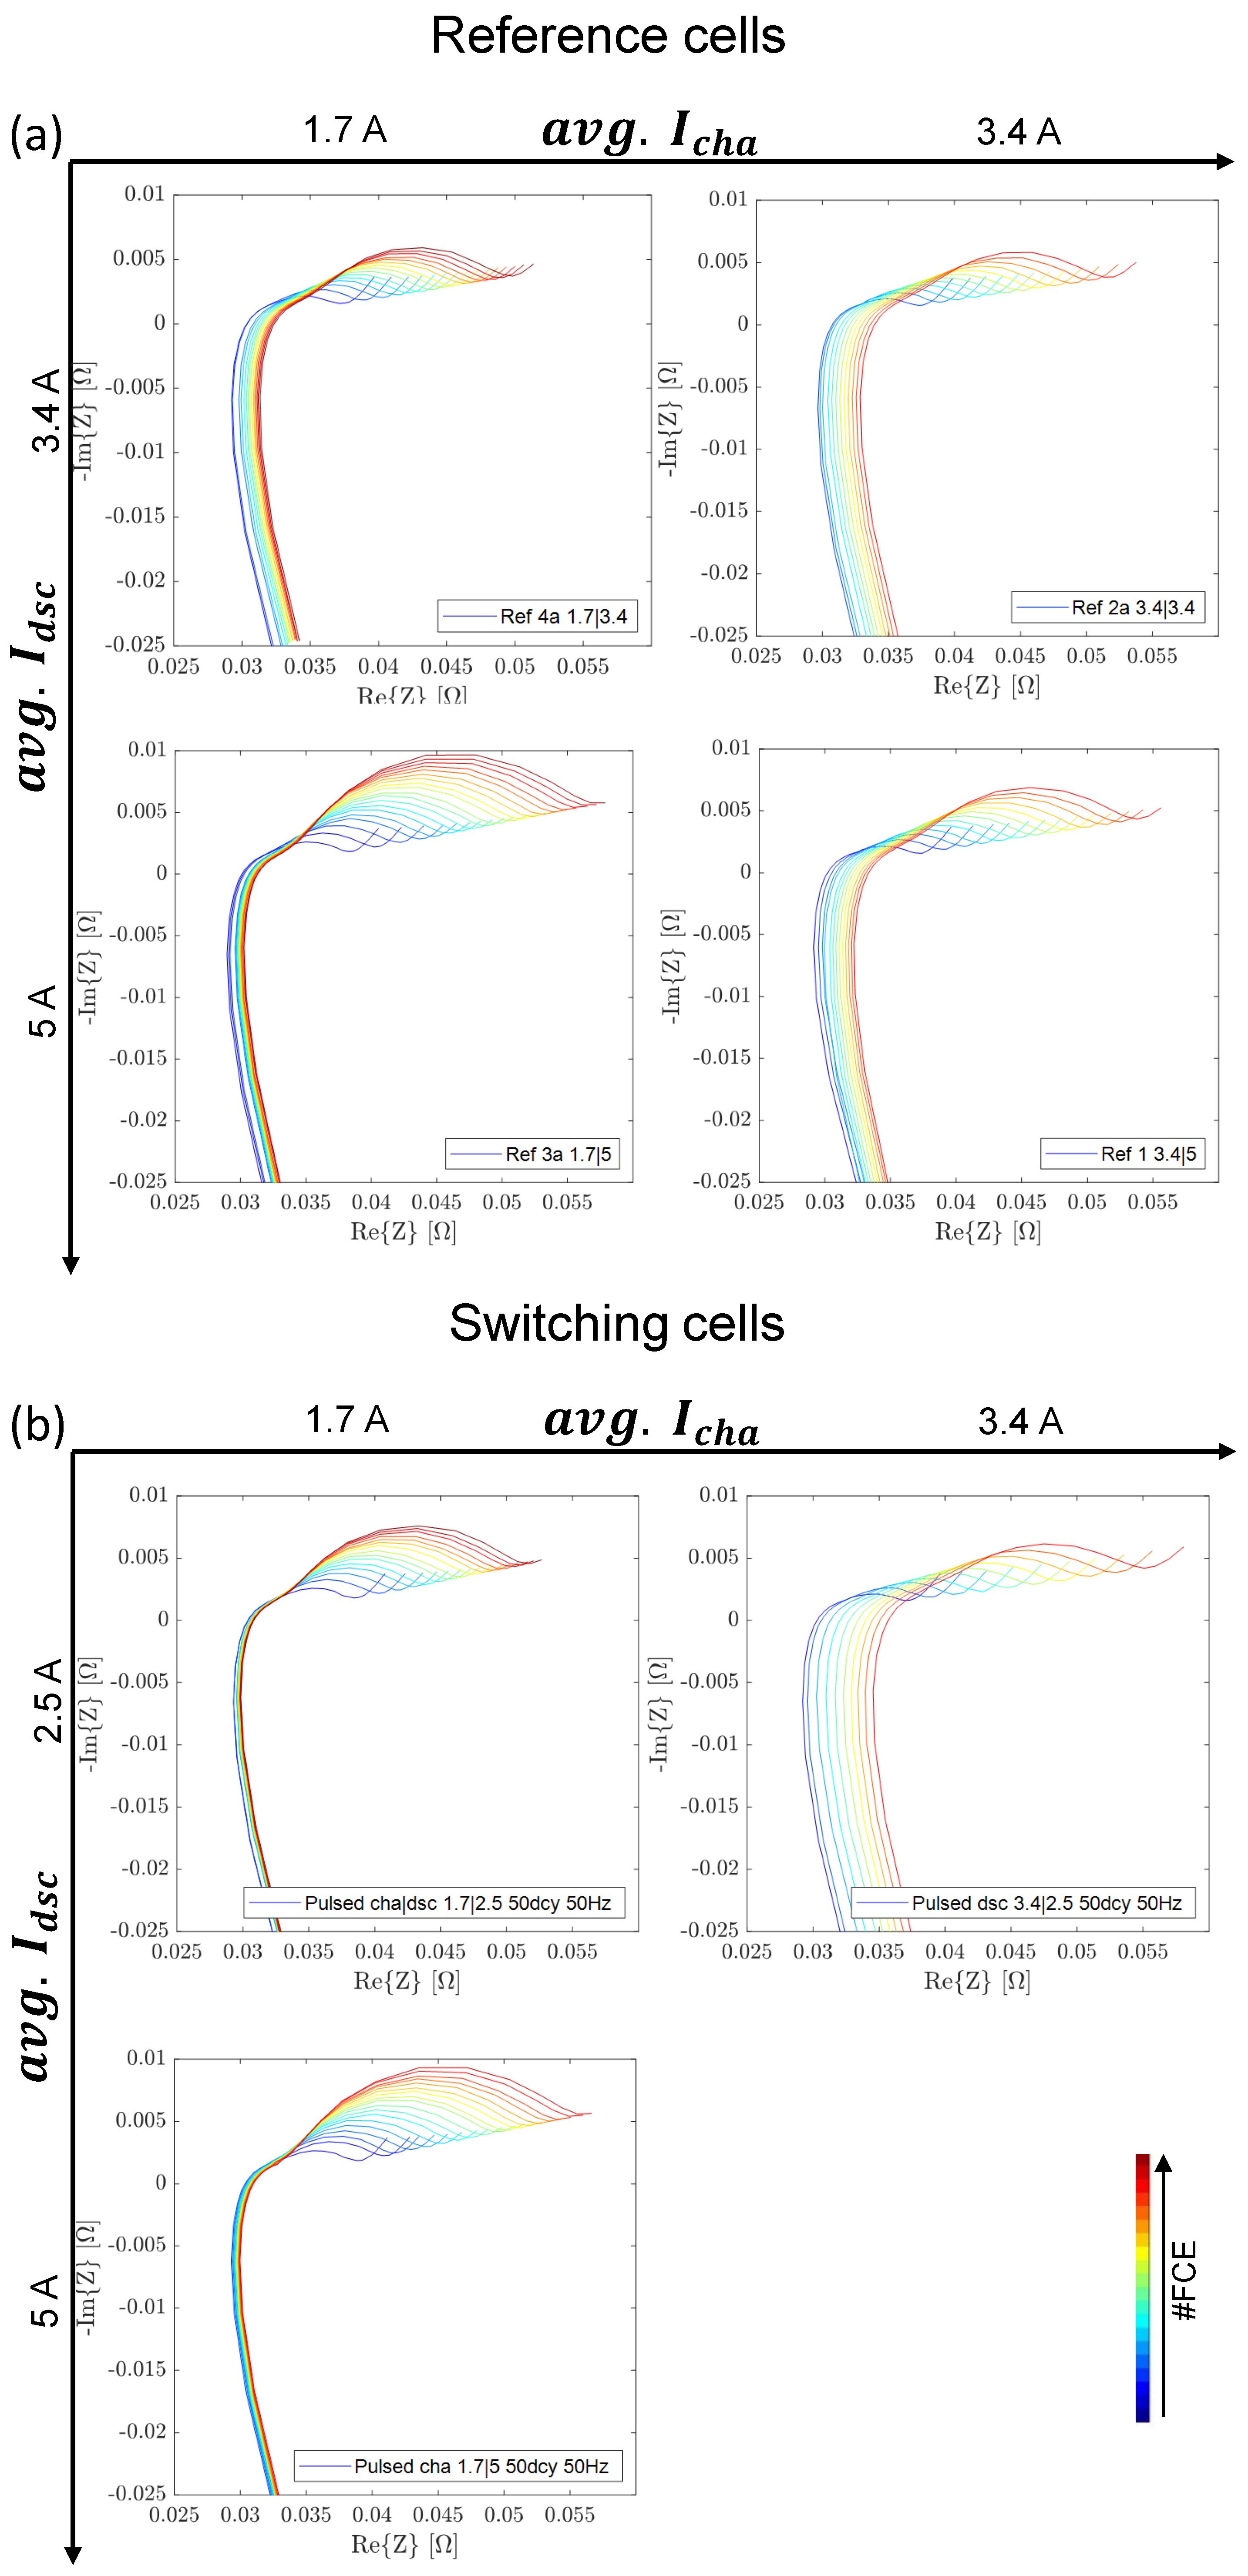
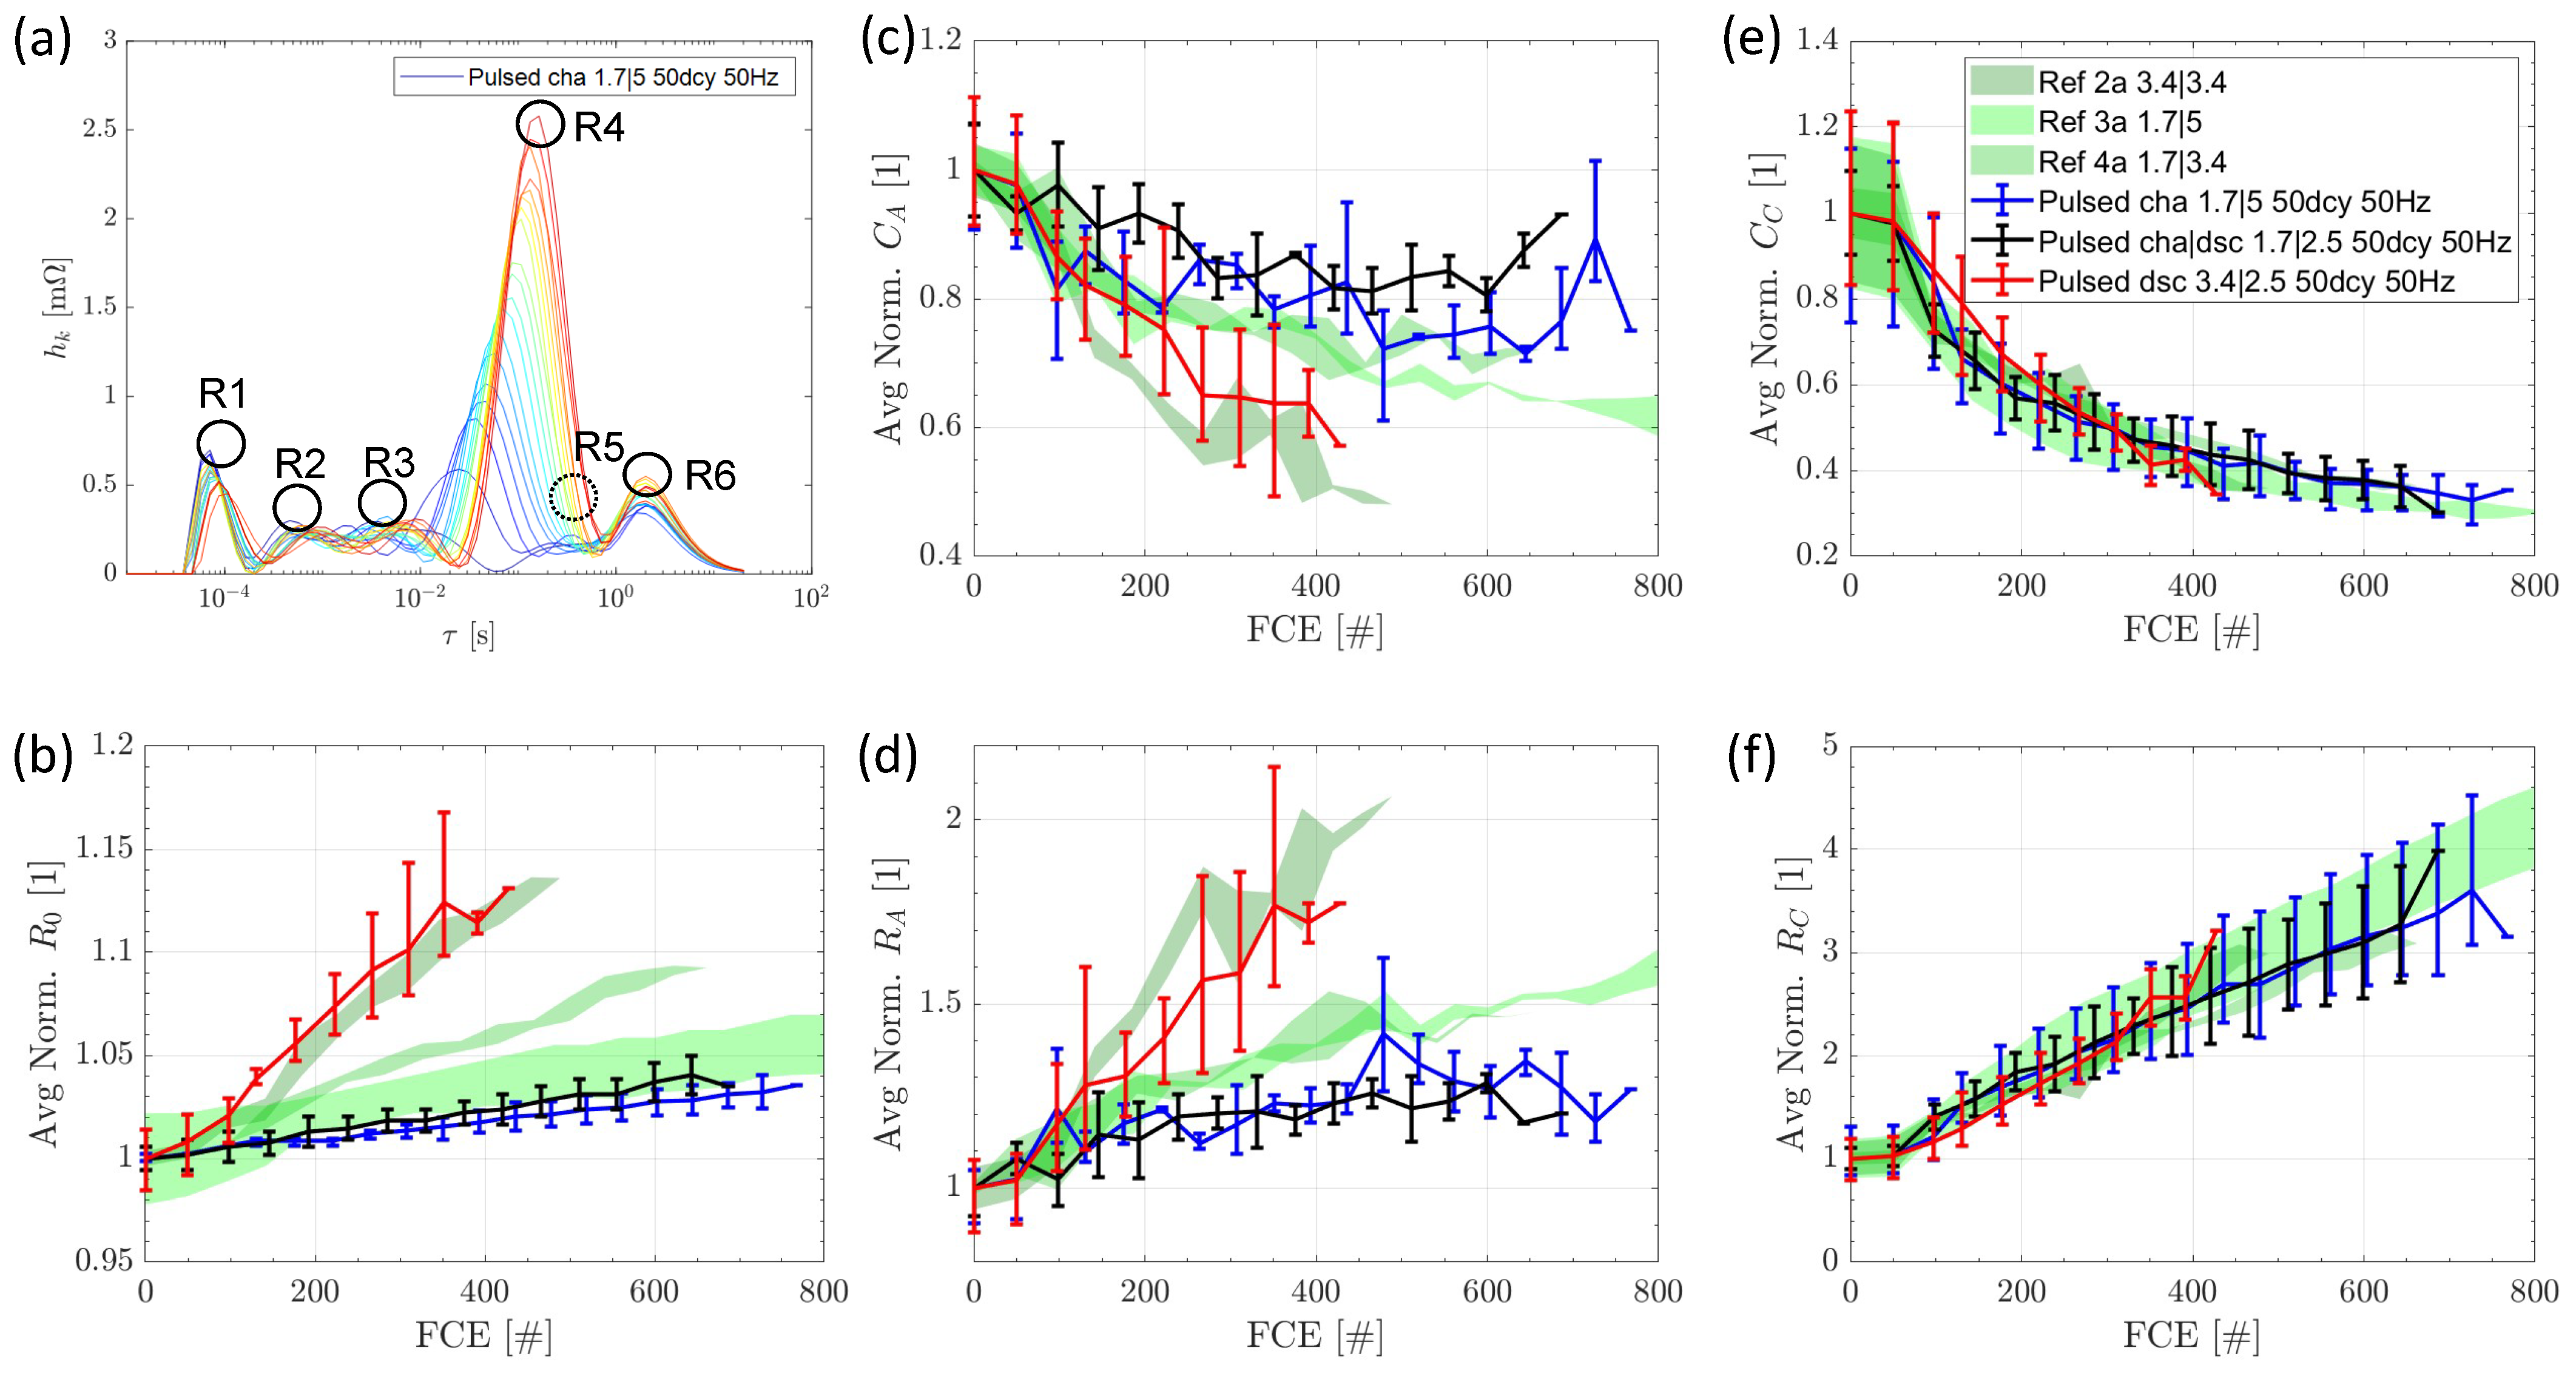
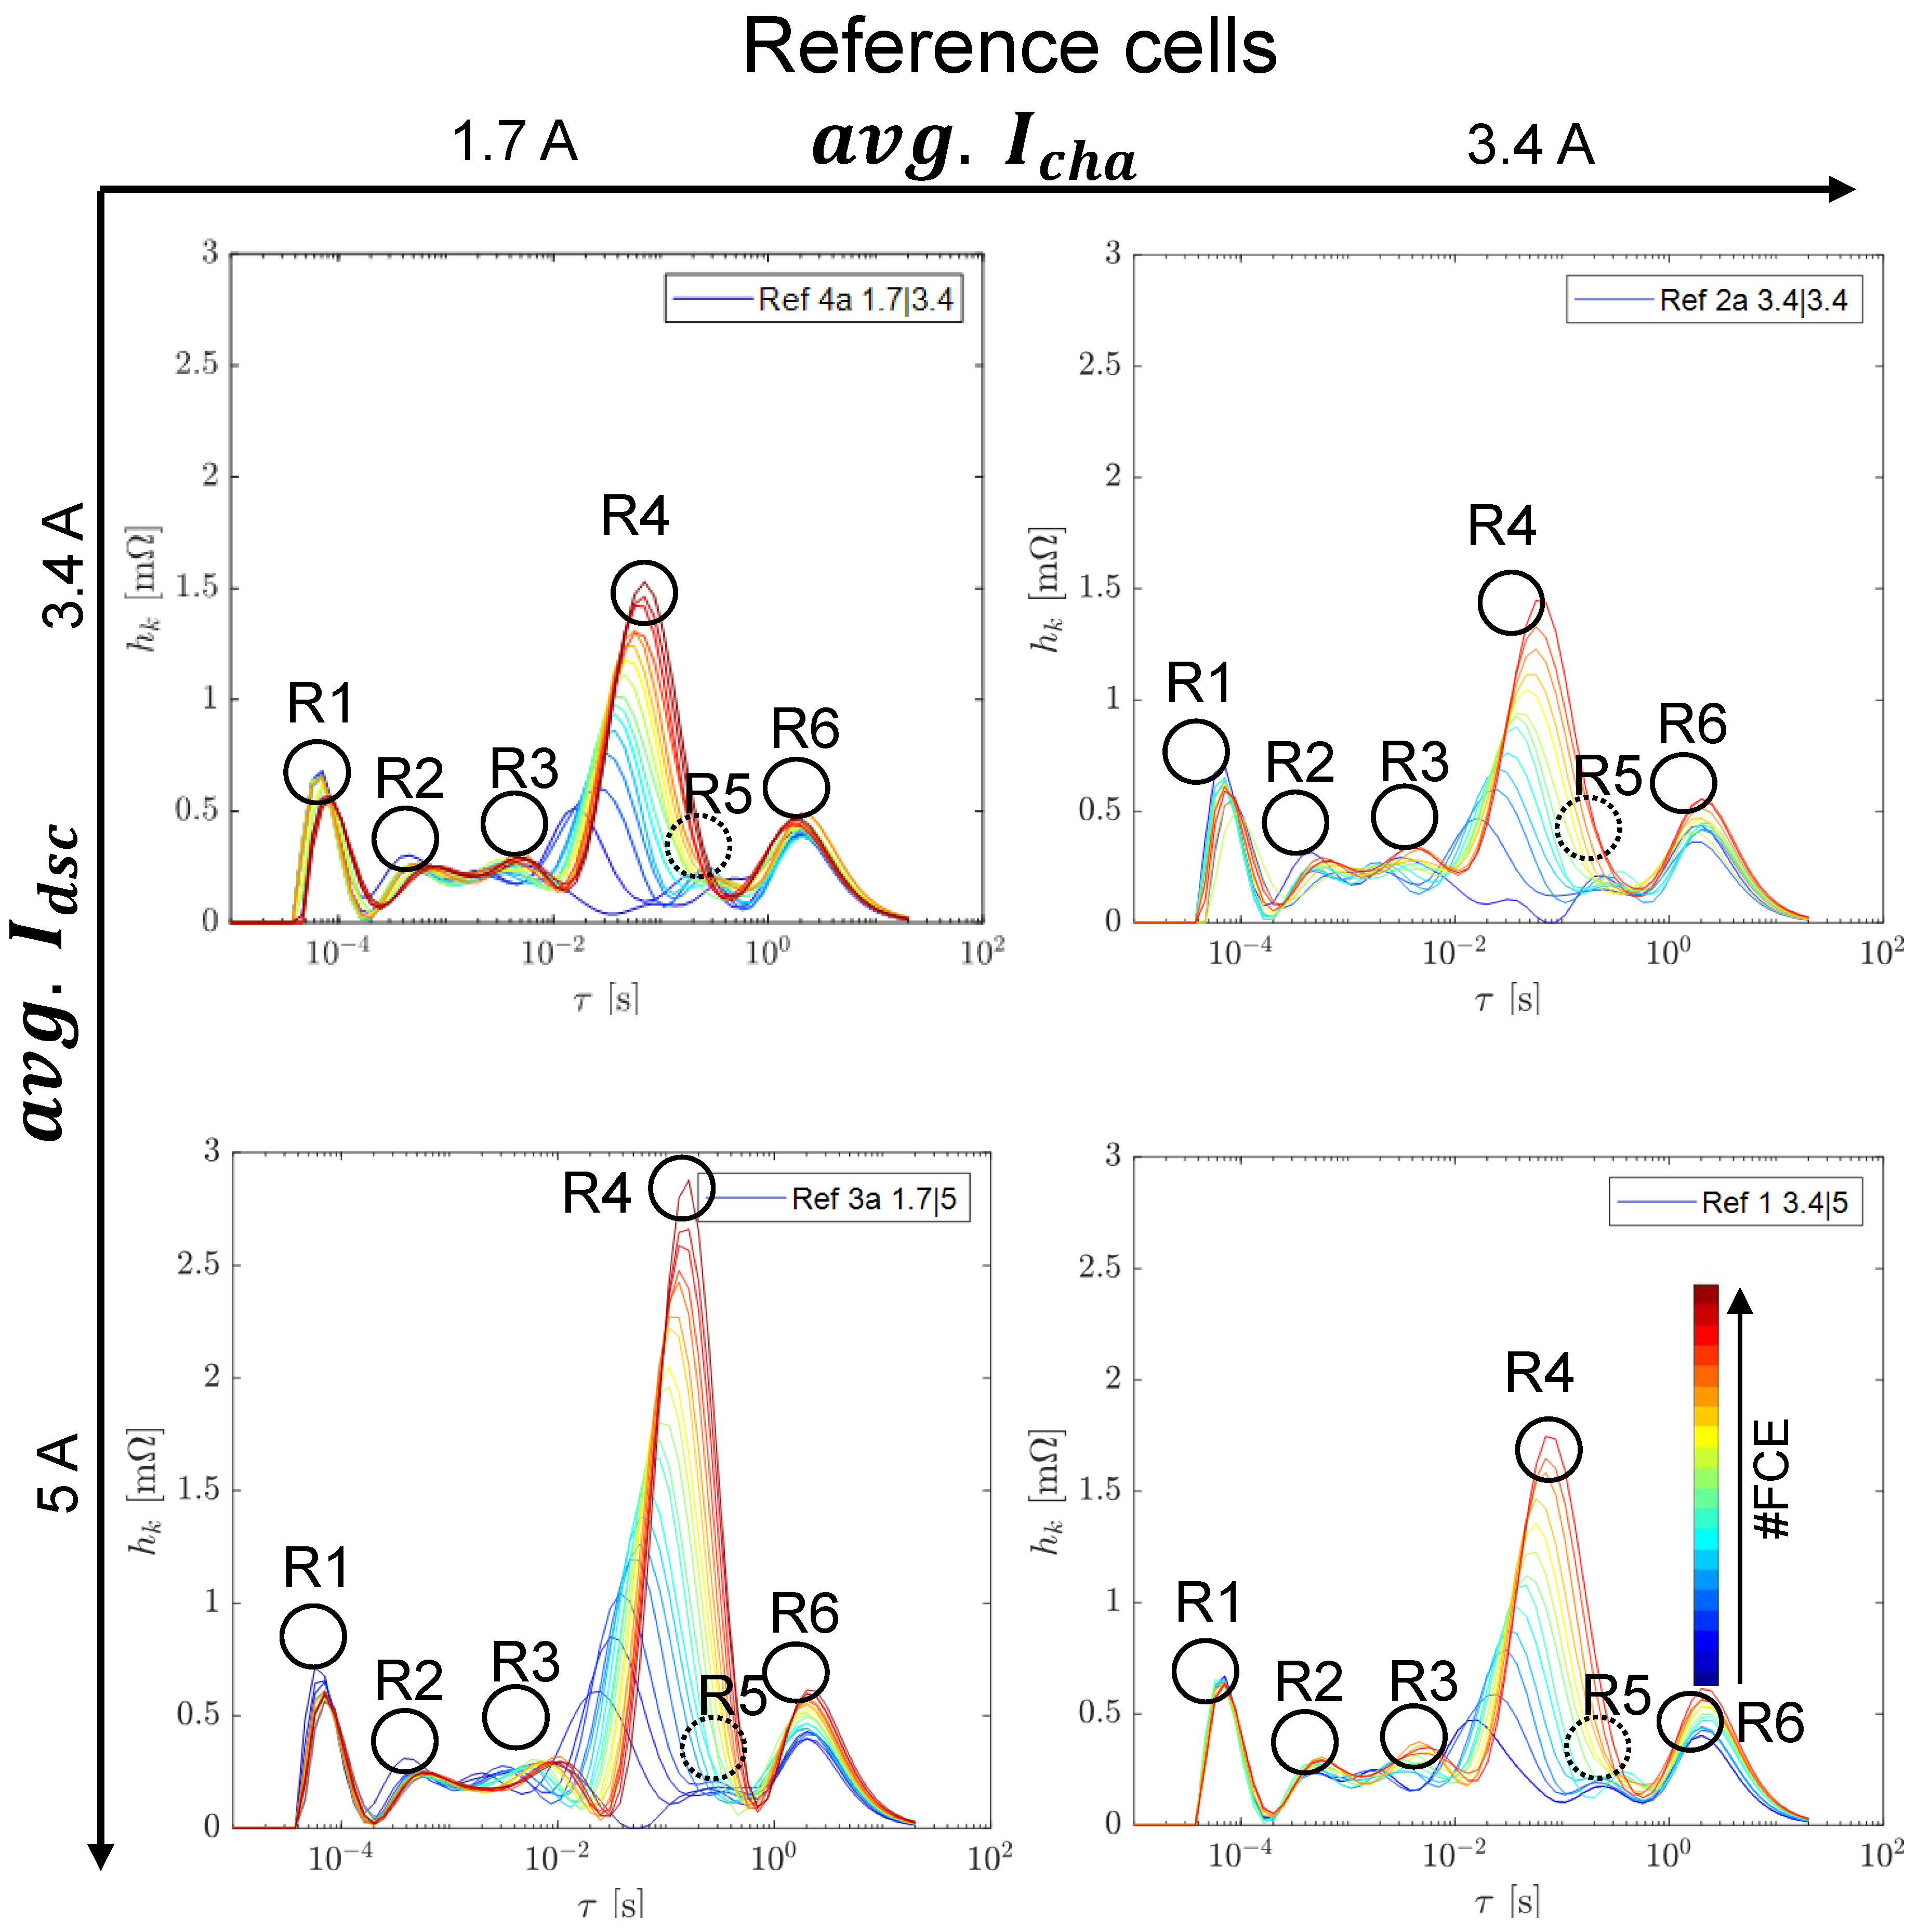
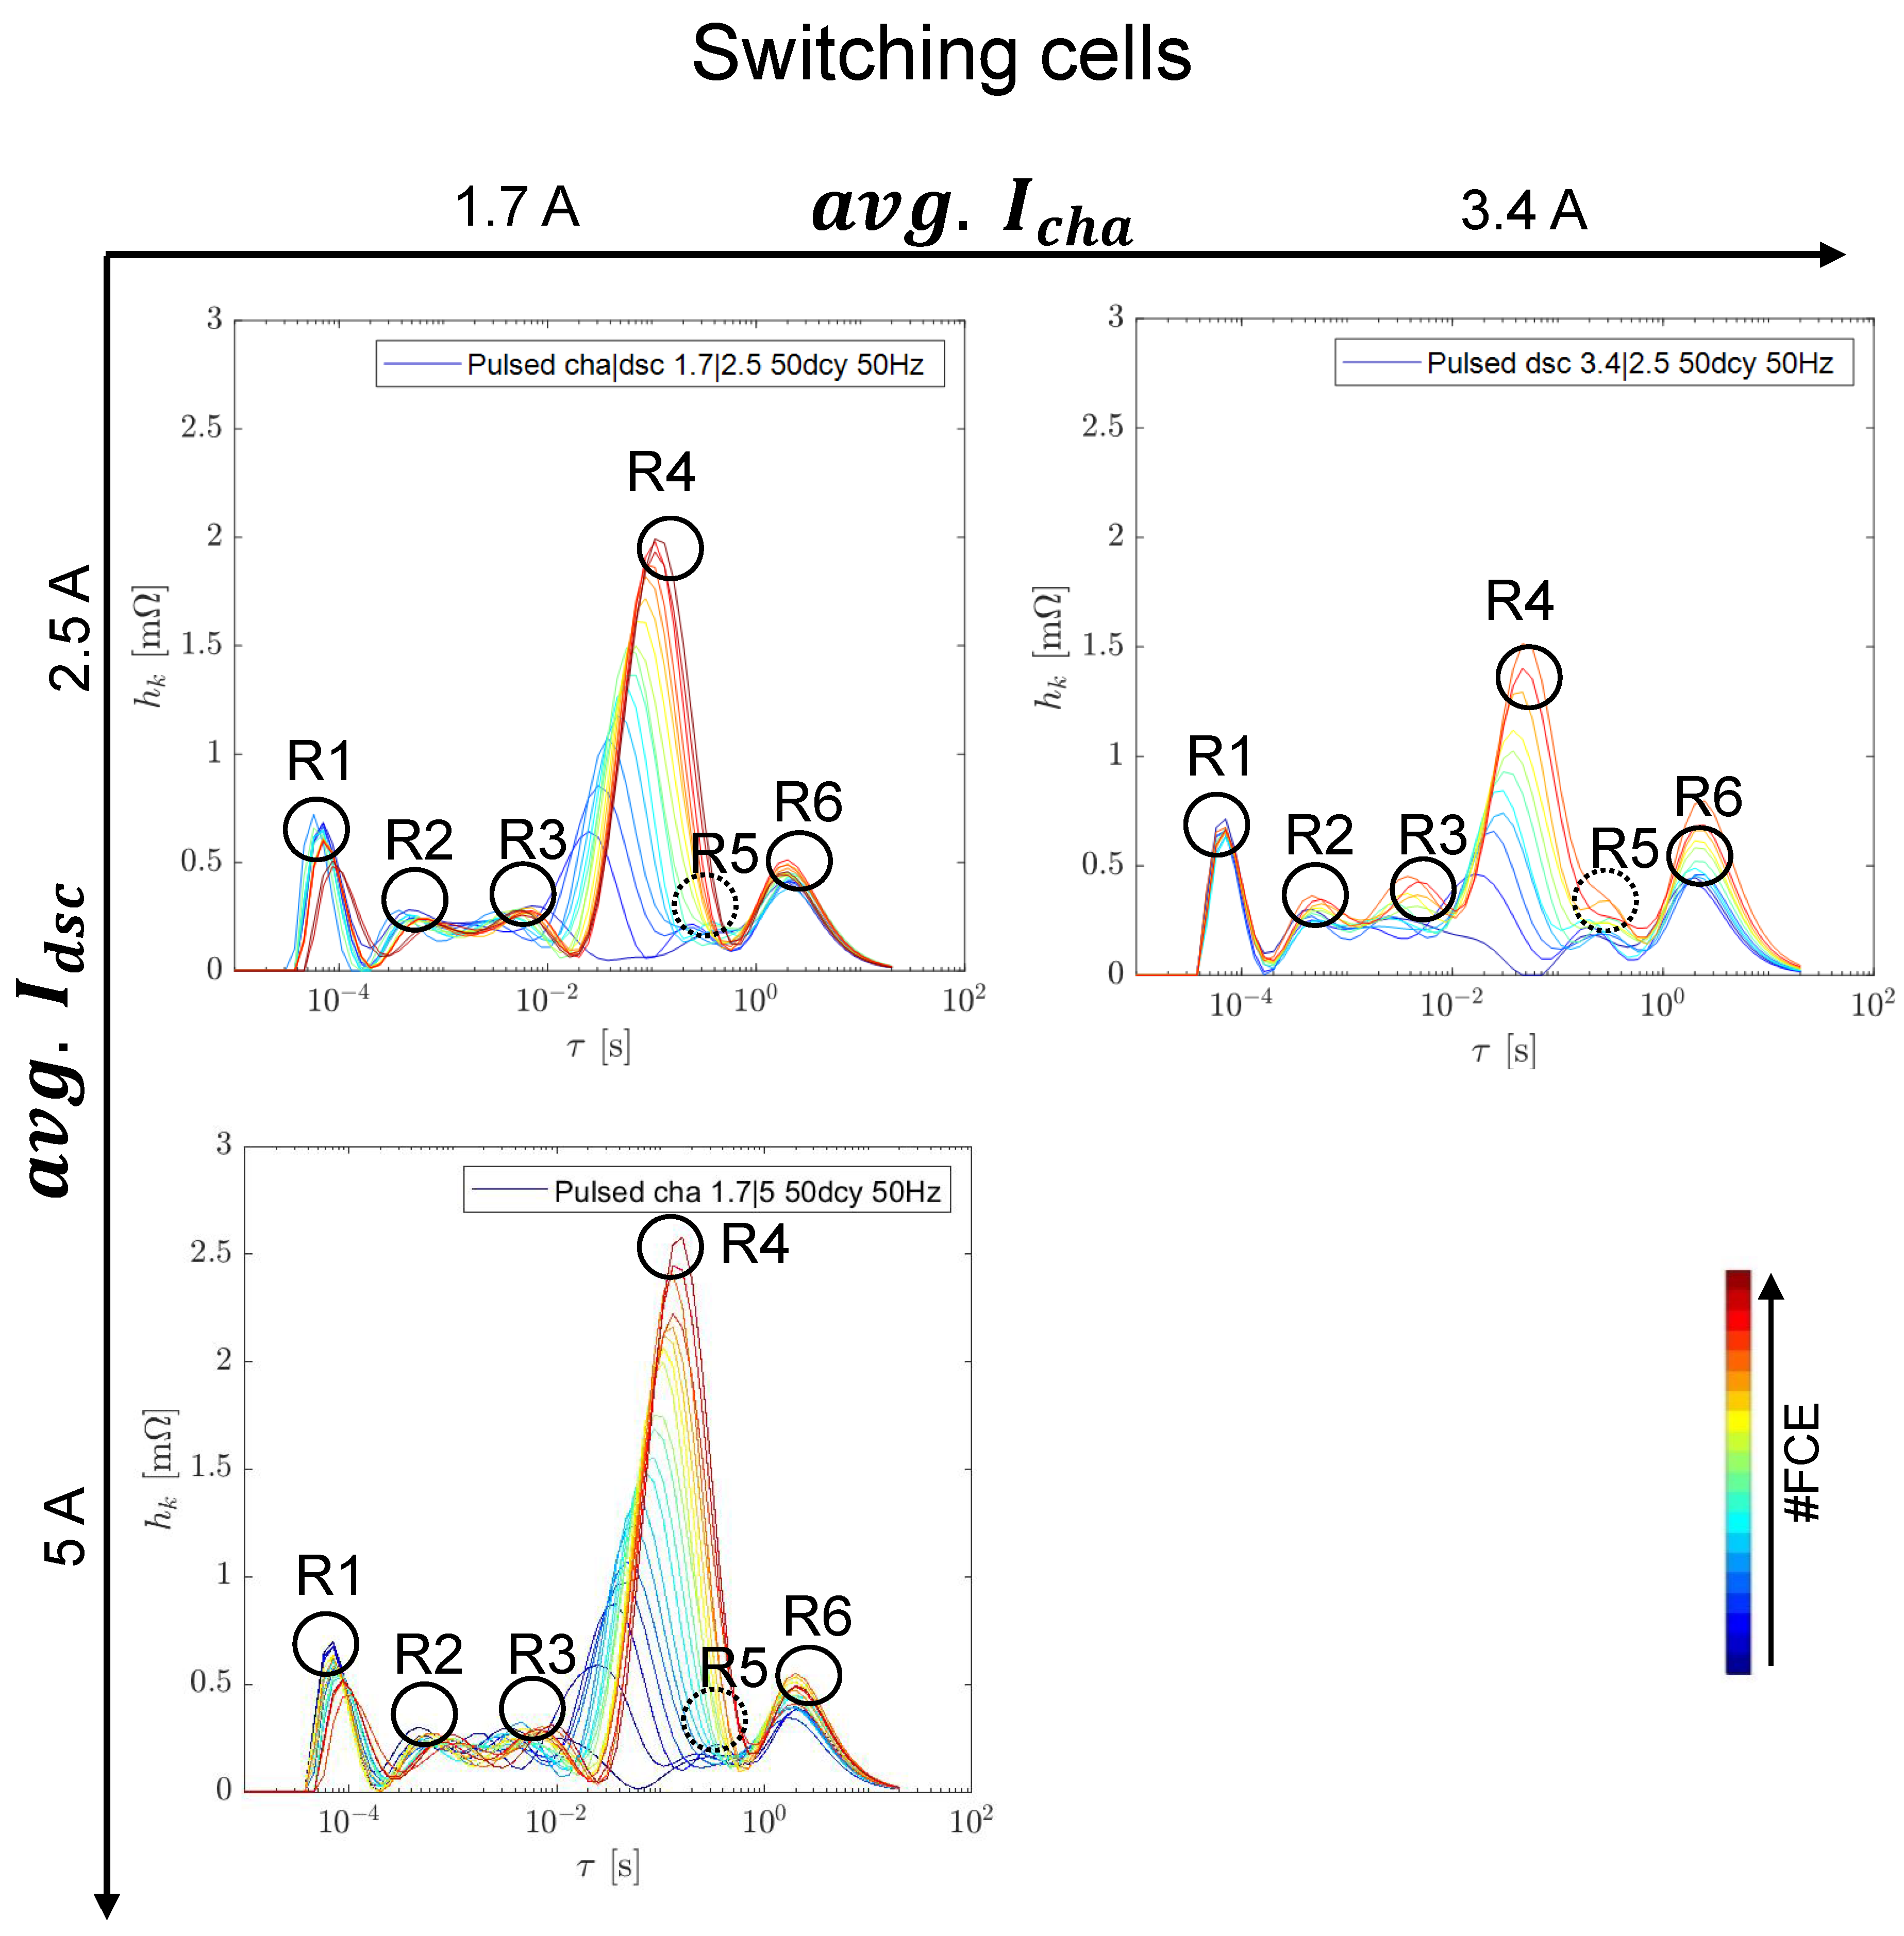
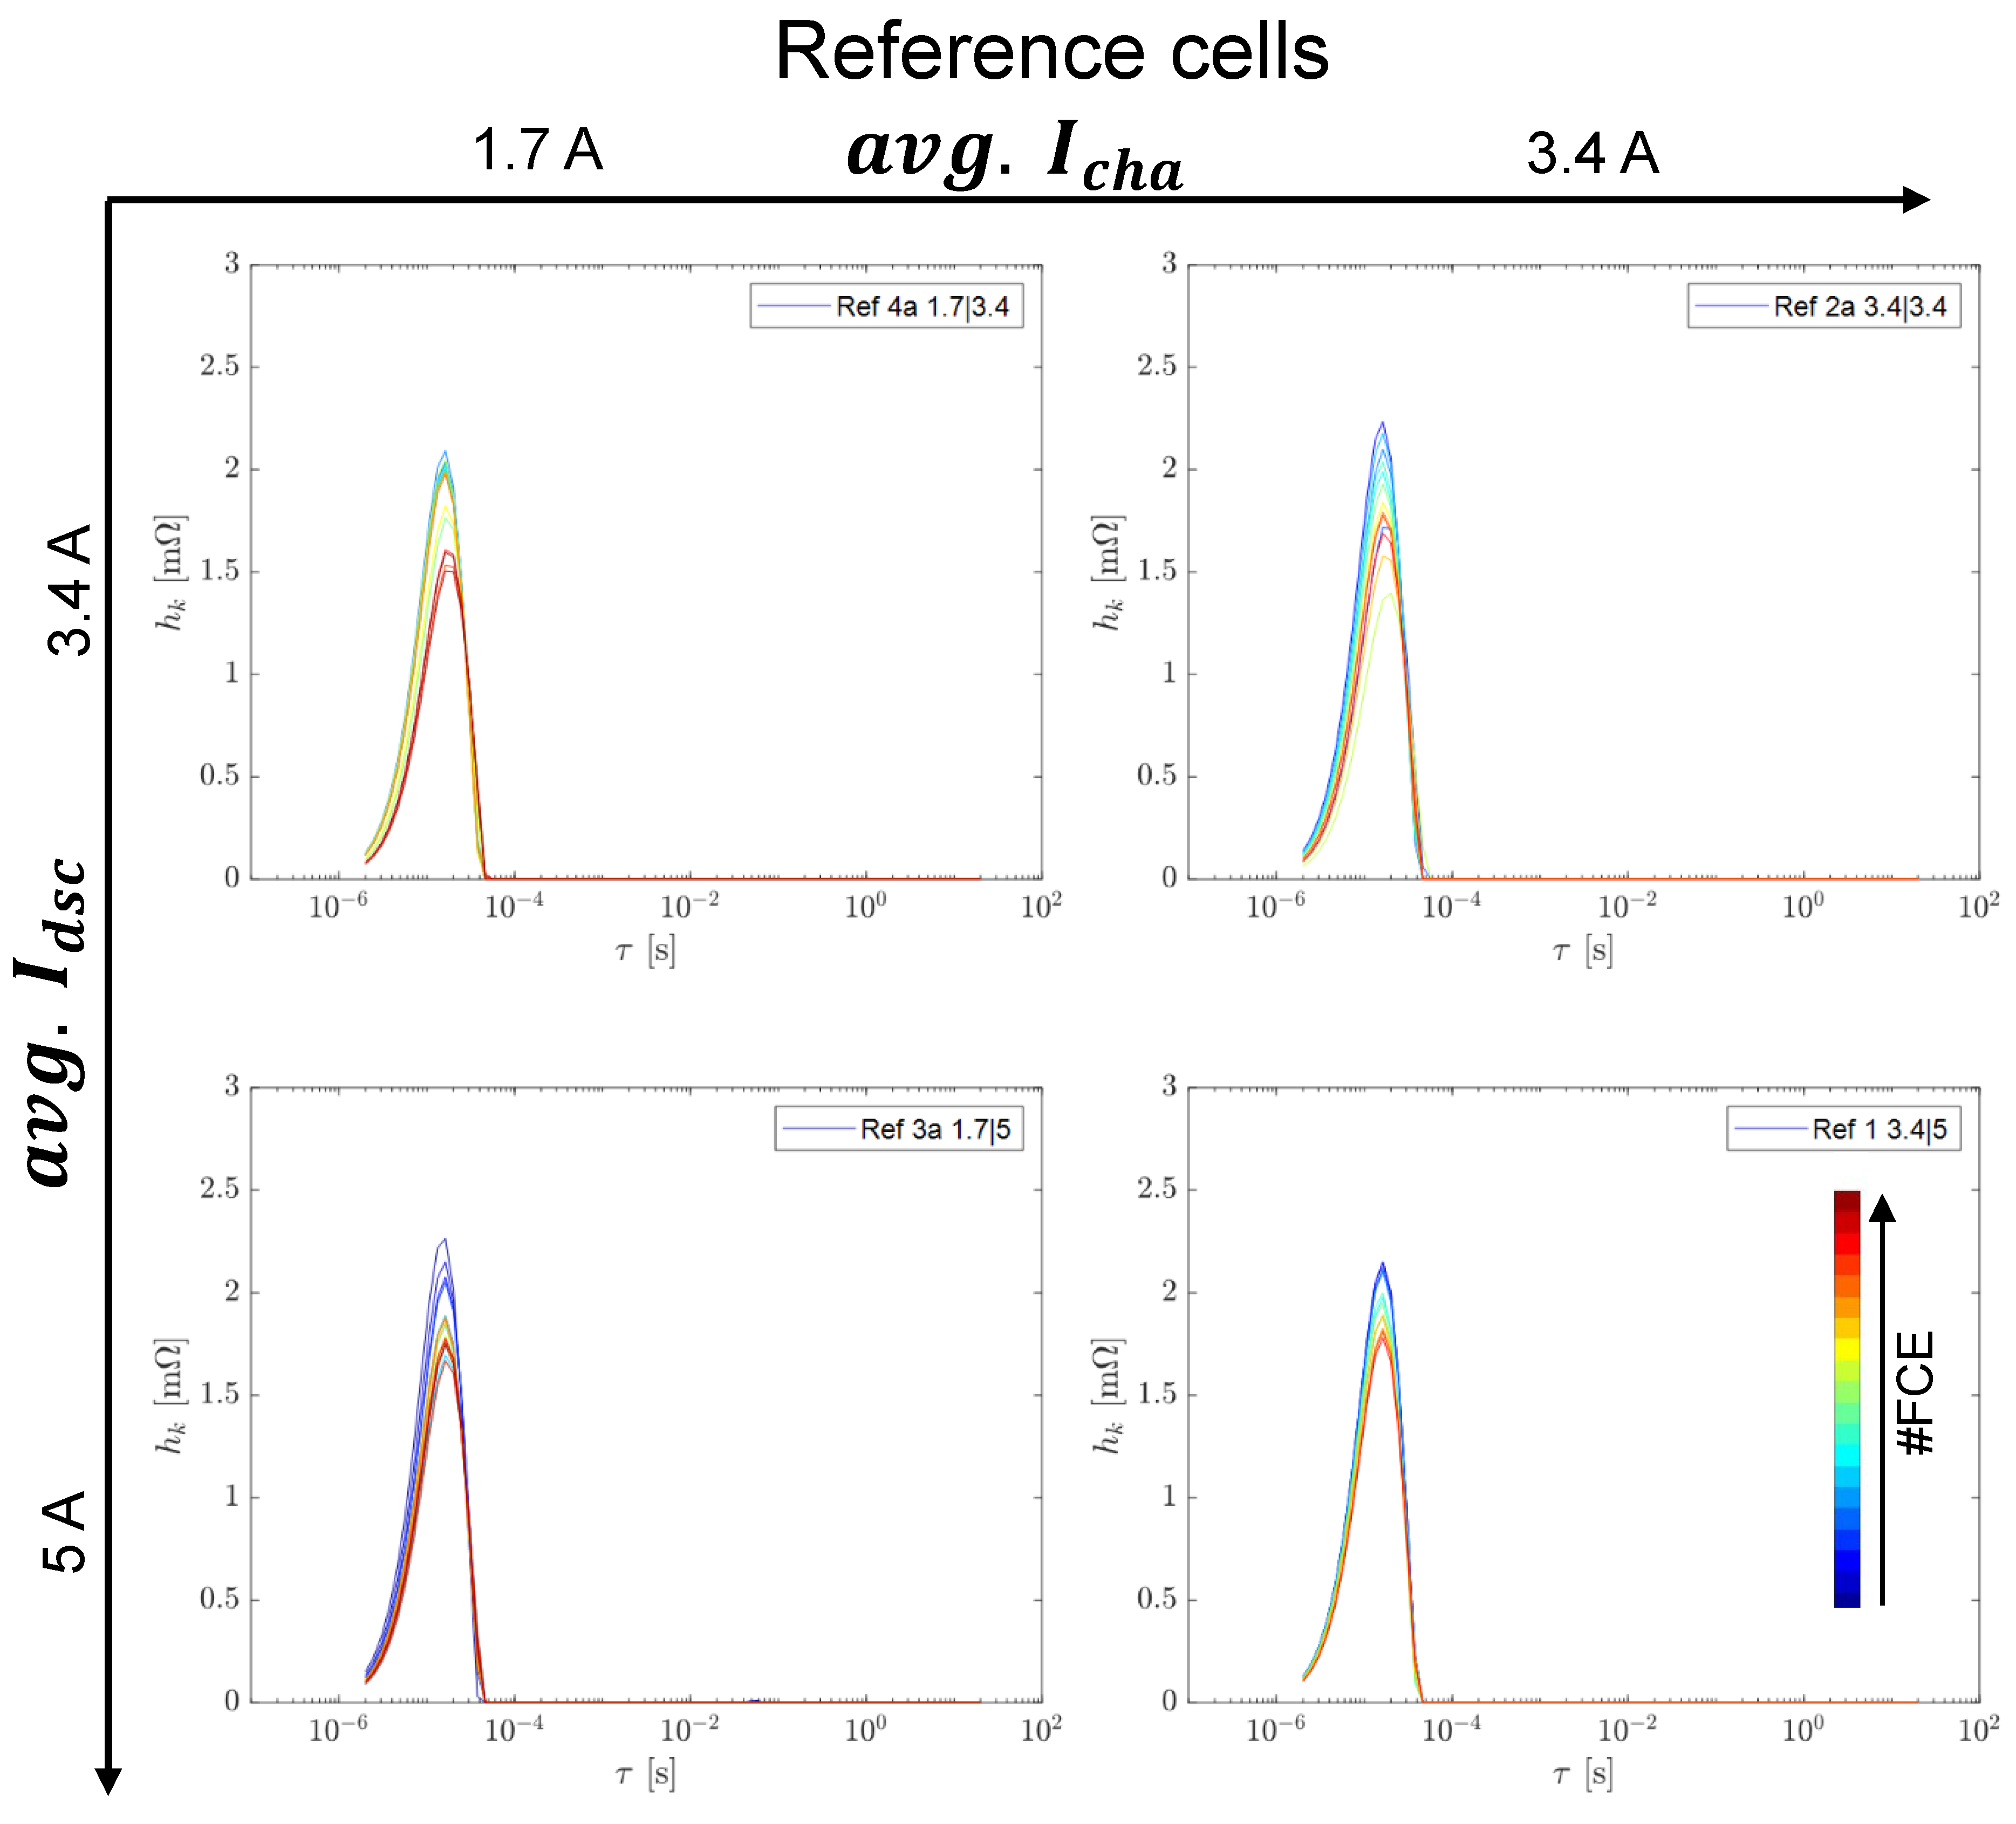
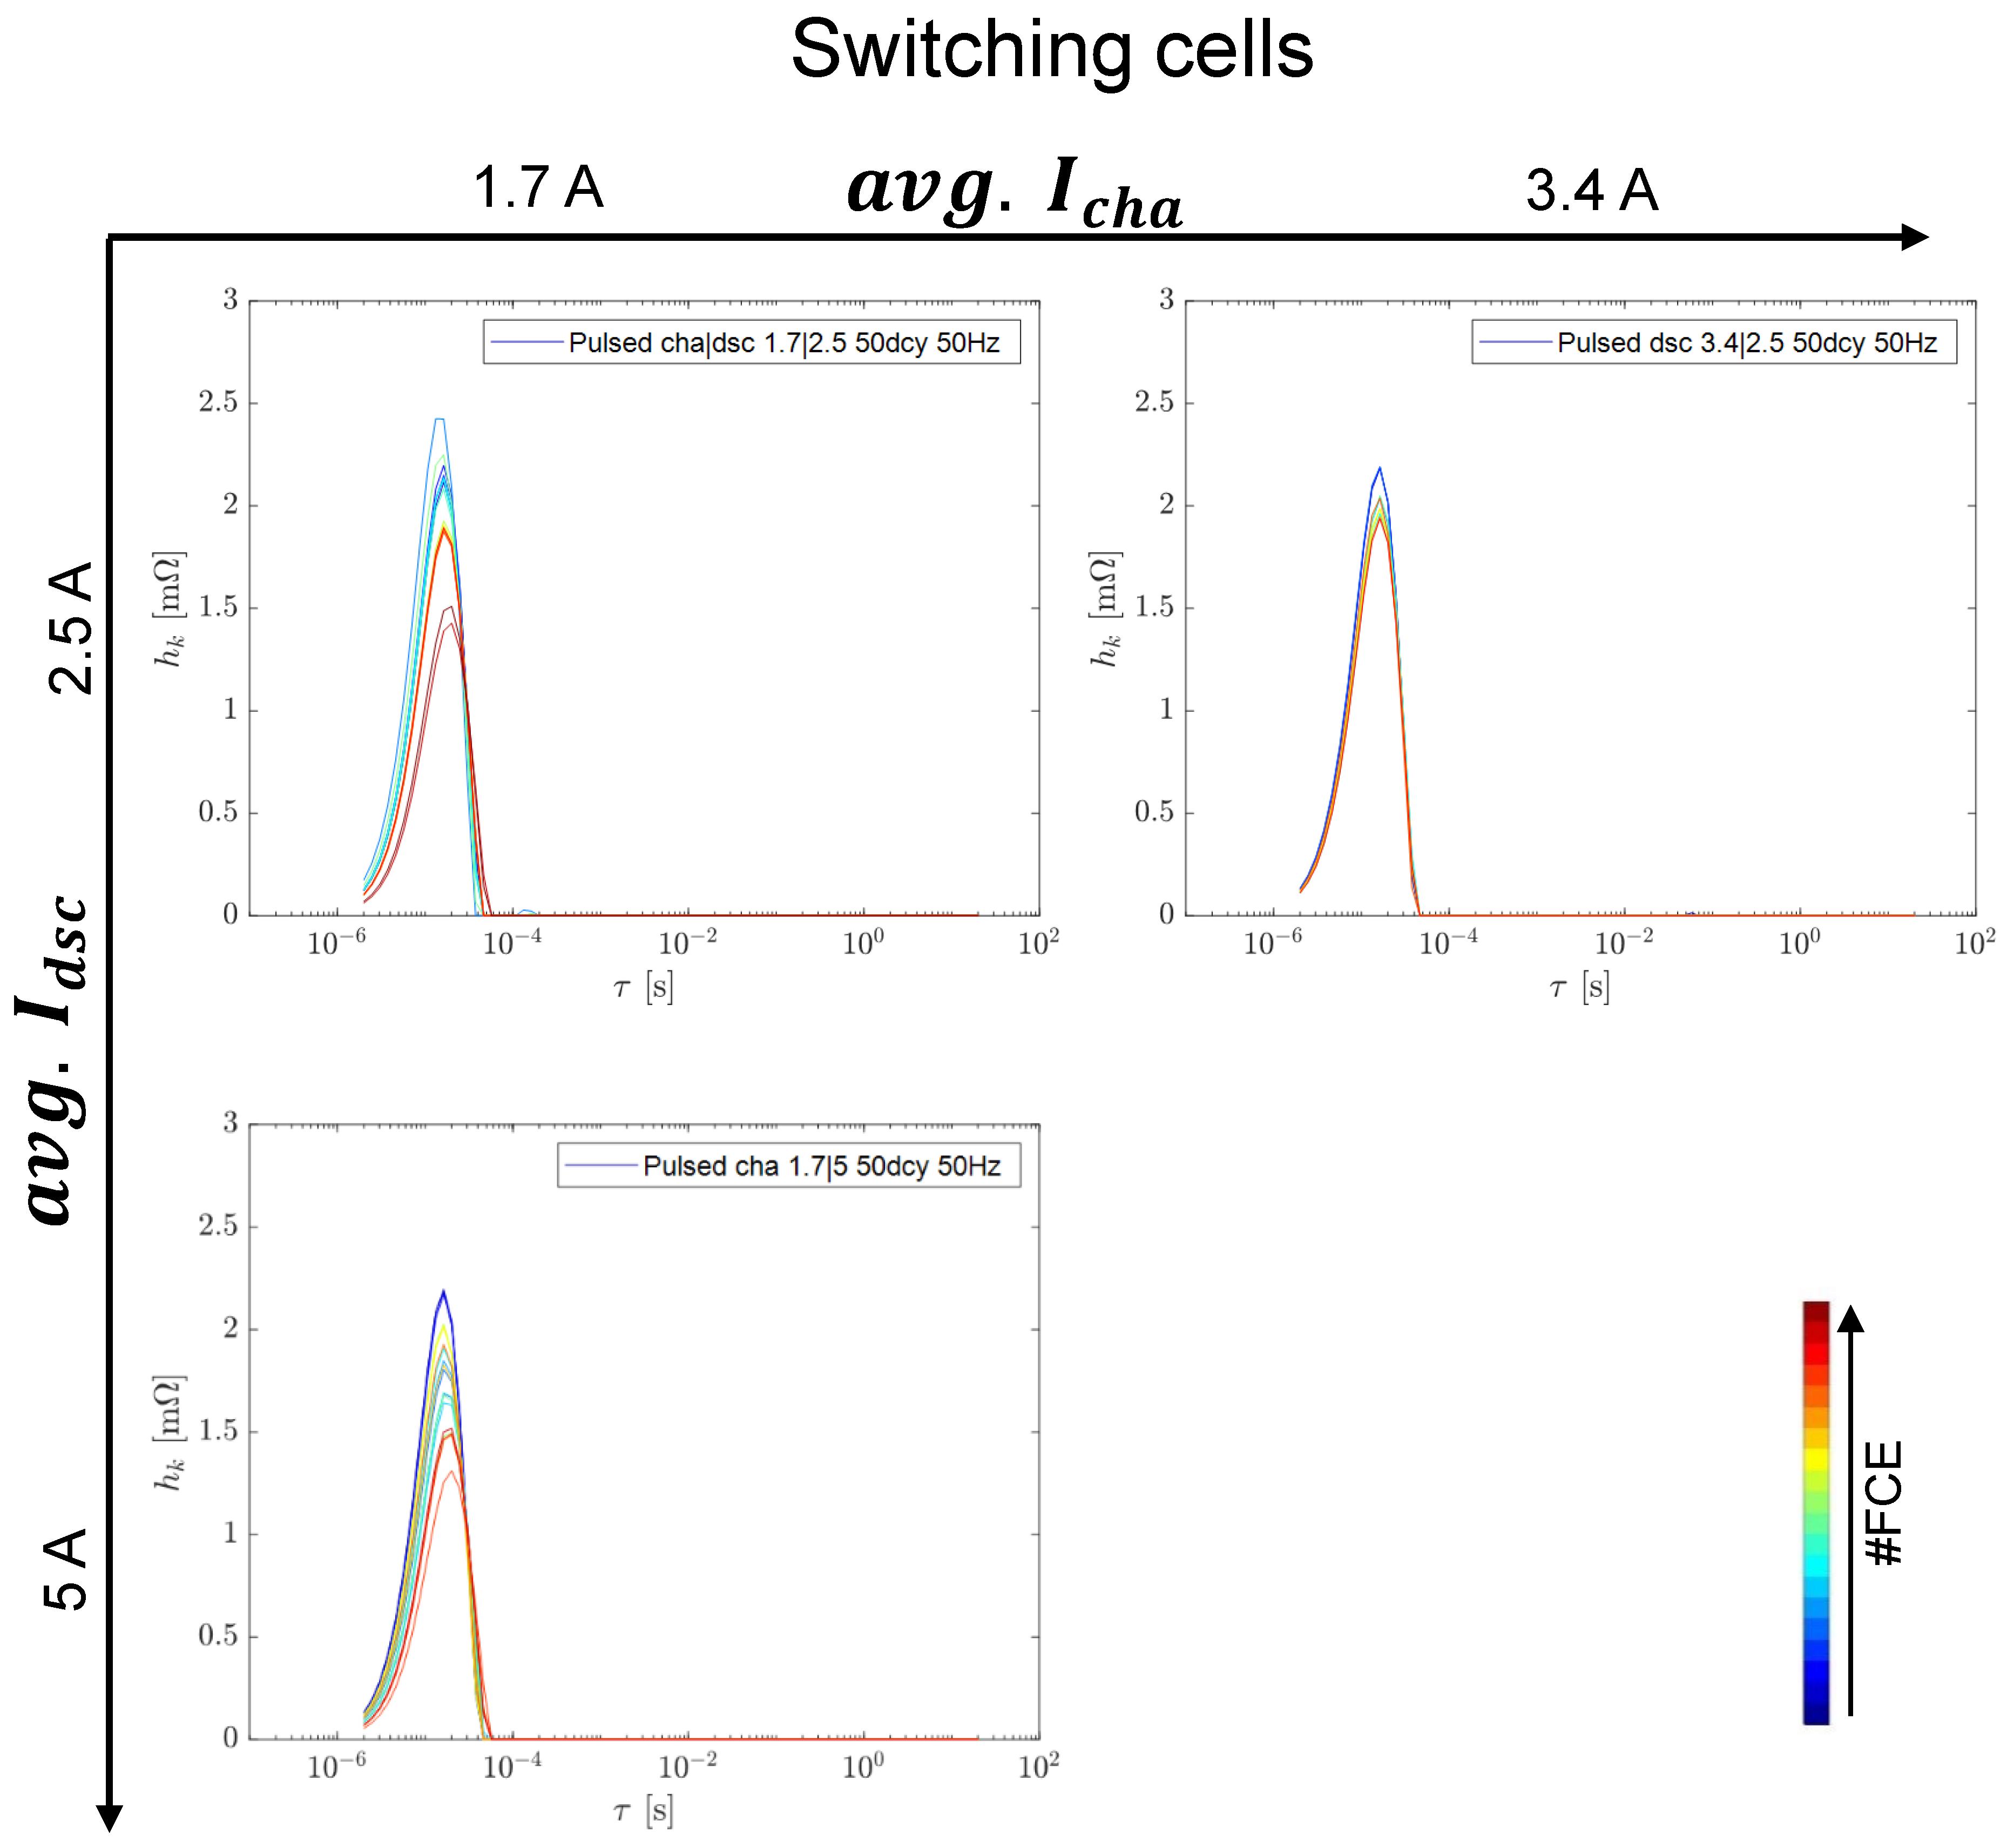
3.3.3. EIS Comparison including Reference Tests

To understand more about the influence of average current and switching, we analyzed the data for the reference tests and switching at 50 Hz using EIS. At first, the Nyquist plots are shown in Figure 8a for the reference cells and in Figure 8b for the switched cells. Nota bene, the discharge current during discharge at low currents is 2.5 A, while in the reference tests the current is 3.4 A. Due to a measurement error, we could not use the data for switching during discharge at low currents.
Depending on the average currents Idsc and Icha, each reference and switched cell was placed in a plot matrix. By increasing the average Icha, the intersection with Im{Z}= 0, also calculated and labeled later as R0, shifts towards larger Re{Z} values and, with this, higher R0 values. Another noticeable phenomenon in the Nyquist plots is that with increasing numbers of FCE, the half circle gets bigger, which corresponds to higher measured impedances. Thereby, reference and switching tests show similar courses in the Nyquist plots for similar or the same average charge currents.
As the curve shape is very similar for all test conditions, we used the GDRT method for evaluation. Figure 9a shows exemplarily the GDRT of a switching cell. To analyze the obtained data from the EC-Idea tool, the normalized values of the resistances and their corresponding capacitances are used. The GDRT identifies six peaks. The area underneath each peak resembles the value of the resistance R of one RC element. The time constant τ, at which the curve reaches its peak, is then used to calculate the corresponding C value according to τ = R C . Thus, GDRT returns data for five to six RC elements as the peak of R5 disappears in some cases with a higher number of FCE. The same analysis and calculation procedure is applied to all cells and is illustrated in the same manner as for the DVA analysis. The remaining GDRT spectra, including RL-elements, are summarized in Appendix A.
The parameter R0 represents the intersection with Im{Z} = 0, as mentioned earlier.
R1 shows a nearly constant normalized value course with an increasing number of FCE and varying switching techniques. This, in addition to its characteristic time constant, makes it attributable to the current collector / active material interface process [32].
It was reported that the SEI formation occurs before the charge transfer [33]. This is why R2 is allocated to the SEI process that is anode-related. As for R3 and R4, both of them are assigned for the charge transfer, with R3 being the anodic charge transfer resistance and R4 being the cathodic one [34]. For a better overview, both peaks R2 and R3 are summarized into one process resembling the anode. Resistance and capacitance are labeled as RA and CA, respectively. In addition to these parameters, R4 will be labeled as RC and CC, resembling the cathode.
The last two peaks, R5 and R6, have a high time constant and showed a noteworthy FCE dependency, thus making them attributed to the solid state diffusion process [35]. Boukamp mentioned in his paper that the solid-phase diffusion can be represented by several RC elements, resulting in a characteristic sequence of peaks with reducing amplitude for smaller time constants. However, the frequency range where the diffusion occurs, also lies in lower frequency ranges than the ones measured during the EIS (f~103 Hz). This results in an inaccurate analysis of the diffusion process, and the diffusion effect will not be further investigated for this publication.
The results obtained from GDRT are presented in Figure 9b–f for the different parameters. It can be seen from Figure 9b that R0 behaves similarly to the pulse resistance and is already eye-caching in Nyquist plots. The cathode shows a similar course for the resistances and capacitances for all three switching techniques (see Figure 9e,f). This supports the findings of the DVA in the previous sections. The anode fluctuates much more, but it also shows the same results as the DVA, as depicted in Figure 9c,d for the resistance and capacitance, respectively. All switching mechanisms show better behavior in terms of lower capacitance losses compared with their respective reference cells. The charging/discharging techniques show a slightly better course than the charging technique.
Wu et al. [16] proposed cathode cracking due to fast charging in their literature review; however, we did not find any difference in cathode aging for all reference tests and switching tests. To the best of our knowledge, no DRT or GDRT were published evaluating pulsed charge or discharge.

3.4. Switching Tests at 10 kHz

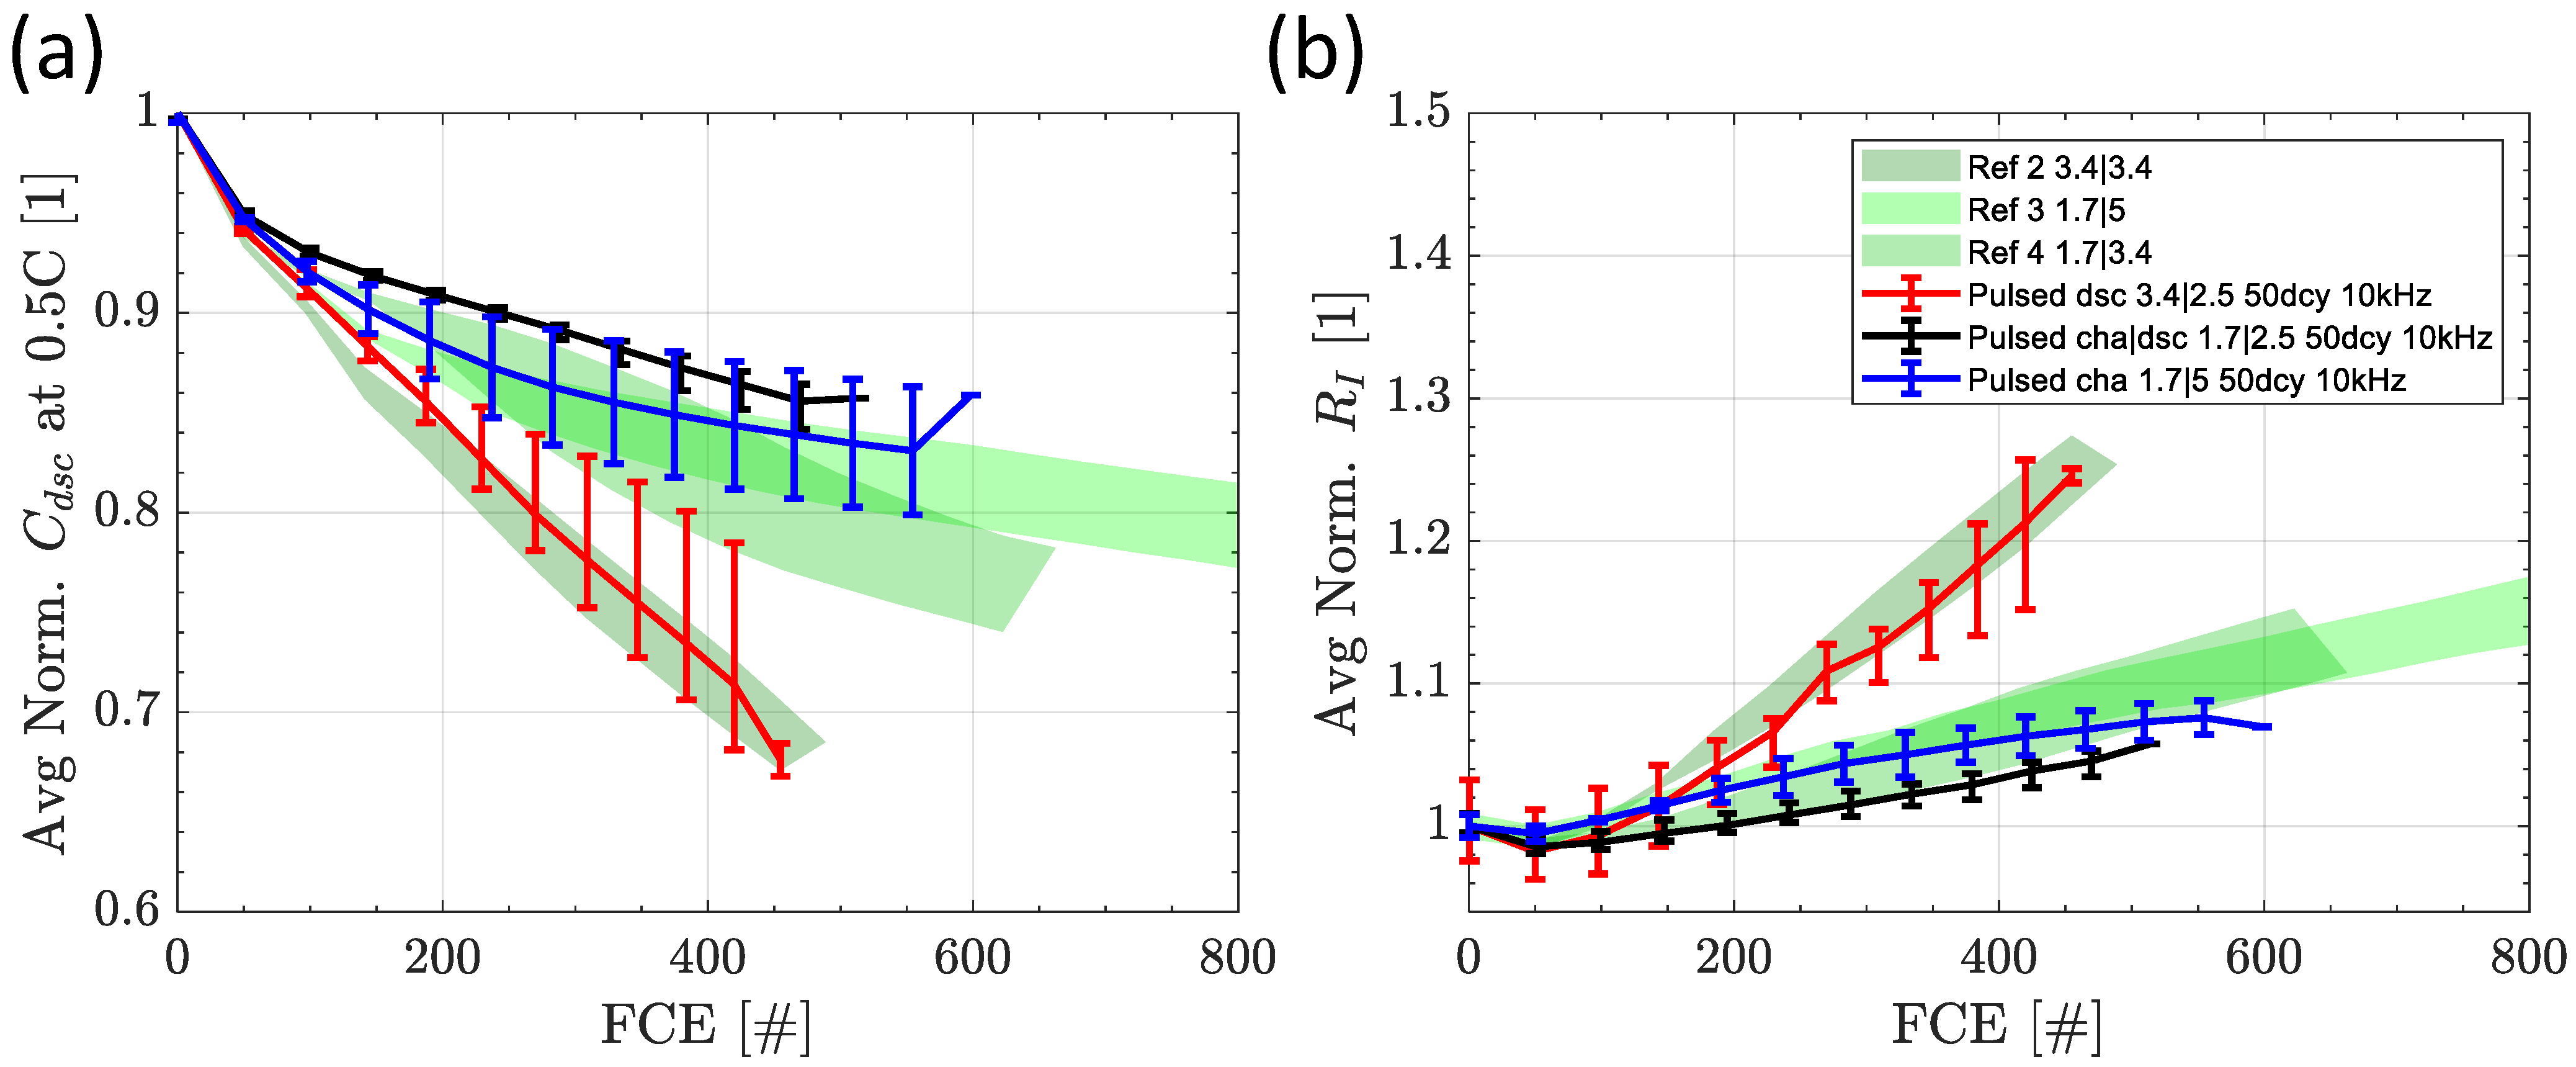
3.4.1. Influence of Switching Strategy at 50% Duty Cycle

In this section, the tests from Section 3.3 are repeated at a higher frequency of 10 kHz using switching boards. The results are given in Figure 10 for (a) capacity and (b) resistance. The only difference is that no additional test for dsc at a low charge rate was performed. At 10 kHz, the results show the same trends as for 50 Hz. The switching during cha|dsc is the best and performing better than the references; cha is slightly better than the references, and dsc is in the order of the corresponding reference cells. The only difference when comparing dsc is the lower cell-to-cell variation, showing no very weak cells but one better-performing cell at 10 kHz. The DVA results are in line with the 50 Hz results and are therefore not shown here. This is in contrast to the findings of Kannan et al. [31], who proposed stronger aging at lower switching frequencies.
We conclude that the general pattern for the different switching strategies is independent of the frequency for the two tested frequencies, and potentially the cell-to-cell variation decreases with higher frequencies during discharge.

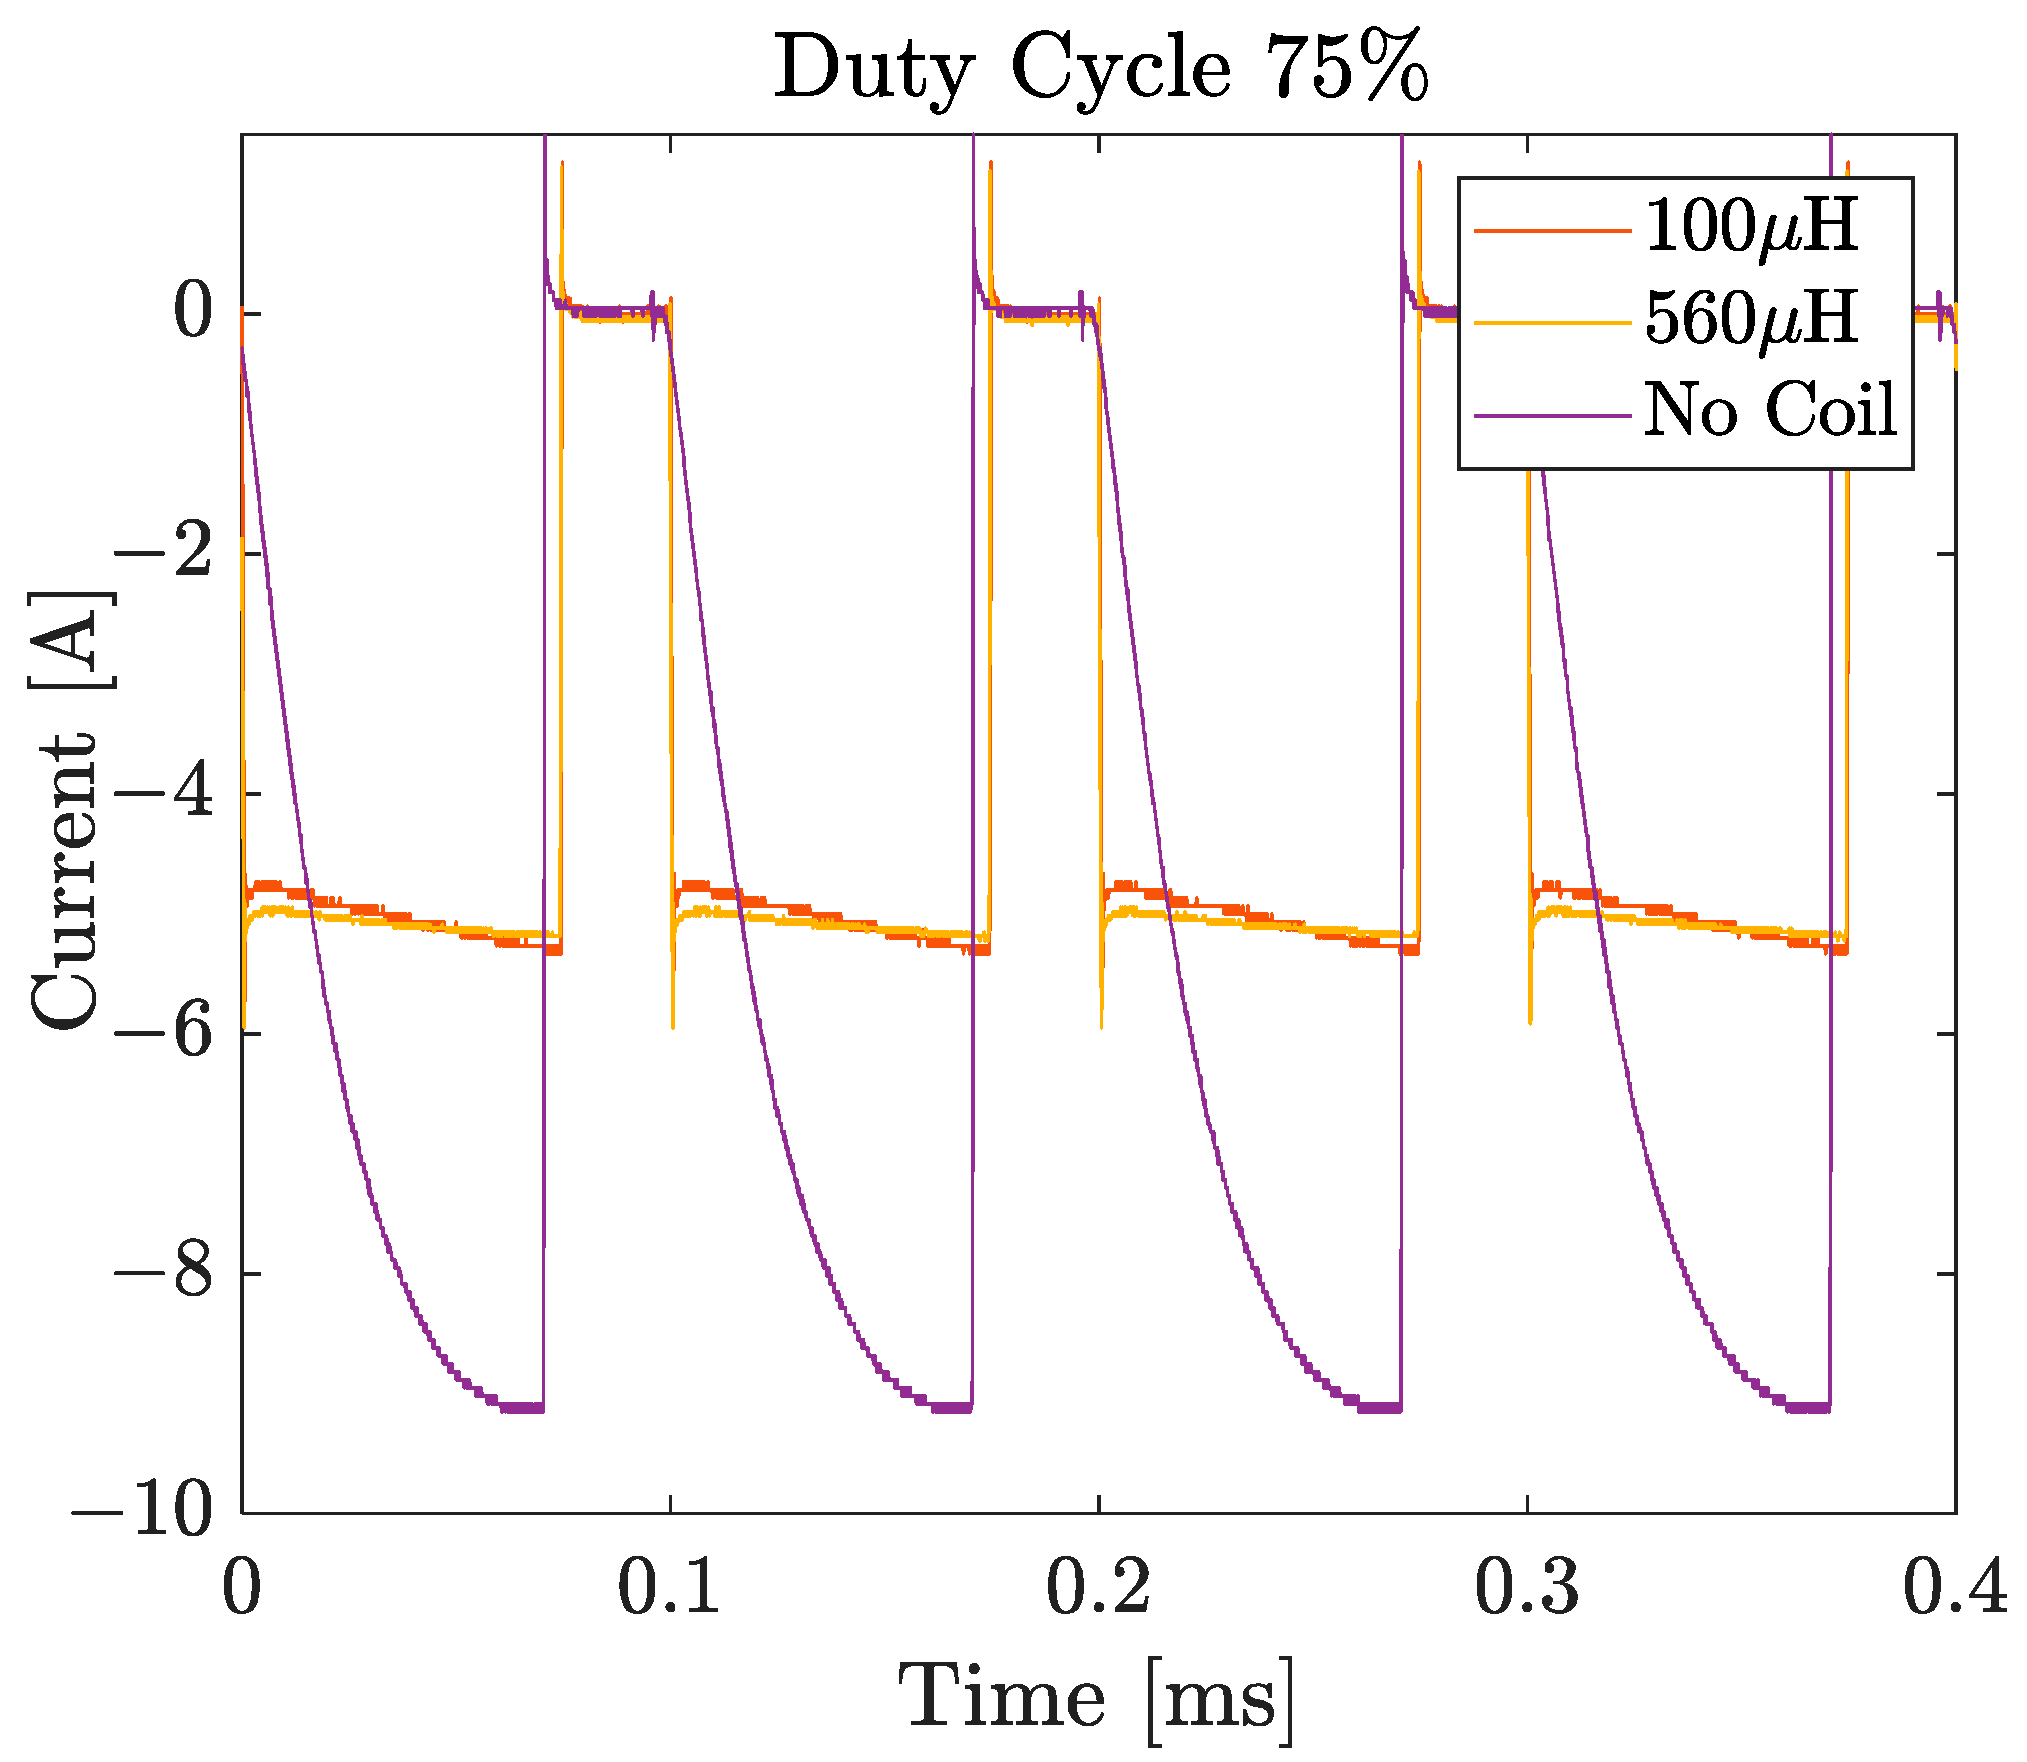
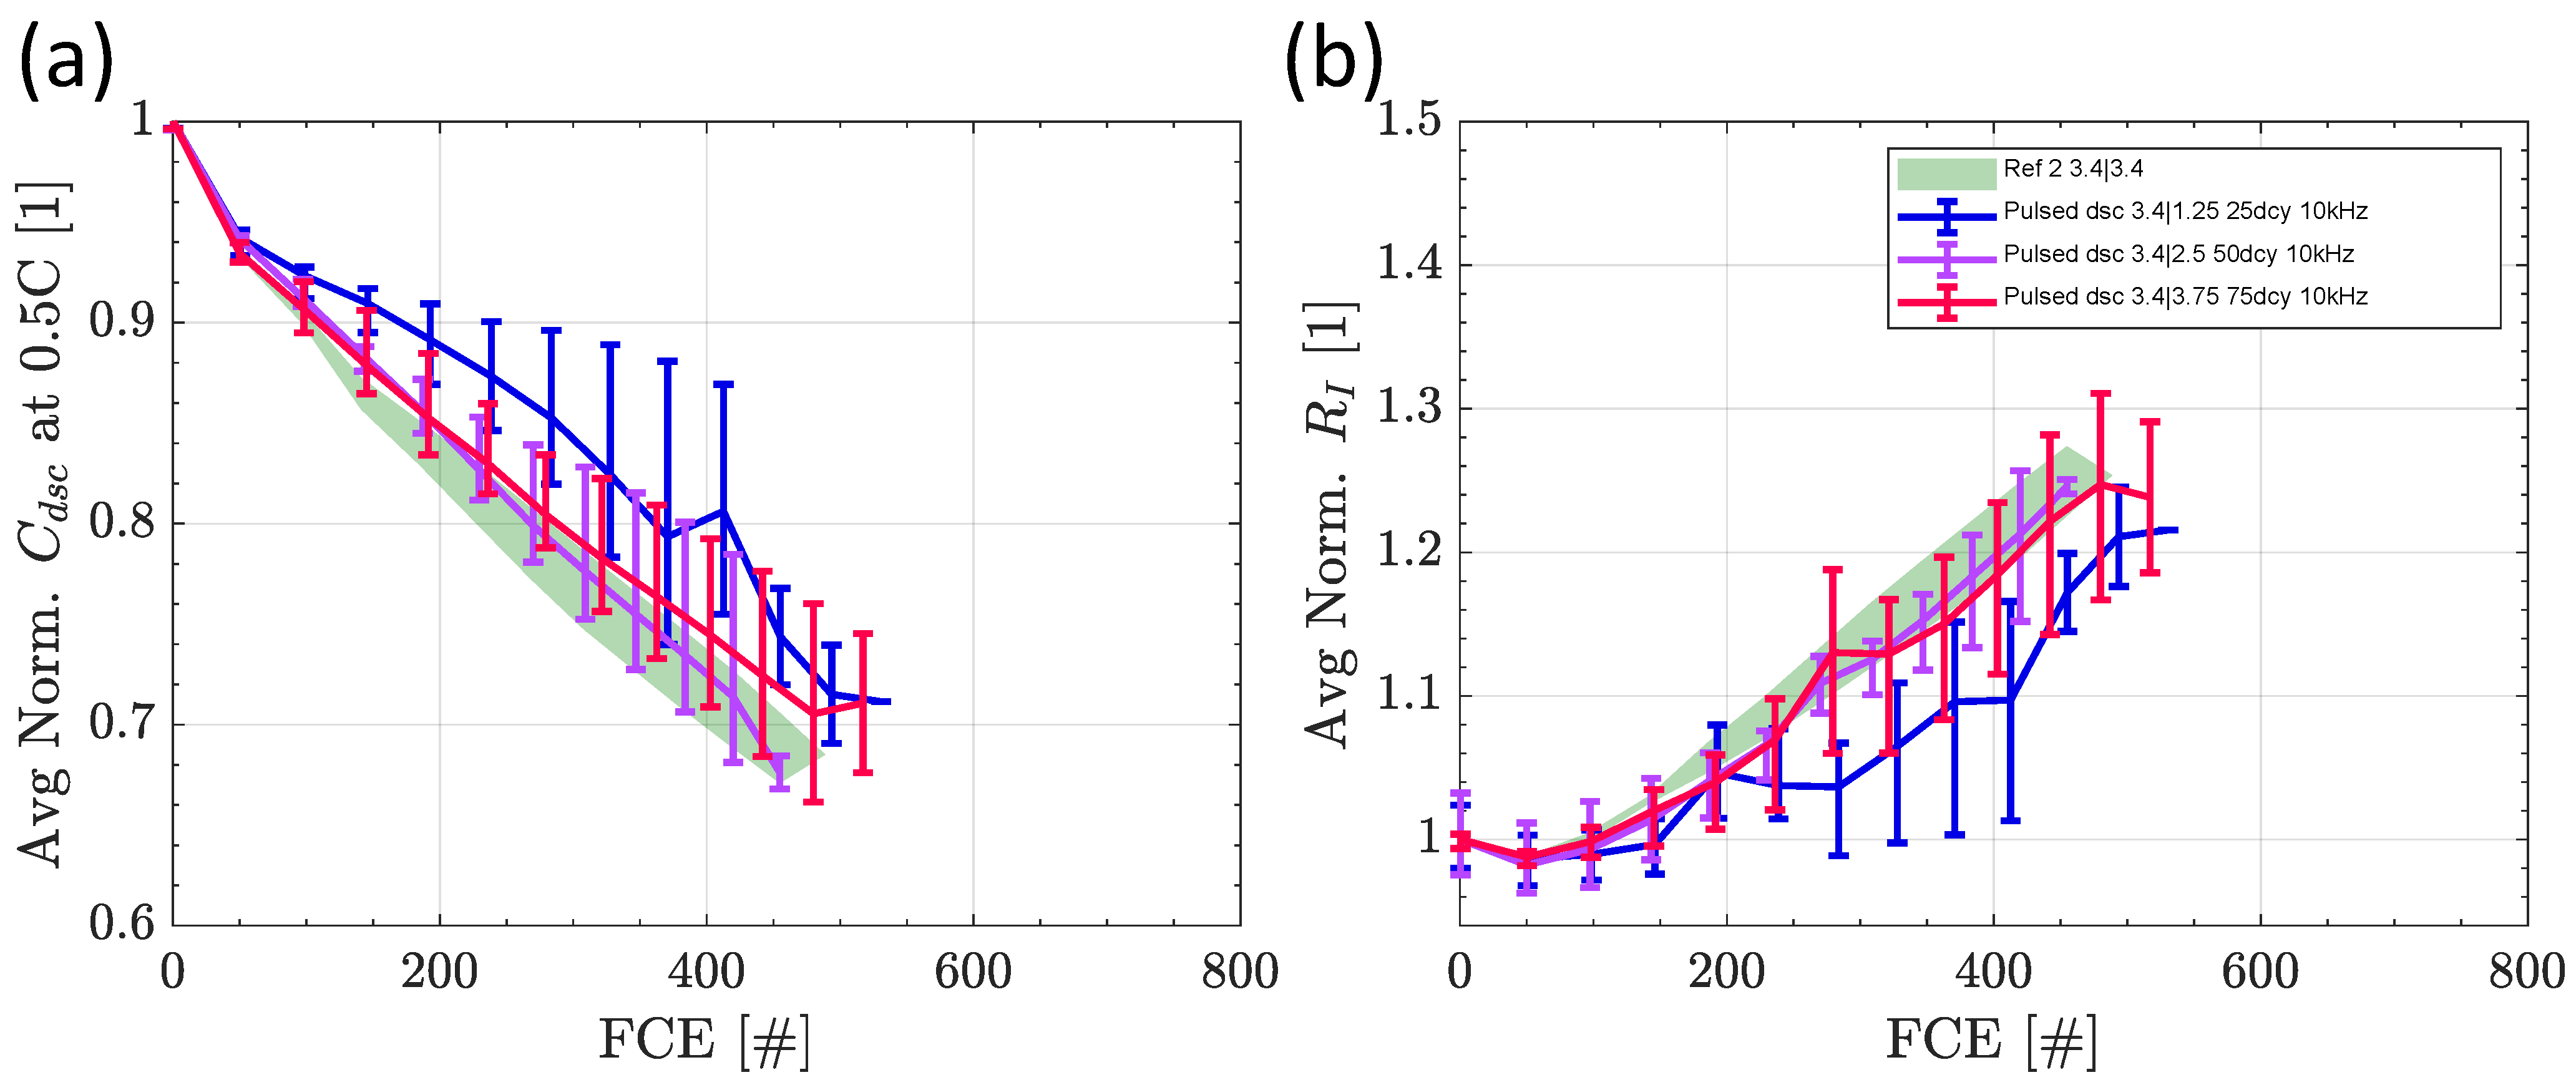
3.4.2. Influence of Duty Cycle at 10 kHz

Tests are conducted for different duty cycles, representing the pulse duration in each period. The duty cycle was tested at 25%, 50%, and 75% for the direction of charge, discharge, and charge/discharge. As the results show comparable results, we demonstrate the behavior of capacity and resistance on behalf of the cell discharge in Figure 11. As reported before, the capacity loss and the internal resistance show mirror image results. The trends for 50% and 75% are on top of each other and do not show any relevant difference. Only the duty cycle (dcy) of 25% has a clear lower aging trend. At 25% dcy during discharge, the average current is very low at 1.25 A (and 0.85 A during cha), even compared with the checkup with maximum charge and discharge currents of 1.7 A. The positive effect of resistive heat during discharge that we observed for 3.4|5 of the reference cell is likely not observed here because the resistive heat at 3.4|3.75 is still too low. Only the cell-to-cell variation seems to be comparably high. For cha and cha|dsc, the number of cells for each test was too low to estimate the cell-to-cell variation reliably.

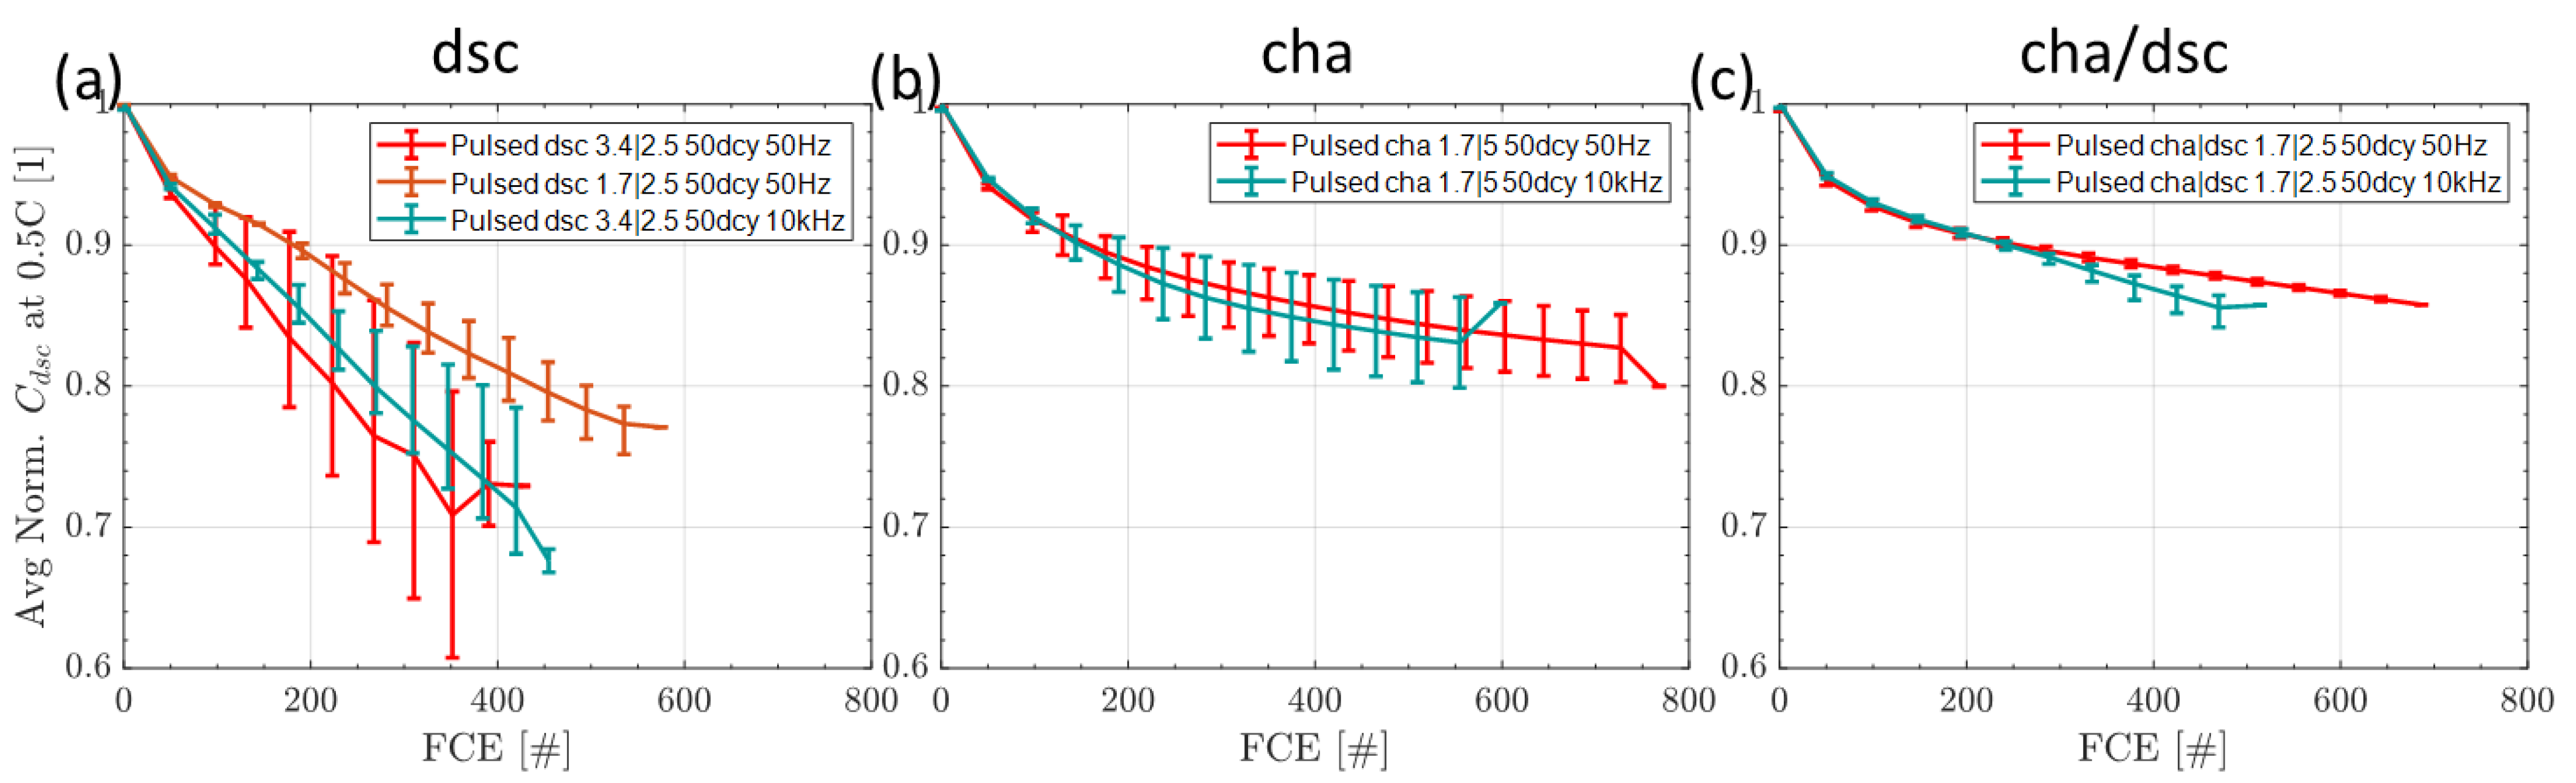
3.4.3. Comparison of the Switching Frequency at 50% Duty Cycle

Comparing the absolute results of switching at 50 Hz and 10 kHz with a duty cycle of 50%, we obtain the results in Figure 12. The data are separated for switching during (a) dsc, (b) cha, and (c) cha|dsc. The deviation between the switching frequencies is rather small and shows no clear tendency. For cha, no deviation is measured. For cha|dsc, there is a worse trend for 10 kHz from 300 FCE on. For dsc, at 50 Hz, the aging is stronger from the beginning, while the scattering of the data for both frequencies has a strong overlap. In an overall comparison, the difference in frequencies is still lower than the lower charge current of the 50 Hz dsc low current experiment.

4. Conclusions

We presented the results for switching tests that changed frequency and duty cycle during charge, discharge, and charge/discharge using a high-energy optimized battery cell. The switching results are compared with reference tests with continuous cycling at currents close to the maximum and average currents that can occur during switching tests.
For all test conditions, the level of charge current had the greatest effect on aging. A larger charge current leads to a higher aging rate. The influence of the applied discharge current led to a lower aging at higher currents, which is most likely an issue of higher temperature and lower resistance at higher discharge currents. The dependence of current rates is the major difference from the previously published results of high-power cells that were more or less independent of the applied currents.
In general, the influence of switching showed a higher correlation with the average currents than with the maximum currents occurring during switching compared with the reference cells. The two applied switching frequencies of 50 Hz and 10 kHz showed only a small deviation in the results that has to be investigated in further experiments to get closer to the origin of this finding and exclude potential experimental errors. The duty cycle from 50% to 75% showed no impact, while at 25% the current is so low that aging becomes very low during cycling.
Unexpected results are obtained by comparing the switching strategies. For a fair comparison, only the cells with the same average charge current are compared to examine the influence of switching. Switching during charge showed small improvements, while switching during discharge showed no difference if the average charge current is set to a low value, as for switching during charge and charge-discharge. To explain the insignificant influence of switching during discharge while the combined switching during charge and discharge showed an improvement, DVA and EIS data were evaluated. The DVA showed the strong dependence between the average charge and the lower average discharge current. Compared with the reference cells, the switching tests with the same low average charge current revealed that the switching during discharge is comparable, the switching during charge performs better, and the switching during charge/discharge performs best. The EIS results supported the finding of the DVA with a strong general aging of the cathode that is independent of the test conditions. The cells switched during charge and charge/discharge performed significantly better than the corresponding reference tests, while the cells switched during discharge showed a comparable trend to the respective reference tests. The root cause for the impact of switching cannot be fully understood by this work alone, and more experiments are required focusing on the separate analysis of switching during charge and discharge. Moreover, we have to emphasize that these conclusions are based on the average value. In cases where the cell-to-cell variation overlaps, our findings in the individual case may be limited.
For the application in a multilevel inverter application, we can conclude that an operation during charge and discharge will have instead a positive rather than a negative impact on aging and are therefore no obstacle in introducing multilevel inverters from the cell’s perspective but potentially a benefit.

Author Contributions

Conceptualization, M.L. and C.E.; methodology, M.L.; validation, M.L., G.W.N., C.H., M.A. and X.S.; formal analysis, M.L., G.W.N., M.A. and X.S.; investigation, M.L., G.W.N., X.S. and C.H.; resources, M.L. and C.E.; data curation, M.L., G.W.N., X.S. and M.A.; writing—original draft preparation, M.L., M.A., G.W.N. and X.S.; writing—review and editing, M.L., M.A. and X.S.; supervision, M.L.; project administration, C.E.; funding acquisition, C.E. All authors have read and agreed to the published version of the manuscript.

Funding

The research is funded by Audi AG. We acknowledge support by the German Research Foundation and the Open Access Publication Fund of Technische Hochschule Ingolstadt.

Data Availability Statement

For data, please refer to the corresponding author.

Acknowledgments

We would like to thank the University of Bayreuth, Chair for Electrical Energy Systems, for providing the impedance analysis and modeling software ec-idea (www.ec-idea.unibayreuth.de (accessed on 13 February 2023)). Special thanks for the fruitful discussion and support go to Michael Hinterberger, Lidiya Komsiyska, Christoph Hartmann, Julia Stöttner, Christoph Terbrack, Simon Diehl, and Markus Hölzle.

Conflicts of Interest

The authors declare no conflict of interest.

Appendix A

Computing the GDRT is difficult as it is an intrinsically ill-posed problem that often requires regularization. The regularization parameter used for the EC-Idea lies ideally between 0.1 and 0.2. Its main advantage over ECM-based modeling is that no predefinition of the processes is required. Each peak represents an RC element and thus can be attributed to an electrochemical process.
For a more detailed analysis and result representation, the analyzed GDRT from the reference and switching cells is shown in Figure A1 and Figure A2, respectively.
Figure A1. Obtained GDRT for the RC elements of the reference cells at 50 Hz.
Batteries 09 00139 g0a1
We can see that there are 5–6 identified peaks, as described in Section 3.3.3.
Again, here there is no distinct difference between the switching and reference cells. All cells show an almost identical course of the GDRT. With a higher number of FCE, the higher the peaks, meaning that the resistance values rise.
The only apparent and dominant factor in all cells is that R4 has the most significant change in relation to the number of FCE.
Figure A2. Obtained GDRT for the RC elements of the switching cells at 50 Hz.
Batteries 09 00139 g0a2
The peak identification allows us to represent, in total, 5–6 RC elements, each contributing to a specific process depending on its aging behavior and significant time constant τ.
Figure A3 and Figure A4 show the identified RL elements. As one can see, there is only one identified peak that occurs at τ = 10 5   s with a nearly constant resistance value and an increasing number of FCE. The peak identified from the distribution function is assigned to the geometry effects (cylindrical cell) [36].
Figure A3. Obtained GDRT for the RL elements of the reference cells at 50 Hz.
Batteries 09 00139 g0a3
Figure A4. Obtained GDRT for the RL elements of the switching cells at 50 Hz.
Batteries 09 00139 g0a4

References

  1. Ferraz, P.K.P.; Schmidt, R.; Kober, D.; Kowal, J. A high frequency model for predicting the behavior of lithium-ion batteries connected to fast switching power electronics. J. Energy Storage 2018, 18, 40–49. [Google Scholar] [CrossRef]
  2. Korte, C.; Specht, E.; Hiller, M.; Goetz, S. Efficiency evaluation of MMSPC/CHB topologies for automotive applications. In Proceedings of the 2017 IEEE 12th International Conference on Power Electronics and Drive Systems (PEDS), Honolulu, HI, USA, 12–15 December 2017; IEEE: Piscataway, NJ, USA, 2017; Volume 122017, pp. 324–330. ISBN 978-1-5090-2364-6. [Google Scholar]
  3. Bughneda, A.; Salem, M.; Richelli, A.; Ishak, D.; Alatai, S. Review of Multilevel Inverters for PV Energy System Applications. Energies 2021, 14, 1585. [Google Scholar] [CrossRef]
  4. Jiang, X.; Doumbia, M.L. Comparative Study of Grid-Connected Multilevel Inverters for High Power Phtovoltaic Systems. In Proceedings of the 2019 IEEE 7th International Conference on Smart Energy Grid Engineering (SEGE), Oshawa, ON, Canada, 12–14 August 2019; IEEE: Piscataway, NJ, USA, 2019; pp. 184–190. ISBN 978-1-7281-2440-7. [Google Scholar]
  5. Komsiyska, L.; Buchberger, T.; Diehl, S.; Ehrensberger, M.; Hanzl, C.; Hartmann, C.; Hölzle, M.; Kleiner, J.; Lewerenz, M.; Liebhart, B.; et al. Critical Review of Intelligent Battery Systems: Challenges, Implementation, and Potential for Electric Vehicles. Energies 2021, 14, 5989. [Google Scholar] [CrossRef]
  6. Uno, M.; Tanaka, K. Influence of High-Frequency Charge–Discharge Cycling Induced by Cell Voltage Equalizers on the Life Performance of Lithium-Ion Cells. IEEE Trans. Veh. Technol. 2011, 60, 1505–1515. [Google Scholar] [CrossRef]
  7. Chang, F.; Roemer, F.; Lienkamp, M. Influence of Current Ripples in Cascaded Multilevel Topologies on the Aging of Lithium Batteries. IEEE Trans. Power Electron. 2020, 35, 11879–11890. [Google Scholar] [CrossRef]
  8. Qin, Y.; Chen, X.; Tomaszewska, A.; Chen, H.; Wei, Y.; Zhu, H.; Li, Y.; Cui, Z.; Huang, J.; Du, J.; et al. Lithium-ion batteries under pulsed current operation to stabilize future grids. Cell Rep. Phys. Sci. 2022, 3, 100708. [Google Scholar] [CrossRef]
  9. Wong, D.; Shrestha, B.; Wetz, D.A.; Heinzel, J.M. Impact of high rate discharge on the aging of lithium nickel cobalt aluminum oxide batteries. J. Power Source 2015, 280, 363–372. [Google Scholar] [CrossRef]
  10. Soares, R.; Bessman, A.; Wallmark, O.; Lindbergh, G.; Svens, P. An Experimental Setup with Alternating Current Capability for Evaluating Large Lithium-Ion Battery Cells. Batteries 2018, 4, 38. [Google Scholar] [CrossRef] [Green Version]
  11. Prasad, R.; Namuduri, C.; Kollmeyer, P. Onboard unidirectional automotive G2V battery charger using sine charging and its effect on li-ion batteries. In Proceedings of the 2015 IEEE Energy Conversion Congress and Exposition (ECCE), Montreal, QC, Canada, 20–24 September 2015; pp. 6299–6305. [Google Scholar]
  12. Korth Pereira Ferraz, P.; Kowal, J. A Comparative Study on the Influence of DC/DC-Converter Induced High Frequency Current Ripple on Lithium-Ion Batteries. Sustainability 2019, 11, 6050. [Google Scholar] [CrossRef] [Green Version]
  13. Ngaleu, G.; Theiler, M.; Straßer, X.; Hanzl, C.; Komsiyska, L.; Endisch, C.; Lewerenz, M. Influence of Switching on the Aging of High Power Lithium-Ion Cells. Batteries 2022, 8, 33. [Google Scholar] [CrossRef]
  14. Sturm, J.; Rheinfeld, A.; Zilberman, I.; Spingler, F.B.; Kosch, S.; Frie, F.; Jossen, A. Modeling and simulation of inhomogeneities in a 18650 nickel-rich, silicon-graphite lithium-ion cell during fast charging. J. Power Source 2019, 412, 204–223. [Google Scholar] [CrossRef] [Green Version]
  15. Heenan, T.M.M.; Jnawali, A.; Kok, M.D.R.; Tranter, T.G.; Tan, C.; Dimitrijevic, A.; Jervis, R.; Brett, D.J.L.; Shearing, P.R. An Advanced Microstructural and Electrochemical Datasheet on 18650 Li-Ion Batteries with Nickel-Rich NMC811 Cathodes and Graphite-Silicon Anodes. J. Electrochem. Soc. 2020, 167, 140530. [Google Scholar] [CrossRef]
  16. Wu, Y.; Long, X.; Lu, J.; Wu, Y.; Zhou, R.; Liu, L. Effect of temperature on the high-rate pulse charging of lithium-ion batteries. J. Electroanal. Chem. 2022, 922, 116773. [Google Scholar] [CrossRef]
  17. Hahn, M.; Schindler, S.; Triebs, L.-C.; Danzer, M.A. Optimized Process Parameters for a Reproducible Distribution of Relaxation Times Analysis of Electrochemical Systems. Batteries 2019, 5, 43. [Google Scholar] [CrossRef] [Green Version]
  18. Lewerenz, M.; Fuchs, G.; Becker, L.; Sauer, D.U. Irreversible calendar aging and quantification of the reversible capacity loss caused by anode overhang. J. Energy Storage 2018, 18, 149–159. [Google Scholar] [CrossRef]
  19. Gyenes, B.; Stevens, D.A.; Chevrier, V.L.; Dahn, J.R. Understanding Anomalous Behavior in Coulombic Efficiency Measurements on Li-Ion Batteries. J. Electrochem. Soc. 2015, 162, A278–A283. [Google Scholar] [CrossRef]
  20. Ecker, M.; Shafiei Sabet, P.; Sauer, D.U. Influence of operational condition on lithium plating for commercial lithium-ion batteries—Electrochemical experiments and post-mortem-analysis. Appl. Energy 2017, 206, 934–946. [Google Scholar] [CrossRef]
  21. Lewerenz, M.; Münnix, J.; Schmalstieg, J.; Käbitz, S.; Knips, M.; Sauer, D.U. Systematic aging of commercial LiFePO 4 |Graphite cylindrical cells including a theory explaining rise of capacity during aging. J. Power Source 2017, 345, 254–263. [Google Scholar] [CrossRef]
  22. Ecker, M.; Nieto, N.; Käbitz, S.; Schmalstieg, J.; Blanke, H.; Warnecke, A.; Sauer, D.U. Calendar and cycle life study of Li(NiMnCo)O2-based 18650 lithium-ion batteries. J. Power Source 2014, 248, 839–851. [Google Scholar] [CrossRef]
  23. Mathieu, R.; Briat, O.; Gyan, P.; Vinassa, J.-M. Comparison of the impact of fast charging on the cycle life of three lithium-ion cells under several parameters of charge protocol and temperatures. Appl. Energy 2021, 283, 116344. [Google Scholar] [CrossRef]
  24. Zilberman, I.; Sturm, J.; Jossen, A. Reversible self-discharge and calendar aging of 18650 nickel-rich, silicon-graphite lithium-ion cells. J. Power Source 2019, 425, 217–226. [Google Scholar] [CrossRef]
  25. Ji, S.-G.; Umirov, N.; Kim, H.-Y.; Kim, S.-S. Relationship between Mechanical and Electrochemical Property in Silicon Alloy Designed by Grain Size as Anode for Lithium-Ion Batteries. J. Electrochem. Soc. 2022, 169, 60520. [Google Scholar] [CrossRef]
  26. Lewerenz, M.; Rahe, C.; Fuchs, G.; Endisch, C.; Sauer, D.U. Evaluation of shallow cycling on two types of uncompressed automotive Li (Ni1/3Mn1/3Co1/3)O2-Graphite pouch cells. J. Electrochem. Soc. 2020, 30, 101529. [Google Scholar] [CrossRef]
  27. Lewerenz, M.; Dechent, P.; Sauer, D.U. Investigation of capacity recovery during rest period at different states-of-charge after cycle life test for prismatic Li(Ni1/3Mn1/3Co1/3)O2-graphite cells. J. Energy Storage 2019, 21, 680–690. [Google Scholar] [CrossRef]
  28. Epding, B.; Rumberg, B.; Jahnke, H.; Stradtmann, I.; Kwade, A. Investigation of significant capacity recovery effects due to long rest periods during high current cyclic aging tests in automotive lithium ion cells and their influence on lifetime. J. Energy Storage 2019, 22, 249–256. [Google Scholar] [CrossRef]
  29. Spingler, F.B.; Naumann, M.; Jossen, A. Capacity Recovery Effect in Commercial LiFePO4/Graphite Cells. J. Electrochem. Soc. 2020, 167, 40526. [Google Scholar] [CrossRef]
  30. Lewerenz, M.; Warnecke, A.; Sauer, D.U. Post-mortem analysis on LiFePO 4 |Graphite cells describing the evolution & composition of covering layer on anode and their impact on cell performance. J. Power Source 2017, 369, 122–132. [Google Scholar] [CrossRef]
  31. Rajagopalan Kannan, D.R.; Weatherspoon, M.H. The effect of pulse charging on commercial lithium nickel cobalt oxide (NMC) cathode lithium-ion batteries. J. Power Source 2020, 479, 229085. [Google Scholar] [CrossRef]
  32. Illig, J.; Ender, M.; Weber, A.; Ivers-Tiffée, E. Modeling graphite anodes with serial and transmission line models. J. Power Source 2015, 282, 335–347. [Google Scholar] [CrossRef]
  33. Piao, T.; Park, S.-M.; Doh, C.-H.; Moon, S.-I. Intercalation of Lithium Ions into Graphite Electrodes Studied by AC Impedance Measurements. J. Electrochem. Soc. 1999, 146, 2794. [Google Scholar] [CrossRef] [Green Version]
  34. Danzer, M.A. Generalized Distribution of Relaxation Times Analysis for the Characterization of Impedance Spectra. Batteries 2019, 5, 53. [Google Scholar] [CrossRef] [Green Version]
  35. Boukamp, B.A. Derivation of a Distribution Function of Relaxation Times for the (fractal) Finite Length Warburg. Electrochim. Acta 2017, 252, 154–163. [Google Scholar] [CrossRef]
  36. Nagasubramanian, G. Two- and three-electrode impedance studies on 18650 Li-ion cells. J. Power Source 2000, 87, 226–229. [Google Scholar] [CrossRef] [Green Version]
Figure 1. Layout of the test equipment, comprising switching board and the connection to the cycler by means of current and voltage sensors and an auxiliary board.
Batteries 09 00139 g001
Figure 2. Measured currents using an inductor of 0, 100, and 560 µH at a frequency of 10 kHz.
Batteries 09 00139 g002
Figure 3. Normalized discharge capacity (a) and normalized pulse resistance (b) of the reference cells at various charge and discharge currents over full cycle equivalents with average charge and discharge currents stated in the legend.
Batteries 09 00139 g003
Figure 4. The dV/dQ-plot of reference 1 to highlight the characteristic peaks of the anode and the cathode obtained at (a) checkup #1, (b) checkup #5, and (c) checkup #14. The full cell curve is depicted in black, while the estimated curves are given in dashed blue for the cathode and in red for the anode. In (a), the anode capacity CA is measured by the distance between two graphite peaks and the cathode capacity CC by two cathode peaks. Loss of active lithium, also known as loss of lithium inventory (LLI), is measured by the shift of anode to the cathode. In (b,c), the change in peak height MinHiy of the minimum at 50% lithiation of the graphite is a measure for homogeneity of lithium distribution.
Batteries 09 00139 g004
Figure 5. Loss of active lithium CLLI (a), the minimum at high SOC (MinHiY) (b), the relative capacity of the cathode CC (c), and the anode CA (d) for the reference cells with average charge and discharge current stated in the legend.
Batteries 09 00139 g005
Figure 6. Normalized discharge capacity (a) and normalized internal resistance (b) of the cells switched at 50 Hz during discharge (dsc), charge (cha), and charge/discharge (cha/dsc), with average charge and discharge current stated in the legend. The reference tests are presented as areas in the background.
Batteries 09 00139 g006
Figure 7. Loss of active lithium CLLI (a), the minimum at high SOC (MinHiY) (b), the relative capacities of the cathode CC (c) and the anode CA (d) for the reference cells and the switched cells, with average charge and discharge current stated in the legend. The reference tests are presented as areas in the background.
Batteries 09 00139 g007
Figure 8. Nyquist diagrams (a) of the reference cells and (b) of the switching cells at 50 Hz, arranged in a matrix according to their average charge and discharge currents. EIS are obtained at 100% SOC in the frequency range from 80 mHz to 5 kHz.
Batteries 09 00139 g008
Figure 9. (a) Exemplary GDRT of the charging switching cell at 50 Hz defining the most significant peaks. The GDRT results are given in (b) for the relative resistance R0, in (c) for the relative anode capacitance CA, in (d) for the corresponding relative anode resistance RA, in (e) for the relative cathode capacitance Cc, and in (f) for the relative cathode resistance Rc. All GDRT analyses are obtained from the EC-Idea tool for both switching cells and reference cells, where the latter is shown as areas in the background.
Batteries 09 00139 g009
Figure 10. Normalized discharge capacity (a) and normalized internal resistance (b) of the switched cells at a frequency of 10 kHz during discharge (dsc), charge (cha), and charge/discharge (cha|dsc), with average charge and discharge currents stated in the legend. The reference tests are presented as areas in the background.
Batteries 09 00139 g010
Figure 11. Normalized discharge capacity (a) and normalized internal resistance (b) of the switched cells at 10 kHz at 25%, 50%, and 75% duty cycles for the representative example of switching during discharge with average charge and discharge current stated in the legend. The reference tests are presented as areas in the background.
Batteries 09 00139 g011
Figure 12. Relative discharge capacity at 0.5 C over FCE for switching during (a) discharge, (b) charge, and (c) charge and discharge with a frequency of 50 Hz and 10 kHz with average charge and discharge current stated in the legend.
Batteries 09 00139 g012
Table 1. Specifications of the used battery cell.
ProducerLG
Cell typeINR18650 MJ1
CathodeNMC: Li(Ni0.8Mn0.1Co0.1)O2
AnodeSilicon-Graphite
Nom. Capacity (0.5 C) 3.4 Ah
Max. discharge voltage2.5 V
Max. charge voltage4.2 V
Max. charge current 3.4 A
Max. discharge current 10 A
Energy density252 Wh/kg
Storage voltage (SOC) before test 3.6 V (33 %)
Table 2. Test matrix.
Test-Name# Test CellsImax [A]Iavg [A]
chadscchadsc
Ref1 23.453.45
Ref223.43.43.43.4
Ref321.751.75
Ref421.73.41.73.4
50 Hz50% dcyPulsed dsc/cha23.451.72.5
50 Hz50% dcyPulsed cha33.451.75
50 Hz50% dcyPulsed dsc63.453.42.5
50 Hz50% dcyPulsed dsc low current31.751.72.5
10 kHz50% dcyPulsed dsc/cha33.451.72.5
10 kHz75% dcyPulsed dsc/cha23.452.553.75
10 kHz25% dcyPulsed cha13.450.855
10 kHz50% dcyPulsed cha23.451.75
10 kHz75% dcyPulsed cha13.452.555
10 kHz25% dcyPulsed dsc53.453.41.25
10 kHz50% dcyPulsed dsc43.453.42.5
10 kHz75% dcyPulsed dsc33.453.43.75
Disclaimer/Publisher’s Note: The statements, opinions and data contained in all publications are solely those of the individual author(s) and contributor(s) and not of MDPI and/or the editor(s). MDPI and/or the editor(s) disclaim responsibility for any injury to people or property resulting from any ideas, methods, instructions or products referred to in the content.

