Article

Enabling Online Search and Fault Inference for Batteries Based on Knowledge Graph

School of Transportation Science and Engineering, Beihang University, Beijing 102206, China
*
Author to whom correspondence should be addressed.
Batteries 2023, 9(2), 124; https://doi.org/10.3390/batteries9020124
Submission received: 31 December 2022 / Revised: 31 January 2023 / Accepted: 3 February 2023 / Published: 9 February 2023

Abstract

:
The safety of batteries has become a major obstacle to the promotion and application of electric vehicles, and the use of cloud-based vehicle practical big data to summarize the fault knowledge of batteries to improve product quality and reduce maintenance costs has attracted widespread attention from academia and industrial communities. In this paper, a method is proposed to construct the battery fault knowledge graph which supports online knowledge query and fault inference. Reliability models for battery undervoltage, inconsistency, and capacity loss are built based on cloud data, and are deployed and continuously updated in the cloud platform to accommodate the migration of the models to different battery products. A bidirectional long short-term memory (Bi-LSTM) neural network was established for knowledge extraction of fault logs, and the results were imported into Neo4j to form a battery fault knowledge graph. Finally, a fault knowledge online query front-end interface was built to conduct inference tests on battery faults of a manufacturer, which proves the feasibility and effectiveness of the proposed method.

1. Introduction

Lithium-ion batteries have become the first choice for electric vehicle power systems due to their high power density, low self-discharge rate, and long cycle life. However, in real operation, the application of lithium-ion batteries is limited by the current development of electrical, thermal, and safety management system technologies, which are subject to mechanical, electrical, and thermal abuse (e.g., over-charge, over-discharge, overheating, etc.) in extreme application scenarios, easily leading to rapid deterioration of battery performance, and even cause safety incidents such as fire and explosion. Therefore, online monitoring of the battery’s working conditions is required to ensure that all types of battery faults can be effectively identified to achieve early warning and improve the safety, stability, and reliability of the real operation of the battery system.
At present, researchers have conducted a lot of tests and accumulated a lot of experience in fault diagnosis methods for lithium-ion batteries. There are three main technical routes: model-based, data-driven, and knowledge-based fault diagnosis, respectively.
The model-based approach simulates the battery’s internal electrochemical reaction process directly or abstracts it into an equivalent circuit model. Lin et al. completed the diagnosis of battery faults by constructing a sensor fault model based on the Kalman filter algorithm [1]; Zhang et al. achieved multiple fault detection and isolation by fusing entropy methods with fault models [2]; Li et al. achieved fault detection by adding an adaptive enhancement method to the equivalent circuit model [3]; Qiu et al. constructed an electro-thermal coupling by using a local anomaly factor model to simulate different levels of anomalies within the battery [4]. When the error between the model estimation and the actual value measured by the sensor exceeds the alarm range, the system is considered faulty. This diagnostic method relies on the accurate modeling of the battery. If the analytical model does not match the actual situation, it will result in a sizeable diagnostic deviation, which is unsuitable for automotive power batteries with complex mechanisms and variable working conditions.
The data-driven approach analyzes and processes the monitoring data of the cloud platform in multiple dimensions, extracting the fault features of the equipment and completing fault diagnosis by mining the relationship between data features and battery status. Zhao et al. completed fault diagnosis by machine learning algorithm and 3σ multilevel strategy [5]; Ojo et al. achieved accurate detection of thermal faults by employing LSTM networks [6]; additionally, residual thresholds of battery short circuit and current leakage were used to achieve higher accuracy fault detection [7]; Xu et al. proposed a cell difference model and machine learning based lithium-ion battery multi-type vehicle-cloud collaborative approach for fault diagnosis [8]. This data-driven fault diagnosis method does not rely on an accurate mechanism model while combining the robust prediction and fitting capabilities of deep learning with fault diagnosis, which has a certain degree of universality. However, the diagnostic results obtained using this approach are somewhat limited in their interpretability due to the lack of fault knowledge and process knowledge to support them.
The most promising and expressive advantage of the knowledge-based approaches is that they can enable more adaptive and targeted diagnostic algorithms by incorporating the wealth of experience from experts, algorithms, and big data [9]. Knowledge graphs can summarize large amounts of information, data, and connections into knowledge, allowing information resources to be more easily calculated, understood, and evaluated. It can allow for more effective representation, management organization, and utilization of the vast amounts of heterogeneous and dynamic changing big data available, making models more innovative and more relevant to human cognitive thinking. Knowledge-based fault diagnosis methods are well interpretable and do not require the construction of complex mathematical mechanistic models while also allowing for updating fault knowledge. Knowledge graphs can be divided into generic and dedicated knowledge graphs according to the scope of knowledge coverage. Generic, large-scale knowledge graphs include Freebase [10], Wikidata [11], DBpedia [12], and YAGO [13], whereas reliable knowledge graphs include IMDB [14] and ConceptNet [15]. Generally speaking, the process of building a knowledge graph can be divided into knowledge representation, knowledge extraction, knowledge fusion, knowledge inference, and knowledge update.
The knowledge graphs method has been widely used in many fields in recent years. Hou et al. applied knowledge graphs to question-and-answer systems for military equipment by analyzing the problems and difficulties in data information and management in military equipment [16]. Guan et al. proposed a knowledge graph with embedded concepts for knowledge graph representation learning that enhances the communication of concept graphs [17]. Anna et al. identified the drivers of drug resistance in EGFR mutant small cell lung cancer by constructing a recommender system on a heterogeneous biological knowledge graph [18]. Zeng et al. used knowledge graphs in the field of drug discovery by structuring between multiple entities and unstructured semantic transformation relationships between entities to achieve unstructured semantic closure of explicit structures [19].
Furthermore, combining deep learning and knowledge graph technologies can improve fault diagnosis results. For example, Liu et al. proposed a variety of CNN, GRU, and knowledge graphs to build an ATT-1D CNN-GRU model for the fault diagnosis of mechanical equipment [20]. Han et al. extracted the triad structure by ROMGJCE and added a reinforcement learning framework to create a knowledge graph of production equipment and completed fault diagnosis of it [21]. Deng et al. established a joint event-parameter entity and relationship extraction model with a stacked bidirectional LSTM neural network used to obtain in-depth contextual features to construct a knowledge map of the robot that can characterize and complete fault diagnosis [22]. Establishing the knowledge graph with the existing expert experience can quickly form the fault knowledge system, dig the potential connection between different faults and causes, and complete the intelligent recommendation question and answer system and the fault diagnosis algorithm based on graph neural network on this basis.
Fault diagnosis technology has been a constraint to the development of lithium-ion batteries, and the construction of its knowledge graph contains many elements involving battery failure performance, working conditions, failure modes, and other aspects. For real-world vehicle applications, it is also necessary to consider the failure relationship between the individual battery failure mode and the battery module or even the battery pack. There are currently no cases where a knowledge graph has been applied to lithium-ion battery fault diagnosis.
This paper implements a scheme to build a knowledge graph in the battery field based on fault logs from a cloud-based management platform. Firstly, practical vehicle data and laboratory test data of a vehicle with under-voltage, inconsistency, and capacity loss faults are analyzed, and reliability models are established. Updates to the reliability models and cloud-based fault diagnosis are realized based on battery cloud-based big data. A bidirectional long short-term memory network is then established to extract and integrate the information contained in the fault logs and analyze the relationships to build a knowledge graph in the field of in-vehicle power battery faults, designing a front-end for online fault query of the battery system and testing the fault cause inference in the cloud to realize intelligent fault diagnosis of the battery system.

2. Battery Big Data Fault Diagnosis

In this section, a battery reliability model based on big data from practical vehicles is constructed to implement cloud-based fault diagnosis. The failure phenomena of batteries and the statistical model based on reliability theory is presented in Section 2.1. In Section 2.2, the data under three typical fault types, including undervoltage, inconsistency, and capacity loss, are analyzed to design an online fault diagnosis algorithm which can continuously iteratively be updated in the cloud.

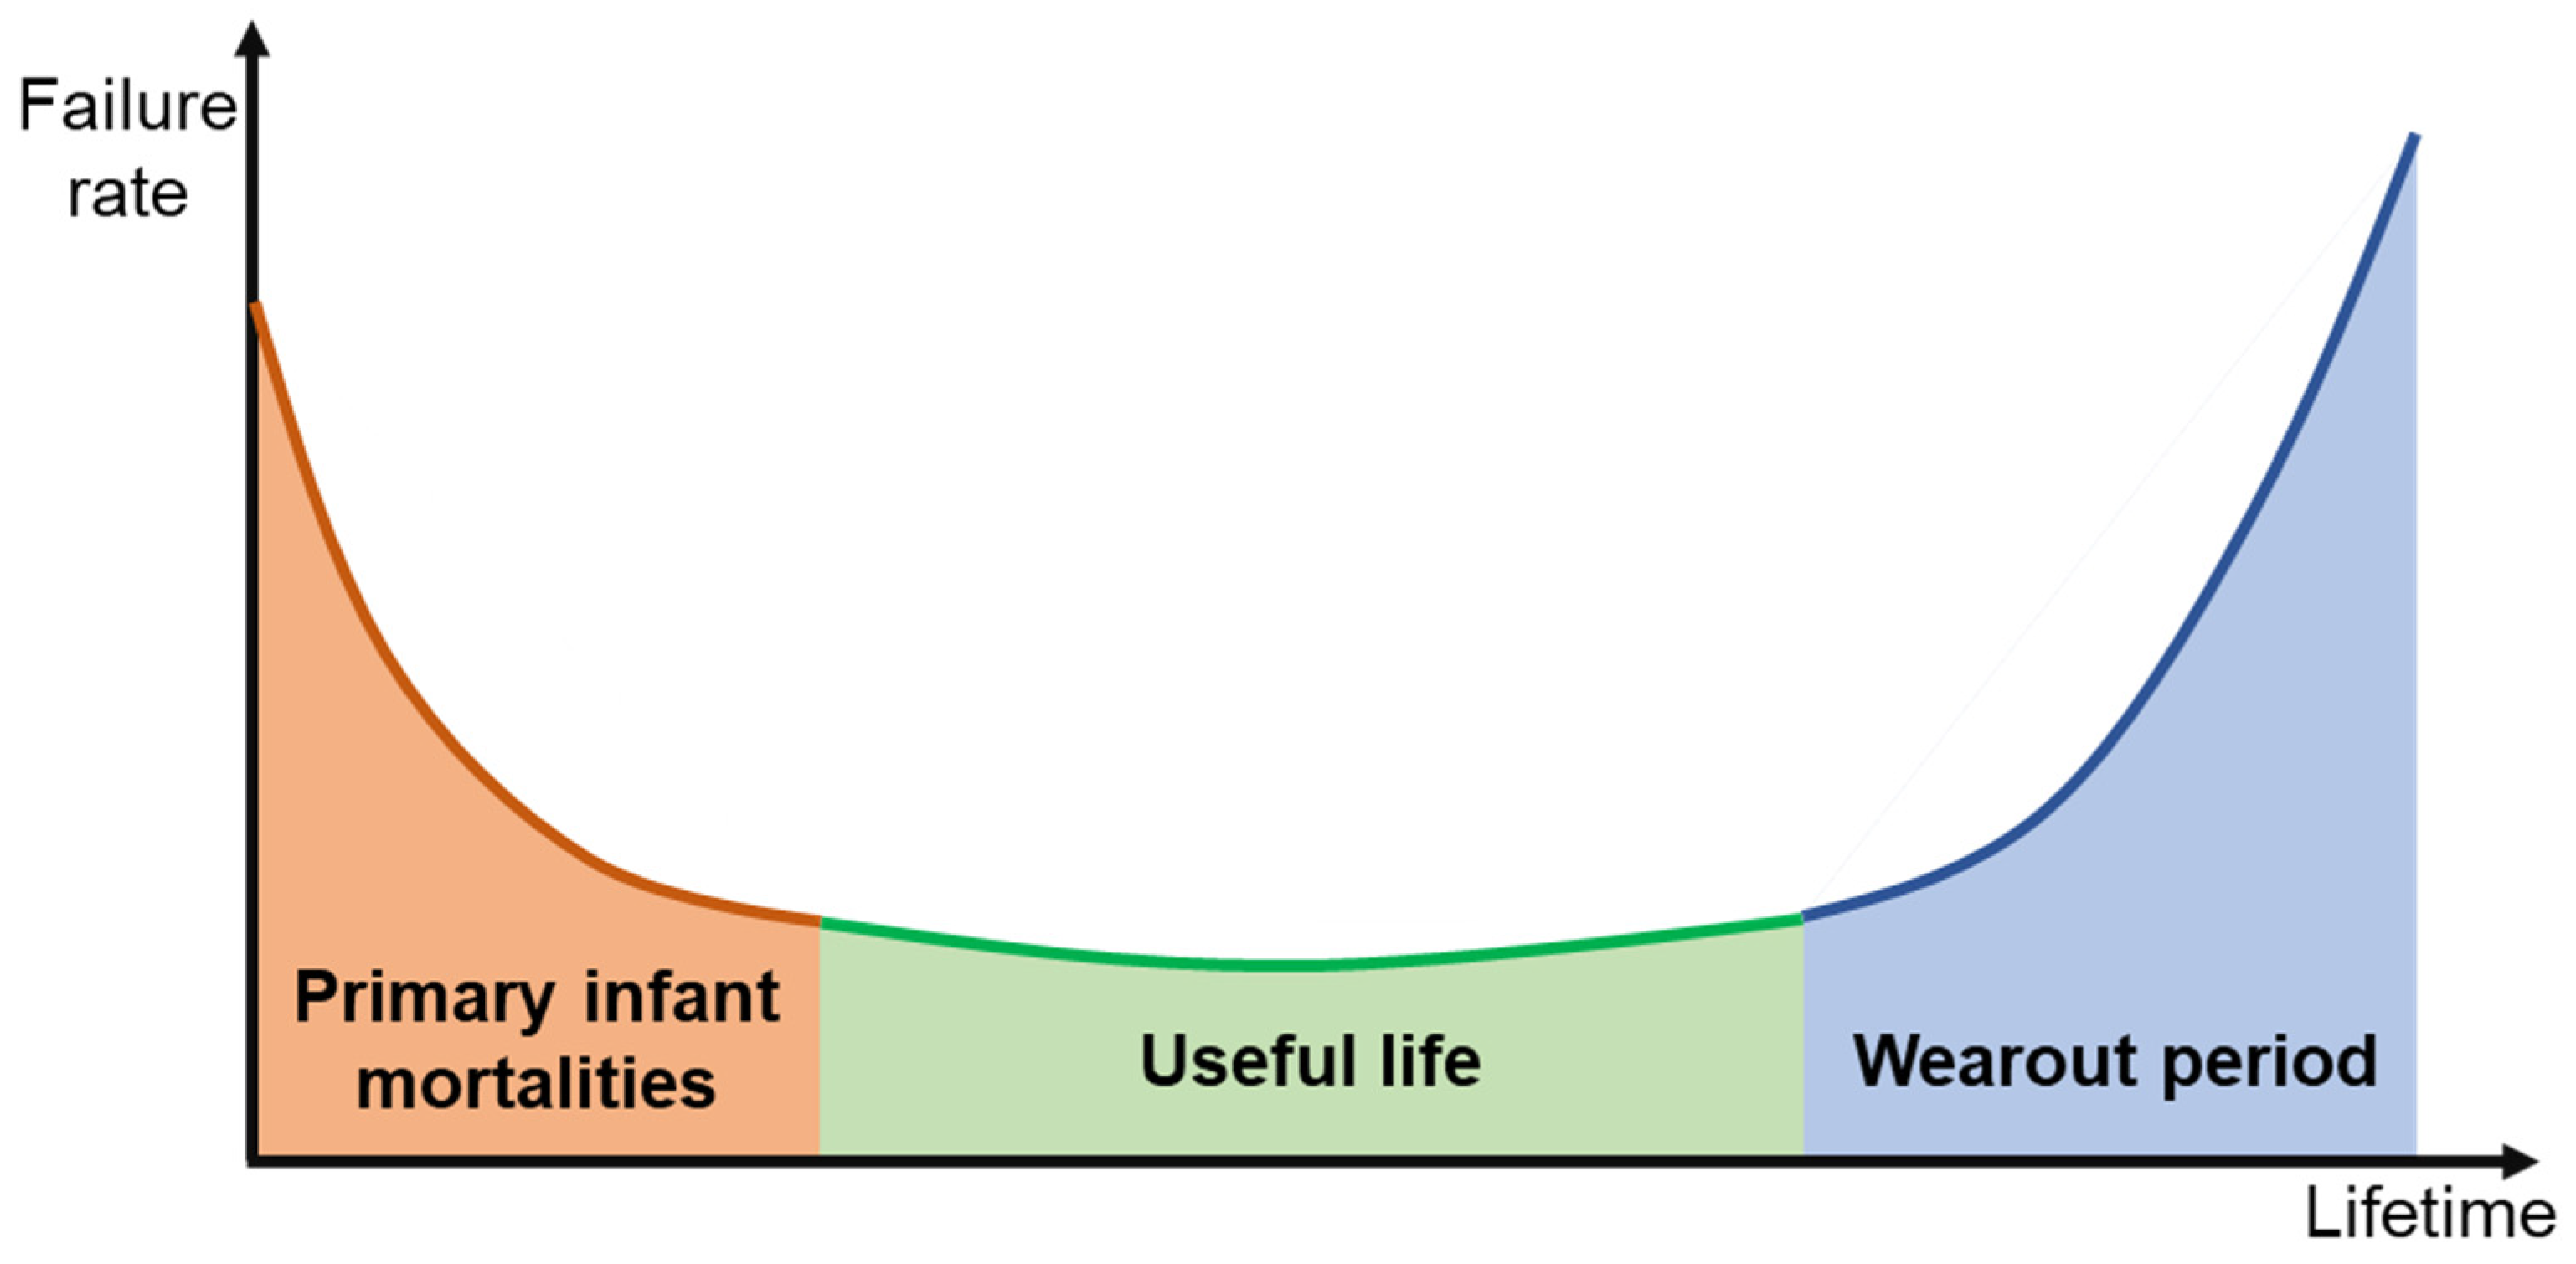
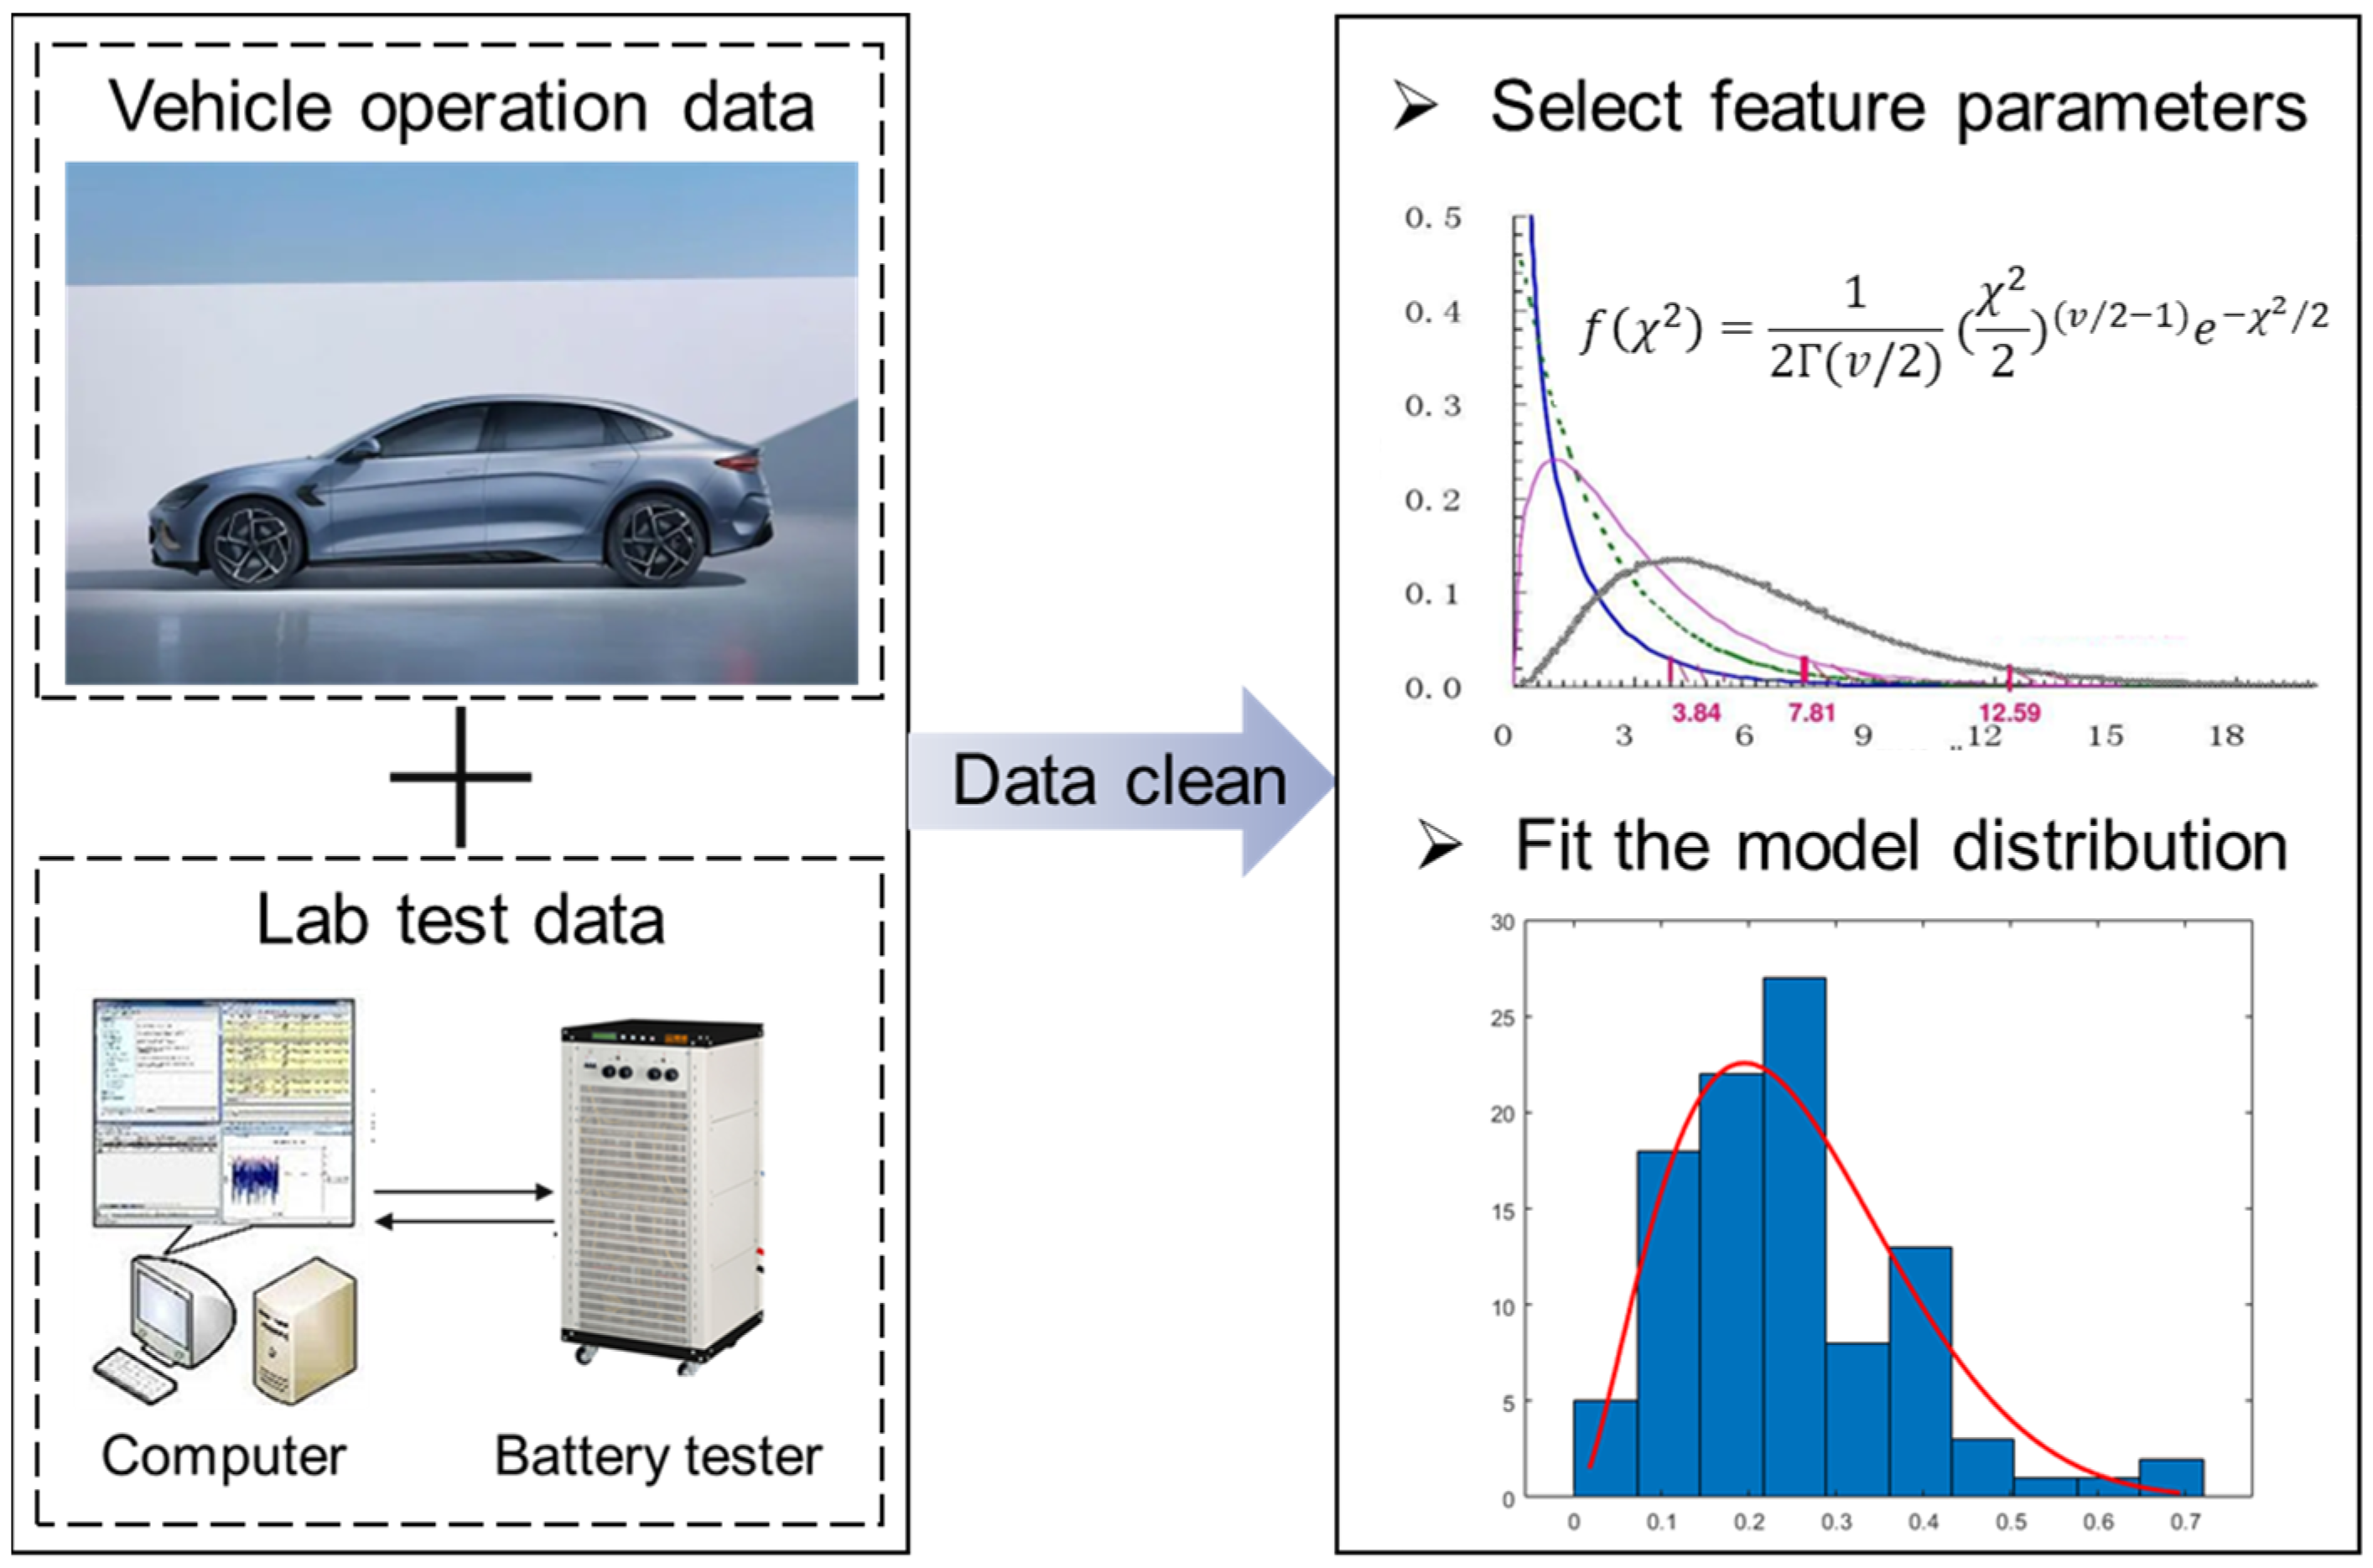
2.1. Battery Big Data Reliability Model

In the case of lithium-ion power batteries, various failure phenomena often occur during different working conditions. For example, phenomena such as the increase of internal resistance, power fade, capacity loss, and increase of self-discharge rate indicate that performance degradation has occurred inside the battery, and there are also phenomena related to battery safety, such as gas production, electrolyte leakage, volume expansion, internal/external short circuit, and even fire and explosion. These failures are usually caused by the interaction of complex electrochemical reactions inside the battery and external environmental factors.
The curve in Figure 1 is called the failure rate curve, which is drawn with lifetime as the horizontal axis and the failure rate of the devices as the vertical axis. Its shape is similar to the shape of a bathtub, so it is also called “bathtub curve”. The failure rate curve is stage-specific, with the probability of failure changing with lifetime. The reference divides the bathtub curve into three main stages: (i) primary infant mortality; (ii) useful life; and (iii) wearout period. Most studies focus on the useful life period [23]. Therefore, failure rate becomes a constant value which is independent of time.
Reliability is the ability to perform a specified function at the required time and under the required conditions; this ability is usually expressed in terms of probability. Reliability modeling and quantitative data analysis can develop evaluation indices for battery performance. For complex nonlinear battery systems, multiple reliability indices need to be determined for multi-dimensional evaluation. In this paper, the degree of undervoltage is selected to evaluate the degradation of battery performances, the inconsistency characterizes the overall performance degradation of the battery system, and the capacity loss function indicates the useful life of the battery. For a practical vehicle, it is difficult to consider the calendar aging and cycle aging of the battery like the laboratory test, so the number of cycles is equivalently substituted for the mileage of the vehicle [24].
The process of establishing the battery reliability model based on the practical vehicle data is shown in Figure 2. Firstly, the practical vehicle data from the cloud monitoring platform and laboratory-acquired data are cleaned, and the abnormal values in data are removed. Then, the appropriate feature parameters are selected and their mapping relationship with the failure mechanism is analyzed. The matching distribution type (such as binomial distribution, normal distribution, exponential distribution, Weibull distribution, etc.) is selected according to the distribution of data, and the empirical formula is obtained by fitting the reliability model parameters. Finally, the reasonableness of the selection of feature parameters and distribution functions is discussed by comparing them with the real vehicle big data.

2.2. Reliability Model-Based Fault Diagnosis

The data of the battery management system uploaded to the cloud platform include battery operation status parameters such as voltage, current, temperature, time, etc., and vehicle operation parameters such as vehicle speed and mileage. Suitable parameters are selected as features from the uploaded practical vehicle data to fit the reliability models corresponding to undervoltage, inconsistency, and capacity loss. The model parameters are continuously updated with the practical vehicle operation data to achieve battery fault diagnosis by querying the reliability values according to the real-time features.

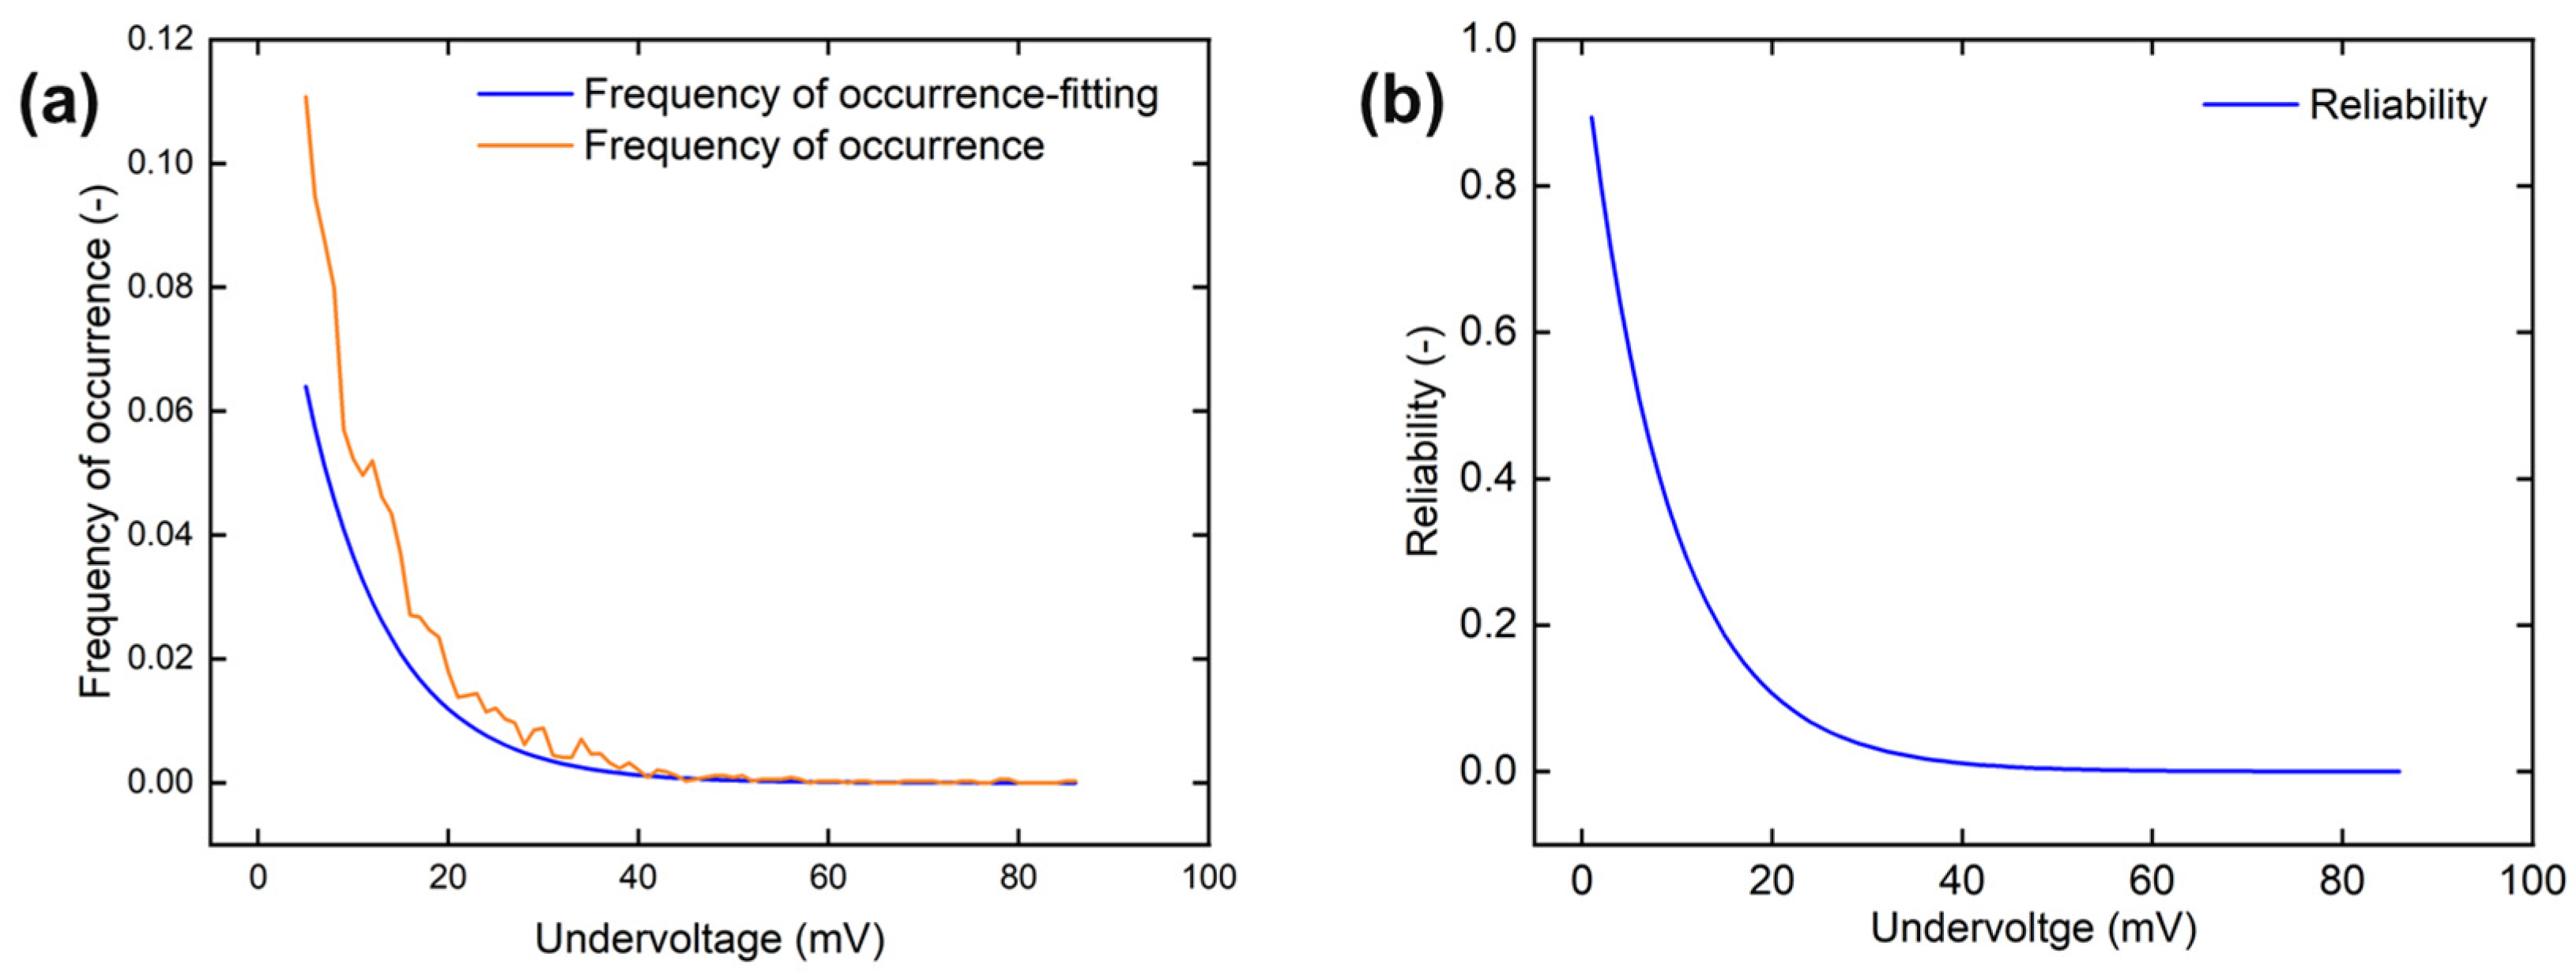
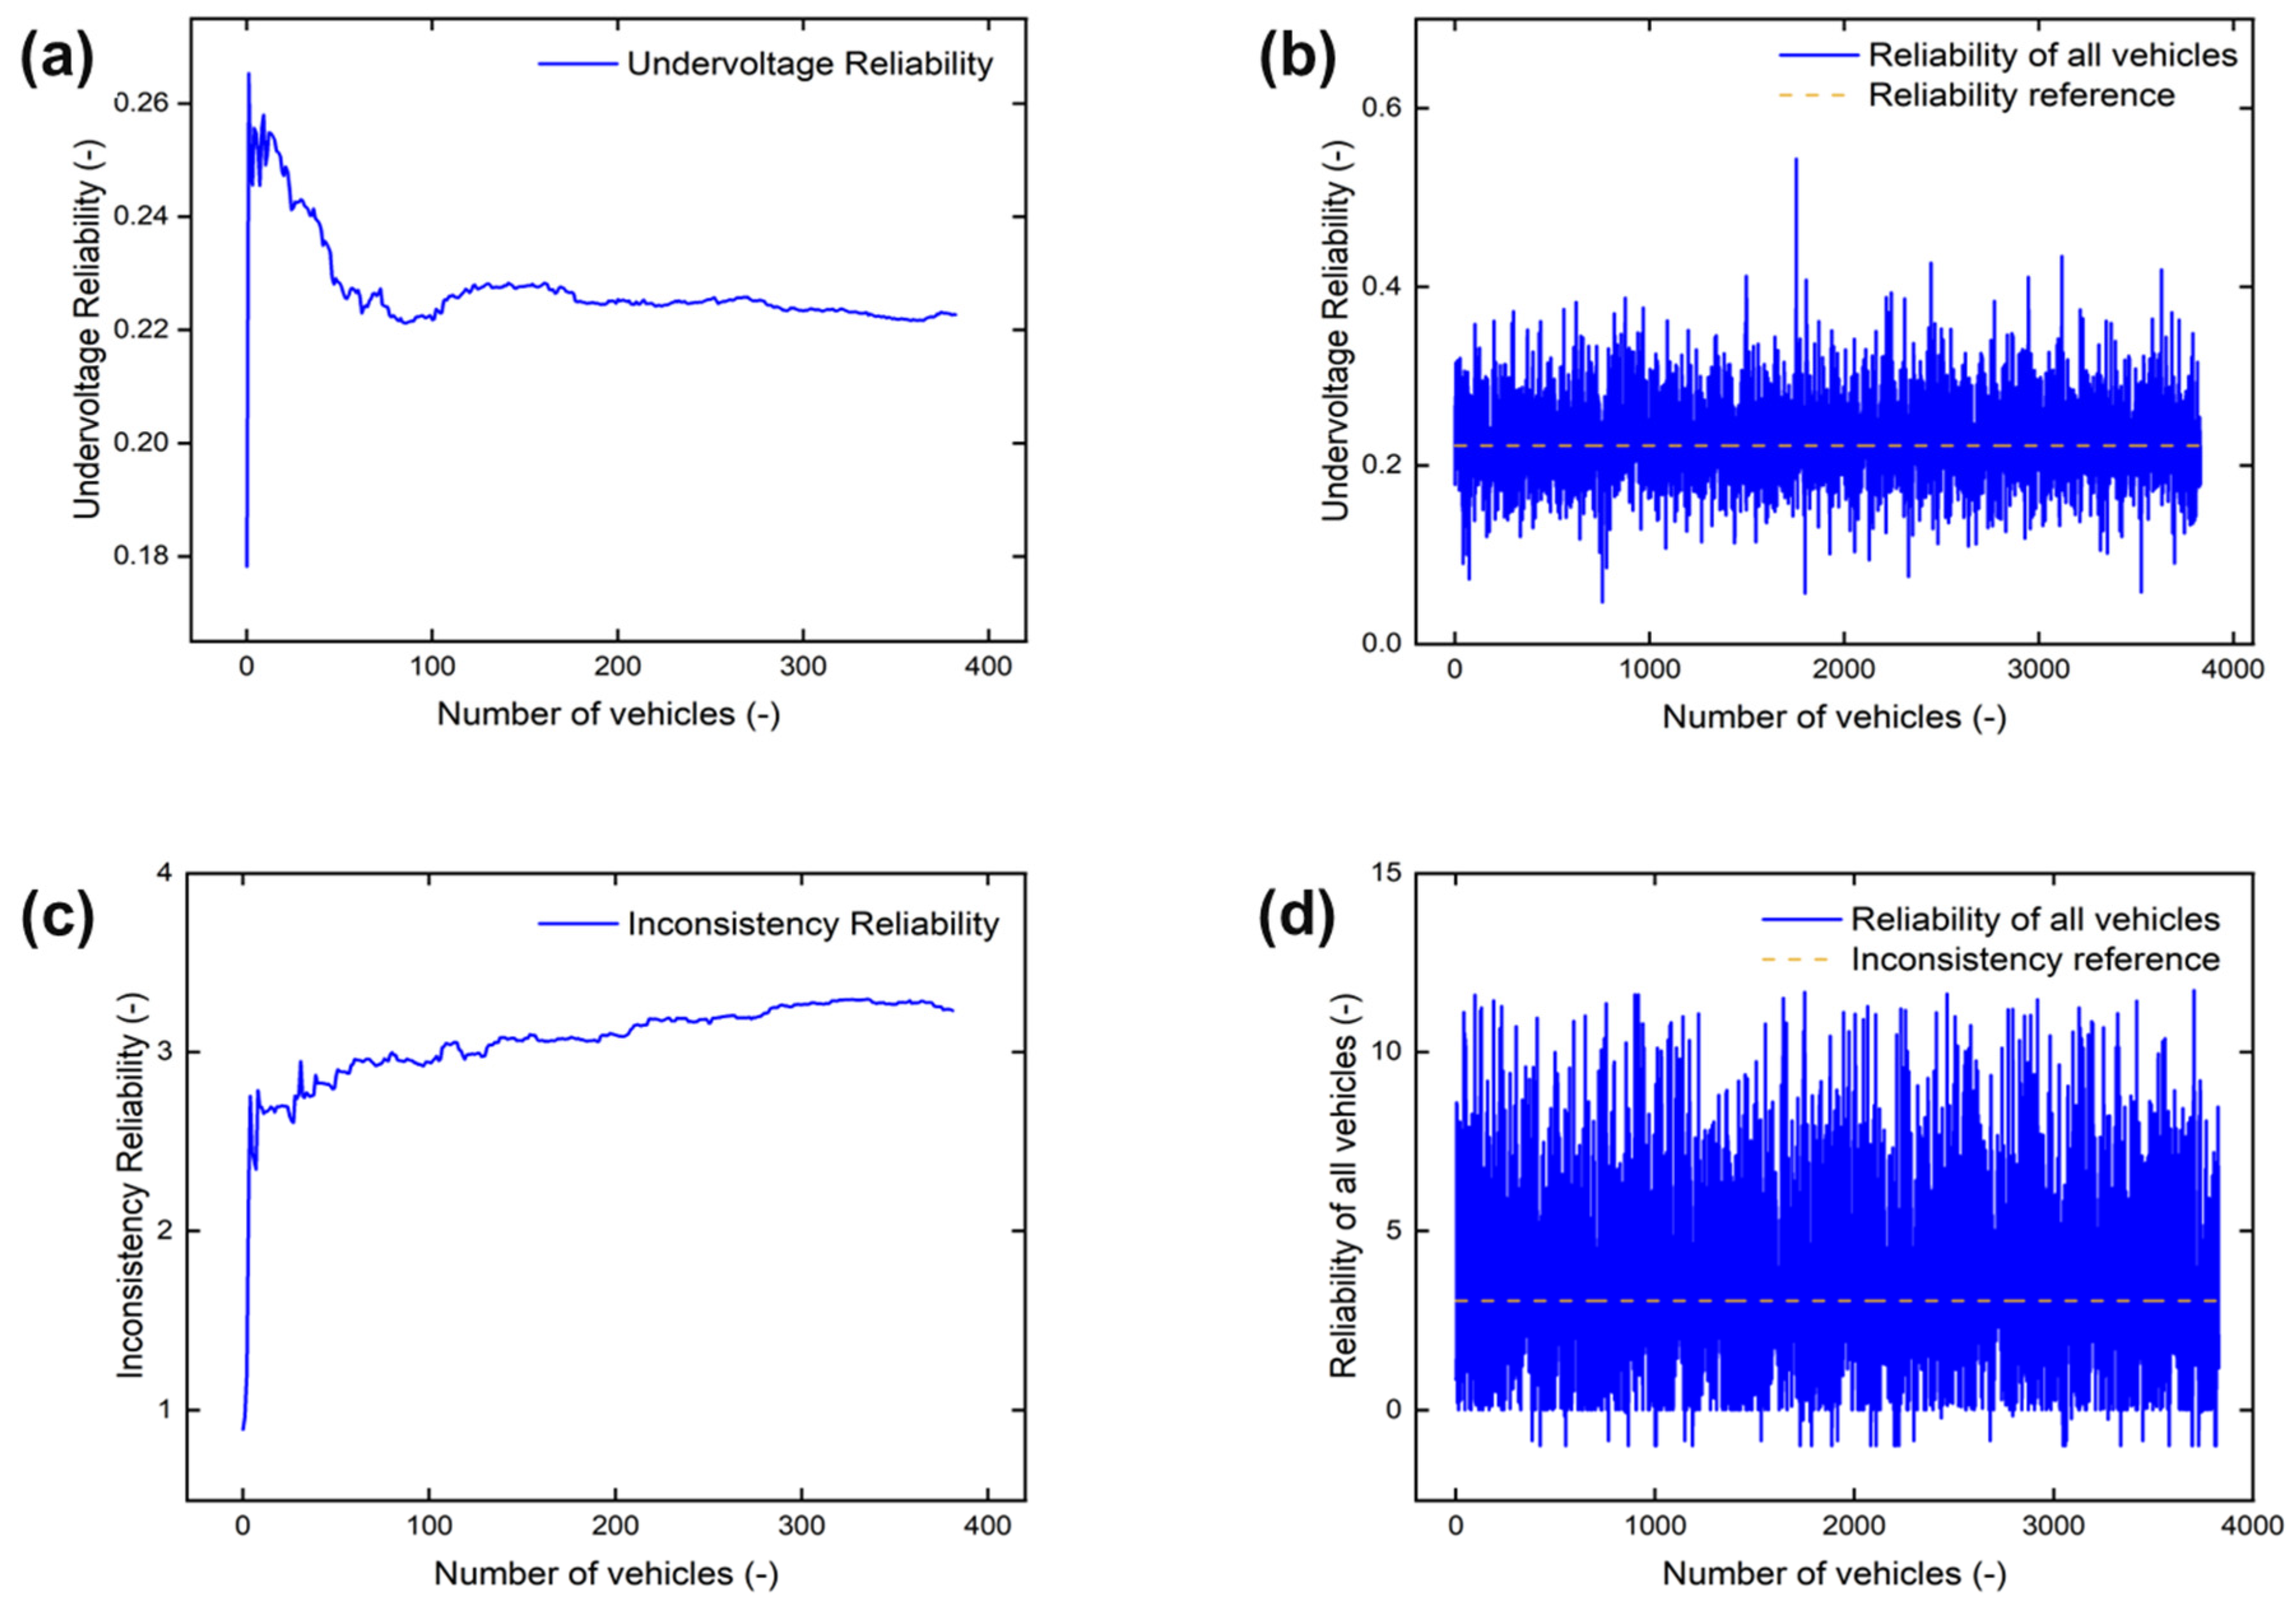
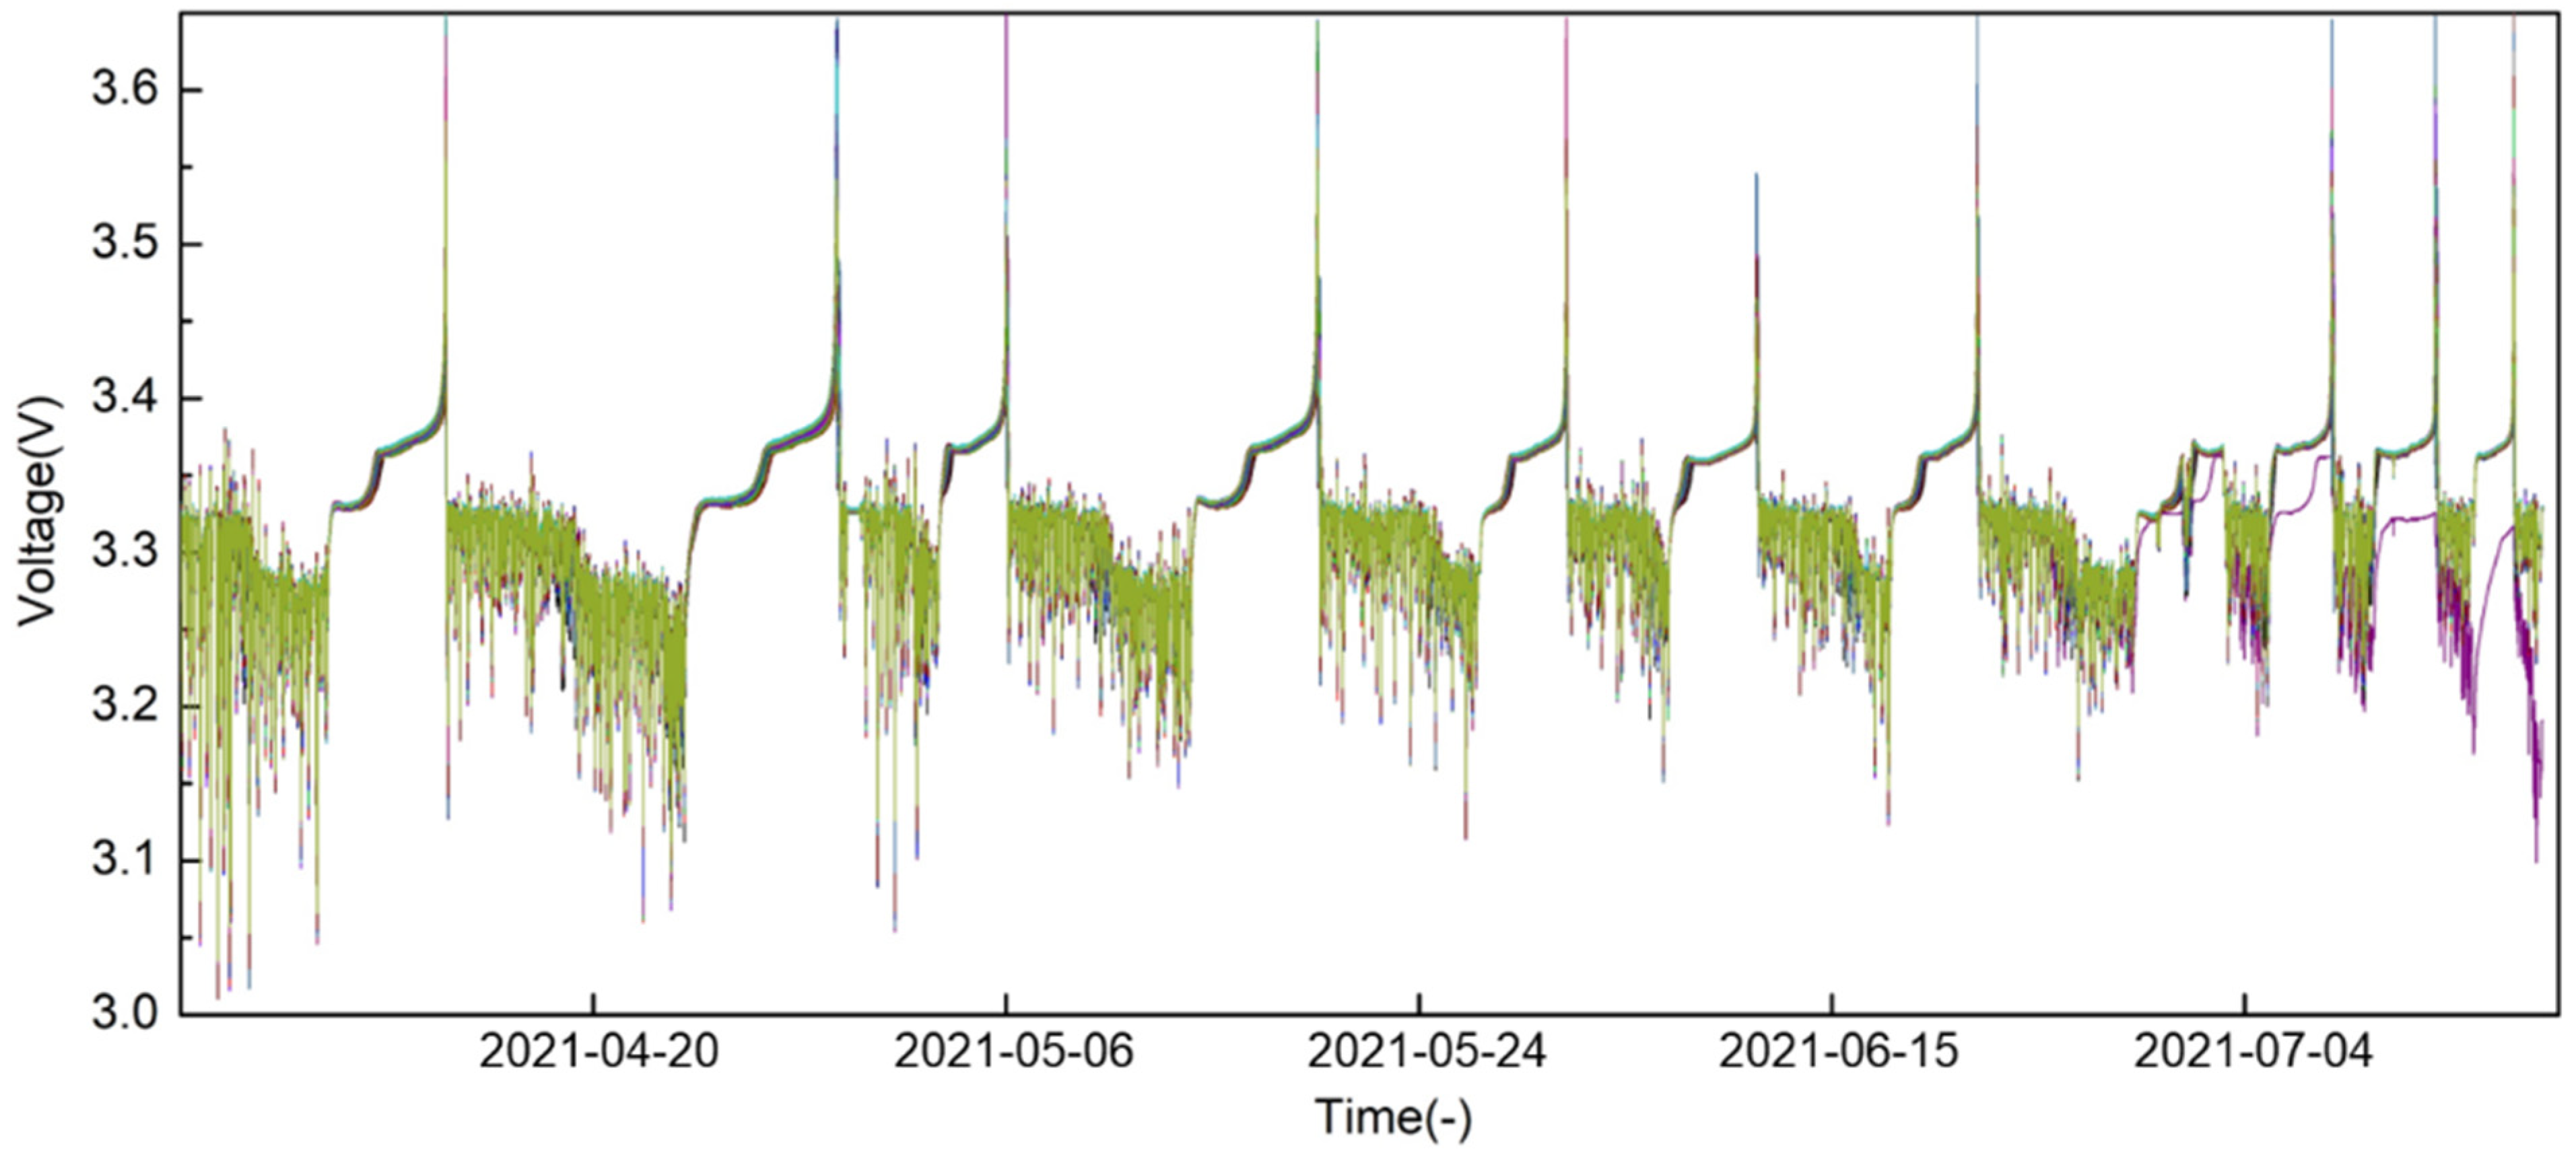
2.2.1. Undervoltage Reliability Model

Voltage data is one of the important parameters that can directly reflect the internal reaction of the battery; the extraction of the feature parameters can realize the performance evaluation more intuitively and clearly. The voltage value will plummet when the battery has a fault such as internal short circuit or electrolyte leakage, so the fault detection can be realized by counting the undervoltage range of the abnormal cell. When analyzing the undervoltage, it is necessary to find a normal reference voltage and select the mode of voltage with real physical significance as the reference. The voltage signal measured by the sensor at the board end usually has a noise of 3–5 mV, and the inconsistency between cells could also bring some errors. Therefore, the undervoltage reliability model constructed in this paper only considers data with undervoltage values above 5 mV.
The undervoltage situation of cell is counted under all sampling moments of the vehicle, and the frequency of occurrence of different undervoltage values is obtained. The highest frequency is the undervoltage value equal to 5 mV, and the probability of occurrence is lower as the undervoltage value increases, and near the undervoltage value of 40 mV, its frequency tends to be close to 0, which is more consistent with the actual situation.
The exponential distribution is chosen as the fitted model based on the statistical data. Its probability density function is expressed as follows:
f t = λ e λ t
where 0 t < ,   0 < λ < , λ is the failure rate of the exponential distribution. The corresponding exponential distribution function has the following form:
F t = 1 e λ t
The expression for the reliability function of the exponential distribution is:
R t = 1 F t = e λ t
Due to the mean value of the exponential distribution being E T = 1 λ and the variance is Var T = 1 λ 2 , the failure rate λ of the exponential distribution is a time-independent constant, and can correspond to the bottom part of the failure rate curve for battery reliability assessment and fault diagnosis.
The exponential distribution probability density function is fitted to obtain the parameter λ = 0.11 at a fitting accuracy of 0.9957. The corresponding probability density curve and the reliability function curve are obtained in Figure 3.

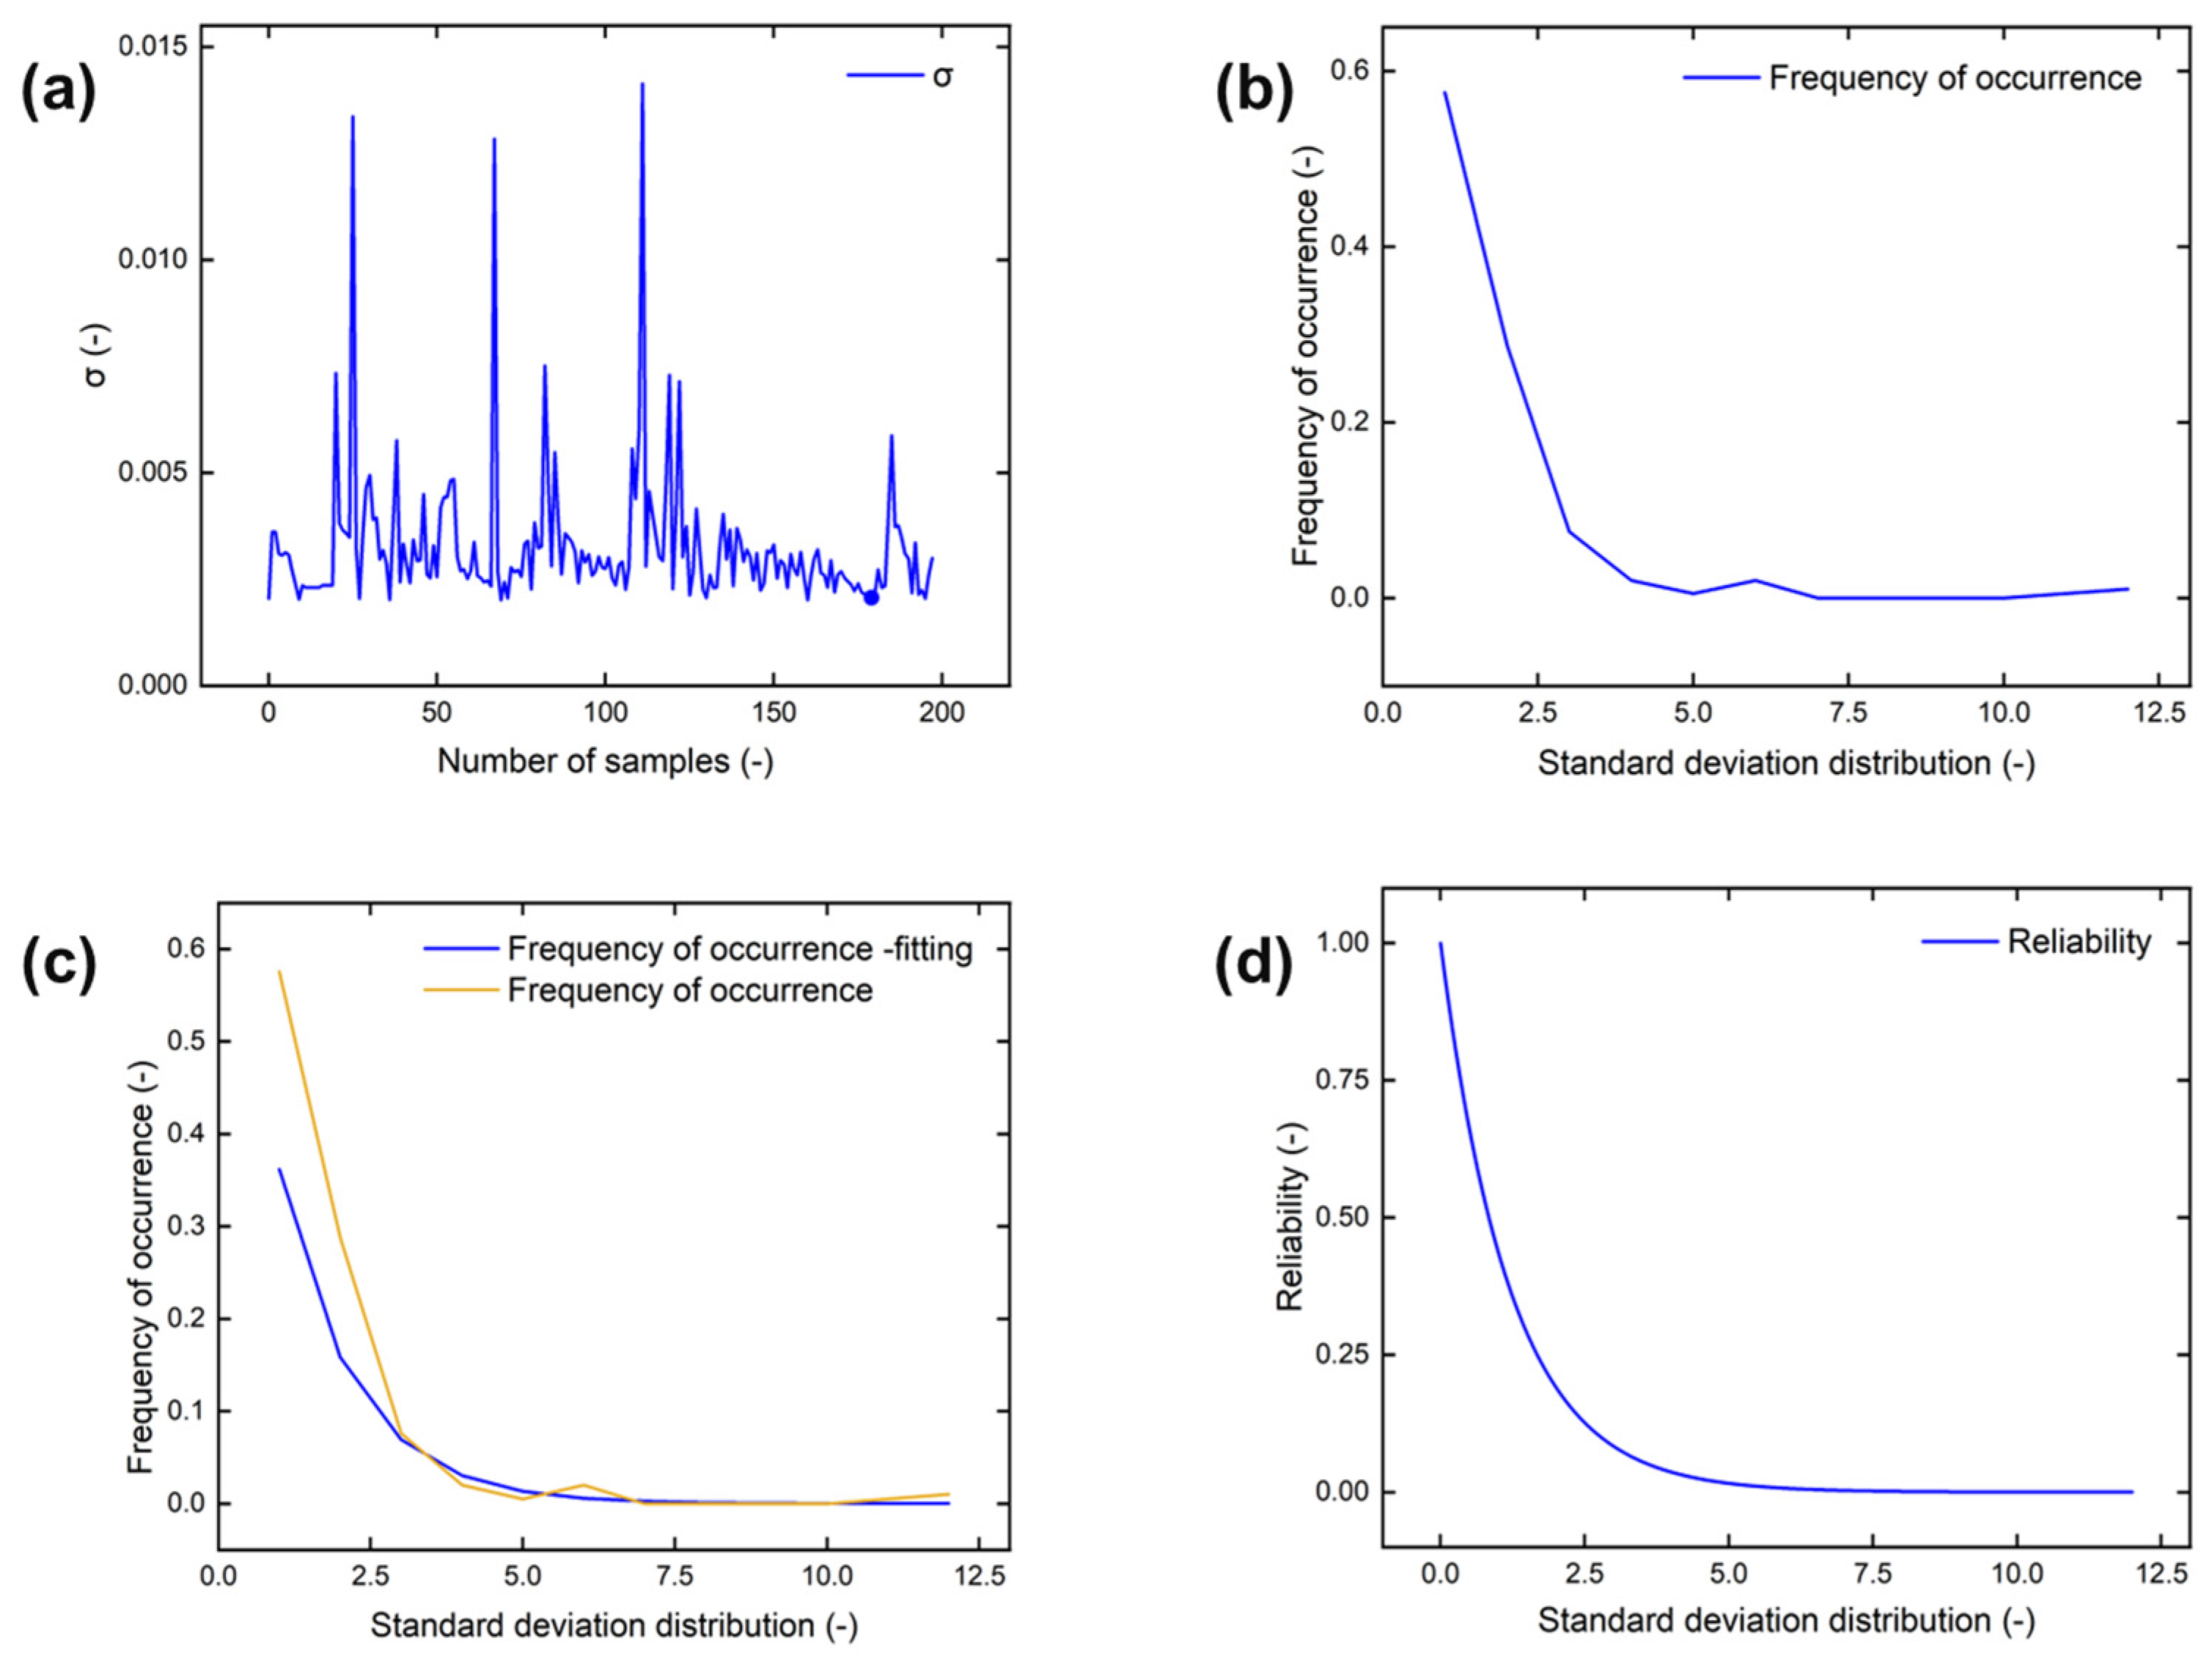
2.2.2. Inconsistency Reliability Model

The inconsistency between cells in the battery pack is due to the slight differences in the initial battery performances after production, and these differences are continuously expanded in the useful life, coupled with the battery pack structure and other reasons that cause large differences in the actual environment, which eventually accelerate the battery aging and even cause failure. The index of battery pack inconsistency evaluation is the standard deviation of all cell voltages at each sampling moment. It is generally believed that there is only one cell with serious outliers in an EV battery pack. In order to make the inconsistency index better evaluate the performance of most of the normal cells in the battery pack, the effect of the maximum and minimum voltage will not be considered when fitting the inconsistency model.
The statistical results of the sampling moments of the voltage inconsistency index with the value greater than 0.002 are shown in Figure 4a. In this paper, the index is divided into 12 intervals according to the interval value equal to 0.001, and the frequency of the inconsistency index in each interval is counted as shown in Figure 4b. The corresponding probability density curve of probability density curve and the reliability function curve are shown in Figure 4c,d.

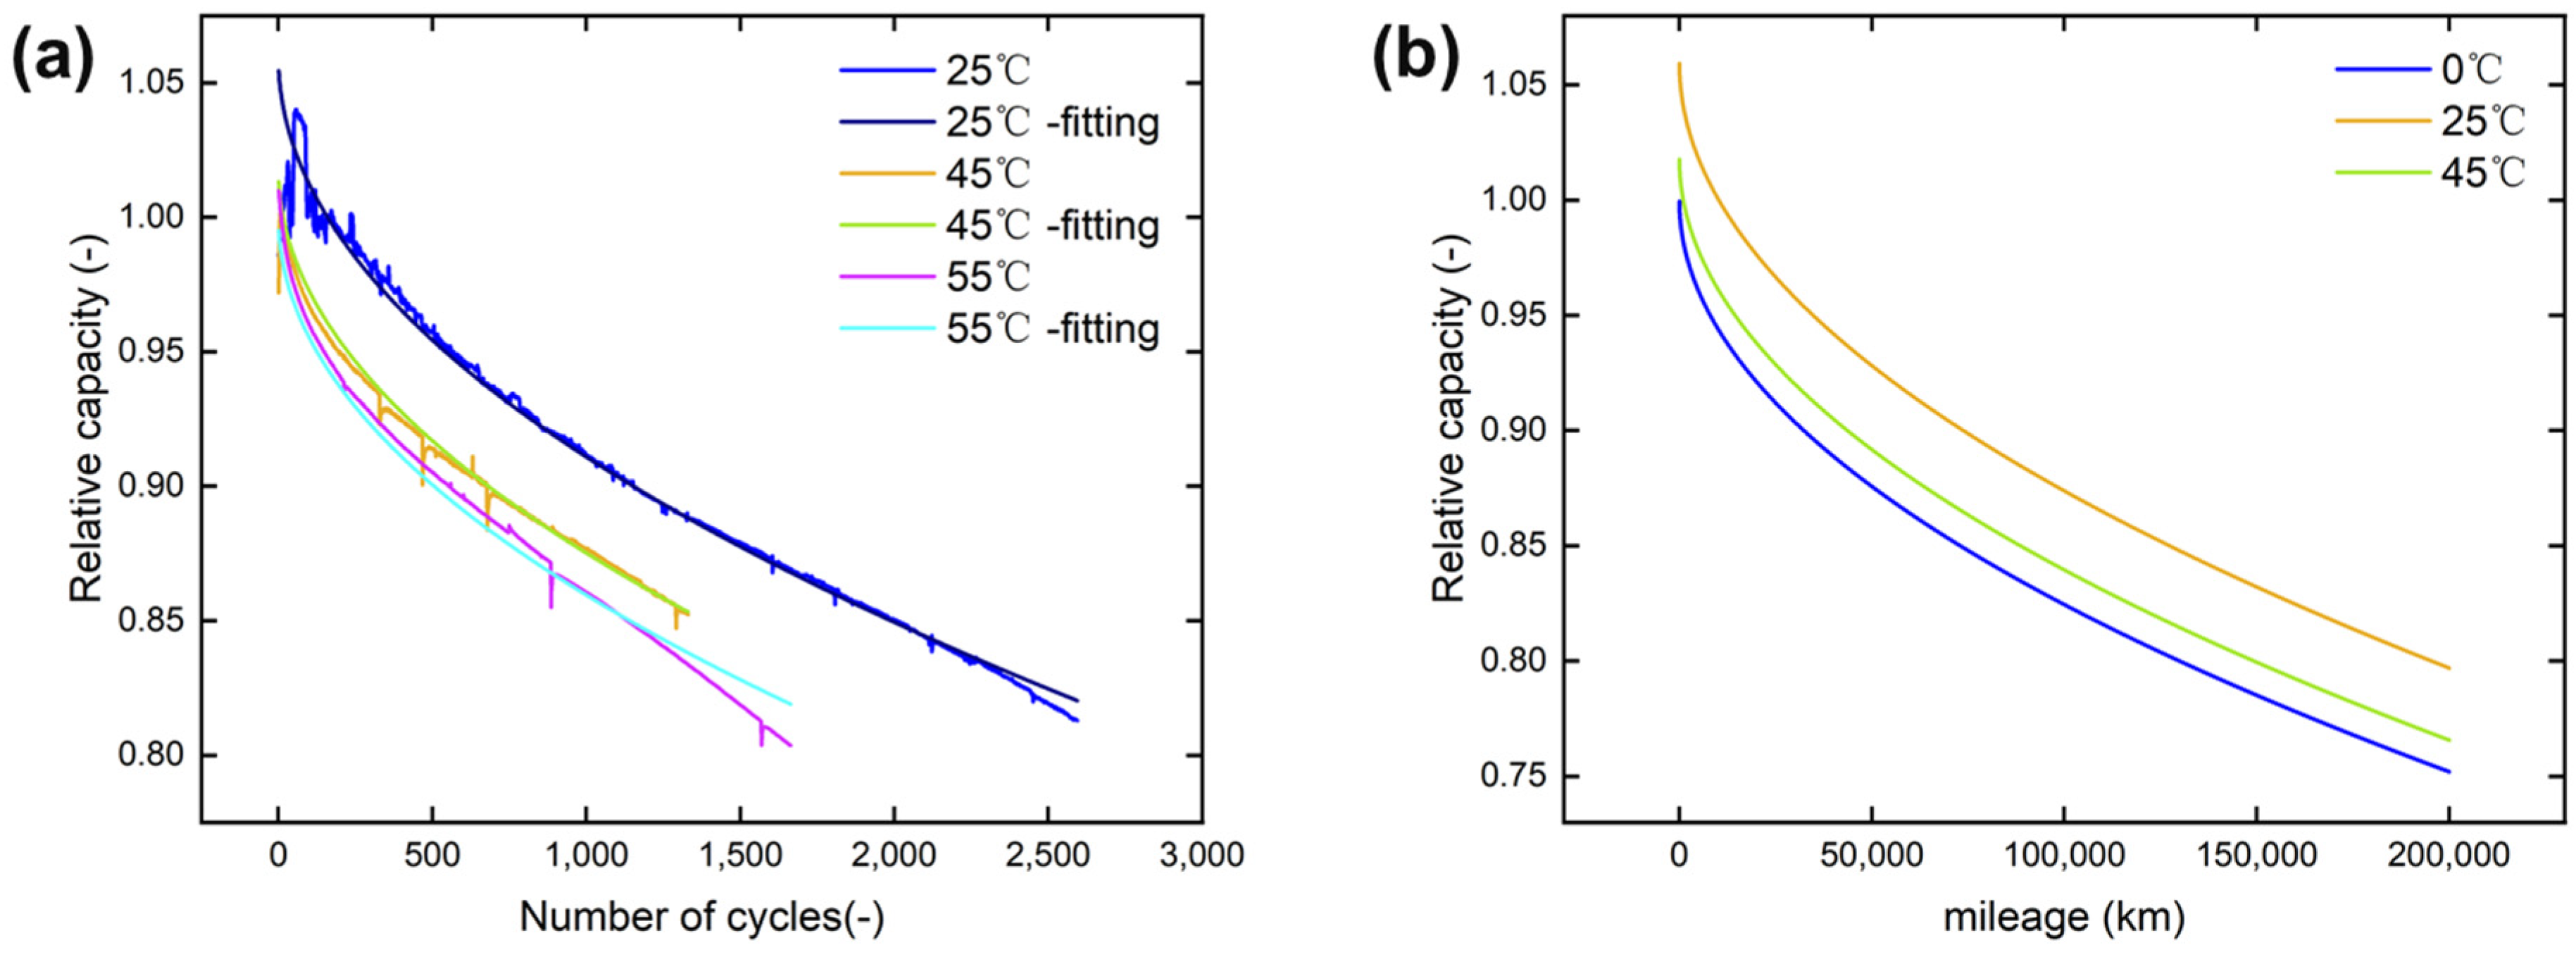
2.2.3. Capacity Loss Reliability Model

The loss of active electrode material, loss of active lithium ions, SEI formation, and other side reactions inside the battery can cause capacity degradation, and capacity is one of the important indicators for battery performance evaluation. Under the cycle aging test conditions, the relationship between battery capacity and the number of charge/discharge cycles can be expressed as Equation (4):
Q = θ T a 0 + a 1 × t 1 2
where Q is the relative capacity of the battery with a maximum value of 1, θ T is the temperature correction factor introduced by the Arrhenius formula, a 0 and a 1 are the parameters that need to be calibrated according to the laboratory test data, and t is the number of cycles of the battery. The expression of θ T is illustrated as follows:
θ T = e x p a · E a R u g 1 T t 1 T r e f
where a is the parameter to be determined, E a is the battery reaction activation energy, R u g is the universal gas constant, T t is the operating temperature of the battery, and T r e f is the reference temperature, typically 273.15 K. In the subsequent calibration process of a , a · E a / R u g can be fitted as a constant. Finally, the capacity loss for a battery can be obtained by Equation (6):
Q = θ T 1.059 0.00469 × t 1 2 = exp 188 1 T t 1 298.15 1.059 0.00469 × t 1 2
The results of fitting the battery capacity and the number of cycles obtained from the test data are shown in Figure 5a. Based on the practical vehicle data, the number of cycles in the horizontal coordinate is replaced by the vehicle mileage to obtain Figure 5b. In this paper, the relative capacity is considered as the reliability parameter of the battery capacity.

2.2.4. Cloud Platform Application

The performance of a lithium-ion battery module is consistent with the “barrel effect”, i.e., the overall performance of the entire lithium-ion battery module depends on the single cell with the worst performance in the module, and the life of the module also depends on the single cell with the shortest life in the module. Once its life is over, the battery connected to it is also scrapped. The reliability model developed in this paper assumes that there is only one short cell in the battery module or system, at which point the cell with the most severe undervoltage and capacity loss reaches a warning level, and the battery module needs to be alarmed. The inconsistency parameter describes the performance distribution of all cells in the battery module and can be used to troubleshoot the system.
After calibrating the reliability model with single-vehicle data as the baseline, gradually add multi-vehicle operation data on the cloud platform and continuously fit and modify the single-vehicle model. With the continuous access to the cloud platform data, the model parameters will be gradually stabilized, and the reliability model has the ability to describe the battery performance accurately. As shown in Figure 6, the vehicle undervoltage reliability parameter after platform data iteration converges at 0.22 and the inconsistency reliability parameter converges at 3.05. For the capacity model, 0.75 or 0.8 is usually selected as the capacity threshold when the vehicle is retired. Hence, the outlier screening and threshold alarm method based on the 3 σ criterion can be established to realize the fault vehicle diagnosis.
A thermal runaway vehicle was selected from the cloud platform for testing, as shown in Figure 7, which occurred at the moment of “15 September 2021 17:58:05”, when the voltage data had obvious outliers. The calculation shows that in the “14 September 2021 17:57:58” moment, 24 h before the thermal runaway is detected by the traditional threshold algorithm, the undervoltage reliability is 2.78 × 10⁻¹⁰ and the inconsistency reliability is 0.959; at this time, the vehicle’s mileage is 63,871 km, corresponding to the capacity loss reliability of 0.9126. At this time, although it has not reached the capacity warning threshold, it has triggered the platform to set the undervoltage reliability lower than the 0.1 limit, so it has realized the early warning for the faulty vehicle.

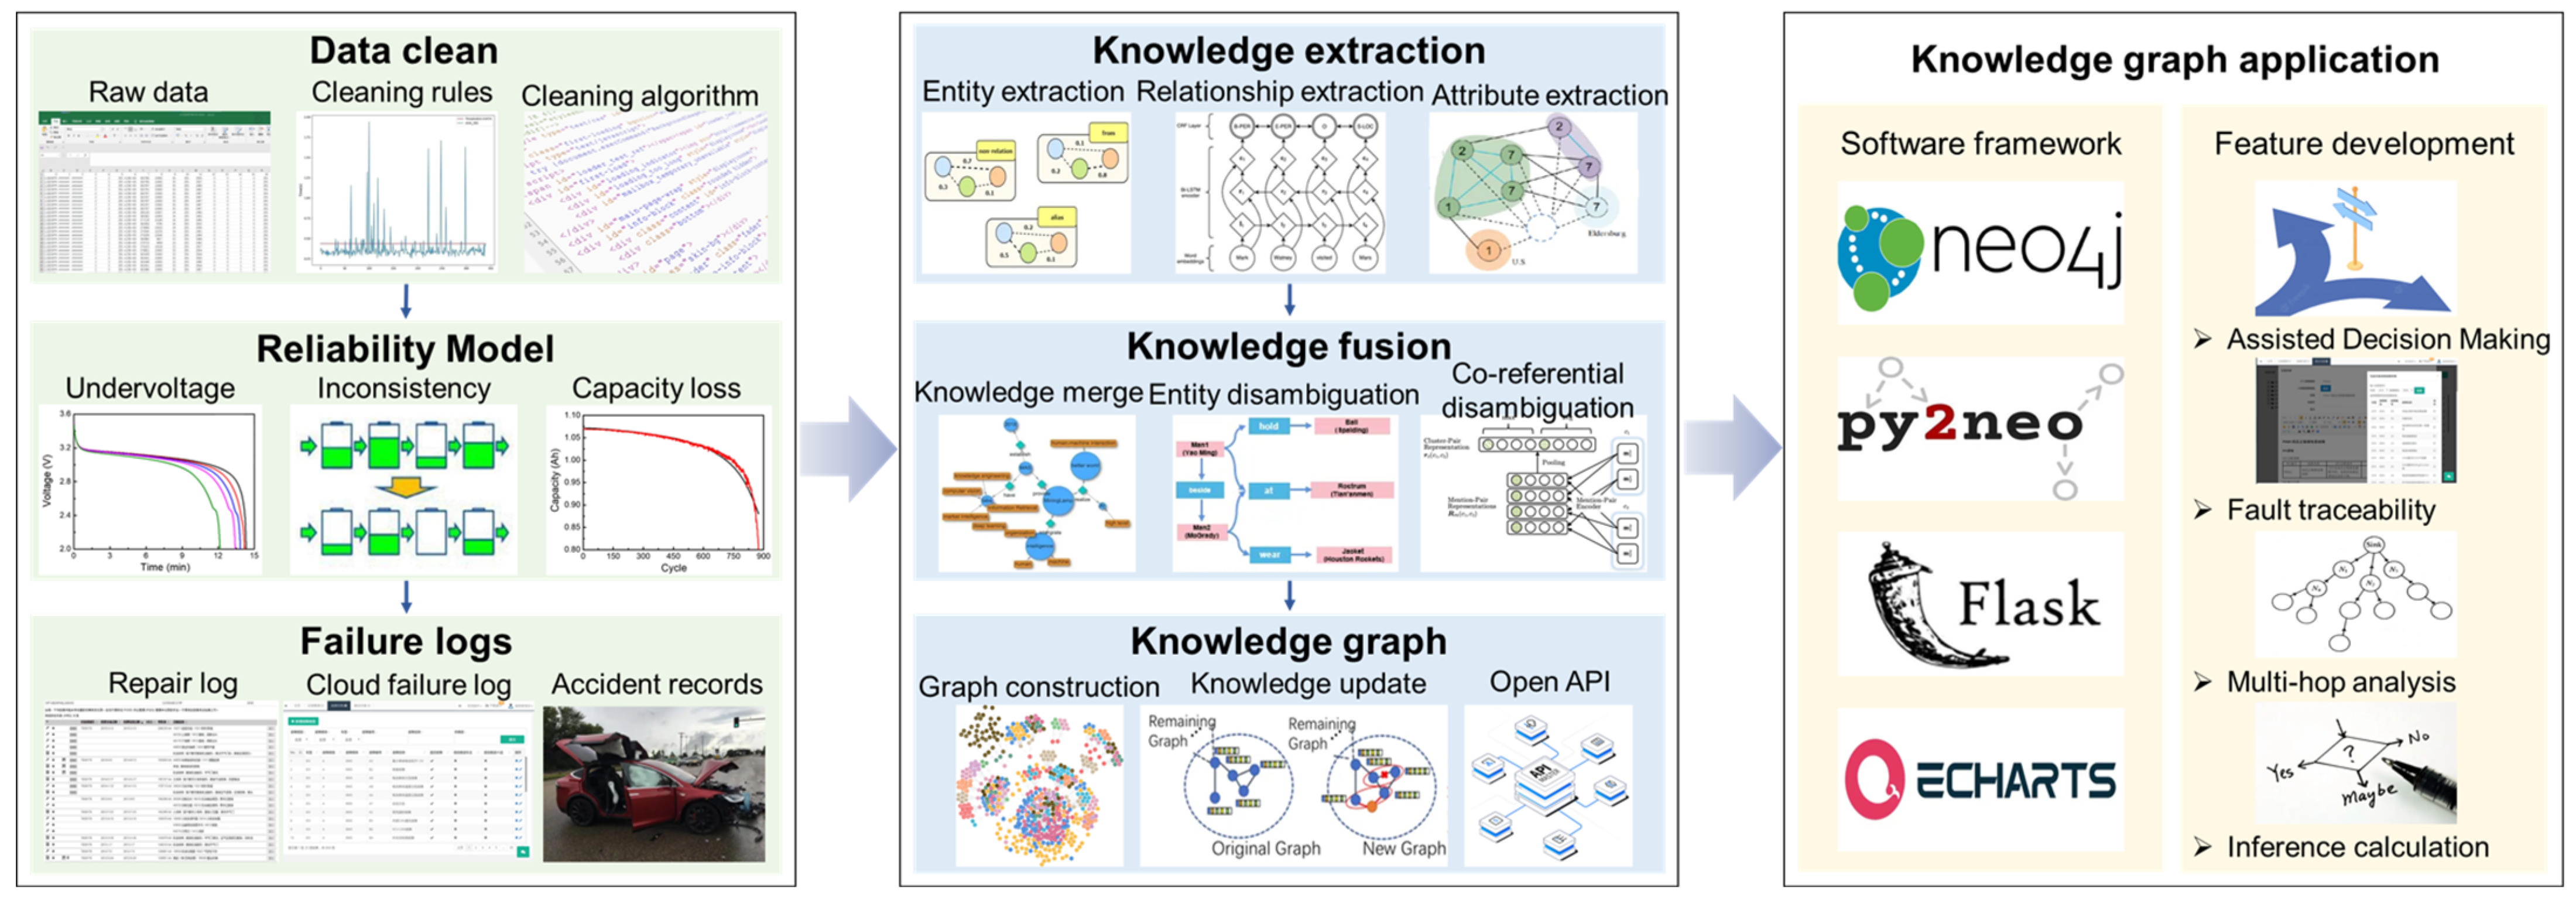
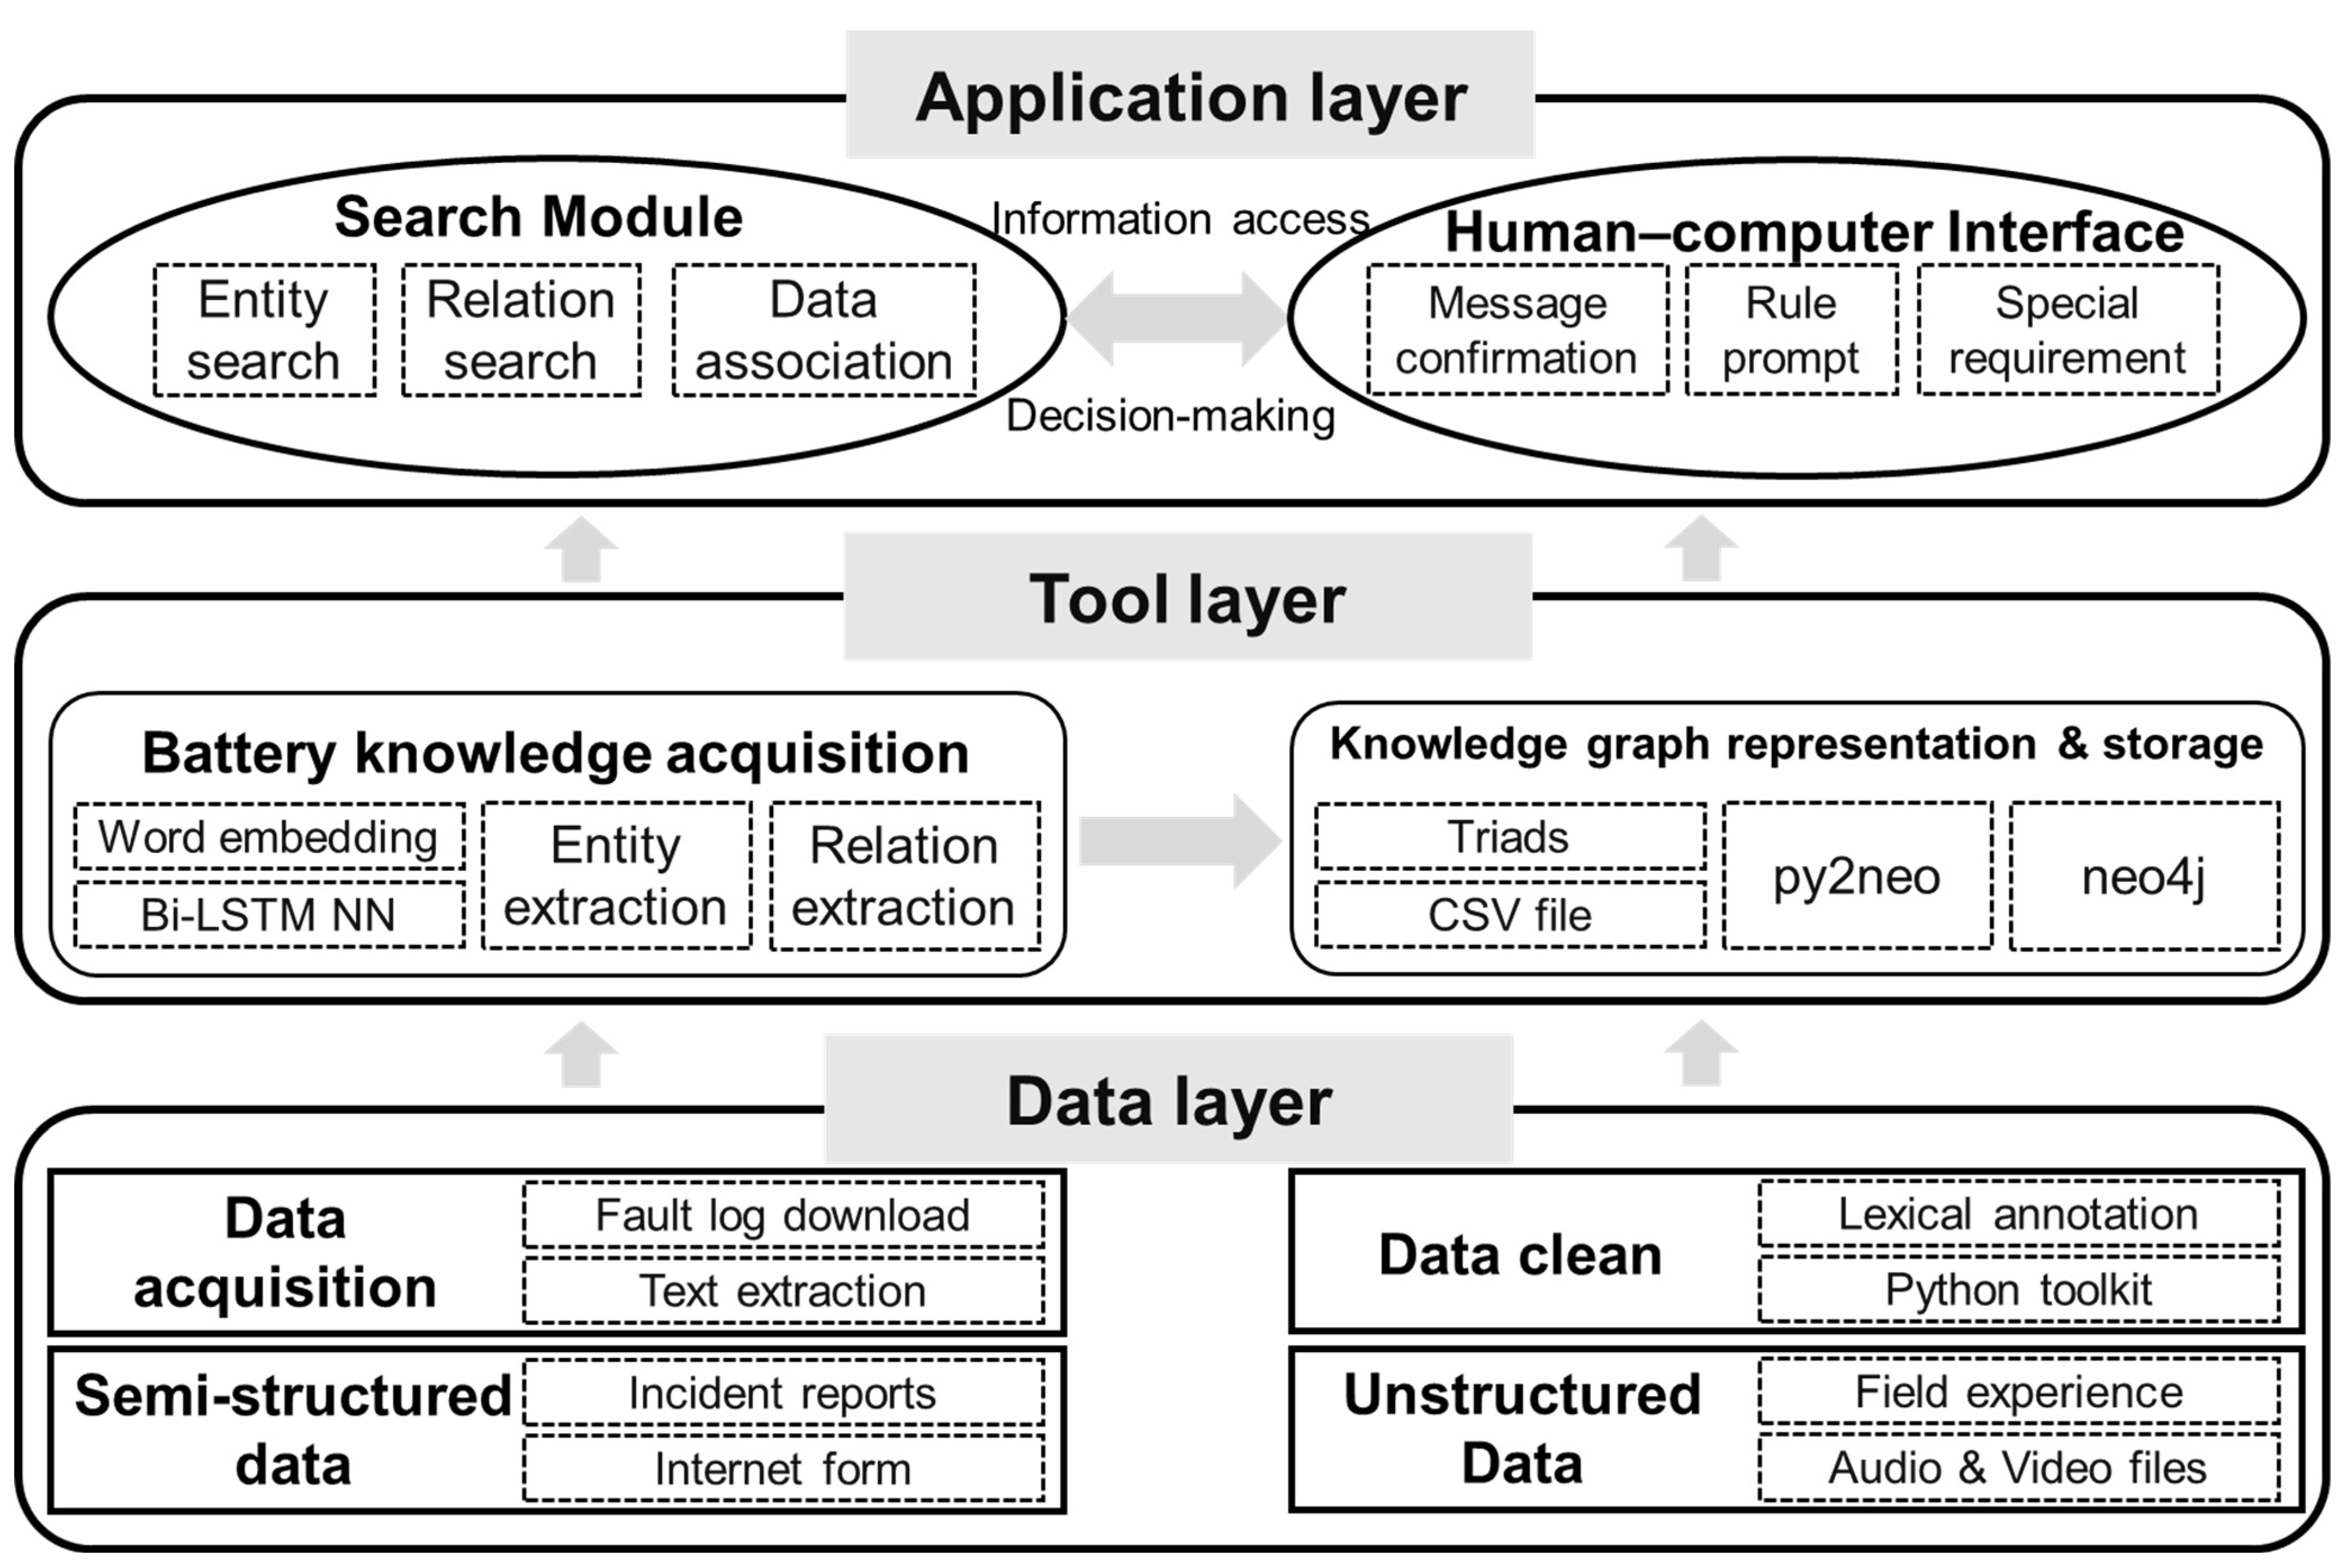
3. Battery Failure Knowledge Graph

The reliability model can realize real-time monitoring and fault diagnosis of vehicles on the cloud platform, and the causes of vehicle faults could be recorded by after-sales and maintenance. In this section, information from fault logs is summarized and a battery fault knowledge graph is constructed as shown in Figure 8, which can provide the basis for efficient fault diagnosis and interpretable fault inference in the future.

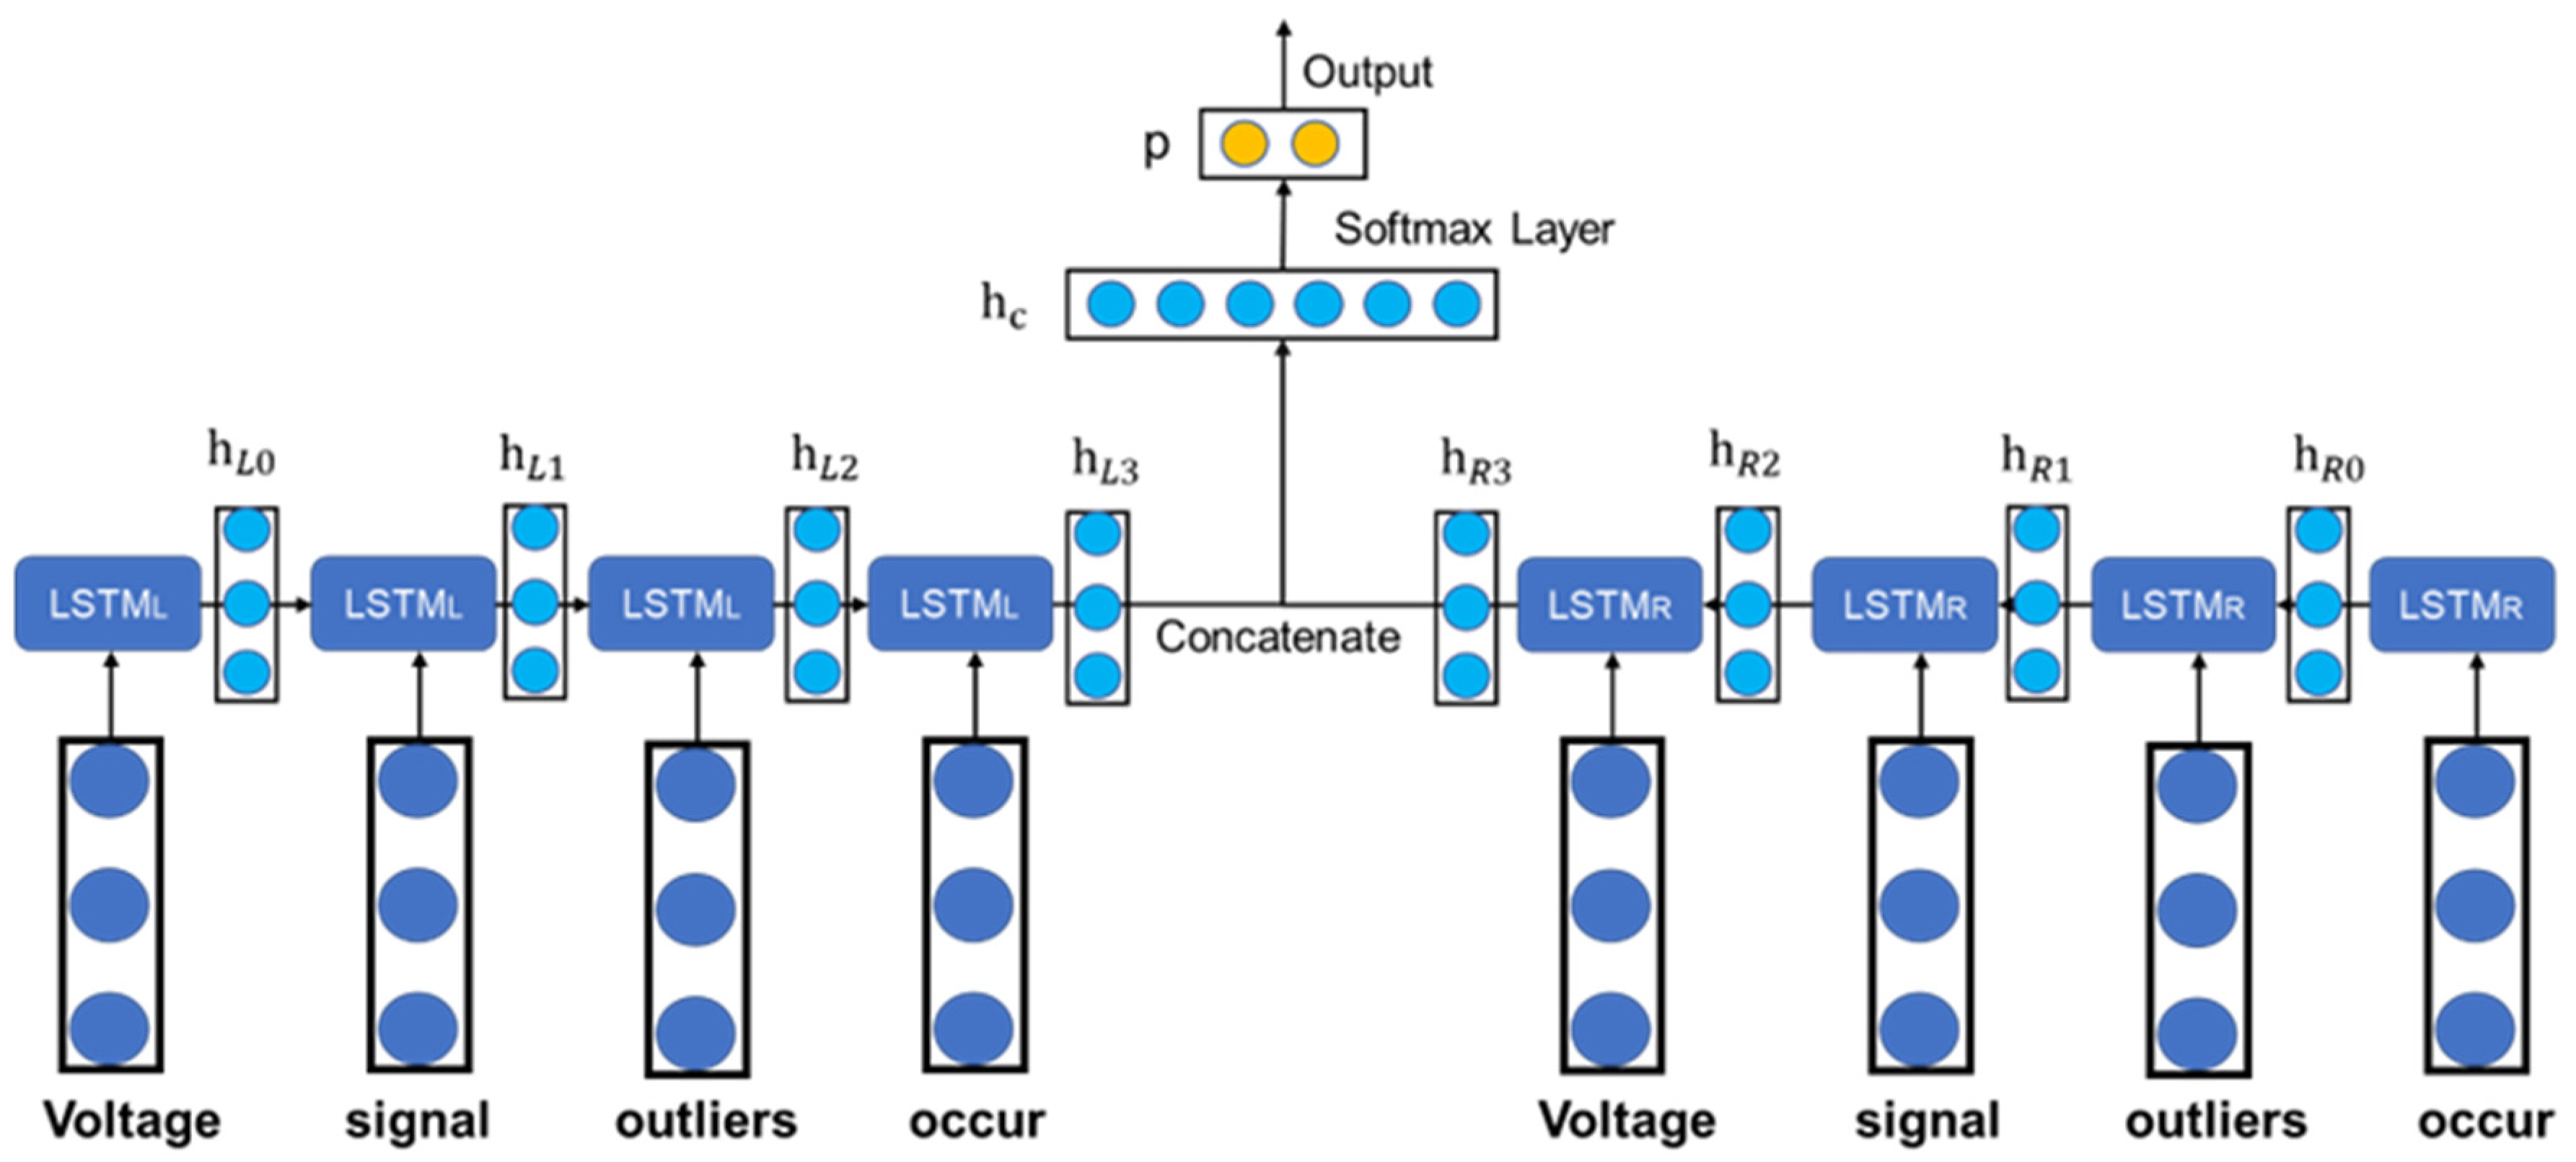
3.1. Knowledge Extraction Based on Bi-LSTM Neural Network

Fault logs are alarm messages that record battery fault information, fault codes, and fault descriptions. Since the data used in this paper come from a wide range of sources and the content of the format is not uniform, the knowledge and relationships need to be extracted to provide the basis for knowledge graph construction. In the field of natural language processing (NLP), in most cases, words in a sentence become features and provide the basis for semantic recognition, classification, and other functions of the whole utterance. The semantics of words and the semantic correlation between words have been a hot topic of research in the field of NLP and information retrieval; for example, “abnormal voltage value in data affects battery performance” and “abnormal current value in data affects battery performance”, the “voltage value” and “current value” in these two sentences express similar meanings; thus, they should have high correlation. The correlation is reflected not only in the correlation of words, but also in the semantics of sentences. Therefore, using the neural network to generate a vector for each word, each dimension in these vectors represents an attribute whose value is closer indicates have stronger relevance. The similarity between two words can be calculated using Equation (7), where φ is the angle of the vector and the similarity is 1 when the two words are exactly similar. Using these word embeddings as parameters of the model, the implicit semantics can be inferred by continuously updating the learning in the model:
S i m i l a r i t y w r o d 1 , w o r d 2 = q w o r d 1 · q w o r d 2 = q w o r d 1 · q w o r d 2 q w o r d 1 · q w o r d 2 = cos φ
An LSTM (long short-term memory) neural network is a classical deep learning model which is commonly used in the field of NLP; its treatment of long-term and short-term memory solves many shortcomings of RNNs (recurrent neural networks), including gradient explosion, gradient disappearance, and poor long-term information storage capacity. Compared with the original RNN model, the LSTM model adds forgetting gate, input gate, and output gate in the hidden layer. The calculation process is as follows:
f t = σ W f h t 1 + U f x t + b f
i t = σ W i h t 1 + U i x t + b i
o t = σ W o h t 1 + U o x t + b o
c ˜ t = tanh W c h t 1 + U c x t + b c
where x t means the input at moment t , h t 1 means the state value of the hidden layer at moment t 1 , x t is equal to the input at moment t , c ˜ t is called the candidate state of the LSTM cell, tanh is the tangent hyperbolic function, and σ denotes the Sigmoid function. W f ,   W i ,   and   W o are the weights of h t 1 for forgetting gate, input gate, and output gate; U f ,   U i ,   and   U o are the weights of x t for forgetting gate, input gate, and output gate; b f ,   b i ,   and   b o are the biases of forgetting gate, input gate, and output gate. The cell state c t 1 at the previous moment is calculated by the forgetting gate and the input gate to obtain the cell state value c t at moment t , illustrated as the following equation:
c t = c t 1 f t + i t c ˜ t
where is the Hadamard product.
The final output h t is derived from o t and c t :
h t = o t tanh c t
The Bi-LSTM neural network consists of two independent LSTM networks, with data fed into two separate models in forward and reverse order. In a natural language processing field, the outputs of the two network structures are spliced and used as the final representation of each word vector. As shown in the structure of the Bi-LSTM neural network in Figure 9, the bidirectional input allows the features to contain both previous and future information, and has better efficiency in feature extraction, as well as word information representation, compared to a single LSTM memory network [25].
The fault log of a vehicle contains information such as vin code, GPS location, manufacturer, fault type, fault alarm level, and fault time. Fault logs with a uniform format can be treated as semi-structured data for knowledge extraction work, for which with a mixed format will have error information, redundant information, interference information, etc. Taking a fault log with a uniform log format for example, in which the format is like “one level over voltage at ‘8 November 2021’ ‘18:29:03’”, the fault logs with mixed formats may appear to include connection noise words, name noise words, orientation noise words, confusing noise words, etc. Types of noise and typical examples are shown in Table 1.
In this paper, the knowledge extraction model is mainly divided into five parts, with the bottom layer labeling the lexical properties of each character in the text according to the policy and serving as input to the model; the second layer is the word embedding layer, where the input characters are converted into a vector for word embedding expression, and each dimension of the vector represents different semantic information of the word; the third layer is the Bi-LSTM layer, where the bi-directional LSTM sequences are spliced to obtain the final output sequence to realize the operation of feature extraction, and the probability of corresponding label for each character is output; the fourth layer is the conditional random field (CRF) layer, which combines the output sequence of the Bi-LSTM layer with the custom annotation information and obtains the training result of adding constraints to the whole text [26]; the last layer converts the computation results into labels for output. Based on more than 6000 fault logs stored by the platform, the training set and test set are divided with a ratio of 7:3, and artificial noise is mixed in the training set to improve the generalization ability of the model. Examples of training set sentence mixed with noise are shown in Figure 10.
The optimal combination of parameters for the neural network is found by optimizing the learning rate, hidden layer dimension, word embedding dimension, and number of iterations. For the model built in this paper, the optimal combination of parameters is that the learning rate is 0.1, the hidden layer dimension is 100, the word embedding dimension is 5, and the iterative training number is 110.

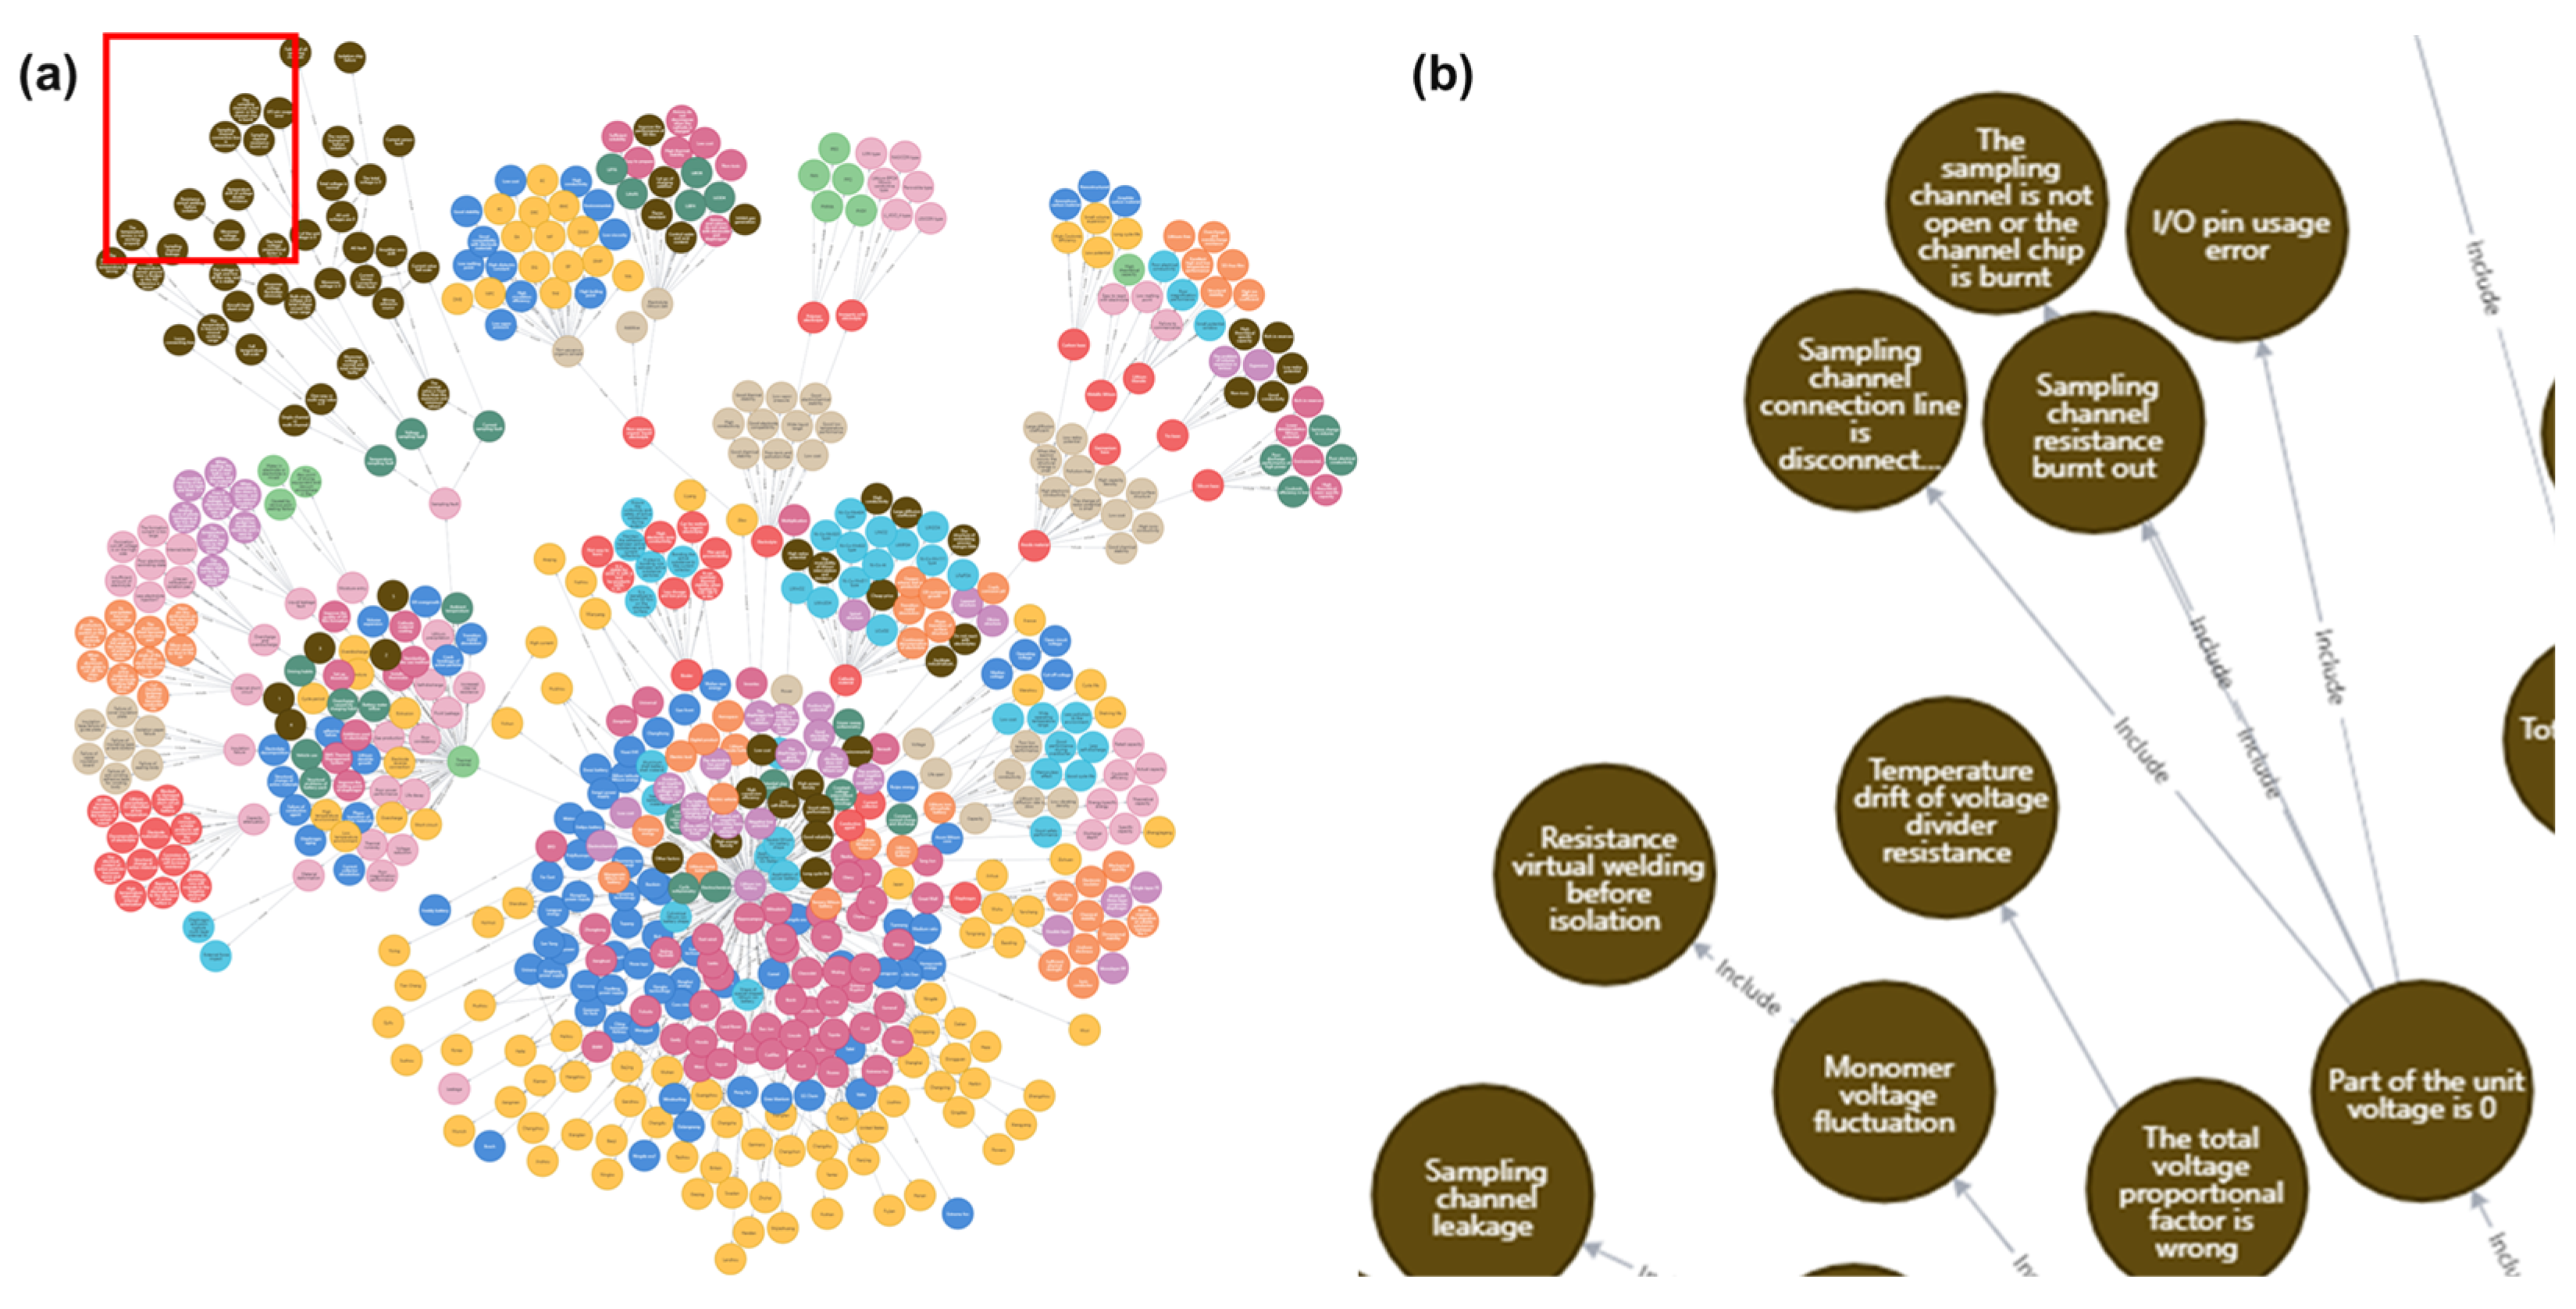
3.2. Battery Fault Knowledge Graph Construction

The knowledge graph is a graphical structure that describes the development and structural relationships of knowledge based on graph databases and visualization techniques. Graph databases are based on graph theory for data storage and query functions and are mainly used to store more relative data. The graph database stores data as nodes and connects nodes to neighboring nodes through relationships, making it easy to retrieve and traverse data in this way. Neo4j, an open-source NoSQL graph database, is one of the most advanced graph databases in the world [27]. The query language is the efficient and intuitive Cypher language [28]. Compared with other databases, Neo4j has the advantages of transparent node relationships, agile and efficient data query, simple and readable query language, and a simple and stable model. Main elements of Neo4j include nodes, attributes, labels, and relationships.
  • Nodes are fundamental elements in a graph database, usually representing entities, similar to records in a relational database.
  • Nodes are connected by relationships, and multiple labels can exist for each node to describe the node’s role within it, as well as various attributes to represent the node’s fundamental values.
  • Attributes are used to express further the critical content of a node, expressed as a string, and can also be indexed.
Using the knowledge and relationships already acquired, a knowledge graph of the battery fault domain is constructed following data collection, knowledge extraction, and knowledge fusion. The pandas’ library in python is used to perform data processing on the data and text of the fault logs, in which the table headers are usually used as labels for the nodes, and the contents of the tables constitute the nodes, forming a triad that can be processed by the software. The knowledge graph constructed in this paper includes more than 600 entities, which mainly have the positive and negative electrode materials, diaphragm, electrolyte, failure phenomena, failure mechanism, operating environment, failure causes, thermal runaway preventive measures, battery manufacturers, location information and the impact of internal short circuit, overcharge and over-discharge on the battery, and much more other knowledge in the field of battery fault detection from multi-dimensional knowledge to develop a more comprehensive summary. The knowledge map in the field of lithium-ion battery fault diagnosis is shown in Figure 11. The bi-directional long short-term memory network classification model established in this chapter enables the automatic extraction of knowledge and relationships from fault logs. It can also be combined with the constructed knowledge graph to be applied in an intelligent question-and-answer system for fault maintenance to extract keywords and provide support and assistance in the areas of after-sales and consultation.

4. Applications and Analysis

Based on the battery fault knowledge graph constructed in the previous section, this chapter uses py2neo as the driver module and the force-oriented diagram in Echarts as the visualization module to realize the front-end visualization interface query function for battery fault diagnosis and to provide users with relevant domain knowledge to assist maintenance personnel in fault reasoning.

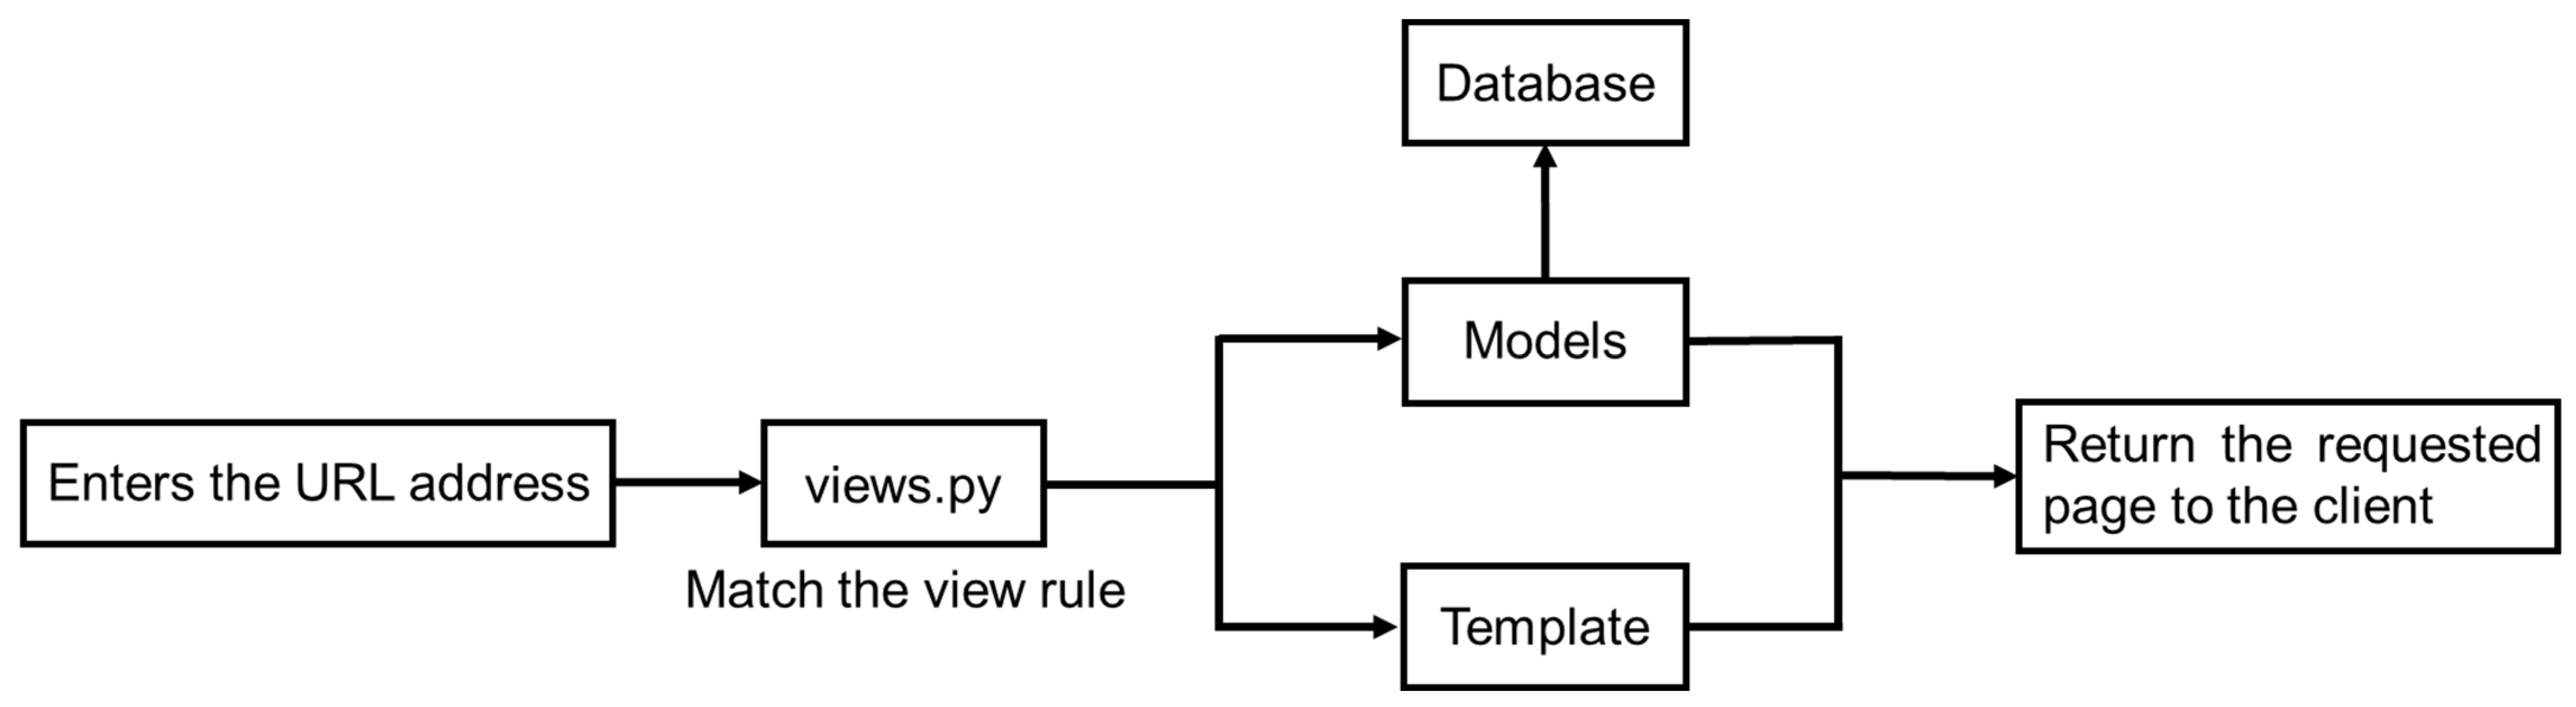
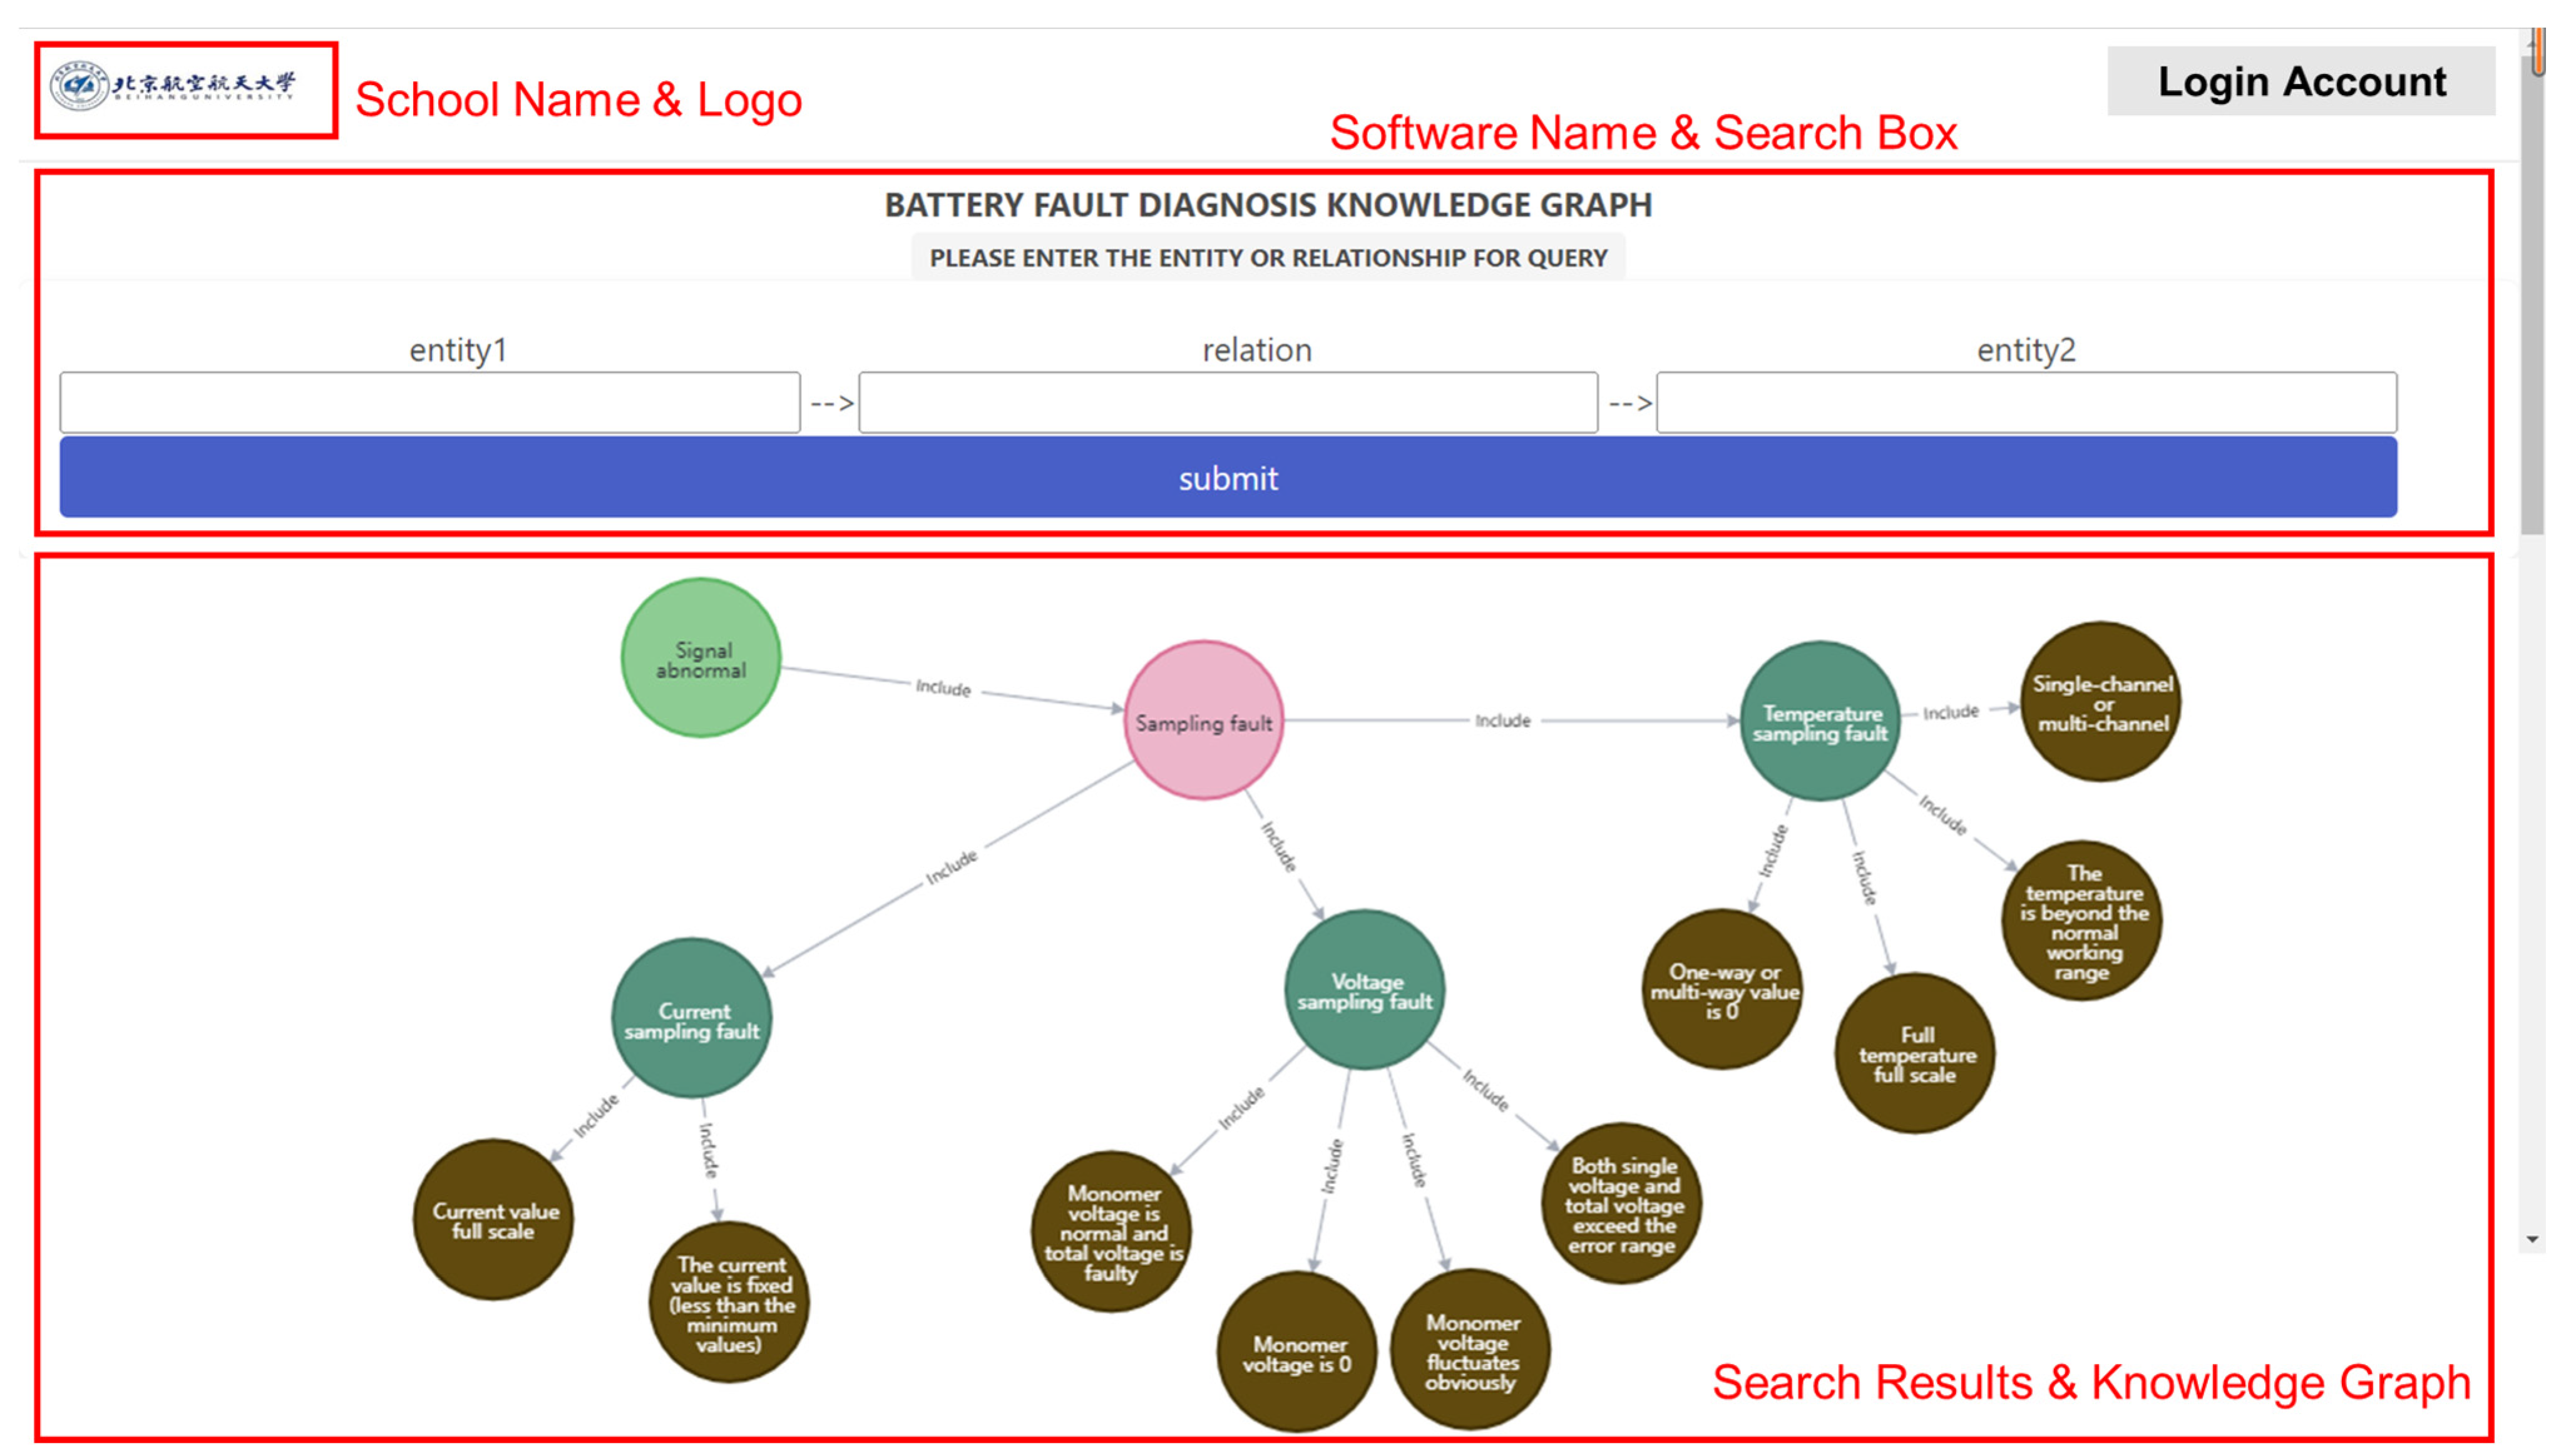
4.1. Battery Fault Knowledge Search Online

The front-end interface built in this paper is based on the flask, an open-source, efficient, and lightweight framework, and the connections of front end, back end, and database follow the MTV software model [29]. The construction process is shown in Figure 12. The connection of front end and database is based on the MTV software model, where “M” stands for “Model”, which is used to write the functions of the program and is responsible for the graph of business objects to the database; where “T” stands for “Template”, which is responsible for how the visual page is presented to the user; and “V” stands for “View”, which is responsible for the business logic and for calling the model and template when appropriate. The three parts are interrelated and form the query page of the knowledge graph.
According to the division of labor in the MTV architecture, the model part is responsible for the management of data; that is, interacting with Neo4j’s graph database, connecting with the database to access the database, and obtaining data according to the relevant requirements. The view part mainly contains logic code, whose primary role is to match the corresponding view function according to the user’s request, and the model layer can obtain the response data, and return the response results to the template part directly, providing the user with a front-end web page that can be viewed now. Its primary role is to render the query results from the view module into the web page for the user to view. The specific steps are as follows:
  • Submit the query via a form on the front-end page;
  • The back office receives the request message, disassembles it, and assembles the Cypher statement;
  • Query node and relationship information in the Neo4j graphical database by executing cypher statements;
  • Processing and filtering of the query results by the back end once the results have been obtained;
  • Finally, the processed information is used to render the front-end interface, together with the Echarts chart library, to visualize the knowledge graph.
As users enter information in different formats on the front-end pages, different results should be returned for various input formats as the Cypher language rule for querying in the Neo4j database is “MATCH (n1:A {name: “B”})-[relation: C] -> (n2:D{name: “E”}) RETURN n1, rel, n2”, where A, B, C, D, and E represent the label of entity one, the node name of entity one, the relation, and the label of entity, respectively. In the actual query process, there is no restriction on the input of these five parts, but if there is a node name, then the label of that node needs to be added to the search as well. When the user enters a form that matches a view function, the information structure is analyzed and checked against the different view functions. Taking “Signal abnormal. Sampling failure Include Sampling failure. Current sampling failure” as an example, the query logic is shown in Table 2, and the results are shown in Figure 13.

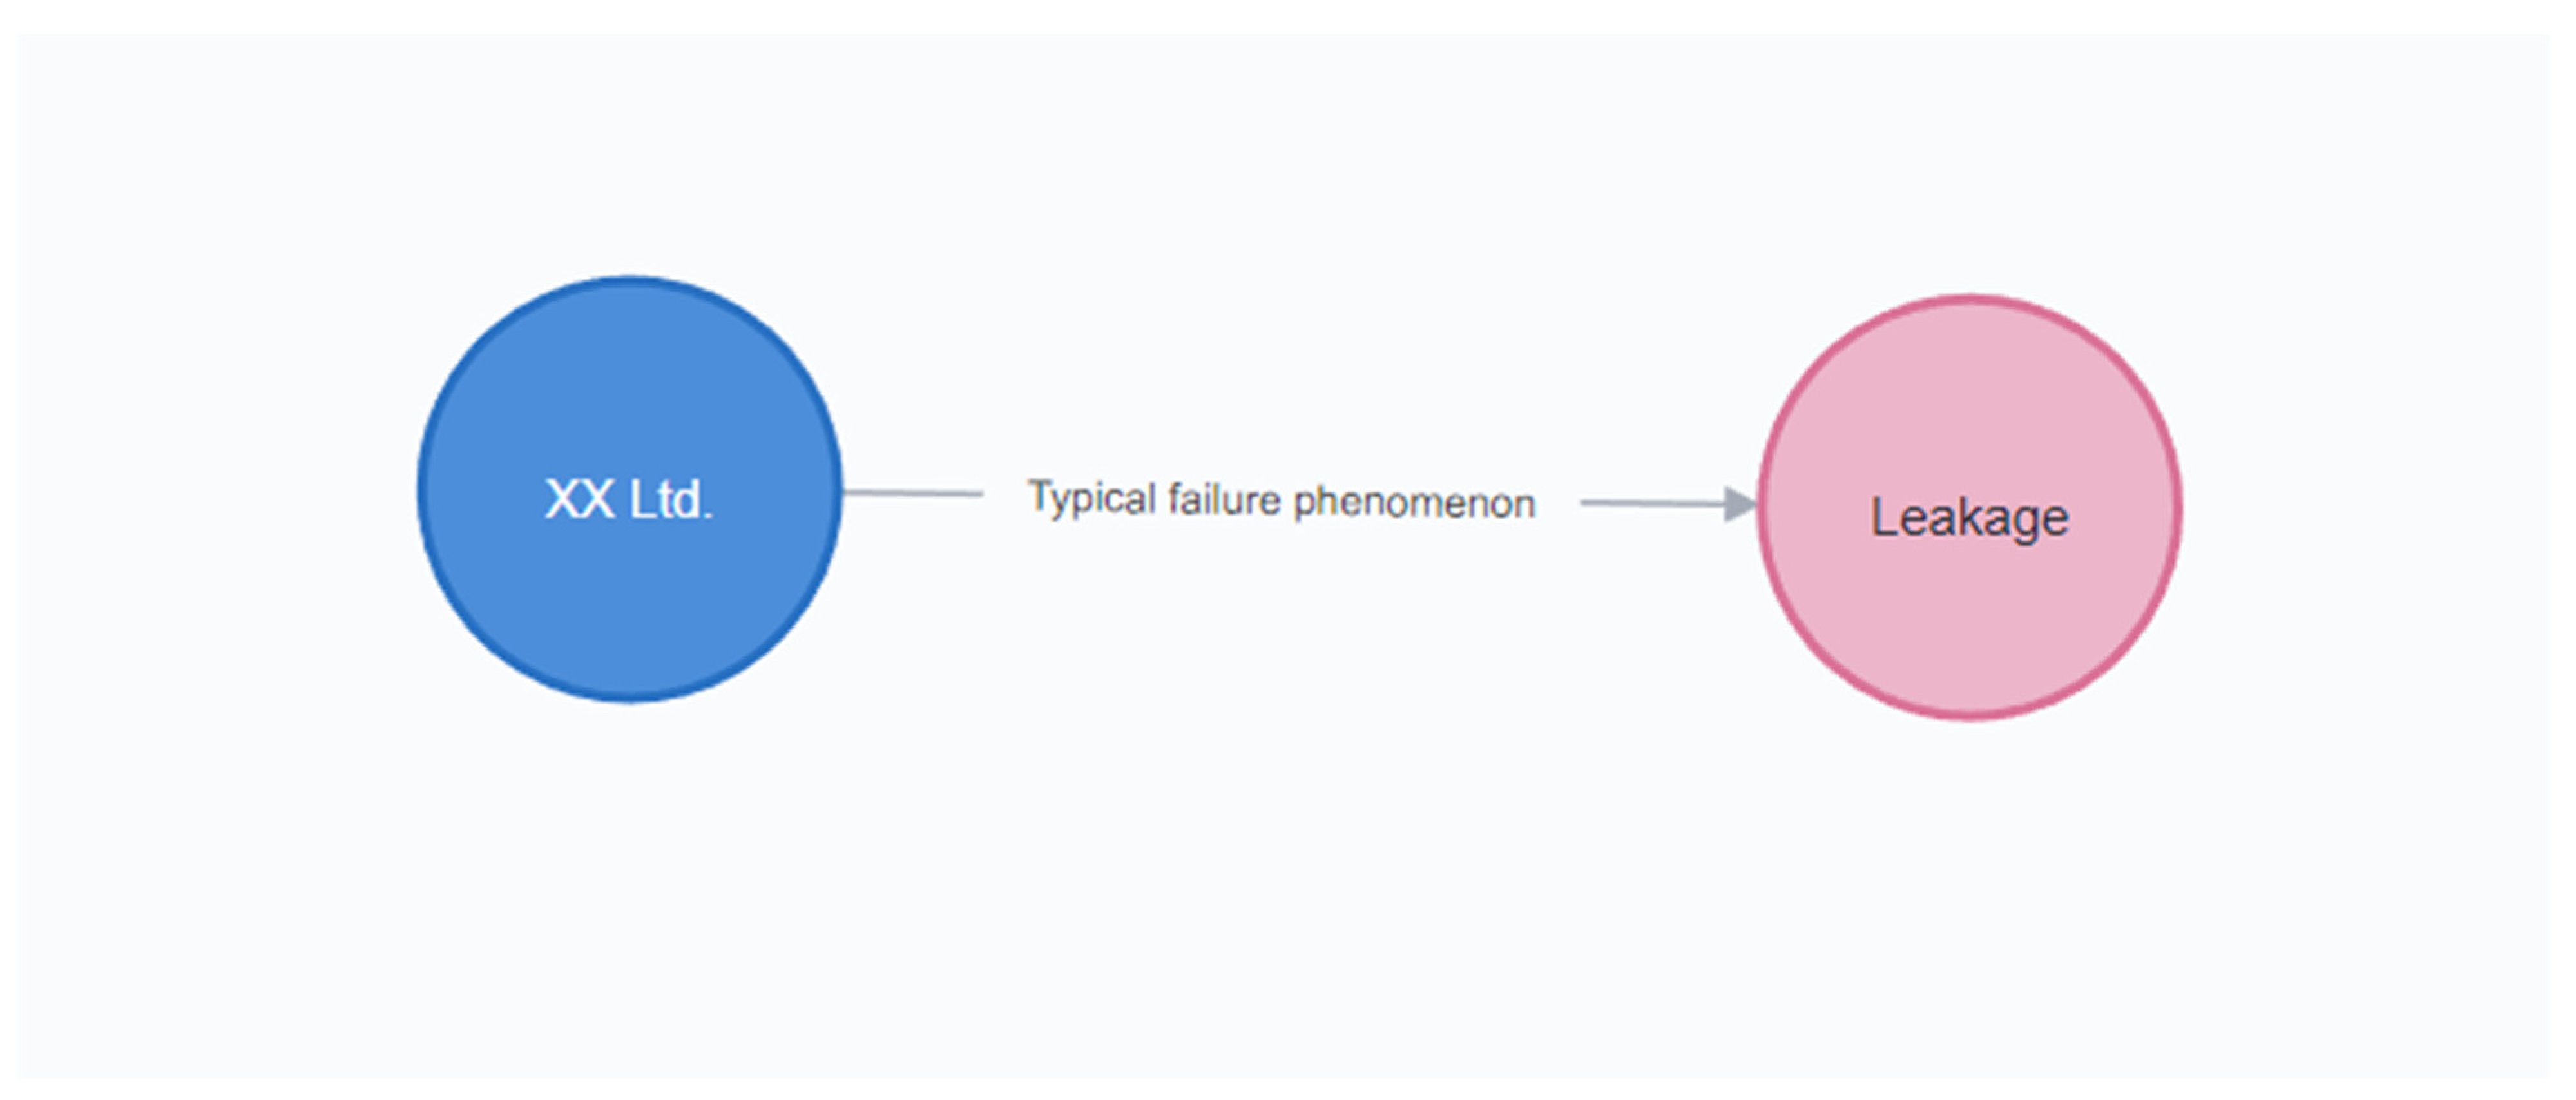
4.2. Battery Fault Reasoning and Decision Making

The traditional manual verification of vehicle faults is less efficient. With the assistance of knowledge graphs, more efficient and accurate fault reasoning and decision-making can be achieved, as shown in Figure 14. The human–computer interaction fault inference system is mainly divided into the data layer, building layer, and application layer [30].
The function of the data layer is to collect data from lithium-ion battery fault logs and knowledge on the internet, and complete data processing by cleaning the confusing data to provide data support for the construction of the lithium-ion battery fault diagnosis domain. The tool layer includes the process of knowledge extraction, knowledge fusion, and knowledge calculation, and the data collected are stored in Neo4j in a triad format to provide support for the subsequent realization of fault traceability and auxiliary decision-making functions. In the application layer, human–computer interaction is carried out by combining the knowledge graph and expert experience, and the actual fault phenomena are combined with the knowledge graph to carry out fault tracing, providing information support for the expert’s decision-making solutions, and realizing the function of assisting decision-making through the relevance of knowledge in the knowledge graph [31].
Based on the battery cloud platform for a fault alarm, through the algorithm of the initial analysis of battery data, you can also start through other information of the battery if you cannot intuitively and clearly distinguish the type of battery failure and the cause of failure. For example, typical failure types of a battery manufacturer plant are known. In the knowledge graph query entity: “battery company name” and the relationship: “typical failure phenomenon”, the corresponding failure phenomenon can be obtained as shown in Figure 15. After obtaining “leakage” as a typical failure phenomenon, more targeted analysis and judgment can be made based on the manifestation and failure characteristics of the leakage, and the online fault diagnosis function of the battery can be realized more efficiently according to different analysis results.

5. Conclusions

This paper constructs domain knowledge graphs for the fault logs stored in the cloud-based battery management platform and implements online search and fault inference for battery fault knowledge. Firstly, based on actual vehicle data, reliability models are established to extract features, including undervoltage, voltage inconsistency, and capacity loss of lithium-ion batteries, respectively. Real-time data in the cloud are used to achieve model update iteration and fault online detection. Then, based on the fault logs of the cloud platform, a knowledge graph for battery fault diagnosis was established by using bi-directional long short-term memory neural network for knowledge extraction and semantic understanding, following the process of “data collection, knowledge extraction, knowledge fusion, graph database modeling”. Finally, based on the MTV model, the front-end visual query interface of the knowledge map is constructed to realize online fault knowledge search, fault reasoning, and decision-making. The battery fault knowledge graph proposed in this paper is not only for the electric vehicle field, but it can also be directly migrated to other industries and professions that use batteries, such as energy storage and electric aircraft. However, the current knowledge graph technology still relies on more upfront technical investment and the deep understanding of experts, and it is difficult to replace humans in the function of inference and learning. Furthermore, an extensive knowledge graph will be built for more comprehensive platform fault logs. Attempts will be made to trace the cause of faults down to the micro level, combined with graph neural networks to complete battery fault inference and prediction.

Author Contributions

Conceptualization, Z.Z. and H.C.; methodology, H.C.; software, Z.Z. and Y.S.; validation, R.C. and Y.S.; formal analysis, L.Z.; investigation, S.Y.; resources, S.Y.; data curation, X.L.; writing—original draft preparation, Z.Z.; writing—review and editing, Y.S. and L.Z.; visualization, Z.Z.; supervision, R.C. and L.Z.; project administration, S.Y. and X.L.; funding acquisition, S.Y. All authors have read and agreed to the published version of the manuscript.

Funding

This work was supported in part by the Key Areas R&D Program of Guangdong Province under Grant 2020B0909030002.

Conflicts of Interest

The authors declare no conflict of interest.

References

  1. Lin, T.; Chen, Z.; Zheng, C.; Huang, D.; Zhou, S. Fault Diagnosis of Lithium-Ion Battery Pack Based on Hybrid System and Dual Extended Kalman Filter Algorithm. IEEE Trans. Transp. Electrif. 2021, 7, 26–36. [Google Scholar] [CrossRef]
  2. Zhang, K.; Hu, X.; Liu, Y.; Lin, X.; Liu, W. Multi-Fault Detection and Isolation for Lithium-Ion Battery Systems. IEEE Trans. Power Electron. 2022, 37, 971–989. [Google Scholar] [CrossRef]
  3. Li, D.; Zhang, Z.; Liu, P.; Wang, Z.; Zhang, L. Battery Fault Diagnosis for Electric Vehicles Based on Voltage Abnormality by Combining the Long Short-Term Memory Neural Network and the Equivalent Circuit Model. IEEE Trans. Power Electron. 2021, 36, 1303–1315. [Google Scholar] [CrossRef]
  4. Qiu, Y.; Dong, T.; Lin, D.; Zhao, B.; Cao, W.; Jiang, F. Fault Diagnosis for Lithium-Ion Battery Energy Storage Systems Based on Local Outlier Factor. J. Energy Storage 2022, 55, 105470. [Google Scholar] [CrossRef]
  5. Zhao, Y.; Liu, P.; Wang, Z.; Zhang, L.; Hong, J. Fault and Defect Diagnosis of Battery for Electric Vehicles Based on Big Data Analysis Methods. Appl. Energy 2017, 207, 354–362. [Google Scholar] [CrossRef]
  6. Ojo, O.; Lang, H.; Kim, Y.; Hu, X.; Mu, B.; Lin, X. A Neural Network Based Method for Thermal Fault Detection in Lithium-Ion Batteries. IEEE Trans. Ind. Electron. 2021, 68, 4068–4078. [Google Scholar] [CrossRef]
  7. Ojo, O.J.; Lin, X.; Lang, H.; Hu, X. A Voltage Fault Detection Method Enabled by a Recurrent Neural Network and Residual Threshold Monitor for Lithium-Ion Batteries. In Proceedings of the 2021 IEEE Transportation Electrification Conference and Expo, ITEC 2021, Chicago, IL, USA, 21–25 June 2021; Institute of Electrical and Electronics Engineers Inc.: Piscataway, NJ, USA, 2021; pp. 813–820. [Google Scholar]
  8. Xu, C.; Li, L.; Xu, Y.; Han, X.; Zheng, Y. A Vehicle-Cloud Collaborative Method for Multi-Type Fault Diagnosis of Lithium-Ion Batteries. eTransportation 2022, 12, 100172. [Google Scholar] [CrossRef]
  9. Auer, S.; Kasprzik, A.; Kovtun, V.; Stocker, M.; Prinz, M.; Vidal, M.E. Towards a Knowledge Graph for Science. In Proceedings of the ACM International Conference Proceeding Series, Taipei, China, 13–15 August 2018; Association for Computing Machinery: New York, NY, USA, 2018. [Google Scholar]
  10. Zhuo, J.; Zhu, Q.; Yue, Y.; Zhao, Y.; Han, W. A Neighborhood-Attention Fine-Grained Entity Typing for Knowledge Graph Completion. In Proceedings of the WSDM 2022—Proceedings of the 15th ACM International Conference on Web Search and Data Mining, Tempe, AZ, USA, 21–25 February 2022; Association for Computing Machinery, Inc.: New York, NY, USA, 2022; pp. 1525–1533. [Google Scholar]
  11. Groth, P.; Rula, A.; Schneider, J.; Tiddi, I.; Simperl, E.; Alexopoulos, P.; Hoekstra, R.; Alam, M.; Dimou, A.; Tamper, M. (Eds.) The Semantic Web: ESWC 2022 Satellite Events; Lecture Notes in Computer Science; Springer International Publishing: Cham, Germany, 2022; Volume 13384, ISBN 978-3-031-11608-7. [Google Scholar]
  12. Yang, Y.; Zhu, Y.; Li, Y. Personalized Recommendation with Knowledge Graph via Dual-Autoencoder. Appl. Intell. 2022, 52, 6196–6207. [Google Scholar] [CrossRef]
  13. Groth, P.; Simperl, E.; Gray, A.; Sabou, M.; Krötzsch, M.; Lecue, F.; Flöck, F.; Gil, Y. The Semantic Web-ISWC 2016, Kobe, Japan, 17–21 October 2016; Springer: Cham, Switzerland, 2016. [Google Scholar]
  14. Memmi, G.; Yang, B.; Kong, L.; Zhang, T.; Qiu, M. (Eds.) Knowledge Science, Engineering and Management; Lecture Notes in Computer Science; Springer International Publishing: Cham, Germany, 2022; Volume 13368, ISBN 978-3-031-10982-9. [Google Scholar]
  15. Corcho, O.; Hollink, L.; Kutz, O.; Troquard, N.; Ekaputra, F.J. (Eds.) Knowledge Engineering and Knowledge Management; Lecture Notes in Computer Science; Springer International Publishing: Cham, Germany, 2022; Volume 13514, ISBN 978-3-031-17104-8. [Google Scholar]
  16. Hou, X.; Zhu, C.; Li, Y.; Wang, P.; Peng, X. Question Answering System Based on Military Knowledge Graph. In Proceedings of the 2020 IEEE 19th International Conference on Cognitive Informatics & Cognitive Computing (ICCI*CC), Beijing, China, 4 May 2022; p. 44. [Google Scholar]
  17. Guan, N.; Song, D.; Liao, L. Knowledge Graph Embedding with Concepts. Knowl.-Based Syst. 2019, 164, 38–44. [Google Scholar] [CrossRef]
  18. Gogleva, A.; Polychronopoulos, D.; Pfeifer, M.; Poroshin, V.; Ughetto, M.; Martin, M.J.; Thorpe, H.; Bornot, A.; Smith, P.D.; Sidders, B.; et al. Knowledge Graph-Based Recommendation Framework Identifies Drivers of Resistance in EGFR Mutant Non-Small Cell Lung Cancer. Nat. Commun. 2022, 13, 1667. [Google Scholar] [CrossRef]
  19. Zeng, X.; Tu, X.; Liu, Y.; Fu, X.; Su, Y. Toward Better Drug Discovery with Knowledge Graph. Curr. Opin. Struct. Biol. 2022, 72, 114–126. [Google Scholar]
  20. Liu, H.; Ma, R.; Li, D.; Yan, L.; Ma, Z. Machinery Fault Diagnosis Based on Deep Learning for Time Series Analysis and Knowledge Graphs. J. Signal Process. Syst. 2021, 93, 1433–1455. [Google Scholar] [CrossRef]
  21. Han, H.; Wang, J.; Wang, X.; Chen, S. Construction and Evolution of Fault Diagnosis Knowledge Graph in Industrial Process. IEEE Trans. Instrum. Meas. 2022, 71, 3522212. [Google Scholar] [CrossRef]
  22. Deng, J.; Wang, T.; Wang, Z.; Zhou, J.; Cheng, L. Research on Event Logic Knowledge Graph Construction Method of Robot Transmission System Fault Diagnosis. IEEE Access 2022, 10, 17656–17673. [Google Scholar] [CrossRef]
  23. Alvarez-Alvarado, M.S.; Jayaweera, D. Bathtub Curve as a Markovian Process to Describe the Reliability of Repairable Components. IET Gener. Transm. Distrib. 2018, 12, 5683–5689. [Google Scholar] [CrossRef]
  24. Smith, K.; Wood, E.; Santhanagopalan, S.; Kim, G.-H.; Neubauer, J.; Pesaran, A. Models for Battery Reliability and Lifetime; NREL: Golden, CO, USA, 2013. [Google Scholar]
  25. Dai, S.; Ding, Y.; Zhang, Z.; Zuo, W.; Huang, X.; Zhu, S. GrantExtractor: Accurate Grant Support Information Extraction from Biomedical Fulltext Based on Bi-LSTM-CRF. IEEE/ACM Trans. Comput. Biol. Bioinform. 2021, 18, 205–215. [Google Scholar] [CrossRef]
  26. Lample, G.; Ballesteros, M.; Subramanian, S.; Kawakami, K.; Dyer, C. Neural Architectures for Named Entity Recognition. In Proceedings of the 2016 Conference of the North American Chapter of the Association for Computational Linguistics: Human Language Technologies, San Diego, CA, USA, 12–17 June 2016; Association for Computational Linguistics: Toronto, ON, Canada, 2016. [Google Scholar]
  27. Miller, J.J. Graph Database Applications and Concepts with Neo4j; AIS: Atlanta, Georgia, 2013. [Google Scholar]
  28. Francis, N.; Green, A.; Guagliardo, P.; Libkin, L.; Lindaaker, T.; Marsault, V.; Plantikow, S.; Rydberg, M.; Selmer, P.; Taylor, A. Cypher: An Evolving Query Language for Property Graphs. In Proceedings of the ACM SIGMOD International Conference on Management of Data, Houston, TX, USA, 10–15 June 2018; Association for Computing Machinery: New York, NY, USA, 2018; pp. 1433–1445. [Google Scholar]
  29. Thoutam, V. A Study On Python Web Application Framework. Electron. Netw. Appl. Math. 2021, 1, 48–55. [Google Scholar] [CrossRef]
  30. Yang, S.; Zhang, Z.; Cao, R.; Wang, M.; Cheng, H.; Zhang, L.; Jiang, Y.; Li, Y.; Chen, B.; Ling, H.; et al. Implementation for a Cloud Battery Management System Based on the CHAIN Framework. Energy AI 2021, 5, 100088. [Google Scholar] [CrossRef]
  31. Zheng, P.; Xia, L.; Li, C.; Li, X.; Liu, B. Towards Self-X Cognitive Manufacturing Network: An Industrial Knowledge Graph-Based Multi-Agent Reinforcement Learning Approach. J. Manuf. Syst. 2021, 61, 16–26. [Google Scholar] [CrossRef]
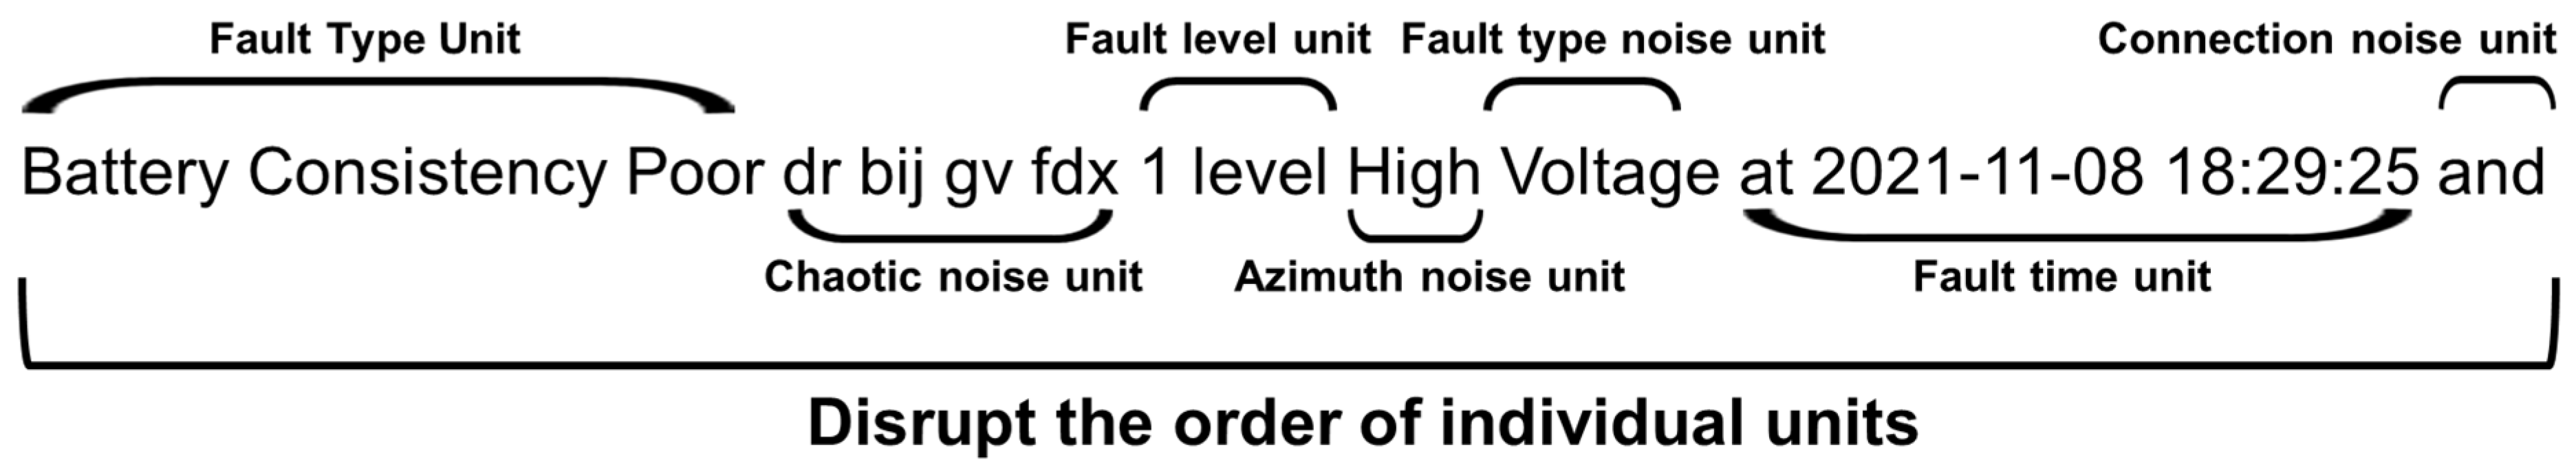
Figure 1. Failure rate curve of the devices.
Batteries 09 00124 g001
Figure 2. Battery reliability modeling method.
Batteries 09 00124 g002
Figure 3. Undervoltage reliability model. (a) Undervoltage probability density curve; (b) undervoltage reliability curve.
Batteries 09 00124 g003
Figure 4. Inconsistency reliability model. (a) Inconsistency indicator curve, (b) inconsistency occurrence frequency curve, (c) inconsistency probability density curve, (d) inconsistency reliability curve.
Batteries 09 00124 g004
Figure 5. Capacity loss reliability model. (a) Battery capacity loss curves at different temperatures; (b) capacity loss reliability curves by replacing battery cycles with mileages.
Batteries 09 00124 g005
Figure 6. Cloud update of the reliability model. (a) Convergence process of the characteristic parameters of the under-voltage reliability model; (b) reference values of the under-voltage model parameters determined after iteration; (c) convergence process of the characteristic parameters of the inconsistency reliability model; (d) reference values of the inconsistency model parameters determined after iteration.
Batteries 09 00124 g006
Figure 7. The last 100 days of the thermal runaway vehicle battery cell voltage curve. (The purple curve is the voltage data of the abnormal cell, the others are the voltage data of the normal cell).
Batteries 09 00124 g007
Figure 8. The framework for constructing the battery failure knowledge graph. (From left to right shows the framework of this paper, respectively, the data cleaning and fault diagnosis part, the knowledge extraction and knowledge graph construction and the application of the knowledge graph).
Batteries 09 00124 g008
Figure 9. Structure of a Bi-LSTM neural network. (The dark blue part of the image to the yellow part shows how the key information in the sentence is extracted into the output).
Batteries 09 00124 g009
Figure 10. Examples of training set sentence mixed with noise.
Batteries 09 00124 g010
Figure 11. Knowledge graph of lithium-ion battery fault diagnosis based on Neo4j. (Different colors represent the types of different nodes and the relationship with neighboring nodes).
Batteries 09 00124 g011
Figure 12. MTV model of the query interface.
Batteries 09 00124 g012
Figure 13. Battery fault diagnosis knowledge graph query result. (Nodes in pink represent entity 1, nodes in other colors represent nodes included by entity 1 (cause of failure)).
Batteries 09 00124 g013
Figure 14. Schematic diagram of overall framework of lithium-ion battery fault diagnosis aided decision-making system based on knowledge graph.
Batteries 09 00124 g014
Figure 15. Application example of auxiliary decision-making system.
Batteries 09 00124 g015
Table 1. Examples of different types of noise.
Noise TypeExample
connection noise words‘and’, ‘or’, ‘not’, etc.
name noise words‘soc’, ‘voltage’, ‘temperature’, etc.
orientation noise words‘over’, ‘under’, etc.
confusing noise words‘dfa’, ‘gfaer’, etc.
Table 2. Query logic in the example.
ABCDEExample of Input
1YesYesYesYesYes“Signal abnormal. Sampling fault”, “Include”, “Sampling fault. Current sampling fault”
2YesYesNoYesYes“Signal abnormal. Sampling fault”, “”, “Sampling fault. Current sampling fault”
3YesYesYesYesNo“Signal abnormal. Sampling fault”, “Include”, “Sampling fault”
4YesYesNoYesNo“Signal abnormal. Sampling fault”, “”, “Sampling fault”
5YesNoYesYesYes“Signal abnormal”, “Include”, “Sampling fault. Current sampling fault”
6YesNoNoYesYes“Signal abnormal”, “”, “Sampling fault. Current sampling fault”
7YesNoYesYesNo“Signal abnormal”, “Include”, “Sampling fault”
8YesNoYesNoNo“Signal abnormal”, “Include”, “”
9YesNoNoYesNo“Signal abnormal”, “”, “Sampling fault”
10NoNoYesYesNo“”, “Include”, “Sampling fault”
11YesNoNoNoNo“Signal abnormal”, “”, “”
12NoNoYesNoNo“”, “Include”, “”
13NoNoNoYesNo“”, “”, “Sampling fault”
14NoNoNoNoNo“”, “”, “”
Disclaimer/Publisher’s Note: The statements, opinions and data contained in all publications are solely those of the individual author(s) and contributor(s) and not of MDPI and/or the editor(s). MDPI and/or the editor(s) disclaim responsibility for any injury to people or property resulting from any ideas, methods, instructions or products referred to in the content.

