Article

Modeling Silicon-Dominant Anodes: Parametrization, Discussion, and Validation of a Newman-Type Model

Chair of Electrical Energy Storage Technology, Department of Energy and Process Engineering, School of Engineering and Design, Technical University of Munich, Arcisstraße 21, 80333 Munich, Germany
*
Author to whom correspondence should be addressed.
Batteries 2023, 9(11), 558; https://doi.org/10.3390/batteries9110558
Submission received: 18 October 2023 / Revised: 10 November 2023 / Accepted: 13 November 2023 / Published: 15 November 2023
(This article belongs to the Topic Electrochemical Energy Storage Materials)

Abstract

:
Silicon is a promising anode material and can already be found in commercially available lithium-ion cells. Reliable modeling and simulations of new active materials for lithium-ion batteries are becoming more and more important, especially regarding cost-efficient cell design. Because literature lacks an electrochemical model for silicon-dominant electrodes, this work aims to close the gap. To this end, a Newman p2D model for a lithium-ion cell with a silicon-dominant anode and a nickel-cobalt-aluminum-oxide cathode is parametrized. The micrometer silicon particles are partially lithiated to 1200 mAh g Si 1 . The parametrization is based on values from the electrode manufacturing process, measured values using lab cells, and literature data. Charge and discharge tests at six different C-rates up to 2C serve as validation data, showing a root-mean-squared error of about 21 mV and a deviation in discharge capacity of about 1.3%, both during a 1 C constant current discharge. Overall, a validated parametrization for a silicon-dominant anode is presented, which, to the best of our knowledge, is not yet available in literature. For future work, more in-depth studies should investigate the material parameters for silicon to expand the data available in the literature and facilitate further simulation work.

1. Introduction

Since their market launch in 1991 [1], lithium-ion batteries (LIBs) have developed into an everyday energy storage device, powering almost all mobile electronic devices [2]. Graphite has been the anode material of choice, despite a comparably low gravimetric capacity of 372 mAh g Gr 1 . Even as early as in the 1960s, about 30 years before the market launch of commercial LIBs, silicon (Si) has been known to be able to store 3579 mAh g Si 1 or even up to 4212 mAh g Si 1 via electrochemical alloying to Li15Si4 or Li22Si5, respectively. This is more than ten times the capacity of graphite [3]. At the same time, silicon has a comparable or even lower mass density than graphite [3], rendering it a potentially interesting anode material. However, the volume of silicon changes drastically during (de)lithiation, introducing several problems, e.g., mechanical cracking and disintegration, loss of electric contact, or breakdown of the solid-electrolyte interphase (SEI) [3].
Silicon’s high specific capacity is utilized in composite anodes consisting of both graphite and silicon. By adding small amounts of silicon to conventional graphite anodes, their capacity can be increased. Such composite anodes have been investigated and commercialized already [4,5,6,7,8,9]. Pure-silicon and Si-dominant anodes, on the other hand, usually are mechanically unstable due to the large volume changes of up to 300% upon (de)lithiation [10]. Ko et al. [10] summarized several approaches to manage this and to enable pure-silicon and silicon-dominant anodes as a successor to graphite anodes. The approaches include size-controlled materials, patterned thin films, shape-preserving shell designs, porous structures, and graphene composites. The silicon anode used in this work belongs to the category of porous structures. In the work of Ko et al. [10], most of the porous structures were synthesized via electrochemical etching of a silicon wafer resulting in nanometer-sized pores. The silicon in this work, however, consists of micrometer-sized silicon particles prepared via jet milling of photovoltaic grade silicon lumps [11]. Obrovac and Krause [12] proposed partial lithiation as another approach to increase cycle life and maintain electrode integrity while still providing higher gravimetric capacities than graphite at full lithiation. This concept of partial lithiation also holds true for the electrode design used in this work, as shown by Jantke et al. [11]. Haufe et al. [13] investigated the failure mechanism of this electrode design with partially lithiated Si. They found that the main failure mechanism is the continuous formation of SEI. Another major contribution is found in particle decoupling when operating at low discharge voltages.
With an appropriate model, an estimation about (im)practical cell designs without the need for time- and cost-intensive experiments is possible. Doyle et al. [14] proposed the dual insertion model, also known as the pseudo-2D (p2D) model or Newman model, which is capable of describing the electrochemical behavior of a rocking-chair cell. Since its publication in 1993, the Newman model and its variations have become a famous and widely used approach for physicochemical modeling of LIBs. For example, it has been used to describe relaxation phenomena [15], short-circuit events [16], or to aid cell design [17]. Additionally, the original publication by Doyle et al. [14] has gained increased research interest over the years, receiving 20% of all citations in the last two years. However, the model first and foremost considers insertion reactions. Hence, care should be taken when using the p2D model for alloying materials, because surface processes (electrode kinetics) as well as transport processes inside the particles (solid phase diffusion) might differ from the implemented processes in the standard p2D model.
Table 1 lists a selection of different simulation models all related to silicon. The models found in the literature cover a wide range of different application scenarios and a variety of different model classes, such as finite element method model, density functional theory models, or impedance-based models, can be found.
When it comes to electrochemical modeling of silicon electrodes, the literature provides different approaches, most of which rely on the Butler–Volmer equation as a reaction kinetic and Fickian solid phase diffusion. Jiang et al. [18], for example, presented a model depicting the different lithiation stages of silicon. At the same time, different activation energies allow for the representation of crystallization effects and different particle sizes can be accounted for by varying equilibrium potentials. Lory et al. [19] presented an adapted p2D model for a Si-graphite composite anode. The model considers three different active material phases; graphite, a carbon matrix, and nano-silicon embedded in the carbon matrix. Thus, the influence of silicon on the cell behavior can be modeled and investigated. Swamy and Chiang [20] published an impedance-based equivalent circuit model to compare the charge transfer overpotentials of pure silicon particles with those of pure graphite particles with respect to the C-rate and the individual particle radius. According to their results, overpotentials may become rate limiting in dependence on the exchange current density.
Regarding the solid phase diffusion, Obrovac and Krause [12] proposed that a partially lithiated silicon particle would show a core–shell structure with the lithiated amorphous phase as the outer layer and a crystalline core. Such a core–shell structure was also detected by McDowell et al. [31] during a lithation process of a single particle using in-situ transmission electron microscopy measurements. To properly capture the impacts of this core–shell structure in a model, Wang et al. [21] used a two-dimensional single particle diffusion model which also considers a reaction front at the phase boundary. Doing so, they could replicate the experimental results. Such a phase boundary is not readily available for the standard p2D model. However, Bordes et al. [32] investigated polycrystalline silicon particles via transmission electron microscopy and found that lithiation preferentially occurs along defects. The particle then consists of several smaller crystalline cores separated by amorphous “veins”. Such a structure is similar to the porous structure of the electrode where the liquid diffusion is described by an effective diffusion coefficient [14]. In this analogy, the pore space filled with electrolyte is equivalent to the amorphous Si phase, and the solid-phase structure of the electrode is equivalent to the crystalline cores which hinder the overall transport. Thus, from a modeling perspective, such a structure can be described by an effective diffusion coefficient without the need for a moving phase boundary, which can be accomplished with the standard p2D model.
Other models in the literature focus not on electrochemistry but on mechanics. This work does not focus on mechanics and the interested reader is referred to the literature given in Table 1, especially references [22,24,25,26,29].
The aim of this work is to provide a parametrized and validated p2D model for a silicon-dominant electrode, since to the best knowledge of the authors, the literature lacks such a model. The anode coating in this work contains graphite, but it is largely electrochemically inactive and mainly serves as a conductive additive [11]. Thus, the electrode is considered silicon-dominant. The loading of 3.61 mAh cm−2 is application-oriented. Furthermore, the silicon particle diameter is in the micrometer range [11], which has hardly been studied in literature, especially not simulatively. Finally, it is important to mention that the silicon is partially lithiated to only approximately 30% (i.e., approximately 1200 mAh g Si 1 ). This benefits the mechanical integrity and thus the cycling stability of the electrode [11].
For a systematic presentation of its contents, this work is structured as follows. First, the properties of the electrodes used are presented. Second, a literature review for material parameters that could not be determined otherwise is discussed. Third, measurements conducted at coin cells and T-cells are presented and discussed. The equilibrium potential measurements of the silicon electrode are of particular interest here. Fourth, the reconstruction of the full-cell quasi open-circuit potential (qOCP) from measured half-cell qOCP curves is discussed, as the curves are a required model input. In a fifth step, a parameter fitting is performed and validated against the full-cell potential at C-rates up to 2 C for charging and discharging. Finally, the model accuracy is evaluated and recommendations for further work are drawn.

2. Experimental Procedure

The experimental methods in this work are split into three parts: Electrode manufacturing, cell assembly, and operational procedures. This work includes all aspects of these three steps necessary to perform parametrization and simulation of a silicon-dominant anode. A more detailed description to each of these steps can be found in the Supplementary Materials.
Electrode manufacturing was performed by the iwb at the Technical University of Munich. Silicon material was provided by the manufacturer. The preparation of the coating slurry as well as coating and drying of electrode sheets was performed according to the recipe provided by Jantke et al. [11]. The anode coating comprises of 69.70   wt % micrometer Si particles, 19.90   wt % graphite, and 10.4   wt % binders and additives. Note that the graphite is electrochemically inactive and only serves as a conductive agent [11], hence the naming of a silicon-dominant anode. The cathode active material is a commercially available nickel-rich nickel-cobalt-aluminum-oxide (NCA) with a composition of LiNi0.8Co0.15Al0.05O1.985(BO3)0.01. As already mentioned, a more detailed description of further electrode properties related to the manufacturing step can be found in Section S1 along with Tables S1 and S2 of the Supplementary Materials.
The assembled cells are circular coin cells (CR2032) for characterization as well as Swagelok® (Solon, OH, USA) T-cells for validation. Coin cells were assembled as half cells vs. lithium (Li) metal as well as full cells. The data retrieved from the coin cells was used for characterization, especially to retrieve the half-cell equilibrium potentials using an electrode balancing process, which is discussed below. Additionally, Swagelok® T-cells using a three-electrode configuration were assembled as full cells with a Li metal reference electrode. The T-cells were used for validation at higher C-rates. Detailed information on the cell assembly process as well as the separator and electrolyte used are given in Section S2 of the Supplementary Materials.
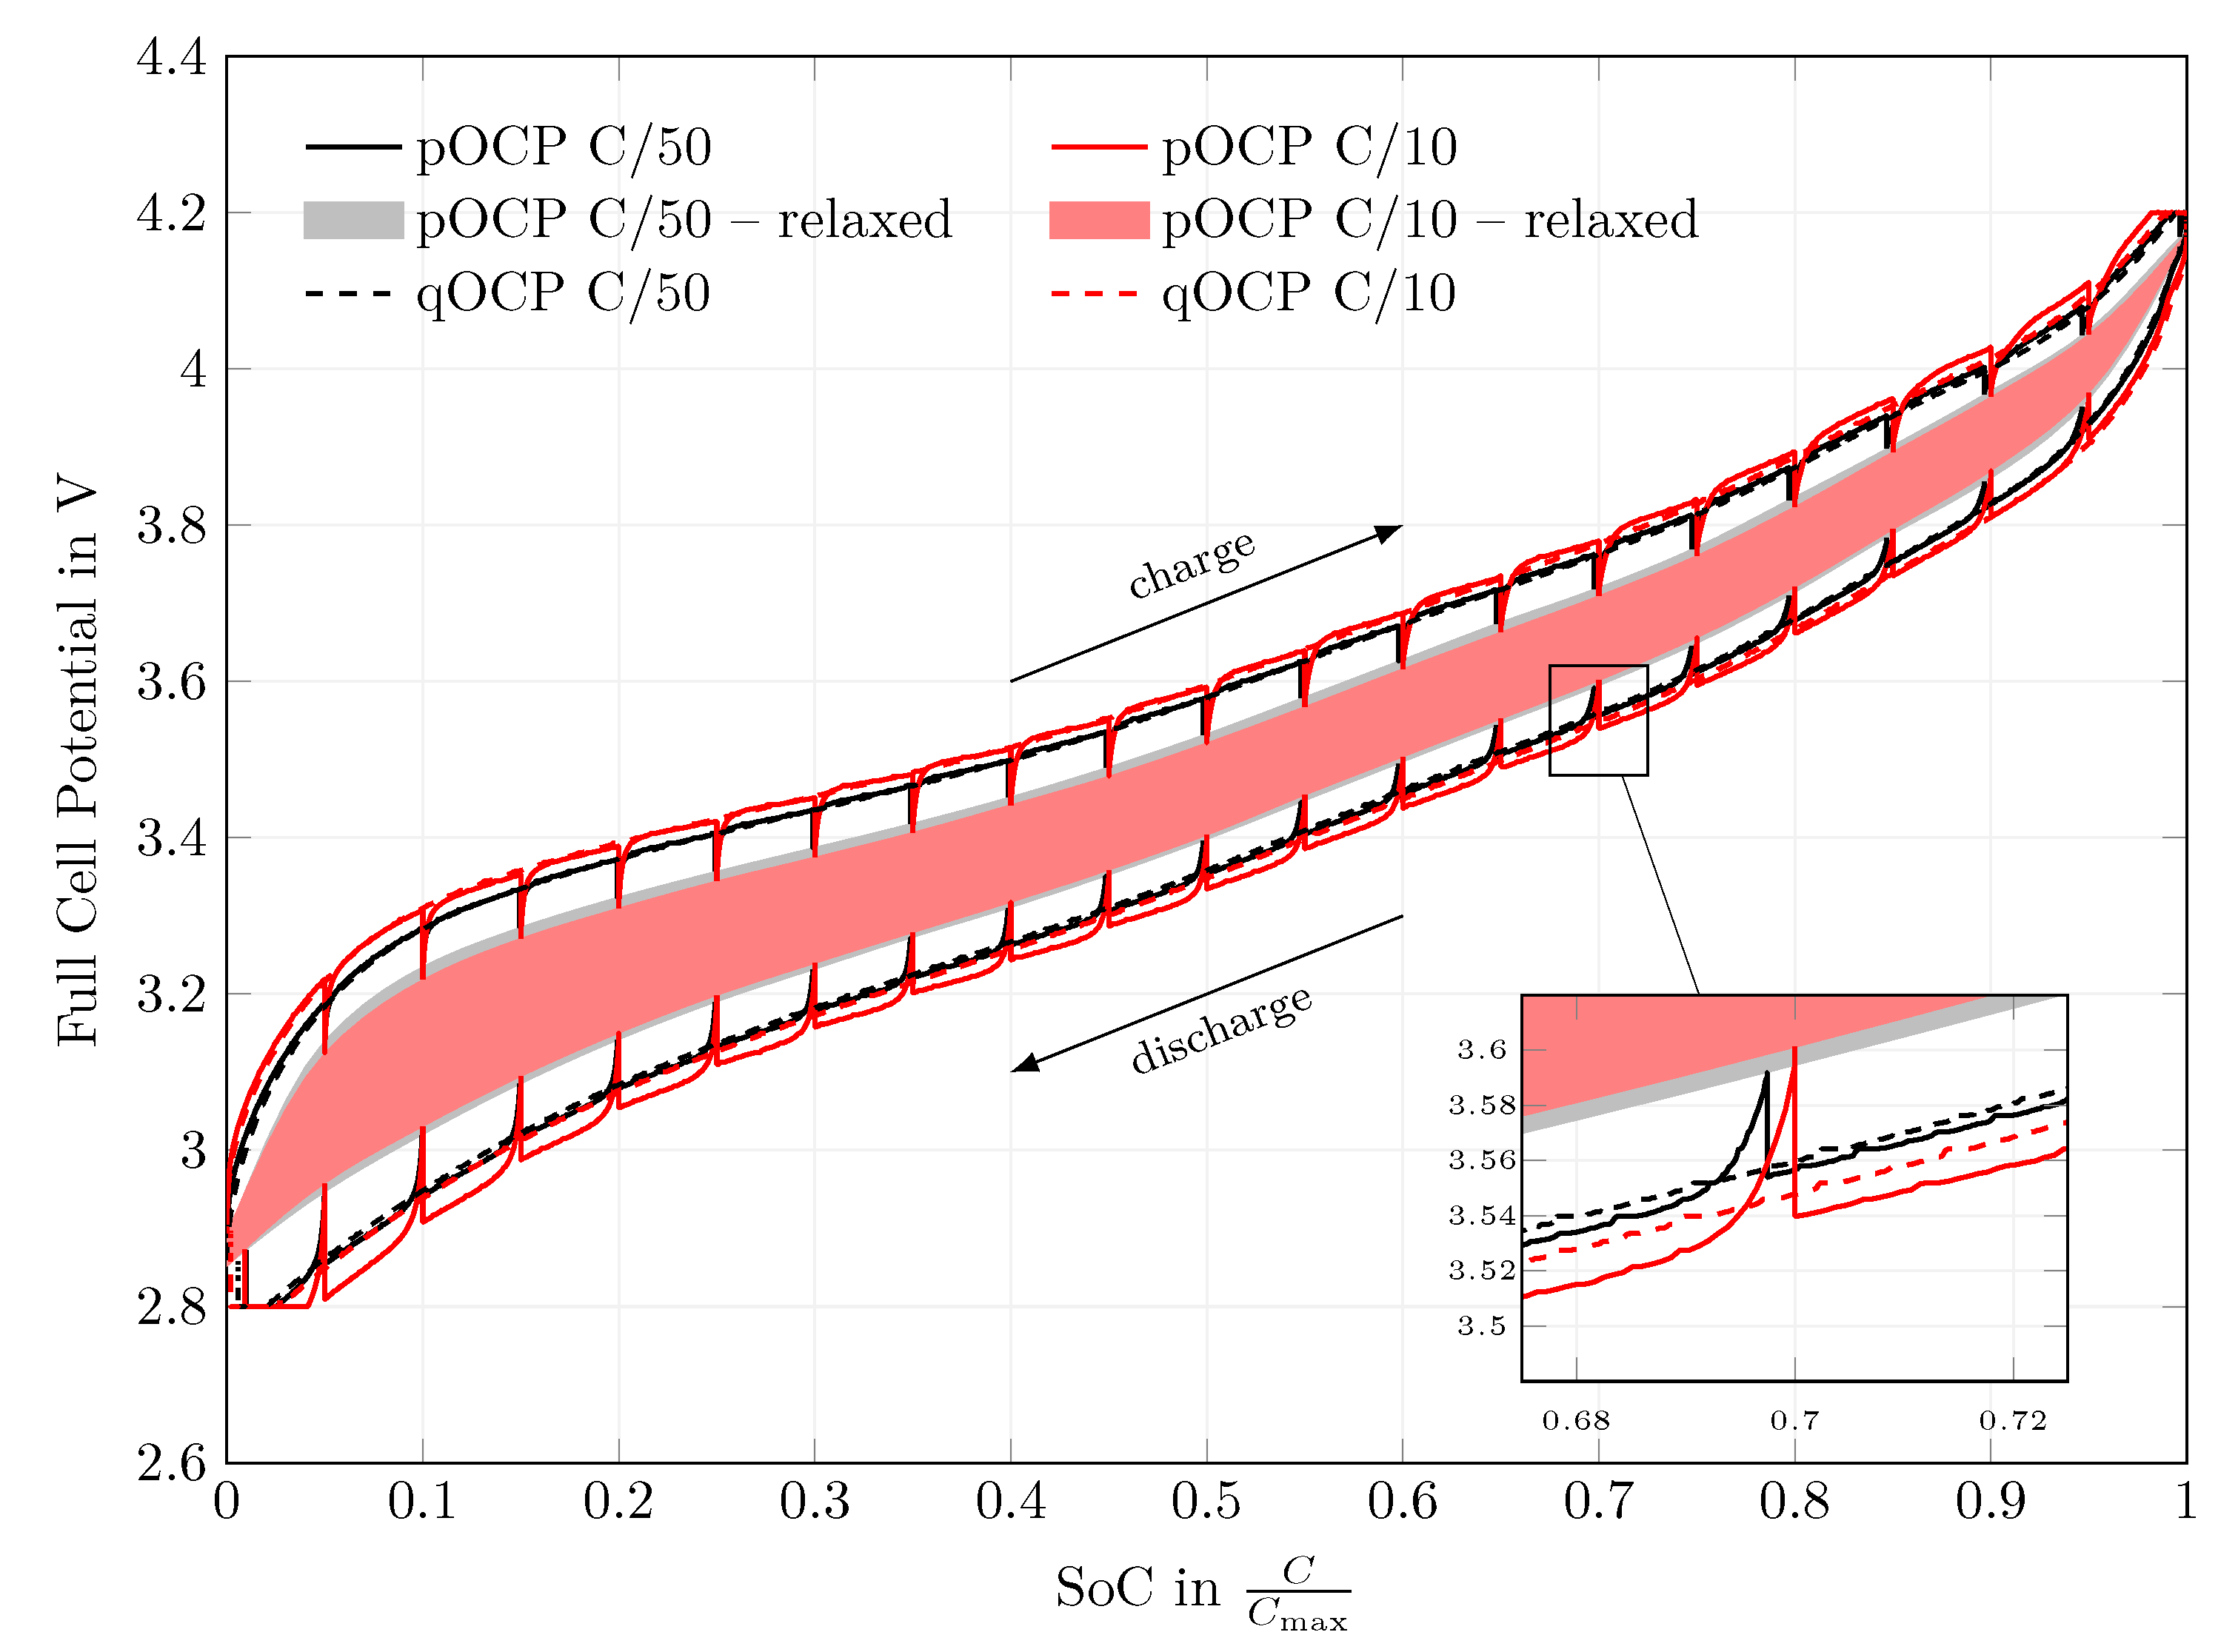
The cells then underwent one formation and nine stabilization cycles. Subsequently, a qOCP measurement at C / 50 and C / 10 was conducted for both coin and T-cells. The formation and stabilization cycles can be evaluated to retrieve an estimate of the capacity losses during formation, while the qOCP measurement yields the usable capacity after formation. This information will later be used to perform an x-axis transformation. The qOCP test is a constant current (CC) charge/discharge cycle at low C-rates of C / 50 and C / 10 which typically is used to measure the open-circuit voltage of a battery. In addition to the qOCP measurement using CC phases only, a pulsed open-circuit potential (pOCP) measurement was conducted. The pOCP test also makes use of a CC charge/discharge cycle at low C-rates of C / 50 and C / 10 . However, current-carrying phases are interrupted at every 5% state of charge (SoC) and the cell is allowed to relax for 2 h. The cell voltage after this relaxation period at different SoC is interpolated to measure the open-circuit voltage of a battery. The tests are compared to one another in order to investigate the qOCP as well as the polarization behavior at low currents. All tests were carried out at 25 C and are assumed to be isothermal because of the large thermal capacity of the cell housing.
Subsequent to the qOCP measurement, a rate capability test was conducted using the T-cells in order to later validate the model at higher C-rates. The procedure includes CC charging and discharging at different C-rates of C / 10 , C / 5 , C / 3 , C / 2 , 1 C , 2 C , 3 C , 5 C , and 10 C . Constant voltage (CV) phases were used for preconditioning so that every (dis)charge step starts with defined and reproducible conditions. More detailed descriptions of the exact procedures can be found in Section S3 along with Table S3 in the Supplementary Materials.

3. Modeling

In this work, a p2D model is used to describe the electrochemical behavior of a full cell incorporating a silicon-dominant anode. For modeling and simulations, the entire system is assumed to be isothermal at 25 C at all times. The model equations are depicted in Table A1 and are solved using COMSOL (Stockholm, Sweden) Multiphysics® 5.4. The solver settings are unchanged from the default solver settings recommended by the software for the given set of equations. The final parameters as used for the simulations are listed in Table A2. Some parameters are given by the cell design, such as the porosity or the active material volume fractions. Since these parameters are given, they are discussed in Section S1 of Supplementary Materials. The equilibrium potentials of the anode and cathode were measured in half-cell setups vs. Li metal. The remaining parameters are discussed based on a literature review, namely the electrolyte properties, solid-phase diffusivity, electrical conductivity, exchange current density, and charge transfer coefficients. A summary of these unknown parameters of the silicon electrode is given in Table 2.

3.1. Equilibrium Potential

Sethuraman et al. [42] discussed the existence of an equilibrium potential and different methods for measuring it. They state that the literature is not in agreement on what the equilibrium potential might look like. Some references discuss a path dependence and represent the equilibrium potential via two potential curves, one for the lithiation process and one for the delithiation process [22,44]. However, a single potential curve could also represent the equilibrium state for both the lithation and delithiation process [30,42]. Sethuraman et al. [42] presented such an approach to simulate the cell potential based on a single equilibrium potential curve. This approach is based on an asymmetric Butler–Volmer equation and a uni-directional side reaction. Additionally, they state that the equilibrium potential might yet be influenced by stress effects.
Because no uni-directional side reaction and no additional stress component are considered in the present work, the equilibrium potential in this work is implemented using two potential curves, similar to what is reported in the literature [22,44]. The equilibrium potential curves used in this work are determined experimentally and shown in Figure 1.

3.2. Voltage Hysteresis

Silicon shows a pronounced hysteresis effect in the measured qOCP curves, as can be seen in Figure 1. By using two potential curves as described in the previous section, the voltage hysteresis effect is already accounted for. This is true because this work’s focus is on full cycles and not on partial cycling and also not on the mechanical behavior. The model uses lithiation and delithiation qOCP curves of both electrodes and switches between the curves whenever the cell current switches sign.
If hysteresis was to be explicitly considered using a single curve only, literature provides several sophisticated approaches. Tjandra et al. [45] discussed different approaches to model the hysteresis based on the Preisach model and eventually used the discrete Preisach model to capture the hysteresis effect during full and partial cycling, i.e., ΔSoC = 100% and ΔSoC < 100%. Lu et al. [29] explained the voltage hysteresis in silicon based on mechanical stress. They proposed a model that accounts for an additional stress-induced overpotential via an adjusted Butler–Volmer equation. They assumed homogeneous lithium distribution due to very thin films ( 0.1   μ m ) and their model results match experimental data. Another possibility to implement the strong relaxation behavior into the model could be an empirically altered shape of the Butler–Volmer kinetics. The linear region usually attributed to small overpotentials could be broad for Si, followed by an almost abrupt and steep slope of the nonlinear regions. If the overall kinetics would follow such a description, a very small current density would be expected to already require quite large overpotentials for the charge transfer to occur, while the additionally required overpotentials for higher current densities would be almost negligible. As mentioned before, hysteresis is accounted for by two (de)lithiation curves in this work.
Figure 1. Quasi open-circuit potential of the measured Si and NCA half cell for the (de)lithiation as used in the model. The data are balanced to the full-cell potential (see Figure 2 and Figure A1) and transformed to refer to the calculated degree of lithiation (DoL) χ of the respective electrode. The degree of lithiation (DoL) is the capacity stored in the material relative to the fully lithiated state with C gr , Si , th = 3579 mAh g−1 and C gr , NCA , th = 279 mAh g−1. Further information on the axis transformation process can be found in Section S5 along with Table S4 and Figure S1 of the Supplementary Materials.
Batteries 09 00558 g001

3.3. Electrolyte Properties

The electrolyte supplier specified the bulk ionic conductivity κ l to be 6.398 mS cm−1. The electrolyte properties were assumed to be similar to th published by Valøen and Reimers [46] and only the ionic conductivity was scaled to match the supplier information.

3.4. Electrical Conductivity

Regarding the constituents of both electrodes, conductive agents such as carbon black are added to the electrode to enhance the otherwise poor electrical conductivity of the active material. Pure graphite particles (in a compacted powder sample) show a comparably high intrinsic conductivity in the order of 103 S m−1 [47]. This is approximately four orders of magnitude greater than the values reported for the two active materials used in the present work. A composite electrode consisting of active material and graphite as a conductive agent would thus show an increase in its electrical conductivity when compared to pure active material. However, since the properties of such a composite electrode again depend on morphological parameters such as the porosity or the particle size distribution, and especially the volume or weight ratio between the two constituents, finding a definitive value for a given electrode can be challenging.
Bulk values for the electrical conductivity of NCA have been reported to be in the range from 10−1.5 S m−1 to 1 S m−1, depending on the stoichiometric coefficient χ in Li1- χ Ni0.8Co0.15Al0.05O2 at 30 C [48]. For NCA composite electrodes, on the other hand, an effective value of 100 S m−1 [49] has been reported. The presence of conductive agent in the porous electrode increases the electrical conductivity by approximately two orders of magnitude. Given the fact that the electrode used in the present work also contains conductive agent, the effective value of 100 S m−1 is used here rather than the bulk value.
On the anode side, finding a viable value for the electrical conductivity of the Si active material or porous matrix for a given composition is just as difficult. Since Si is a semi-conductor, its intrinsic electrical conductivity strongly depends on (im)purities from doping as well as on temperature. Pure crystalline silicon has a low electrical conductivity of 4.5 × 10⁻⁴ S m−1 [50] (p. 258), which can be increased by several orders of magnitude by doping [51] while following Arrhenius characteristics with increasing temperature [52]. Chockla et al. [33] for example manufactured silicon nanowires without any conductive carbon and measured an as-made electrical conductivity of 0.2 nS m−1. They could improve these values to 1400 nS m−1 via annealing under a reducing atmosphere at elevated temperatures. McDowell and Cui [34] also investigated the electrical conductivity of nanowires without conductive carbon, but found values of around 400 S m−1. They found similar values of 600 S m−1 for silicon thin films. An important difference is that Chockla et al. [33] could not even lithiate the untreated nanowire because of its low electrical conductivity, while McDowell and Cui [34] conducted their measurement in the lithiated state. The difference in conductivity depending on the DoL was reported by Pollak et al. [35], who found amorphous silicon thin films to be approximately 3.5 orders of magnitude more conductive in the fully lithiated state than in the delithiated state. The highest conductivity value they measured is approximately 5 × 10³ S m−1. In another study, Kim et al. [36] found the electrical conductivity of bare 10   μ m Si particles to be 2 S m−1, which could be improved to 1.81 × 10³ S m−1 via copper deposition on etched Si particles. The conductivity of the untreated particles is two orders of magnitude smaller than for the nanowires and thin films investigated by McDowell and Cui [34]. This might indicate a dependence on the electrode morphology, but might also be due to different degrees of lithiation or different phase compositions of the silicon, e.g., crystalline or amorphous. Among the values already mentioned, Chandrasekaran and Fuller [23] assumed a bulk value of 33 S m−1 for their Si electrode including conductive carbon. Wang [37] used this value in simulations and found it to be a suitable value via comparison to experiments. Hence, the electrical conductivity of 33 S m−1 is also used in this work. Due to the high fraction of conductive agent, the true value of the electrode used in this work might be even higher.
Based on the literature discussed above, care should be taken when selecting material parameters from the literature, especially for materials as diverse as silicon. Values may vary by several orders of magnitude depending on the morphology and composition of the sample as well as the degree of lithiation. Additionally, not necessarily all experimental information might be given. Experimental studies on the electrical conductivity of Si-based electrodes using different electrode compositions, i.e., pure silicon as well as different silicon to graphite ratios, at different degrees of lithiation would be very valuable for future modeling.

3.5. Solid-Phase Concentration

The maximum concentration of lithium inside the active material particles c s , max is calculated based on the gravimetric capacity C gr and the density ρ according to
c s , max = C gr , th · ρ F .
The theoretic gravimetric capacities for Si and NCA are 3579 mAh g−1 and 279 mAh g−1, respectively, while the densities of 2336 kg m−3 and 4730 kg m−3 are supplier information. The density for Si is the density in the purely crystalline state, and the density for NCA was obtained from powder X-ray diffraction data. These density values yield concentration values of 311,943 mol m−3 and 49,239 mol m−3, respectively. Note that these values are considered to be a good guess but will be adjusted in order to fit the model to the measurement data.
In Equation (1), the density is not a function of the DoL but has a constant value that corresponds to the pristine particle state, i.e., no Li inside Si and NCA fully lithiated. In reality, especially for Si, the density of a particle will change with the DoL because of the lithiation-induced volume expansion of up to 300% for Si [10]. Chandrasekaran et al. [22] presented an approach to account for this effect which also takes the changing particle radius and thus a variable diffusion path length into account. In this case, the maximum solid-phase concentration in the fully lithiated state would be 77,986 mol m−3 instead of 311,943 mol m−3. However, since no volume change of the active material particles is considered in the present work, the change in the maximum solid-phase concentration in dependence on the DoL is of no further interest here.

3.6. Solid-Phase Diffusivity

For NCA particles, Dees et al. [40,53] determined the diffusion coefficient of Li inside NCA using galvanostatic intermittent titration technique (GITT) measurements to be in the range of 10−14 m2 s−1 to 10−17 m2 s−1 depending on the DoL. A value of 6 × 10⁻¹⁵ m2 s−1 is used for the simulations in this work, i.e., the value at 3.77   V vs. Li metal. This is because it is centered between the minimal and maximal cathode half-cell potentials for the cell setup used in this work ( 3.0   V and 4.4   V NCA vs. Li metal).
The solid diffusion coefficient of Li in Si varies from 10−13 m2 s−1 to 10−20 m2 s−1 [21,38]. A detailed and more recent literature review by Sivonxay et al. [39] suggests even higher values up to 10−11 m2 s−1. They investigated Li diffusion properties in LixSi and LixSiO2 via first-principle calculations which yielded values between 10−11 m2 s−1 and 10−15 m2 s−1. Wang et al. [21] compared numerical simulations with in situ lithiation experiments in order to determine the diffusion coefficient of Li in Si. They reported the coefficient in the amorphous as well as in the Li-rich phase after the formation cycle to be in the order of 2 × 10⁻¹⁵ m2 s−1. However, Bordes et al. [32] showed that fast Li diffusion pathways exist along defects. Such defects may occur due to stacking faults in a single crystal but can also occur along grain boundaries in polycrystalline Si particles. They propose that due to this phenomenon, Li diffusion may be much faster than in a single crystal without defects, regardless of the particle size. This suggests that, at least in polycrystalline particles as in this work, the diffusion coefficient might be greater than that reported by Wang et al. [21]. Nonetheless, their value of 2 × 10⁻¹⁵ m2 s−1 is used for the simulations in the present work, as it has been validated against experimental data.
As mentioned before, the value for solid-phase diffusivity reported in the literature spans several orders of magnitude. Hence, a detailed analysis of the solid-phase diffusivity in silicon considering its various types such as nanowires, thin-films, or particles as well as its different amorphization states would be of great value when it comes to physicochemical modeling. However, obtaining a consistent value for the solid-phase diffusivity is a problem that has not been solved yet, not even for long-used materials such as graphite [54].

3.7. Electrode Kinetics

The Butler–Volmer electrode kinetics described by Equation (A7) requires an exchange current density i 0 . Since no experimental determination of the exchange current densities was carried out in the scope of this work, values from the literature are used. For the exchange current density of 9.4   μ m NCA particles, a value of 1 A m−2 has been reported [40]. For NCA particles dipped in PVdF binder, the exchange current density during lithiation can reach higher values of up to 10 A m−2 [55].
For the exchange current density of Si electrodes, however, a wide range of values spanning several orders of magnitude from 10−3 A m−2 to 105 A m−2 can be found. Bucci et al. [38] reported a value in the order of 105 A m−2 for silicon thin film electrodes of about 100 μm thickness. Lory et al. [19] assumed the exchange current density to be non-limiting and chose a constant value of 2 A m−2 for their model. Note that, in their model, silicon is assumed to have no direct contact with the electrolyte because it is embedded inside carbon particles of 12 μm diameter. The value thus represents the exchange current density between carbon and silicon. Li et al. [41] derived values between 0.7 A m−2 to 1.3 A m−2 based on potentiostatic intermittent titration technique (PITT) measurements on silicon thin films of up to 1000 nm. Swamy and Chiang [20] found values of approximately 1 A m−2 by fitting impedance data of 500 μm thick silicon wafers to an equivalent circuit model. Chandrasekaran et al. [22] report values of about 10−2 A m−2 to show a good fit between their single particle model with a diameter of 60 nm and experiments conducted using silicon nanowires with a pristine diameter of 89 nm [56]. Finally, Wang [37] fitted a multi-radius model to measurements on nanowires and found a value of 10−3 A m−2 to be a good fit for the exchange current density. This value is well below the reported values determined using measurements, which might indicate that some cross-dependencies due to model assumptions influence the value found via fitting. Thus, this value should be taken with care. None of the references stated a clear dependency on the DoL. With the exception of Chandrasekaran et al. [22], none of the references discussed charge transfer coefficients and assumed them to be symmetric, i.e., α a = α c = 0.5 . Additionally, different sample geometries that have been investigated in the literature also make it difficult to get a true value for the exchange current density when only determined for a single state. This is due to the uncertainty in the active surface area of different samples, which depends on the sample morphology and undergoes changes due to volume expansion. Furthermore, the different measurement approaches used to determine the exchange current density might impede cross-reference comparisons. For simulations in this work, 1 A m−2 is considered to be a reasonable initial guess because it is on neither end of the range found in the literature. For future simulation works, two different experimental results would be valuable: On the one hand, a consistent value for a single sample obtained via different measurement approaches would indicate under which conditions cross-reference comparisons are valid. On the other hand, an extensive investigation of various samples using a single measurement approach could serve as a baseline for a consistent data base.
The exchange current densities in the present model are expressed as a function of the local concentrations (see Equation (A9)). In this case, the exchange current density is dependent on the reaction rate constant k and on the concentrations c l and c s , surf at the silicon–electrolyte interface. This equation is used because it contains limitations for surface concentrations near the minimum and maximum solid-phase concentrations. This representation at least simulates a DoL-dependence in a most basic way. In order to convert the given exchange current densities to such reaction rate constants, Equation (A9) is solved for k. No distinction between anodic and cathodic reaction rates is made here, thus k c α a k a α c = k α a + α c . A further assumption for this calculation is α a = α c = 0.5 . Hence, the anodic and cathodic reactions are assumed to be symmetrical. A more detailed discussion on this topic can be found in Section S4 of the Supplementary Materials. Equation (A9) is solved for in such manner that the reaction rate k is a function of c s , surf . Accordingly, values for c l and c s , max are needed. For c s , max , the values calculated using Equation (1) are used. For c l , a constant value of 1000 mol m−3 is assumed, i.e., the value in the equilibrium state. By assuming a constant value for c l , the impact of gradients during operation is excluded for the transformation from exchange current densities to reaction rates. Doing so, the transformed reaction rates are not dependent on c l and thus the dependency of i 0 on c l in Equation (A9) is not accounted for twice. Since c s , surf may vary from the maximum value c s , max , the reaction rate constant for a constant exchange current density may vary, too. To avoid division by zero when c s , surf becomes 0 or c s , max , c s , surf is limited to the range [ 0.01 c s , max ;   0.99 c s , max ] here. The reaction rate k is solved for using these values and then averaged so that it is no longer a function of c s , surf . Averaging is necessary so that the dependency of i 0 on c s , surf in Equation (A9) is not accounted for twice. The averaged values are 2.95 × 10⁻¹² m s−1 for silicon and 1.90 × 10⁻¹¹ m s−1 for NCA. However, because of the uncertainty of the exchange current densities found in the literature, these values will be subject to a fitting process. The final values after the fitting can be found in Table A2.

4. Results and Discussion

To maintain readability, only the results of one representative lab cell are shown and discussed. This decision is based on the variations in gravimetric capacity between the tested cells of 3.18% during cell formation and 1.94% during the qOCP tests, indicating that cell manufacturing, cell formation and stabilization are reproducible.

4.1. Open-Circuit Potential Measurements

The qOCP and pOCP measurements are shown in Figure 3. Black curves refer to C / 50 and red curves refer to C / 10 . The cell potential is plotted as a function of the normalized cell capacity for the charge and discharge step that was recorded during the individual tests. The reversible discharge capacity at C / 50 is 5.5605   m Ah . With respect to the smaller cathode electrode sample with a diameter of 14 m m , this yields a utilized areal capacity of 3.61 mAh cm−2.
Overall, the potential during the CC phases of the pOCP measurement plotted with solid lines are in good agreement with the potential of the pure CC load, i.e., the qOCP measurement, plotted with dashed lines. However, even at C-rates as low as C / 50 , the cell potential still relaxes by up to 90 m V during 2 h of open-circuit conditions. The value at the end of this relaxation phase is called the “relaxed potential” in the following. The relaxed potentials at different SoC were interpolated and are plotted as areas, indicating the voltage hysteresis effect between charging and discharging. Both observations hold true for C-rates of C / 50 and C / 10 . The pronounced relaxation has been described in the literature [42,44,57], but to the best knowledge of the authors, its origin has not been identified yet. The fact that the cell potentials at C / 10 and C / 50 are quite similar, but still differ significantly from the relaxed potential, indicates that the effect observed here is at least not related to ohmic losses but rather to electrode kinetics. Possibilities to implement such behavior into the model have been discussed above.
As previously mentioned, the qOCP data at C / 50 are used as a model input. Thus, the model is not expected to be able to capture the strong relaxation behavior but the behavior under load, as shown below. Because individual lithiation and delithiation curves are implemented, no dedicated hysteresis model is used here.

4.2. Electrode Balancing

One of the model outputs is the full-cell potential, which is a superposition of the half-cell potentials including overpotentials. Thus, an accurate reconstruction of the full-cell potential from the measured half-cell potentials is needed to provide a correct model input. During this reconstruction process, the half-cell measurements are stretched and shifted along the capacity axis in such way that their superposition results in the full-cell measurement. By doing so, the electrodes are being matched to each other so that they give the reference full-cell measurement. Complementary to the measured voltage curve, its derivative with respect to the capacity—the differential voltage analysis (DVA)—can be used to retrieve a satisfying reconstruction. Certain features in the DVA like the transition between between two two-phase regions as is the case for graphite or the steep limiting region at either end of the utilizable stoichiometry can be used to compare the superposition of anode and cathode curves with that of the full-cell curve, and eventually minimize the difference. The procedure was described by Smith et al. [58] and was later used by Dahn et al. [59] to facilitate the analysis of degradation mechanisms in lithium-ion batteries.
In this work, especially the DVA was used to fit the half cells to the full cell. Additionally, the process was carried out for the full-cell charge and discharge step individually, analogous to [7].
The result of the balancing process is shown in Figure 2a for the coin full-cell charging. The results for the discharge are given in Figure A1 in the Appendix B.
As a result of the balancing process, the measured half-cell as well as the superposed full-cell potential is a function of the full-cell SoC instead of the electrode capacity. The balanced half-cell potential curves show an overhang beyond the limits of the full-cell SoC, which is due to the different cut-off potentials for the tests on full cells and half cells.
Figure 2b and Figure A1b show a maximum absolute qOCP error of less than 11 m V and 15 m V for the charging and discharging process, respectively. The corresponding rootmean-squared error (RMSE) is 2.9   m V and 5.4   m V . The small RMSE indicates that the superposition of the half cells using the identified full-cell SoC is satisfactory to represent the full-cell potential at low C-rates. This can also be seen in the overlay of the measured and reconstructed full-cell curves (light and dark red) in Figure 2c and Figure A1c. Here, the differential potentials are shown and normalized by multiplying by the total capacity of the respective (dis)charge step Q 0 .

4.3. Transformation to the Degree of Lithiation

At this point, the balancing process is completed and the results are dependent on the full-cell SoC. However, the model solves for the solid-phase concentrations c s of both electrodes. These concentrations can be normalized using the maximum solid-phase concentration c s , max , yielding the DoL χ , as described in Equation (2). Hence, a representation of the equilibrium potential as a function of the DoL instead of the full-cell SoC would be advantageous.
χ = c s c s , max = C gr C gr , th
The DoL can not only be calculated based on concentrations taken from the model but also based on capacities taken from measurements. Here, the gravimetric capacity C gr from the tests and the theoretical maximum gravimetric capacity C gr , th of the material are used. For the maximum gravimetric capacity, the maximum theoretical value of 3579 mAh g−1 [5] is used. For the current gravimetric capacity, the current capacity from the battery cycler is divided by the active material mass of the sample. Additionally, unlike the concentration, the measured capacity is no absolute value but the integration of the electric current. An integration constant or rather an initial value is needed to retrieve a proper value for the DoL. This initial value is assumed to be the irreversible loss during formation and will be discussed in the following.
To obtain such a representation as a function of the DoL, an estimate based on the losses during the first formation and stabilization cycles Δ χ loss as well as the utilization during the qOCP test Δ χ q O C P is made. These values are then used for shifting and scaling the curves to perform the transformation from SoC to DoL. A detailed description of this transformation including a table with all necessary interim and final values is given in Section S5 along with Table S4 of the Supplementary Materials.
Figure 1 shows the final result. The plotted curves show the half-cell potentials as a function of the DoL. Green lines represent the NCA cathode half cell, and blue lines represent the Si anode half cell. The black arrows together with labeled crosses show the utilization range of the respective half cell DoL for a full-cell SoC as previously identified in the balancing process. The anode DoL utilization between 0% and 100% SoC ranges between 0.0396 and 0.3068, respectively, and that of the cathode ranges between 0.7954 and 0.1396. The corresponding equilibrium potentials, averaged for charge and discharge, are 739.9   m V and 182.1   m V for the anode and 3.558   V and 4.378   V for the cathode. Table 3 lists these average values together with the individual values for charging and discharging.
From these utilization ranges, it can be seen that Si is not entirely delithiated. This is due to silicon’s significantly better aging behavior when not fully delithiated. Wetjen et al. [5] showed this for nanometer-sized silicon and Haufe et al. [13] showed this for the same micrometer-sized silicon that is also used in the present work. This results in a half cell balancing procedure that is slightly more complex for Si anodes than for graphite anodes because, for graphite anodes, the minimum DoL can usually be set close to zero, while for partially lithiated silicon, this is not recommended. If this effect were not taken into account, significant errors between simulation and measurement results would be expected at low full-cell SoC.

4.4. Fitting of Solid-Phase Concentrations

So far, electrodes’ equilibrium potentials from the qOCP measurements have been balanced using a DVA-aided process and the resulting full-cell SoC has been transformed to a degree of lithiation unique to each electrode. The curves shown in Figure 1 are used as a model input and depend on the DoL from Equation (2). Thus, the value of c s , max directly influences the course of the DoL and the cell potential when a fixed intercalation rate is given. Initially, the values given by Equation (1) are used for the first simulation of a complete cell charge and discharge at C / 50 . An evaluation of the DoL revealed that the Si electrode was lithiated to a higher degree than that obtained from the transformation to the DoL ( χ 1 , Si = 0.3068 , see Figure 1).
This effect is also shown in Figure 4a. The blue dotted line shows the full-cell potential at C / 50 (dis)charging using the initial parametrization. The data are plotted as a function of the (dis)charge capacity normalized to the capacity during a C / 50 charge for both, the measurement (black) and model (colored), individually. Only CC phases are plotted, CV phases are not shown. Because the DoL overshoots during the simulation, the equilibrium potential is beyond the defined range and thus not valid. This becomes especially evident during the discharge at approx. 98% normalized capacity. At this point, the voltage curve shows a sharp bend. This is caused by the DoL entering the defined range again and the change in the shape of the anode equilibrium potential drastically impacts the full-cell potential. This bend is not comparable to that during the experiments.
To prevent this non-physical behavior, the maximum solid-phase concentration is fitted in such way that the DoL no longer overshoots. This fitting of the anode maximum solid-phase concentration does not alter the electrode potential at a given DoL, but it does alter the balancing between anode and cathode. To compensate for this overlithiation of the anode, the anode maximum solid-phase concentration was increased by a factor of 9.56%. Considering the volume expansion and its effect on the mass density in Equation (1), this is considered to be within the range of physically interpretable values.
Subsequent to this individual fitting of the maximum solid phase concentration of the anode, the maximum solid-phase concentration of both electrodes was scaled equally. By scaling the solid phase concentrations by the same factor, the balancing between anode and cathode is retained while adjusting the absolute capacity of the model so that it matches the capacity of the measurements at C / 10 . Finally, the maximum solid-phase concentration of the anode is increased by 3.25%, already taking into account the anode-specific factor from above, and that of the cathode is decreased by 5.77%. The final results for the maximum solid-phase concentrations are summarized in Table A2. The green dash-dotted line in Figure 4a now shows a behavior similar to that during the experiments. Fitting of the maximum solid phase concentration resulted in an improvement of the RMSE by up to 30 m V in values.

4.5. Rate Capability

Up to this point, the model describes the experimental data satisfactorily at C-rates of C / 50 . To check the quality of the model’s predictions at higher C-rates, measurements at different C-rates using a T-cell were conducted. The formation and stabilization procedure for T-cells and coin cells are identical, and the results are comparable. Hence, the model parametrization based on coin cells is expected to be valid for T-cells, too.
A comparison between measurement and simulation data (black dashed vs. green dash-dotted line) in Figure 4b shows that a certain error also remains at 1 C when using the current parametrization. This is due to the overpotential at higher C-rates which depends on the kinetic behavior. The literature reports a wide range for the exchange current density, and, as such, for the reaction rate constants k, the reaction rate constants were fitted so that the RMSE between simulation results and experimental data is minimized. Up to this point, the only quantity that was fitted is the maximum solid-phase concentration. The fitting of the reaction rates was done using the lsqnonlin optimizer in MATLAB® 2021b aiming to minimize the difference between simulation and measurement data for a 1 C constant current charge and discharge. All other C-rates were not part of the fitting procedure. They serve as validation data and can be seen in Figure 5 and Figure 6.
The best agreement between the simulated and measured full-cell potentials was found with the reaction rate constants of 5.78 × 10⁻¹² m s−1 for the anode and 1.64 × 10⁻¹⁰ m s−1 for the cathode. The values are also summarized in Table A2. Before further inspecting the full-cell potential, the optimized reaction rates are checked for plausibility regarding the range from the literature. To this end, the optimized reaction rates are re-transformed to exchange current densities. This re-transformation is analogous to the transformation of the initial exchange current densities to reaction rates, as described above. The results show a re-transformed and averaged exchange current density of 2.228 A m−2 for the Si anode and 9.108 A m−2 for the NCA cathode. These values deviate by a factor of about 2 to 9 from the initial value of 1 A m−2 for both anode and cathode, as taken from the literature. Considering a range of several orders of magnitude for the anode exchange current density, the fitting is considered to be within an acceptable range. For the NCA material, a value of approximately 9 A m−2 lies at the upper end of the range given in the literature.
Figure 4b allows for a further inspection of the full-cell potential and reveals the improvement due to the fitting of reaction rates. Here, the green dash-dotted line represents the simulation data after the fitting of the maximum solid phase concentrations, and the red solid line represents the subsequently optimized parametrization. Note that the optimized parametrization consists of a single reaction rate constant for each electrode that is optimized to match the charge and discharge at the same time. In other words: The reaction rate constant is not dependent on the sign of the cell current or the reaction direction. The RMSE given is that between the measurements and the optimized simulation results. The RMSE value during charging improves by only 1.13 mV and is almost unaffected by the optimization. This is because the regions where simulation and measurement differ have shifted from higher to lower SoC. The RMSE value during discharging, on the other hand, improved by approx. 28 m V , and the curves show an overall reduced deviation.
Figure 5 is similar to Figure 4 but shows the validation data at different C-rates instead. Only the final parametrization including the optimized reaction rates is used for the simulation data. From both figures together it can be seen that the RMSE for discharging remains in the range between 18.30   m V and 24.02   m V for different C-rates. This indicates that the overpotentials during discharging are well described using the symmetric Butler–Volmer kinetics implemented here. The RMSE for charging, however, increases with increasing C-rate, revealing that overpotentials during charging at high C-rates are more pronounced than at low C-rates. This might indicate that kinetics are asymmetric. Another possible explanation for this observation is an SoC-dependent porosity. With increasing SoC, the porosity of the Si anode decreases due to intercalation-induced volume expansion. A decrease in porosity would first occur near the separator during charging and gradually propagate towards the current collector. Similarly, the porosity would first increase near the separator during discharging and then gradually propagate towards the current collector. This way, an increasing overpotential with increasing C-rate due to porosity changes is to be expected during charging, while during discharging, a decreasing overpotential with increasing C-rate is to be expected. Because the model does not account for such porosity changes, the behavior in Figure 4 is different. Overall, further investigation regarding the overpotentials during fast (dis)charging is needed in order to accurately describe the full-cell potential. This statement agrees with the statement deduced from Figure 6.
Figure 6 shows the CC discharge capacity as a function of the C-rate. The discharge capacity is normalized to the CC charge capacity at C / 10 , just as in Figure 4b and Figure 5. Up to 2 C , the capacities predicted by the model are in good agreement with those obtained from the measurements. The maximum deviation between simulation and measurement data up to 2 C is <2.4% for discharging and <1.8% for charging. Especially for the discharge drawn with dotted lines, an almost constant offset between measurement and simulation can be seen. This could originate from the strong relaxation behavior of the qOCP measurement which is present even at small C-rates. The model does not account for these effects. From 3 C onwards, the model overestimates the capacity for charging and discharging when compared to the measurements. This indicates that the model underestimates the total polarization at high C-rates.
A possible explanation for the low capacity retention at elevated C-rates during the experiments are mass transport limitations. Xie and Yang [60] explained the interplay between transport in the solid and liquid phase using an electrochemical model including a graphite anode. Due to sluggish transport in the solid particles and preferred (de)intercalation near the separator-electrode interface, the particle surface will become saturated, resulting in a gradient of the surface concentration along the electrode thickness. This increases the diffusion path length in the electrolyte to allow for further reactions, increasing the total overpotential. The behavior described by Xie and Yang [60] is similar to that in Figure 6, suggesting that the rate capability as seen in the figure is not exclusive to silicon.
Despite the overall good representation of the real cell behavior, one potential aspect for optimization could lie in the model’s porosity. For the model parametrization, the porosity calculated from data in the pristine state prior to cell formation is used. Further information on this topic can be found in Section S1 of the Supplementary Materials. However, because of the large volume expansion of silicon as well as the formation losses, it is likely that the active material volume fraction after formation is different from the value prior to formation. As a consequence, it is also likely that the increase in the active material volume fraction causes a decrease in porosity and thus poor rate performance at high C-rates as can be see in Figure 6. Furthermore, this decrease in porosity is likely to be a local effect linked to the gradient in the particle concentration mentioned above. Thus, an optimized and possibly local porosity value and as such an optimized MacMullin number would likely further increase the model accuracy. Lastly, the error between simulation and measurement in Figure 5 shows a clear trend with changing SoC, which might be due to an SoC-dependent porosity affecting the overpotentials. Accounting for this effect could enhance the model accuracy.

5. Conclusions and Outlook

Until now, the literature has not provided an electrochemical model for a silicon-dominant electrode. Hence, the goal of this study was to parametrize and validate a Newman-type model for a custom-built Si NCA lithium-ion cell. Many parameters in the model presented here, such as the porosity, could be obtained from electrode manufacturing, while other parameters, such as the exchange current density, were taken from the literature and underwent a fitting procedure.
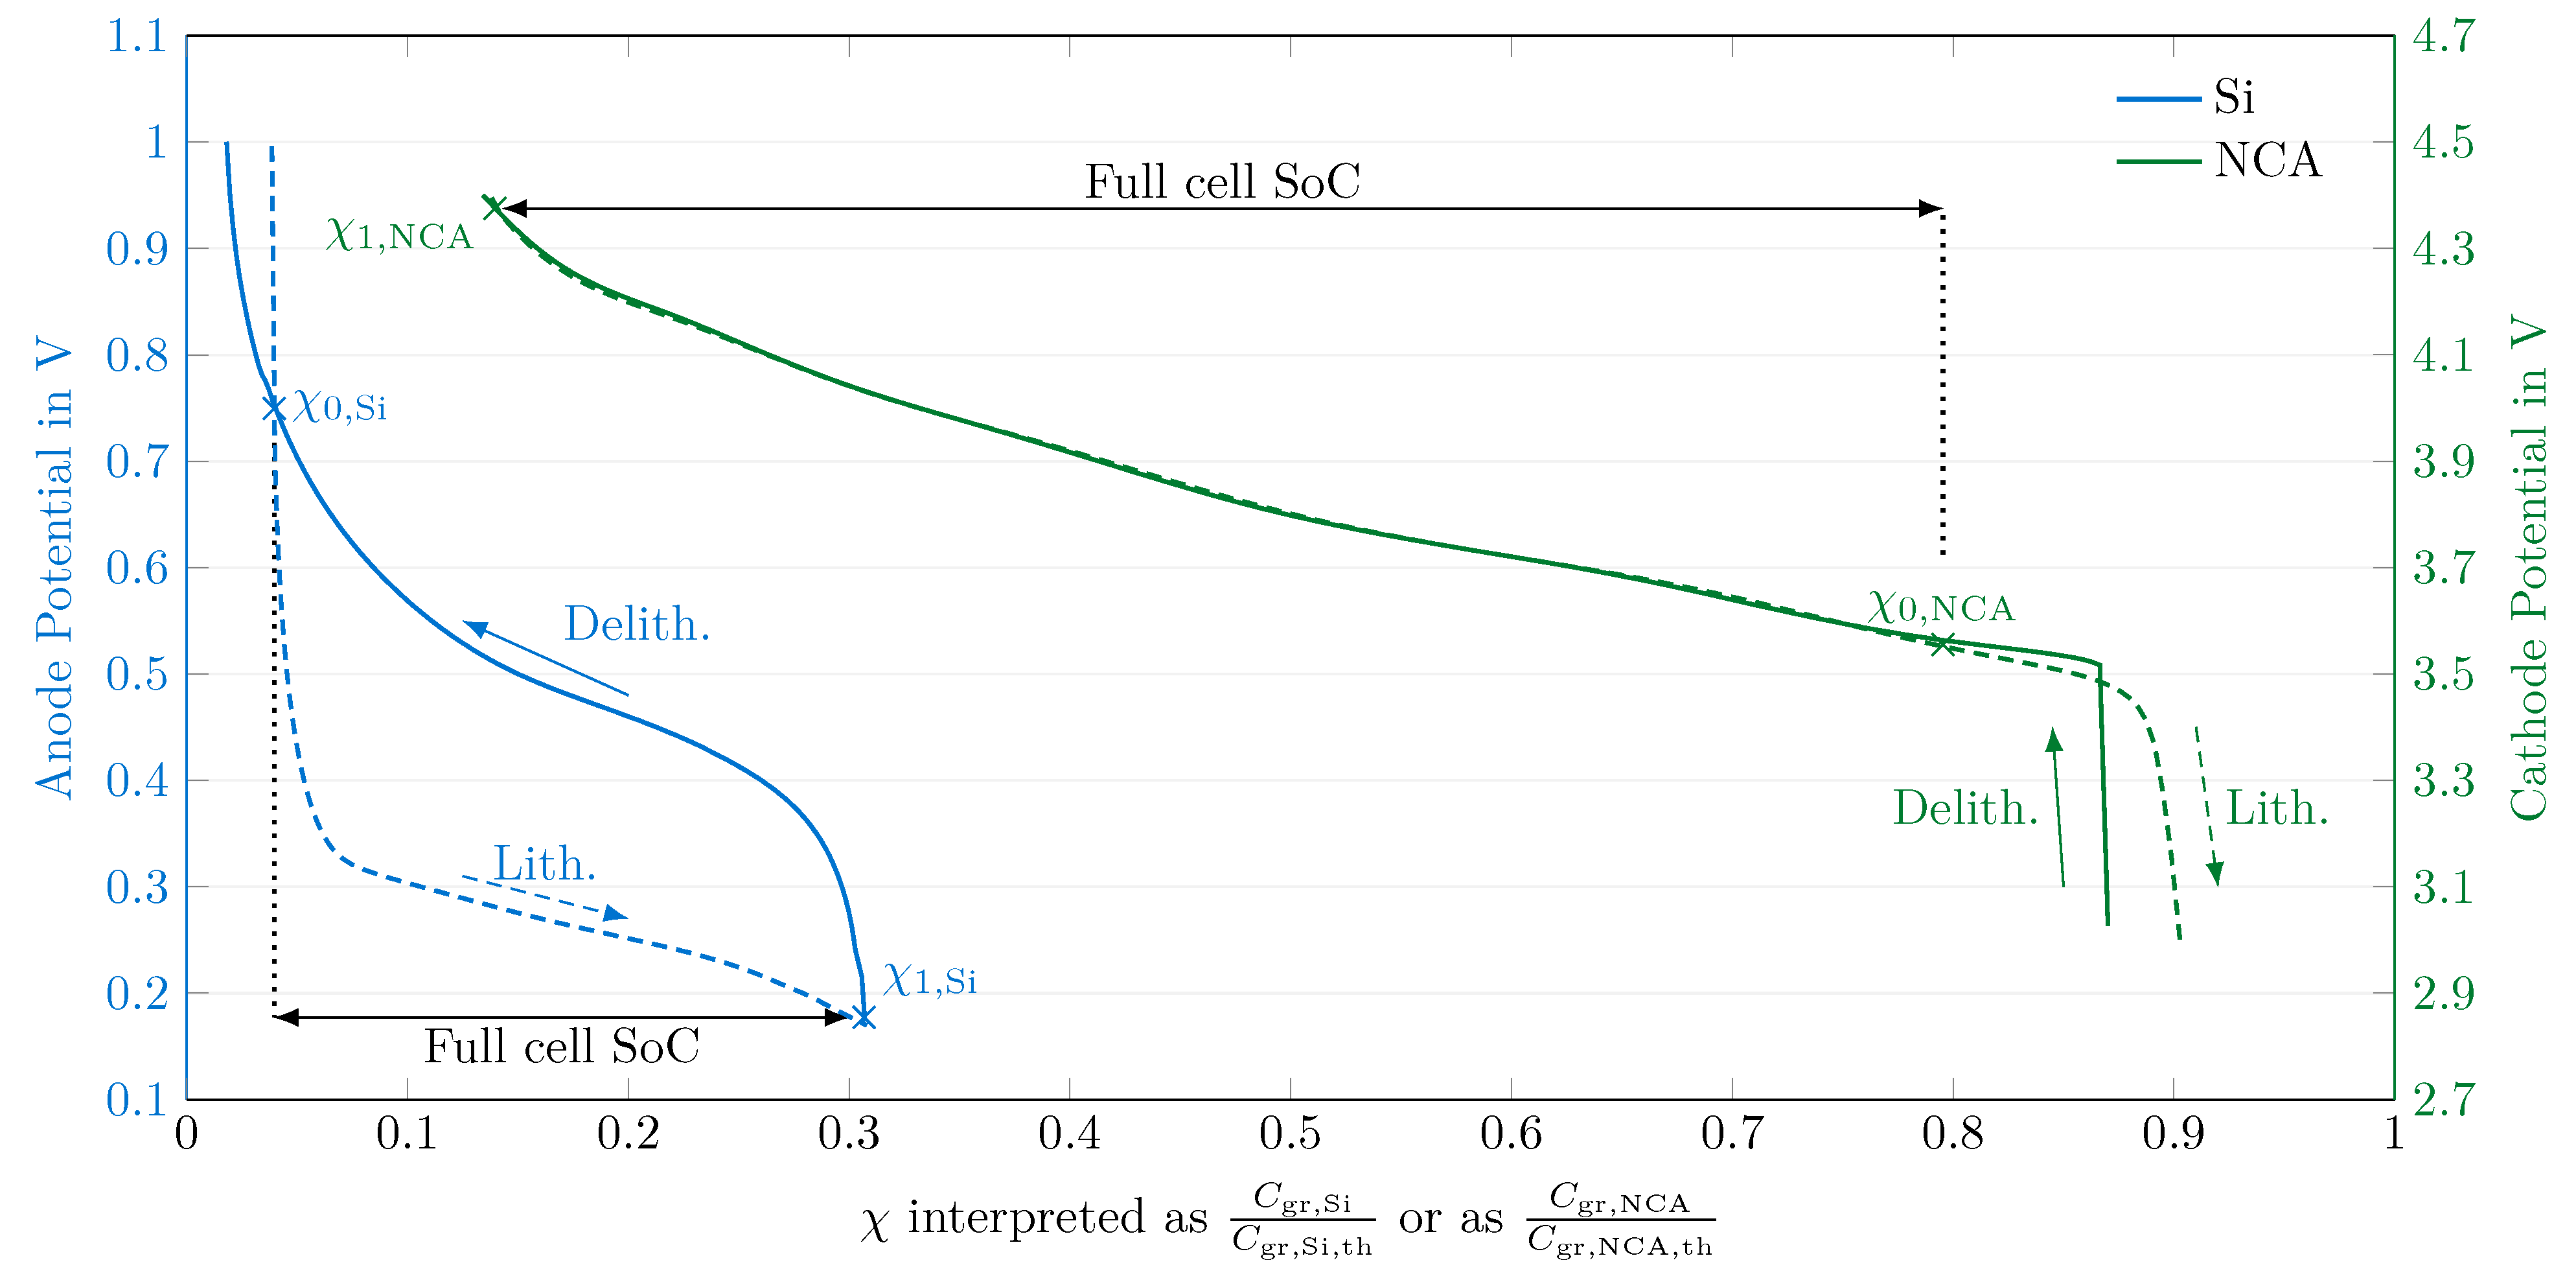
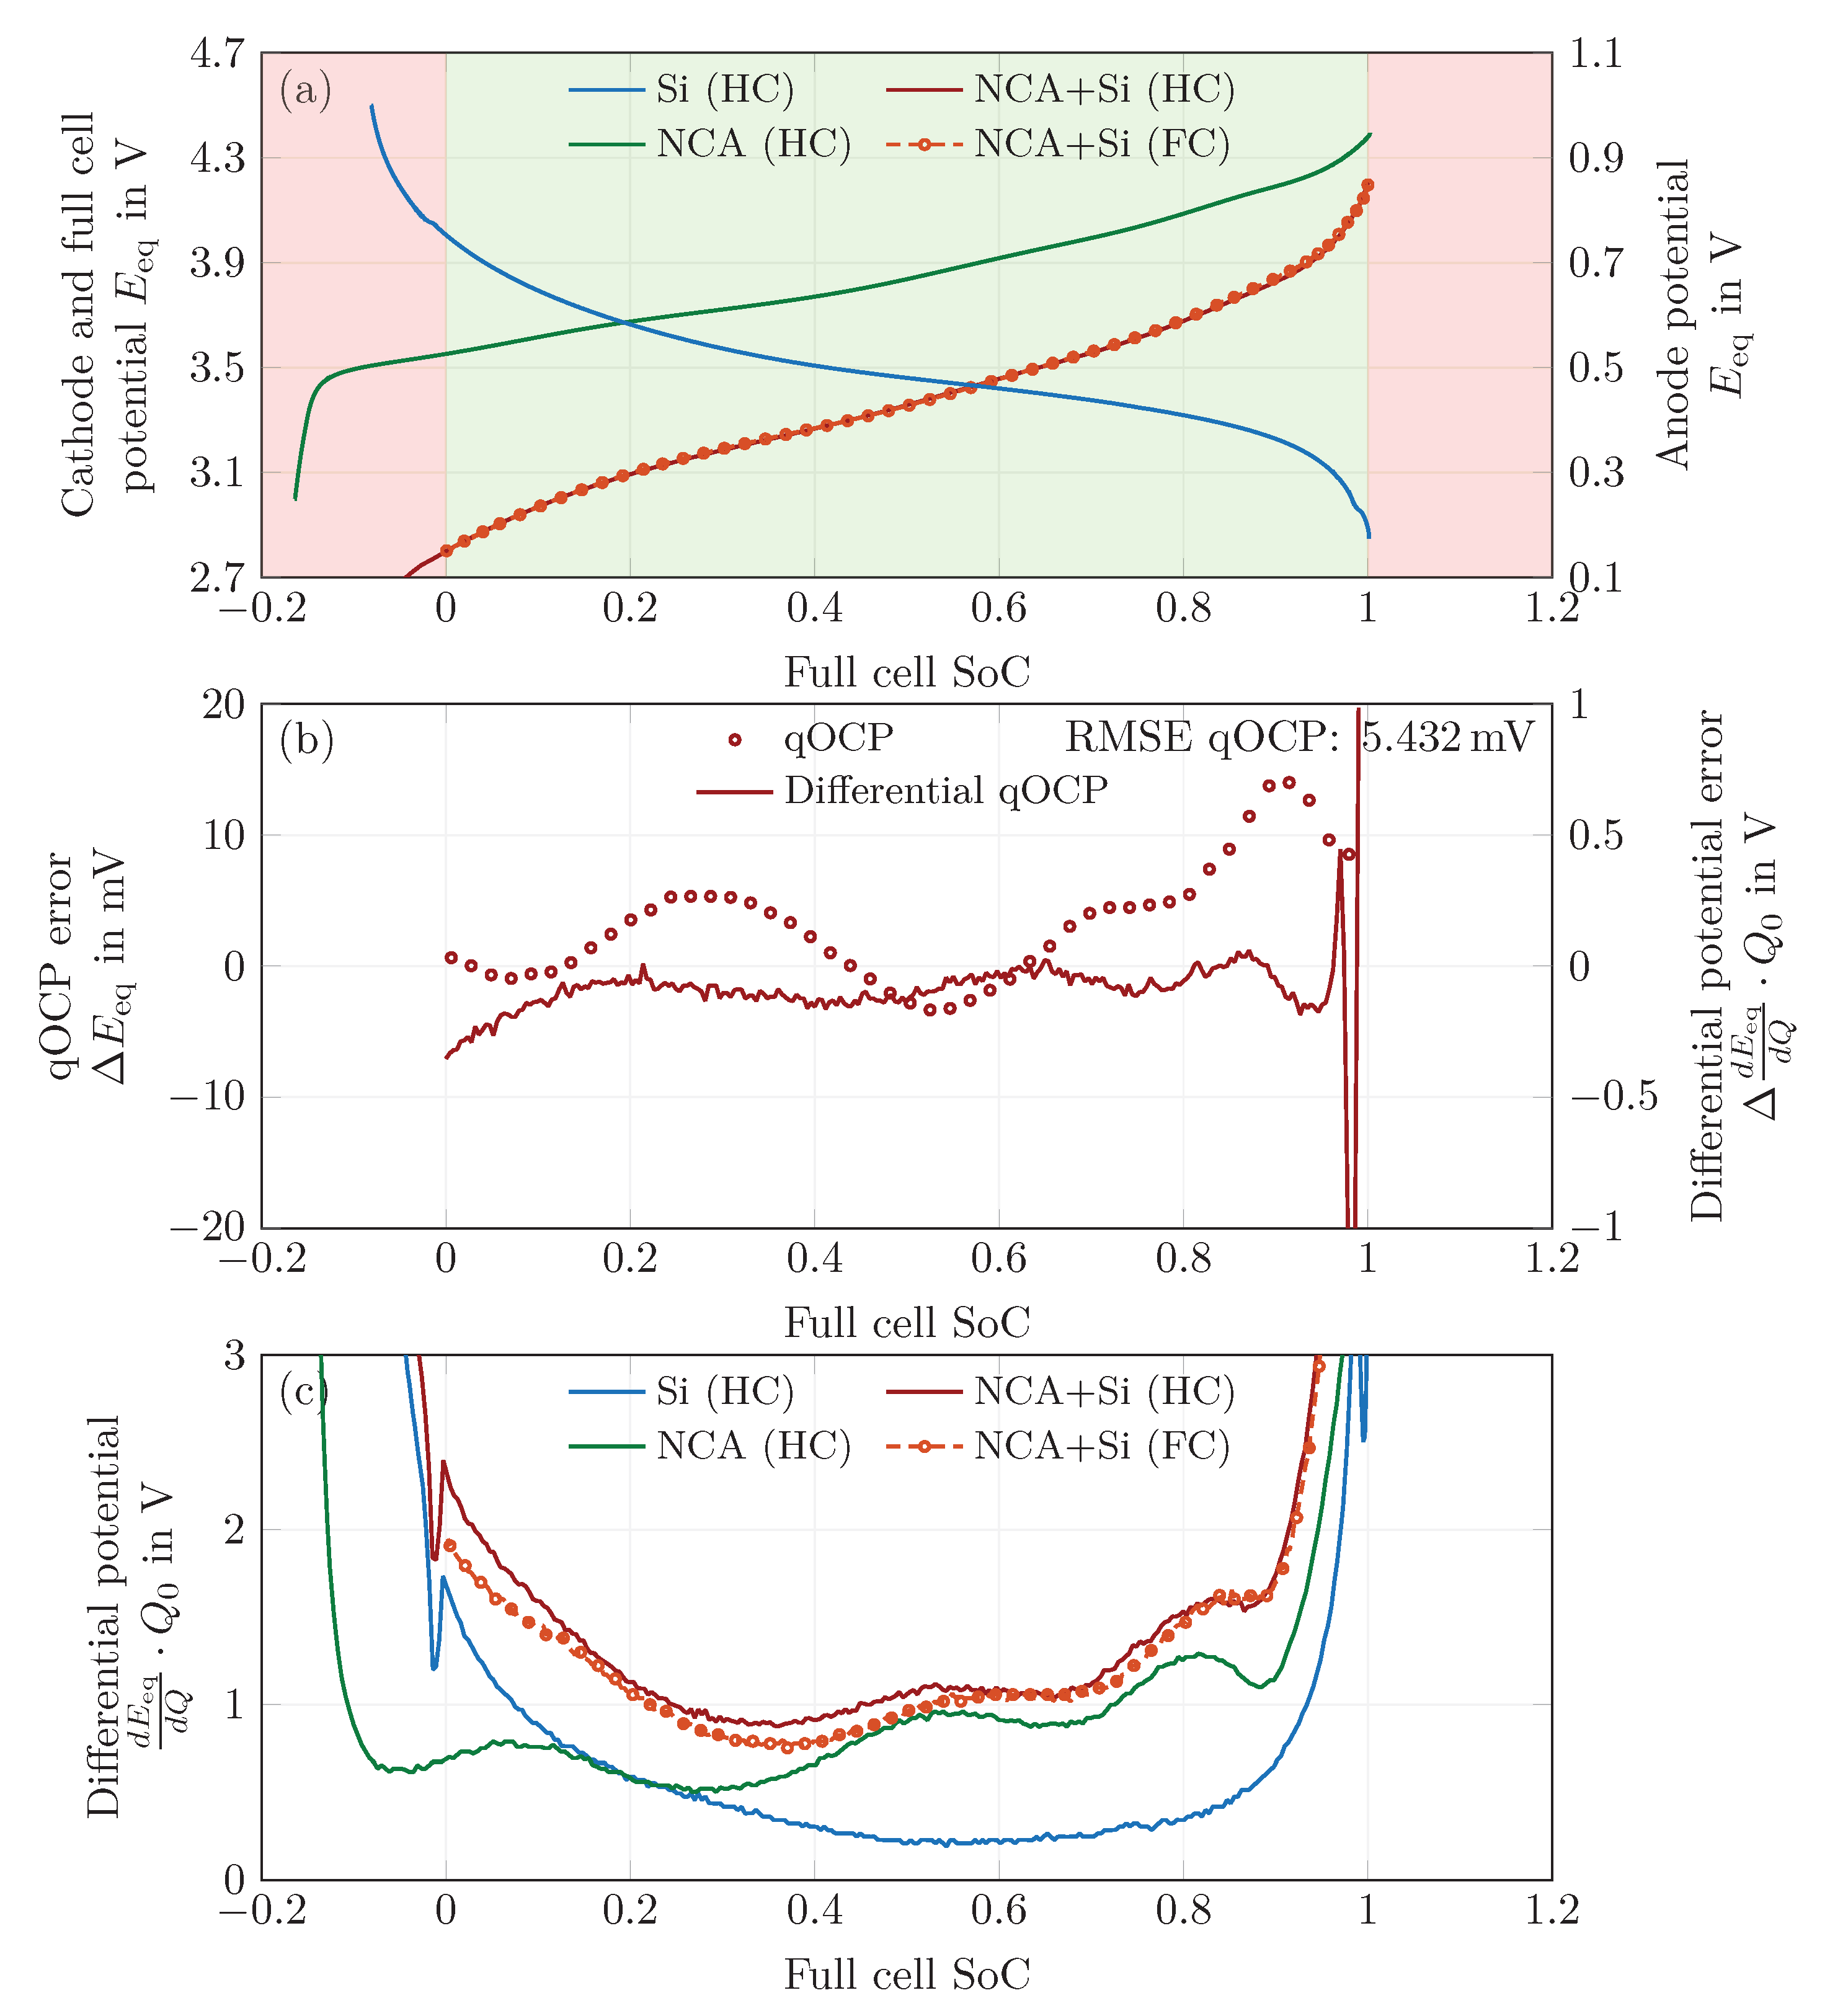
In a first step, the equilibrium potentials of the half cells and the full cell were measured. At C-rates as low as C / 50 , the Si half-cell potential still relaxes significantly, but the origin of this effect has not been identified yet. The behavior at C / 50 is similar to that at C / 10 , indicating that more processes than just the charge transfer described by a single Butler–Volmer equation might be at play. Thus, the qOCP measurement at constant current have been used in the following, ignoring the model’s equilibrium potential relaxation effect. Voltage hysteresis is accounted for by switching between lithiation and delithiation half-cell potentials.
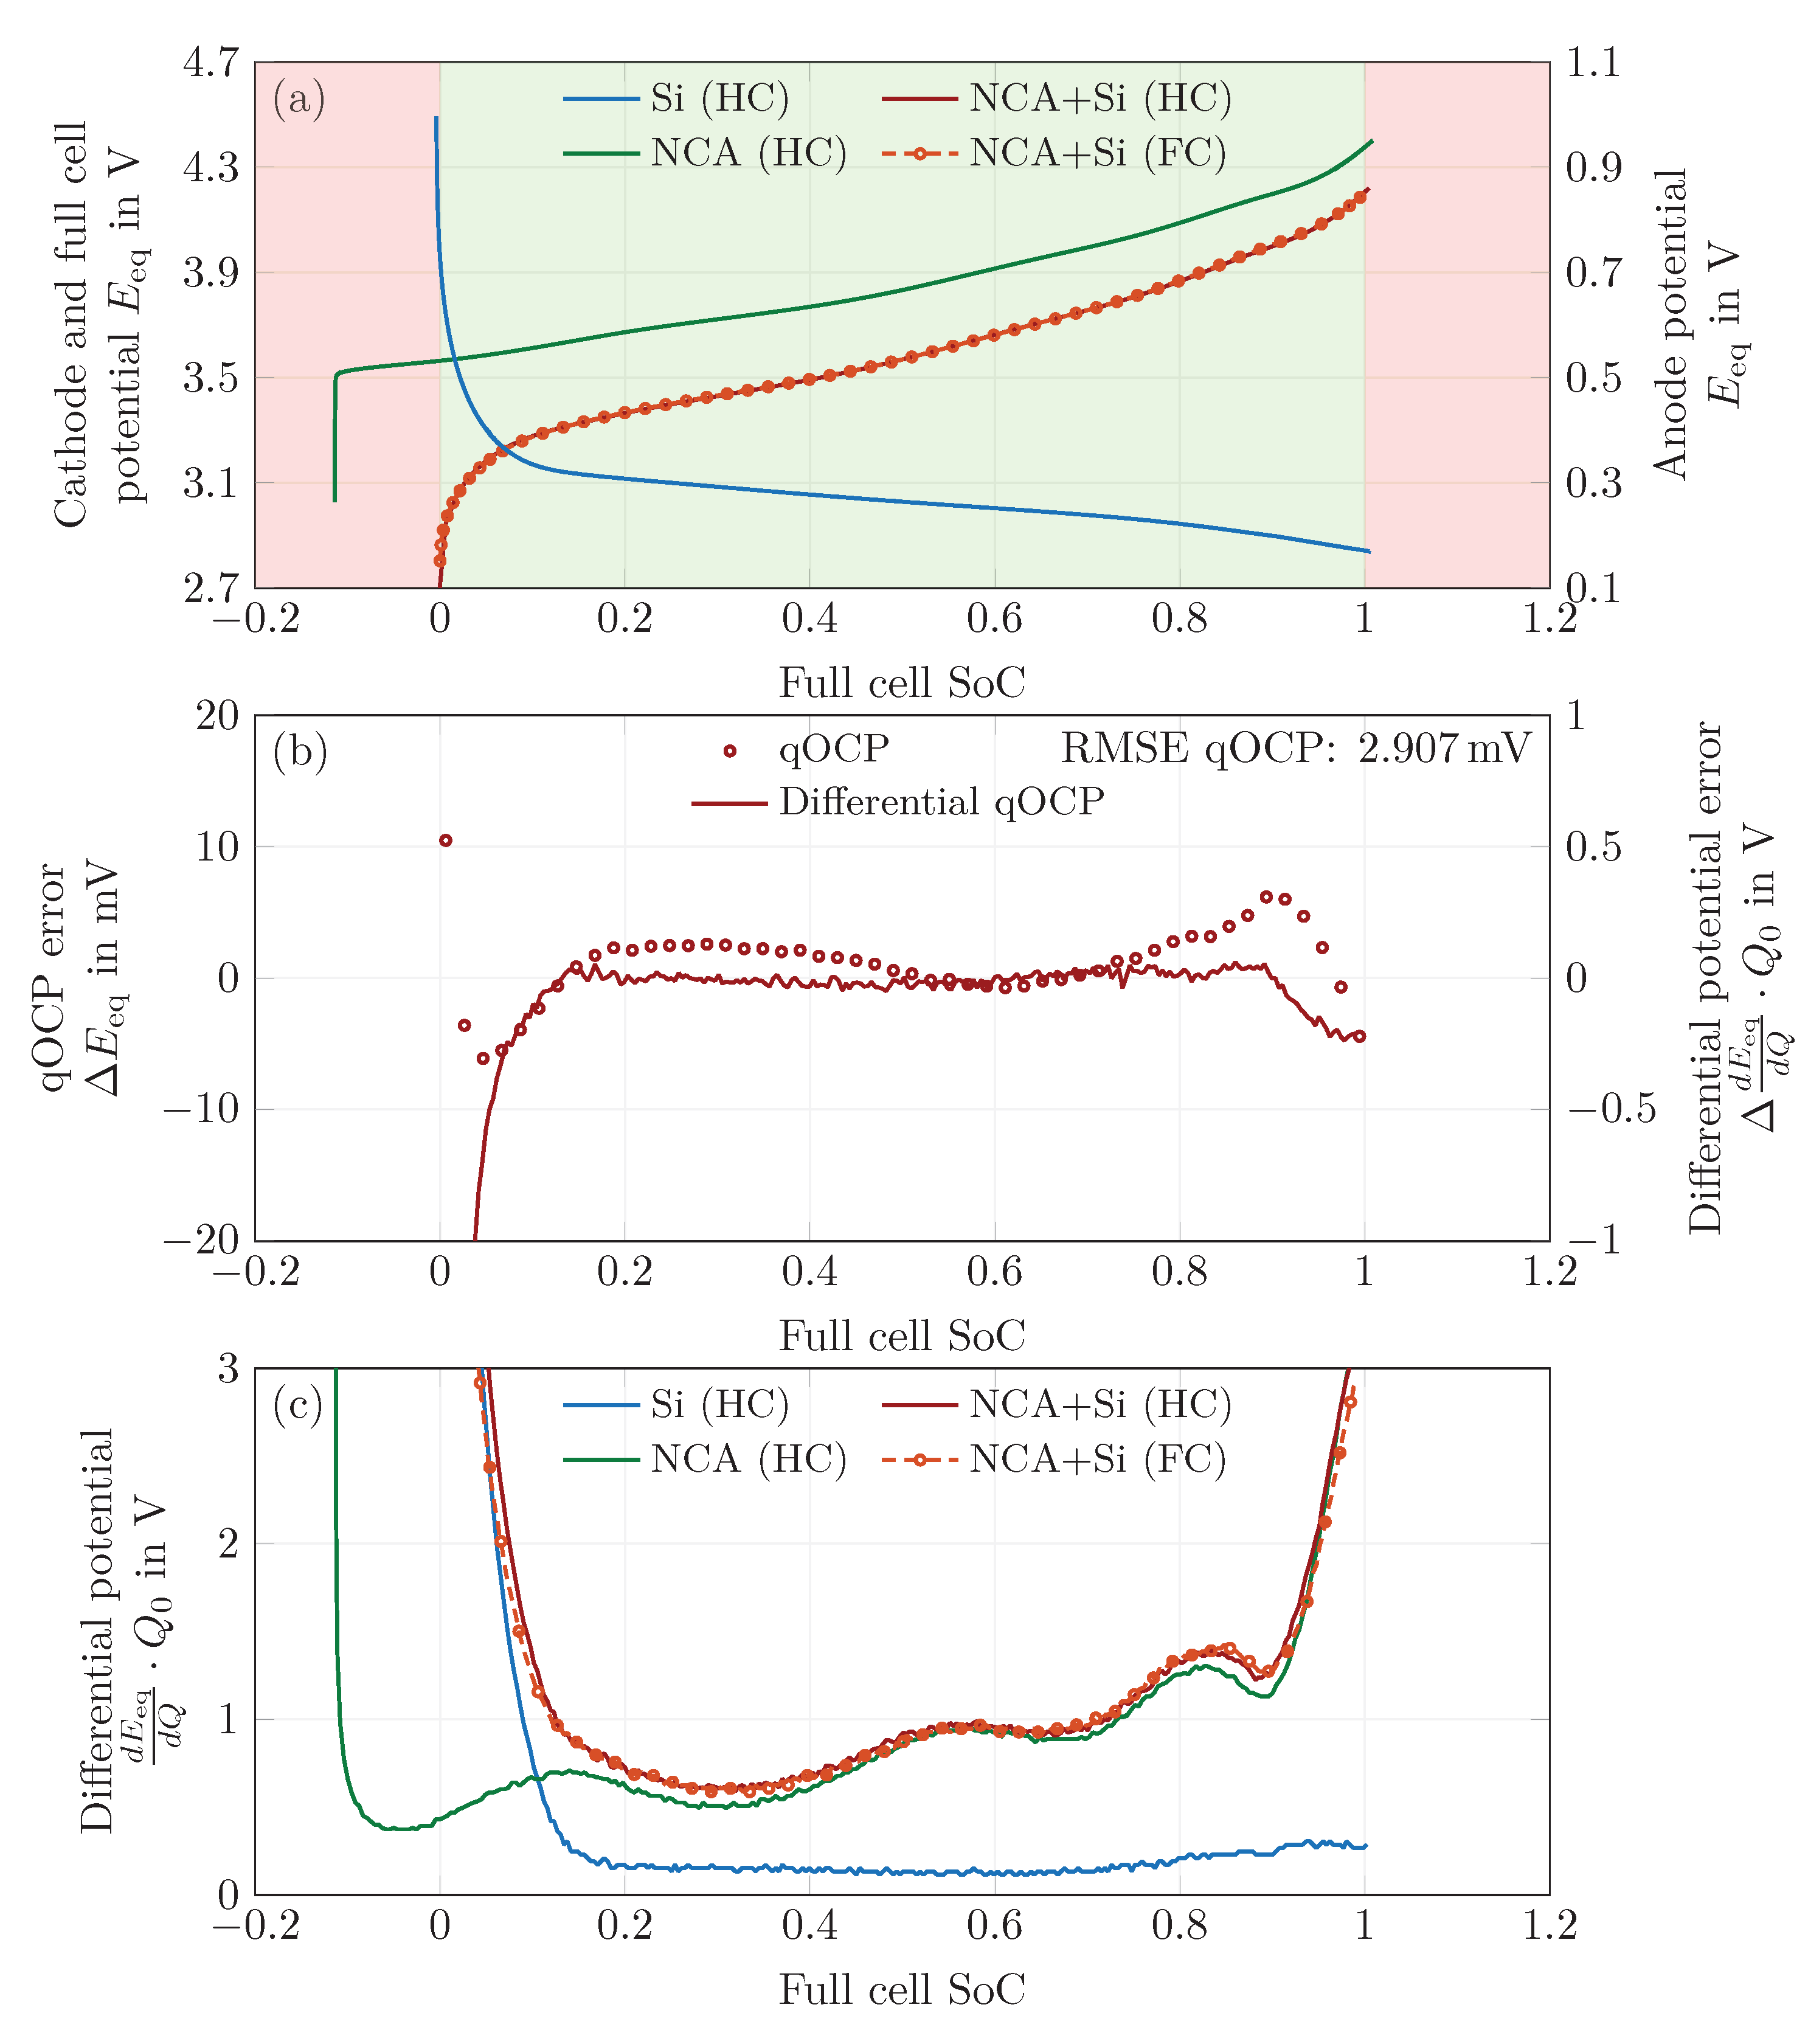
In a second step, a balancing process of the measured half cell qOCP curves was performed. A proper superposition of the half-cell potentials then yields the reconstructed full-cell qOCP curve with a RMSE of 2.907   m V for the charge step and 5.432   m V for the discharge step. The measurements needed for this balancing process also allow for an estimation of the anode and cathode utilization, and as such allow for an estimation of the DoL.
In a third step, the maximum solid-phase concentrations were fitted in such way that the model’s relative concentration is always bounded by the minimum and maximum DoL obtained in the previous step. Additionally, the concentrations were scaled so that the model’s capacity meets that of the measurements.
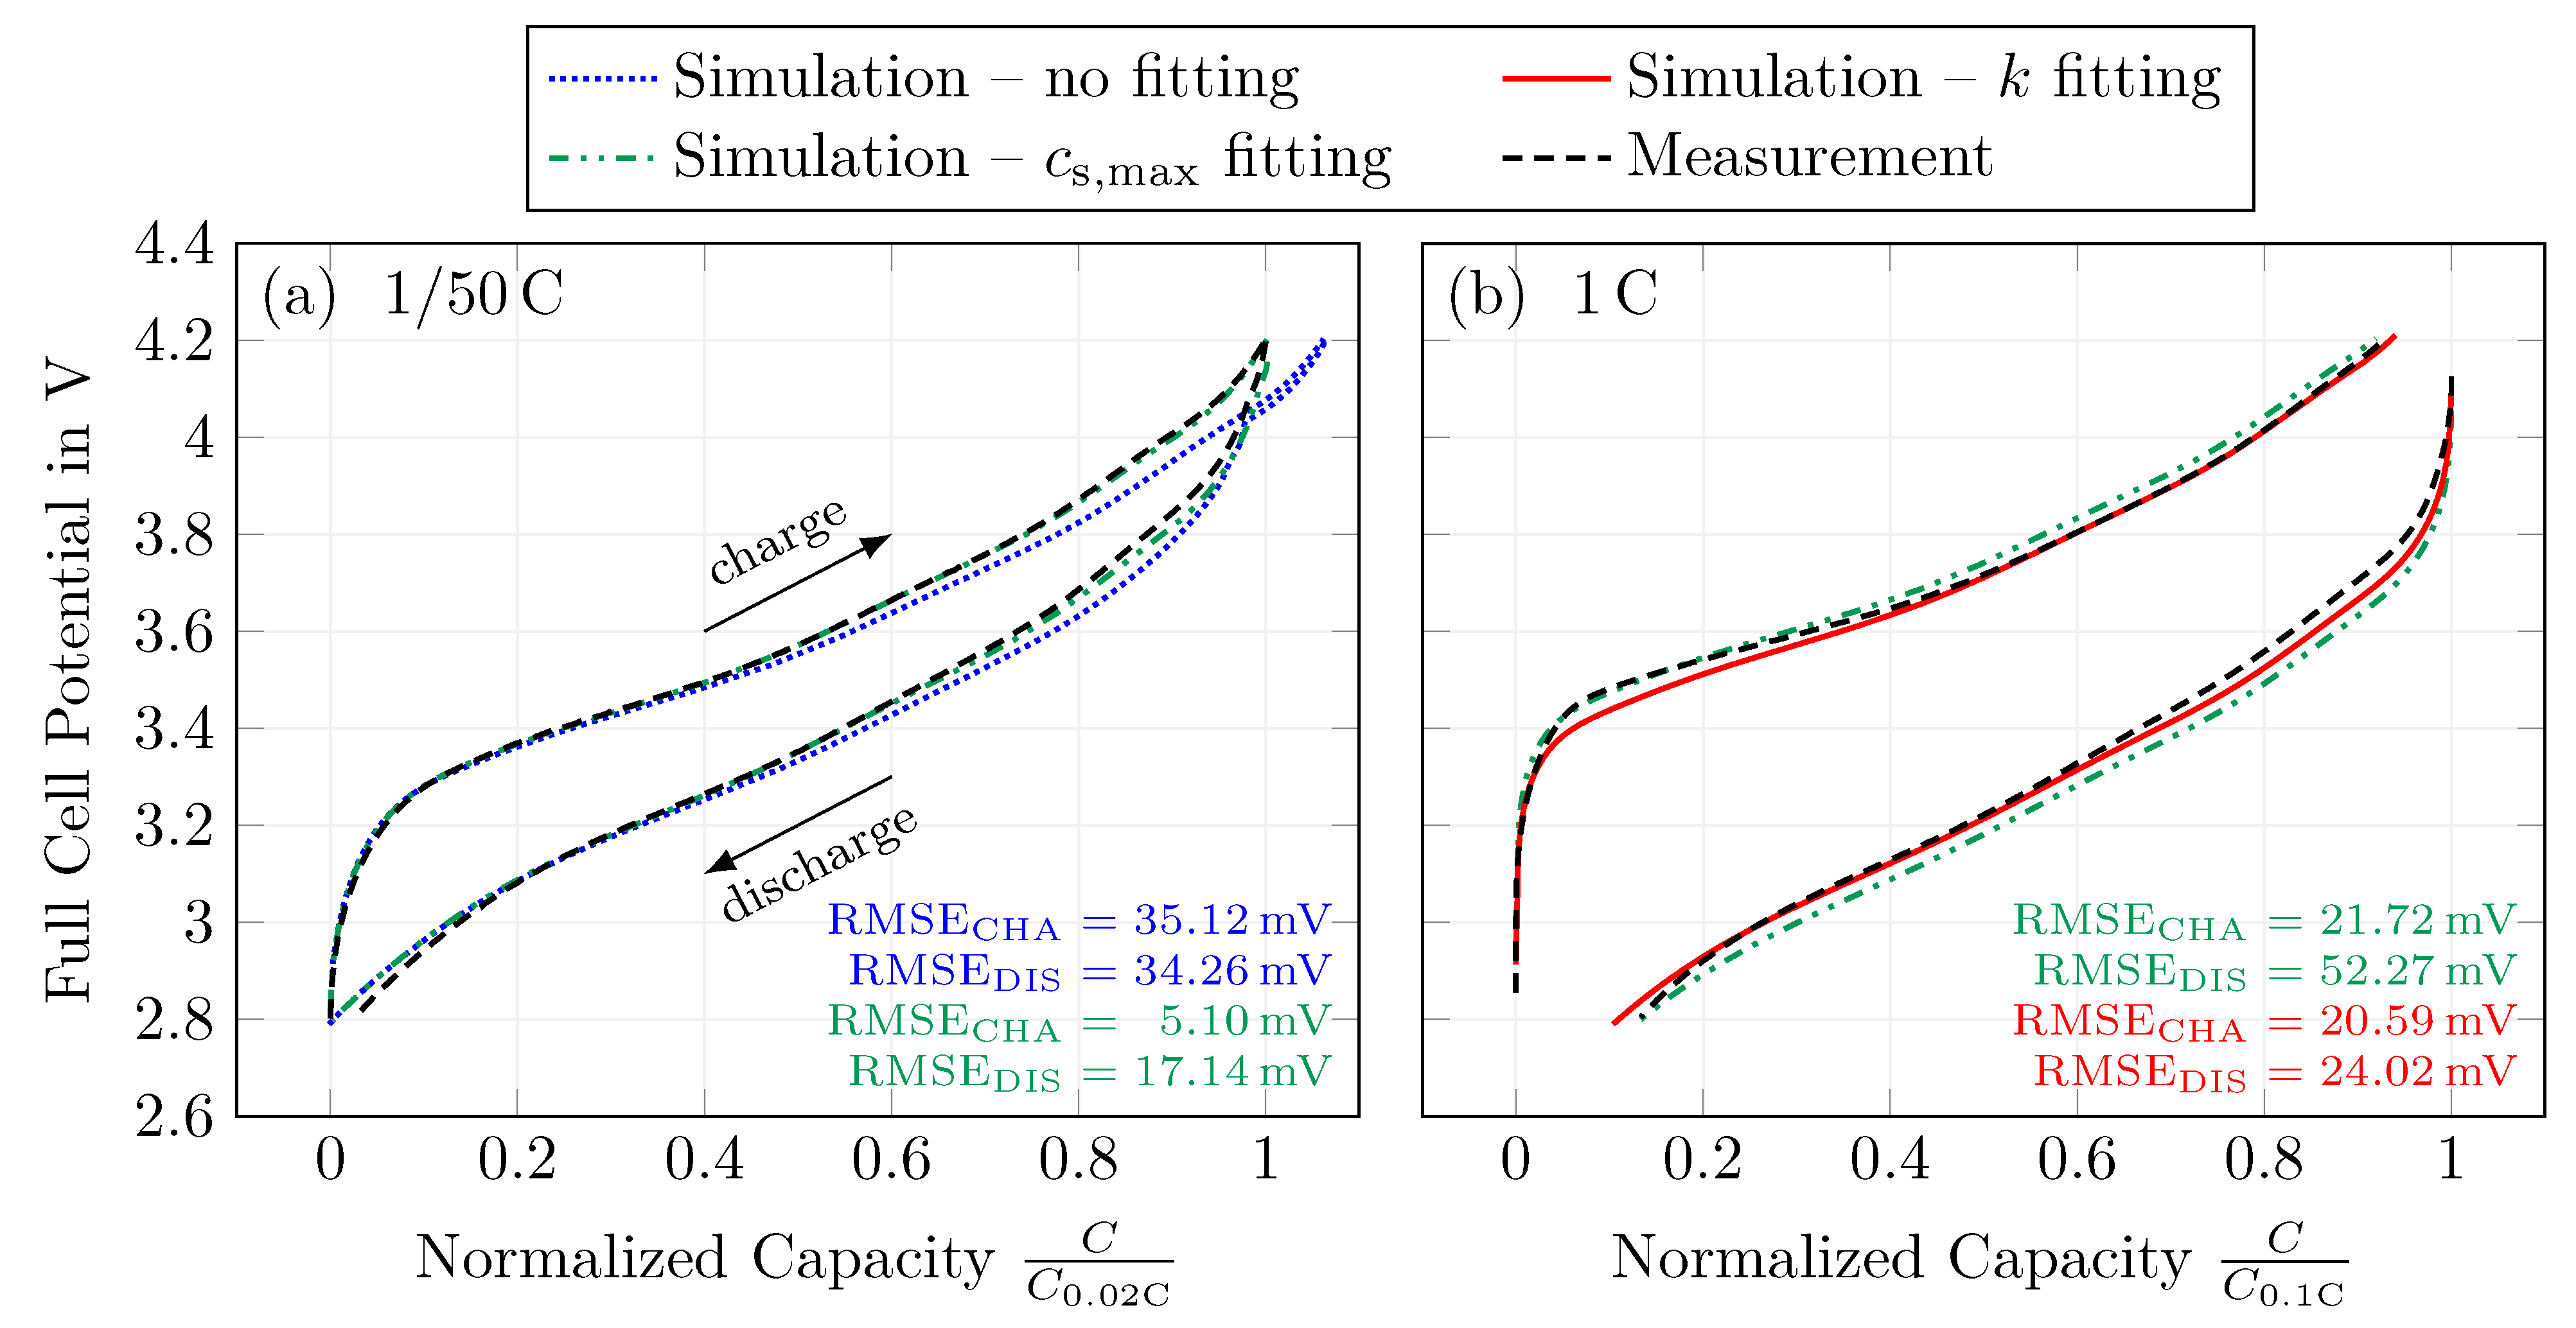
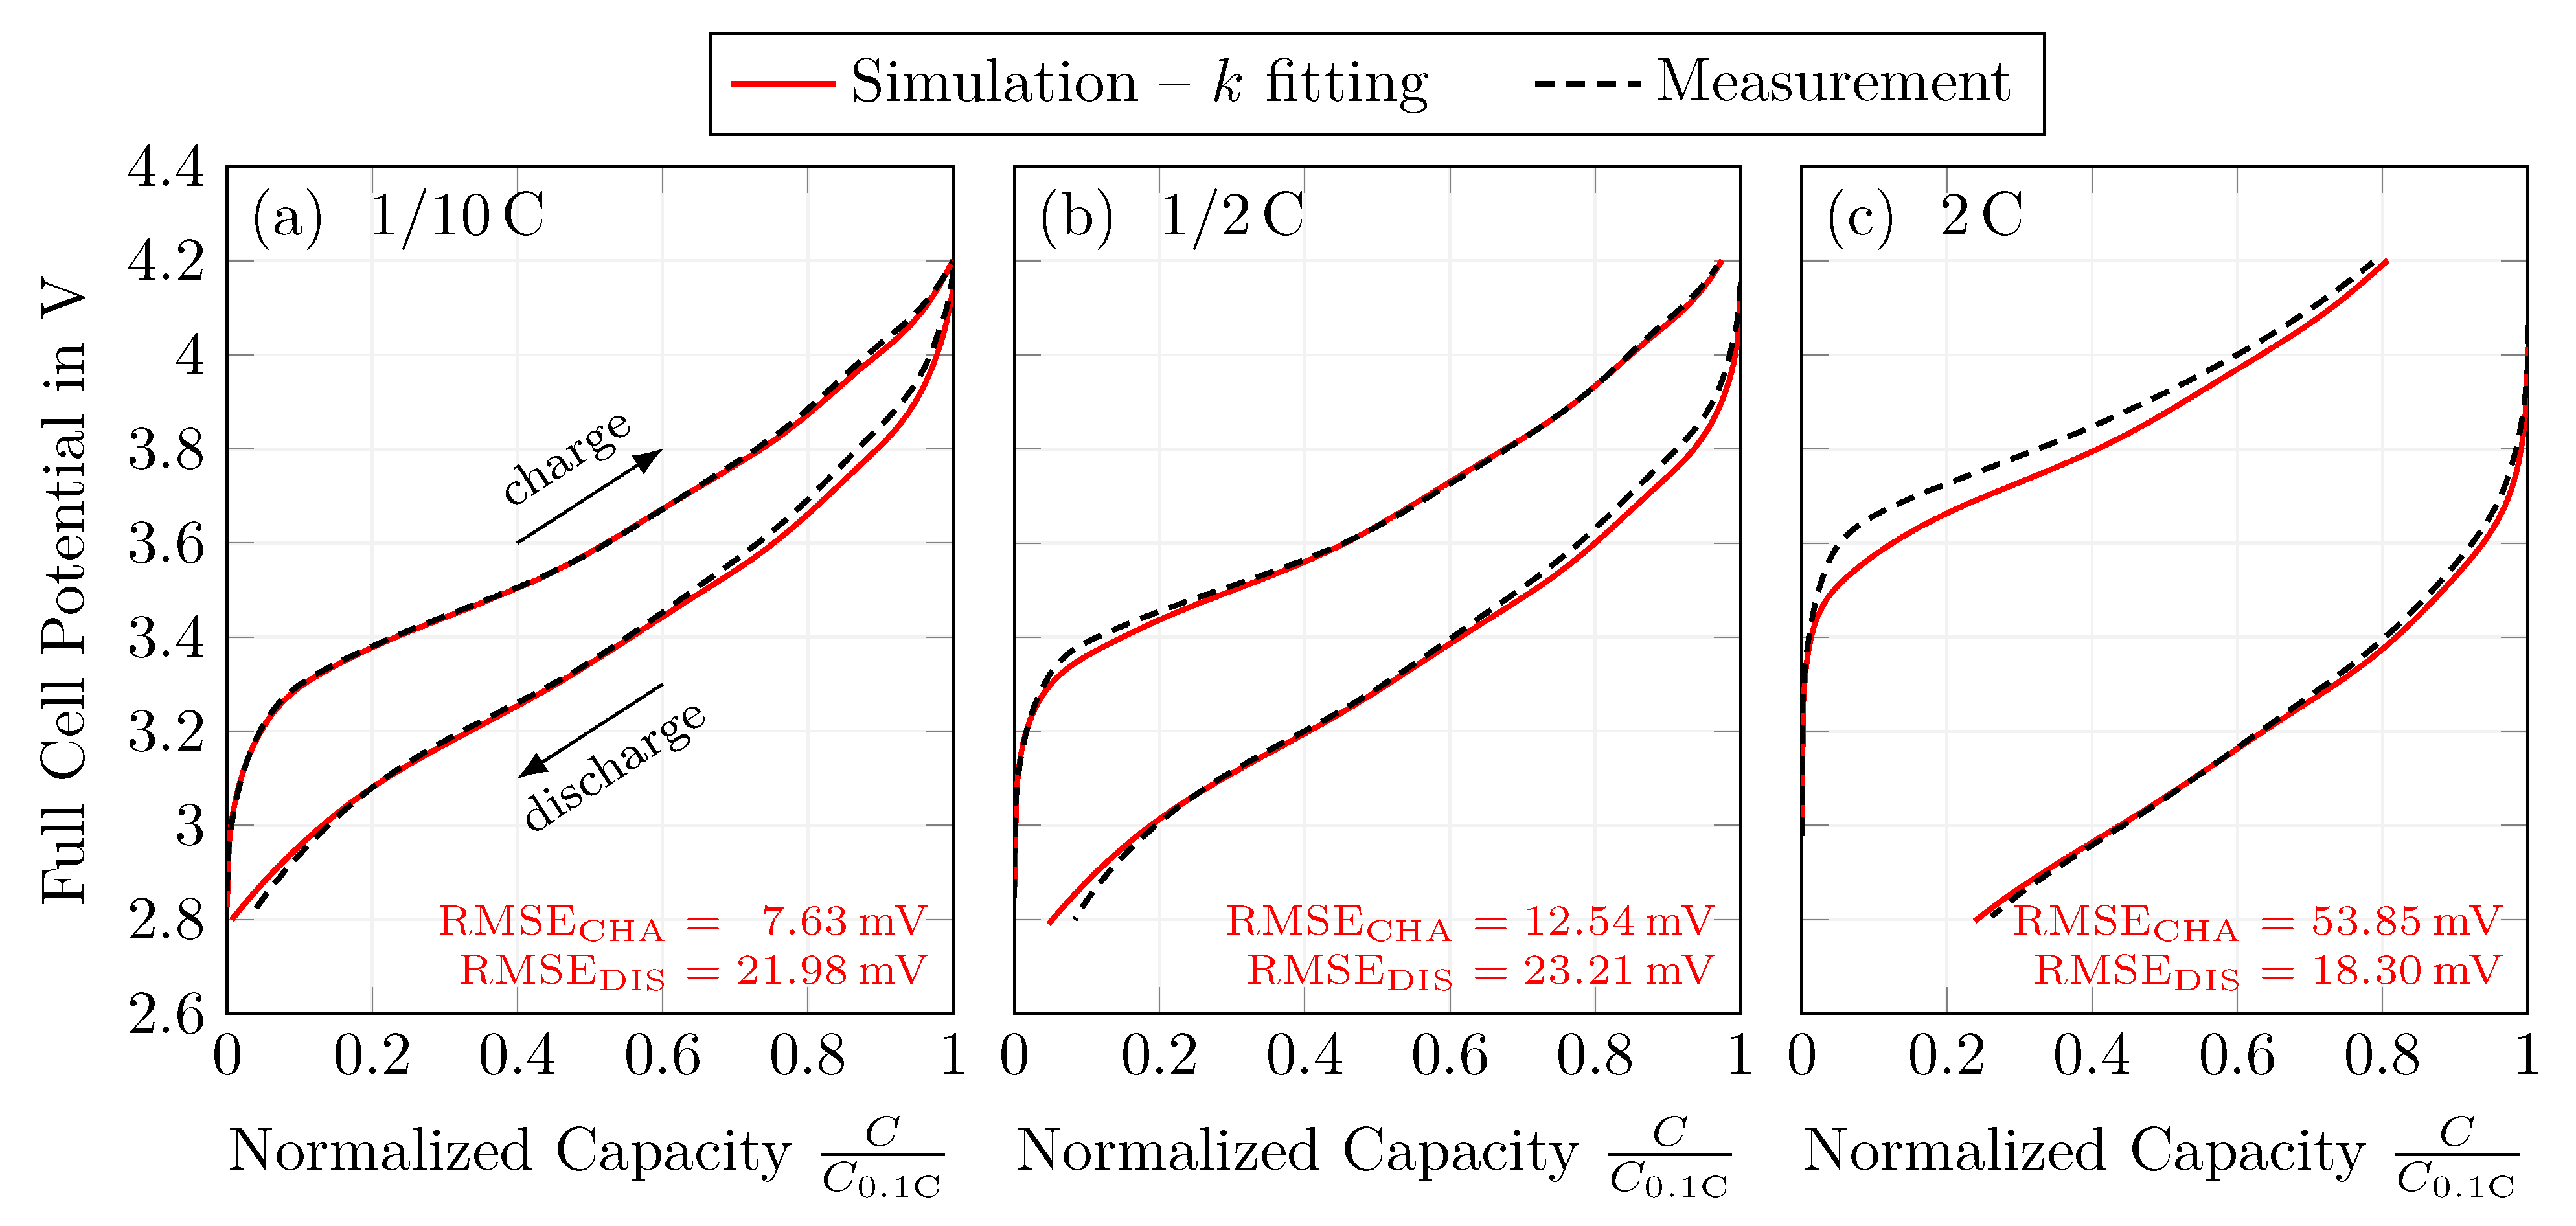
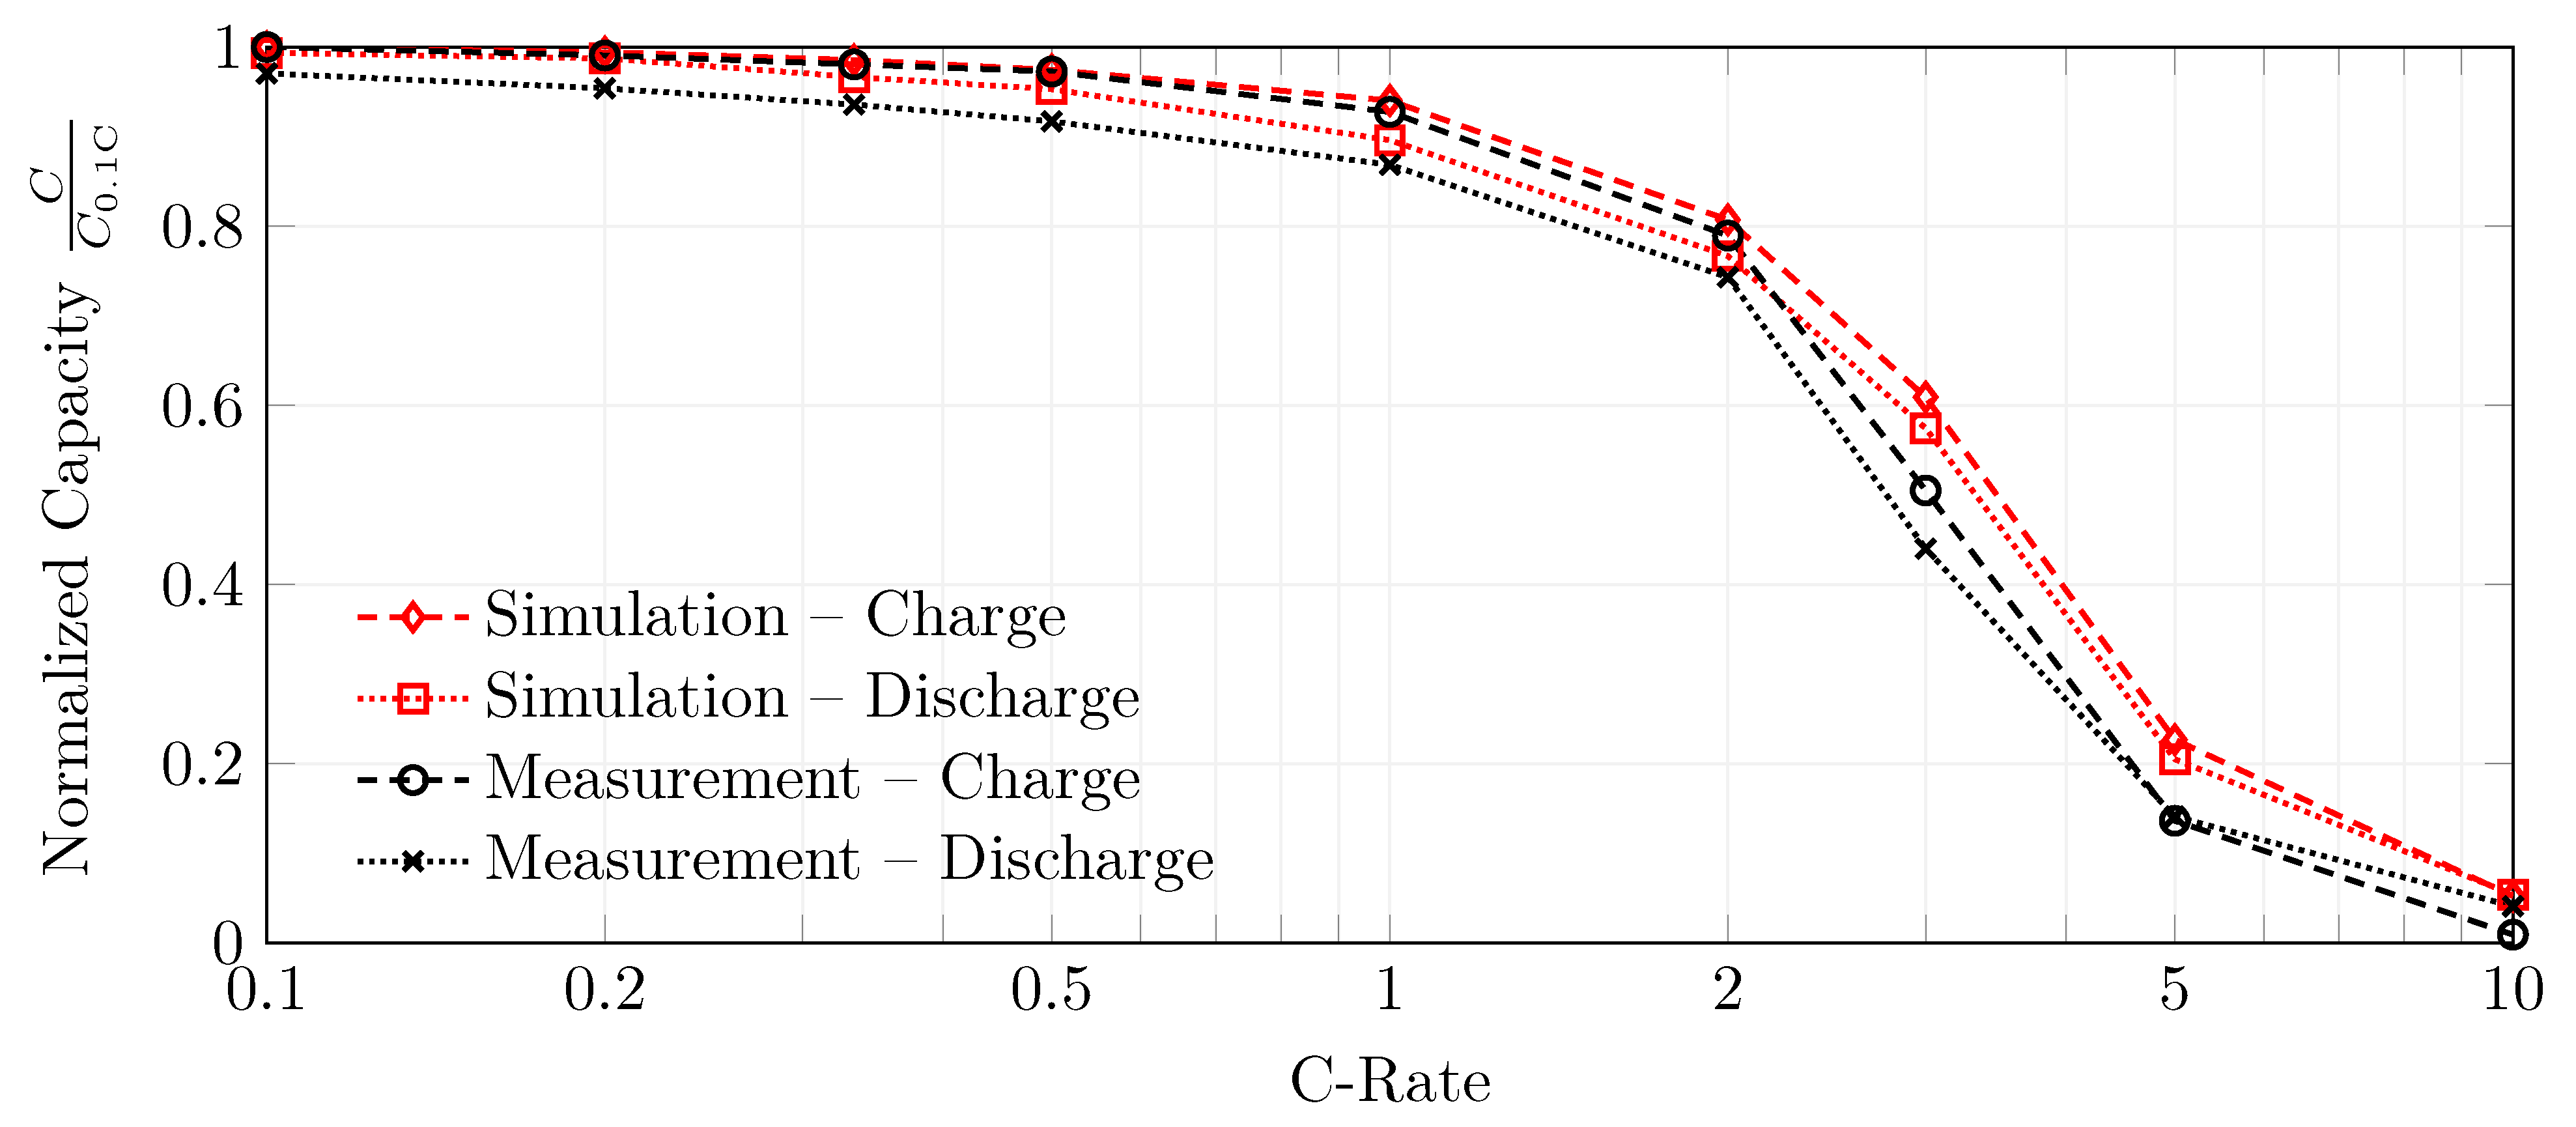
In a fourth and final step, the model’s reaction rate constants were fitted for a 1 C constant current charge and discharge step. The fitting was performed in such a way that the full-cell potential during both charging and discharging is described by a single parameter set. Different C-rates between C / 10 and 10 C were used to validate the model parametrization. The model can describe the full-cell potential and also meets the constant current (dis)charge capacity. This is true up to a C-rate of 2 C . At higher C-rates, the model underestimates the polarization when comparing the simulation results with measurements.
Overall, the model results are satisfying, with an RMSE between measurements and the simulations of 20.59   m V and 24.02   m V during 1 C charging and discharging, respectively. At the same time, the absolute error in the normalized capacities is 1.27% and 2.75%, respectively. Thus, the presented parametrization is considered valid to describe a silicon-dominant anode when a Newman-type model is used, under the premise that:
  • Si is partially lithiated to a similar degree as in this study and as such does not undergo further amorphization or crystallization.
  • Model equations have not been adjusted, for example with respect to complex electrode kinetics, solid state diffusion, or volumetric changes.
  • Voltage hysteresis is accounted for via two equilibrium curves rather than a dedicated hysteresis model.
In future work, several aspects regarding silicon-dominant anodes can be further investigated. Optimized parameters such as DoL-dependencies for the solid-phase diffusivity or the electrical conductivity could further improve the model quality. Additionally, a dedicated voltage hysteresis model could prove valuable to better describe the voltage behavior during open-circuit periods. An overview, including suggestions for experimental studies, is given for each of the parameters that have been taken from literature. An understanding of the origin of the strong relaxation behavior, including an appropriate kinetics model, would benefit subsequent studies. Closely related to this is an analysis of polarization at high currents. Since only laboratory cells were used, isothermal conditions were assumed for all experiments and simulations. A scale-up to a large-format pouch cell, for example, would require a thermal model to capture temperature-related effects such as joule heating and entropic heating. Similarly, a suitable mechanical model, because of the large volumetric expansion, is needed to capture porosity changes and related effects on the mass transport. Eventually, a fully coupled physicochemical-mechanical-thermal model would be required to capture all mentioned effects properly.

Supplementary Materials

The following supporting information can be downloaded at: https://www.mdpi.com/article/10.3390/batteries9110558/s1, Figure S1: Quasi open-circuit potentials as shown in Figure 1 but with additional information.; Table S1: Electrode composition and mass densities for each cell component; Table S2: Characteristic properties of double-coated electrode samples; Table S3: Information on the cycling procedure; Table S4: Step-by-step overview for the data conversion from charge throughput to the degree of lithiation. References [61,62,63] are cited in the supplementary materials.

Author Contributions

Conceptualization, A.D.; methodology, A.D. and S.F.; software, A.D.; validation, A.D., S.F. and L.H.; formal analysis, A.D. and L.H.; investigation, A.D., S.F. and L.H.; resources, A.J.; data curation, A.D. and L.H.; writing—original draft preparation, A.D.; writing—review and editing, A.D., S.F., L.H. and A.J.; visualization, A.D. and L.H.; supervision, A.J.; project administration, A.D. and A.J.; funding acquisition, A.J. All authors have read and agreed to the published version of the manuscript.

Funding

This research is funded by the German Federal Ministry of Education and Research (BMBF) via the research project ExZellTUM III (grant number: 03XP0255). The project is overseen by Project Management Juelich (PtJ).

Data Availability Statement

The data presented in this study are available on request from the corresponding author. The data are not publicly available due to privacy policy.

Acknowledgments

The authors gratefully thank Philip Rapp for the support in T-cell assembly and Simon Helmer for measurements regarding of MacMullin numbers.

Conflicts of Interest

The authors declare no conflict of interest. The funders had no role in the design of the study; in the collection, analyses, or interpretation of data; in the writing of the manuscript; or in the decision to publish the results.

Abbreviations

The following abbreviations are used in this manuscript:
Acronyms
AMactive material
CCconstant current
CVconstant voltage
DoLdegree of lithiation
DVAdifferential voltage analysis
GITTgalvanostatic intermittent titration technique
Lilithium
LIBlithium-ion battery
NCAnickel-cobalt-aluminum-oxide
PITTpotentiostatic intermittent titration technique
pOCPpulsed open-circuit potential
qOCPquasi open-circuit potential
RMSEroot-mean-squared error
SEIsolid-electrolyte interphase
Sisilicon
SoCstate of charge
Roman Symbols
Ccapacity, Ah
cconcentration, mol m 3
Ddiffusivity, m 2 s 1
d ln f ± d ln c l ( x , t ) activity, no unit
E eq equilibrium potential, V
F Faraday’s constant, 96,485 A s mol 1
icurrent density, A m 2
i 0 exchange current density, A m 2
j n pore-wall flux, mol m 2 s 1
kreaction rate constant, m s 1
Lthrough-plane thickness, m
N M MacMullin number, no unit
rr-axis or r-dimension (pseudo dimension), m
R universal gas constant, 8.314 J mol 1 K 1
R p particle radius, m
Ttemperature, K
ttime, s
t 0 + transference number, no unit
xx-axis or x-dimension, m
Greek Symbols
α charge transfer coefficient, no unit
χ stoichiometry, no unit
ε volume fraction, no unit
η overpotential, V
κ conductivity, S m 1
φ electrical potential, V
ρ density, kg m 3
Subscripts & Superscripts
aanodic
appapplied
ccathodic
effeffective
grgravimetric
lliquid phase
maxmaximum
refreference
ssolid phase
surfsurface
ththeoretical
tottotal

Appendix A. Model Equations and Parameters

Table A1. Equations for the p2D model. Here, x is the spatial gradient in the real dimension, i.e., along the through-plane direction of the cell stack, and r is the spatial gradient in the pseudo dimesion, i.e., along the radius of the spherical active material particles.
Spatial gradients x = x , r = r (r in spherical pseudo dimension) (A1)
Mass balance ε l c l ( x , t ) t = x D l eff c l ( x , t ) x c l ( x , t ) + i l ( x , t ) 1 t + 0 F (A2)
Mass balance c s ( x , t , r ) t = r D s r c s ( x , t , r ) = 1 r 2 r D s r 2 c s ( x , t , r ) r (A3)
Potentials x φ l ( x , t ) = i l ( x , t ) κ l eff + 2 R T F 1 t + 0 1 + d   ln   f ± d   ln   c l ( x , t ) x ln c l ( x , t ) (A4)
x φ s ( x , t ) = i s ( x , t ) κ s with i app ( t ) = i s ( x , t ) + i l ( x , t ) x , t (A5)
Charge balance x i l ( x , t ) + x i s ( x , t ) = 0 with x i s ( x , t ) = 3 ε AM R p F j n ( x , t ) (A6)
Electrode kinetics j n ( x , t ) = i 0 ( x , t ) F exp α a F η ( x , t ) R T exp α c F η ( x , t ) R T (A7)
η ( x , t ) = φ s ( x , t ) φ l ( x , t ) E eq ( x , t ) (A8)
i 0 ( x , t ) = F k c α a k a α c c s , max c s , surf α a c s , surf α c c l ( c l , ref ) α a (A9)
Effective transport parameters ( κ s eff ) = κ s ( N M ) , κ l eff = κ l N M , D l eff = ( D l ) N M (A10)
Boundary conditions x c l ( x , t ) | x = 0 x = L tot = 0 (A11)
x φ l ( x , t ) | x = 0 x = L tot = 0 (A12)
φ s ( x , t ) | x = 0 = 0 (A13)
x φ s ( x , t ) | x = L tot = i app κ s eff (A14)
r c s ( x , t , r ) | r = 0 = 0 (A15)
r c s ( x , t , r ) | r = R p = j n D s (A16)
Table A2. Parametrization of the p2D model with NCA|  |Si electrodes.
AnodeSeparatorCathode
Geometry
Thickness coating L46 μm m,c 2 × 260 μm d 68 μ m m , c
d 50 particle radius R p 2.25 μm L13.0755 μm d
Active material volume fraction ε AM 0.32 c 0.61 c
Electrolyte volume fraction (porosity) ε l 0.50 c 0.55 L 8 0.32 c
MacMullin number N M 5.385 c 1.29 L 9 , c 7.333 c
Thermodynamics
Equilibrium potential E eq Figure 1 m Figure 1 m
Stoichiometry χ     100% SoC 0.3068 f 0.1396 f
                                0% SoC 0.0396 f 0.7954 f
Max. concentration c s , max 322,067 mol m−3 c,f 46,400 mol m−3 c,f
Transport
Solid diffusivity D s 2 × 10⁻¹⁵ m2 s−1 L3 1 × 10⁻¹⁴ m2 s−1 L7
Electric conductivity κ s 33 S m−1 L3 1 S m−1 L6
Kinetics
Reaction rate constant k5.78 × 10−12 m s−1 L2,f 1.64 × 10⁻¹⁰ m s−1 L4,f
Anodic charge transfer coefficient α a 0.5 a 0.5 a
Cathodic charge transfer coefficient α c 0.5 a 0.5 a
Electrolyte *
Salt diffusivity D l in m2 s−1 *, L 5 10 4 · 10 4.43 54 T ( 229 + 5 c l ) 0.22 c l
Ionic conductivity κ l in S m−1 *, L 5 , f 0.5358 · 10 1 c l ( 10.5 + 0.668 c l + 0.494 c l 2 + 0.0740 T 0.0178 c l T 8.86 · 10 4 c l 2 T 6.96 · 10 5 T 2 + 2.8 · 10 5 c l T 2 ) 2
Activity d   ln   f ± d   ln   c l ( x , t ) (no unit) *, L 5 ( 0.601 0.24 c l 0.5 + 0.982 ( 1 0.0052 ( T 293.15 ) ) c l 1.5 ) 1 t + 0 1
Transference number transference number t + 0 L 5 0.38
Reference concentration c l , ref   a 1 mol m−3
* Analytic functions for the electrolyte are physically not interpretable. Input arguments are to be normalized (concentration c l per / L and temperature T per K ). The functions are only valid for c l [ 0 / L ; 4 / L ] . The output value is to be interpreted in the unit given in the table. a assumption; c calculated; d from supplier data sheet; f fitted, based on data sheet (d, f) or based on the literature (L,f); L from the literature; L 1 [13]; L 2 [20]; L 3 [37]; L 4 [40]; L 5 [46]; L 6 [49]; L 7 [53]; L 8 [64]; L 9 [65]; m measured.

Appendix B. Additional Measurement Results

Figure A1. Approximation of the quasi open-circuit potential (qOCP) under constant current discharge at C /50 and 25 °C. Differential voltage analysis (c) was used to reconstruct the measured qOCP vs. full-cell SoC (a) under discharge of the full cell (see NCA+Si (FC)) via the (de)lithiation paths of the respective half cells (see NCA (HC) and Si (HC)). The approximation errors vs. SoC as well as the RMSE of the qOCP are shown in subplot (b)).
Batteries 09 00558 g0a1

References

  1. Scrosati, B. History of lithium batteries. J. Solid State Electrochem. 2011, 15, 1623–1630. [Google Scholar] [CrossRef]
  2. Yoshino, A. The birth of the lithium-ion battery. Angew. Chem. Int. Ed. Engl. 2012, 51, 5798–5800. [Google Scholar] [CrossRef] [PubMed]
  3. Zhang, J.G.; Wang, W.; Xiao, J.; Xu, W.; Graff, G.L.; Yang, G.; Choi, D.; Wang, D.; Li, X.; Liu, J. Silicon-Based Anodes for Li-ion Batteries. In Encyclopedia of Sustainability Science and Technology; Meyers, R.A., Ed.; Springer: New York, NY, USA, 2012; pp. 9293–9316. [Google Scholar] [CrossRef]
  4. Wetjen, M.; Pritzl, D.; Jung, R.; Solchenbach, S.; Ghadimi, R.; Gasteiger, H.A. Differentiating the Degradation Phenomena in Silicon-Graphite Electrodes for Lithium-Ion Batteries. J. Electrochem. Soc. 2017, 164, A2840–A2852. [Google Scholar] [CrossRef]
  5. Wetjen, M.; Solchenbach, S.; Pritzl, D.; Hou, J.; Tileli, V.; Gasteiger, H.A. Morphological Changes of Silicon Nanoparticles and the Influence of Cutoff Potentials in Silicon-Graphite Electrodes. J. Electrochem. Soc. 2018, 165, A1503–A1514. [Google Scholar] [CrossRef]
  6. Xu, Q.; Wang, Q.; Chen, D.; Zhong, Y.; Wu, Z.; Song, Y.; Wang, G.; Liu, Y.; Zhong, B.; Guo, X. Silicon/graphite composite anode with constrained swelling and a stable solid electrolyte interphase enabled by spent graphite. Green Chem. 2021, 23, 4531–4539. [Google Scholar] [CrossRef]
  7. Sturm, J.; Rheinfeld, A.; Zilberman, I.; Spingler, F.B.; Kosch, S.; Frie, F.; Jossen, A. Modeling and simulation of inhomogeneities in a 18650 nickel-rich, silicon-graphite lithium-ion cell during fast charging. J. Power Sources 2019, 412, 204–223. [Google Scholar] [CrossRef]
  8. Schmitt, J.; Schindler, M.; Jossen, A. Change in the half-cell open-circuit potential curves of silicon–graphite and nickel-rich lithium nickel manganese cobalt oxide during cycle aging. J. Power Sources 2021, 506, 230240. [Google Scholar] [CrossRef]
  9. Schindler, M.; Sturm, J.; Ludwig, S.; Durdel, A.; Jossen, A. Comprehensive Analysis of the Aging Behavior of Nickel-Rich, Silicon-Graphite Lithium-Ion Cells Subject to Varying Temperature and Charging Profiles. J. Electrochem. Soc. 2021, 168, 060522. [Google Scholar] [CrossRef]
  10. Ko, M.; Chae, S.; Cho, J. Challenges in Accommodating Volume Change of Si Anodes for Li-Ion Batteries. ChemElectroChem 2015, 2, 1645–1651. [Google Scholar] [CrossRef]
  11. Jantke, D.; Bernhard, R.; Hanelt, E.; Buhrmester, T.; Pfeiffer, J.; Haufe, S. Silicon-Dominant Anodes Based on Microscale Silicon Particles under Partial Lithiation with High Capacity and Cycle Stability. J. Electrochem. Soc. 2019, 166, A3881–A3885. [Google Scholar] [CrossRef]
  12. Obrovac, M.N.; Krause, L.J. Reversible Cycling of Crystalline Silicon Powder. J. Electrochem. Soc. 2007, 154, A103. [Google Scholar] [CrossRef]
  13. Haufe, S.; Bernhard, R.; Pfeiffer, J. Revealing the Failure Mechanism of Partially Lithiated Silicon-Dominant Anodes Based on Microscale Silicon Particles. J. Electrochem. Soc. 2021, 168, 080531. [Google Scholar] [CrossRef]
  14. Doyle, M.; Fuller, T.F.; Newman, J. Modeling of Galvanostatic Charge and Discharge of the Lithium/Polymer/Insertion Cell. J. Electrochem. Soc. 1993, 140, 1526–1533. [Google Scholar] [CrossRef]
  15. Fuller, T.F.; Doyle, M.; Newman, J. Relaxation Phenomena in Lithium–Ion–Insertion Cells. J. Electrochem. Soc. 1994, 141, 982–990. [Google Scholar] [CrossRef]
  16. Rheinfeld, A.; Sturm, J.; Noel, A.; Wilhelm, J.; Kriston, A.; Pfrang, A.; Jossen, A. Quasi-Isothermal External Short Circuit Tests Applied to Lithium-Ion Cells: Part II. Modeling and Simulation. J. Electrochem. Soc. 2019, 166, A151–A177. [Google Scholar] [CrossRef]
  17. Dees, D.W.; Battaglia, V.S.; Bélanger, A. Electrochemical modeling of lithium polymer batteries. J. Power Sources 2002, 110, 310–320. [Google Scholar] [CrossRef]
  18. Jiang, Y.; Offer, G.; Jiang, J.; Marinescu, M.; Wang, H. Voltage Hysteresis Model for Silicon Electrodes for Lithium Ion Batteries, Including Multi-Step Phase Transformations, Crystallization and Amorphization. J. Electrochem. Soc. 2020, 167, 130533. [Google Scholar] [CrossRef]
  19. Lory, P.F.; Mathieu, B.; Genies, S.; Reynier, Y.; Boulineau, A.; Hong, W.; Chandesris, M. Probing Silicon Lithiation in Silicon-Carbon Blended Anodes with a Multi-Scale Porous Electrode Model. J. Electrochem. Soc. 2020, 167, 120506. [Google Scholar] [CrossRef]
  20. Swamy, T.; Chiang, Y.M. Electrochemical Charge Transfer Reaction Kinetics at the Silicon-Liquid Electrolyte Interface. J. Electrochem. Soc. 2015, 162, A7129–A7134. [Google Scholar] [CrossRef]
  21. Wang, M.; Xiao, X.; Huang, X. Study of lithium diffusivity in amorphous silicon via finite element analysis. J. Power Sources 2016, 307, 77–85. [Google Scholar] [CrossRef]
  22. Chandrasekaran, R.; Magasinski, A.; Yushin, G.; Fuller, T.F. Analysis of Lithium Insertion/Deinsertion in a Silicon Electrode Particle at Room Temperature. J. Power Sources 2010, 157, A1139. [Google Scholar] [CrossRef]
  23. Chandrasekaran, R.; Fuller, T.F. Analysis of the Lithium-Ion Insertion Silicon Composite Electrode/Separator/Lithium Foil Cell. J. Electrochem. Soc. 2011, 158, A859. [Google Scholar] [CrossRef]
  24. Golmon, S.; Maute, K.; Lee, S.H.; Dunn, M.L. Stress generation in silicon particles during lithium insertion. Appl. Phys. Lett. 2010, 97, 033111. [Google Scholar] [CrossRef]
  25. Wang, M.; Xiao, X. Investigation of the chemo-mechanical coupling in lithiation/delithiation of amorphous Si through simulations of Si thin films and Si nanospheres. J. Power Sources 2016, 326, 365–376. [Google Scholar] [CrossRef]
  26. Wang, M.; Xiao, X.; Huang, X. A multiphysics microstructure-resolved model for silicon anode lithium-ion batteries. J. Power Sources 2017, 348, 66–79. [Google Scholar] [CrossRef]
  27. Dhillon, S.; Hernández, G.; Wagner, N.P.; Svensson, A.M.; Brandell, D. Modelling capacity fade in silicon-graphite composite electrodes for lithium-ion batteries. Electrochim. Acta 2021, 377, 138067. [Google Scholar] [CrossRef]
  28. Dasari, H.; Eisenbraun, E. Predicting Capacity Fade in Silicon Anode-Based Li-Ion Batteries. Energies 2021, 14, 1448. [Google Scholar] [CrossRef]
  29. Lu, B.; Song, Y.; Zhang, Q.; Pan, J.; Cheng, Y.T.; Zhang, J. Voltage hysteresis of lithium ion batteries caused by mechanical stress. Phys. Chem. Chem. Phys. PCCP 2016, 18, 4721–4727. [Google Scholar] [CrossRef]
  30. Chevrier, V.L.; Dahn, J.R. First Principles Model of Amorphous Silicon Lithiation. J. Electrochem. Soc. 2009, 156, A454. [Google Scholar] [CrossRef]
  31. McDowell, M.T.; Lee, S.W.; Harris, J.T.; Korgel, B.A.; Wang, C.; Nix, W.D.; Cui, Y. In situ TEM of two-phase lithiation of amorphous silicon nanospheres. Nano Lett. 2013, 13, 758–764. [Google Scholar] [CrossRef]
  32. Bordes, A.; de Vito, E.; Haon, C.; Boulineau, A.; Montani, A.; Marcus, P. Multiscale Investigation of Silicon Anode Li Insertion Mechanisms by Time-of-Flight Secondary Ion Mass Spectrometer Imaging Performed on an In Situ Focused Ion Beam Cross Section. Chem. Mater. 2016, 28, 1566–1573. [Google Scholar] [CrossRef]
  33. Chockla, A.M.; Harris, J.T.; Akhavan, V.A.; Bogart, T.D.; Holmberg, V.C.; Steinhagen, C.; Mullins, C.B.; Stevenson, K.J.; Korgel, B.A. Silicon nanowire fabric as a lithium ion battery electrode material. J. Am. Chem. Soc. 2011, 133, 20914–20921. [Google Scholar] [CrossRef]
  34. McDowell, M.T.; Cui, Y. Single Nanostructure Electrochemical Devices for Studying Electronic Properties and Structural Changes in Lithiated Si Nanowires. Adv. Energy Mater. 2011, 1, 894–900. [Google Scholar] [CrossRef]
  35. Pollak, E.; Salitra, G.; Baranchugov, V.; Aurbach, D. In Situ Conductivity, Impedance Spectroscopy, and Ex Situ Raman Spectra of Amorphous Silicon during the Insertion/Extraction of Lithium. J. Phys. Chem. C 2007, 111, 11437–11444. [Google Scholar] [CrossRef]
  36. Kim, J.W.; Ryu, J.H.; Lee, K.T.; Oh, S.M. Improvement of silicon powder negative electrodes by copper electroless deposition for lithium secondary batteries. J. Power Sources 2005, 147, 227–233. [Google Scholar] [CrossRef]
  37. Wang, M. Simulation of Amorphous Silicon Anode in Lithium-Ion Batteries. Ph.D. Thesis, Michigan State University, East Lansing, MI, USA, 2017. [Google Scholar]
  38. Bucci, G.; Nadimpalli, S.P.; Sethuraman, V.A.; Bower, A.F.; Guduru, P.R. Measurement and modeling of the mechanical and electrochemical response of amorphous Si thin film electrodes during cyclic lithiation. J. Mech. Phys. Solids 2014, 62, 276–294. [Google Scholar] [CrossRef]
  39. Sivonxay, E.; Aykol, M.; Persson, K.A. The lithiation process and Li diffusion in amorphous SiO2 and Si from first-principles. Electrochim. Acta 2020, 331, 135344. [Google Scholar] [CrossRef]
  40. Dees, D.W.; Gallagher, K.G.; Abraham, D.P.; Jansen, A.N. Electrochemical Modeling the Impedance of a Lithium-Ion Positive Electrode Single Particle. J. Electrochem. Soc. 2013, 160, A478–A486. [Google Scholar] [CrossRef]
  41. Li, J.; Xiao, X.; Yang, F.; Verbrugge, M.W.; Cheng, Y.T. Potentiostatic Intermittent Titration Technique for Electrodes Governed by Diffusion and Interfacial Reaction. J. Phys. Chem. C 2012, 116, 1472–1478. [Google Scholar] [CrossRef]
  42. Sethuraman, V.A.; Srinivasan, V.; Newman, J. Analysis of Electrochemical Lithiation and Delithiation Kinetics in Silicon. J. Electrochem. Soc. 2013, 160, A394–A403. [Google Scholar] [CrossRef]
  43. Guidelli, R.; Compton, R.G.; Felio, J.M.; Gileadi, E.; Lipkowski, J.; Schmickler, W. Defining the transfer coefficient in electrochemistry: An assessment (IUPAC Technical Report). Pure Appl. Chem. 2014, 86, 245–258. [Google Scholar] [CrossRef]
  44. Baggetto, L.; Niessen, R.A.H.; Roozeboom, F.; Notten, P.H.L. High Energy Density All-Solid-State Batteries: A Challenging Concept Towards 3D Integration. Adv. Funct. Mater. 2008, 18, 1057–1066. [Google Scholar] [CrossRef]
  45. Tjandra, R.; Thanagasundram, S.; Tseng, K.J.; Jossen, A. Improved lithium-ion battery model with hysteresis effect. In Proceedings of the 2014 IEEE Transportation Electrification Conference and Expo (ITEC), Dearborn, MI, USA, 15–18 June 2014; IEEE: Piscataway, NJ, USA, 2014; pp. 1–8. [Google Scholar] [CrossRef]
  46. Valøen, L.O.; Reimers, J.N. Transport Properties of LiPF6-Based Li-Ion Battery Electrolytes. J. Electrochem. Soc. 2005, 152, A882–A891. [Google Scholar] [CrossRef]
  47. Marinho, B.; Ghislandi, M.; Tkalya, E.; Koning, C.E.; de With, G. Electrical conductivity of compacts of graphene, multi-wall carbon nanotubes, carbon black, and graphite powder. Powder Technol. 2012, 221, 351–358. [Google Scholar] [CrossRef]
  48. Amin, R.; Ravnsbæk, D.B.; Chiang, Y.M. Characterization of Electronic and Ionic Transport in Li1-xNi0.8Co0.15Al0.05O2 (NCA). J. Electrochem. Soc. 2015, 162, A1163–A1169. [Google Scholar] [CrossRef]
  49. Ashwin, T.R.; McGordon, A.; Widanage, W.D.; Jennings, P.A. Modified electrochemical parameter estimation of NCR18650BD battery using implicit finite volume method. J. Power Sources 2017, 341, 387–395. [Google Scholar] [CrossRef]
  50. Grundmann, M. The Physics of Semiconductors; Springer International Publishing: Cham, Switzerland, 2016. [Google Scholar] [CrossRef]
  51. Pearson, G.L.; Bardeen, J. Electrical Properties of Pure Silicon and Silicon Alloys Containing Boron and Phosphorus. Phys. Rev. 1949, 75, 865–883. [Google Scholar] [CrossRef]
  52. Fan, S.; Plascencia, G.; Utigard, T. High Temperature Electric Conductivity of Pure Silicon. Can. Metall. Q. 2008, 47, 509–512. [Google Scholar] [CrossRef]
  53. Dees, D.W.; Kawauchi, S.; Abraham, D.P.; Prakash, J. Analysis of the Galvanostatic Intermittent Titration Technique (GITT) as applied to a lithium-ion porous electrode. J. Power Sources 2009, 189, 263–268. [Google Scholar] [CrossRef]
  54. Park, J.H.; Yoon, H.; Cho, Y.; Yoo, C.Y. Investigation of Lithium Ion Diffusion of Graphite Anode by the Galvanostatic Intermittent Titration Technique. Materials 2021, 14, 4683. [Google Scholar] [CrossRef]
  55. Tsai, P.C.; Wen, B.; Wolfman, M.; Choe, M.J.; Pan, M.S.; Su, L.; Thornton, K.; Cabana, J.; Chiang, Y.M. Single-particle measurements of electrochemical kinetics in NMC and NCA cathodes for Li-ion batteries. Energy Environ. Sci. 2018, 11, 860–871. [Google Scholar] [CrossRef]
  56. Chan, C.K.; Peng, H.; Liu, G.; McIlwrath, K.; Zhang, X.F.; Huggins, R.A.; Cui, Y. High-performance lithium battery anodes using silicon nanowires. Nat. Nanotechnol. 2008, 3, 31–35. [Google Scholar] [CrossRef] [PubMed]
  57. Pan, K.; Zou, F.; Canova, M.; Zhu, Y.; Kim, J.H. Systematic electrochemical characterizations of Si and SiO anodes for high-capacity Li-Ion batteries. J. Power Sources 2019, 413, 20–28. [Google Scholar] [CrossRef]
  58. Smith, A.J.; Dahn, H.M.; Burns, J.C.; Dahn, J.R. Long-Term Low-Rate Cycling of LiCoO2 /Graphite Li-Ion Cells at 55 C. J. Electrochem. Soc. 2012, 159, A705–A710. [Google Scholar] [CrossRef]
  59. Dahn, H.M.; Smith, A.J.; Burns, J.C.; Stevens, D.A.; Dahn, J.R. User-Friendly Differential Voltage Analysis Freeware for the Analysis of Degradation Mechanisms in Li-Ion Batteries. J. Electrochem. Soc. 2012, 159, A1405–A1409. [Google Scholar] [CrossRef]
  60. Xie, W.; Yang, S. Charging Optimization of Lithium-Ion Batteries Based on Charge Transfer Limitation and Mass Transport Limitation. J. Electrochem. Soc. 2023, 170, 010506. [Google Scholar] [CrossRef]
  61. Li, J.; Dahn, J.R. An In Situ X-Ray Diffraction Study of the Reaction of Li with Crystalline Si. J. Power Sources 2007, 154, A156. [Google Scholar] [CrossRef]
  62. Graf, M.; Berg, C.; Bernhard, R.; Haufe, S.; Pfeiffer, J.; Gasteiger, H.A. Effect and Progress of the Amorphization Process for Microscale Silicon Particles under Partial Lithiation as Active Material in Lithium-Ion Batteries. J. Electrochem. Soc. 2022, 169, 020536. [Google Scholar] [CrossRef]
  63. Nitta, N.; Wu, F.; Lee, J.T.; Yushin, G. Li-ion battery materials: Present and future. Mater. Today 2015, 18, 252–264. [Google Scholar] [CrossRef]
  64. Landesfeind, J.; Hattendorff, J.; Ehrl, A.; Wall, W.A.; Gasteiger, H.A. Tortuosity Determination of Battery Electrodes and Separators by Impedance Spectroscopy. J. Electrochem. Soc. 2016, 163, A1372–A1387. [Google Scholar] [CrossRef]
  65. Habedank, J.B.; Kraft, L.; Rheinfeld, A.; Krezdorn, C.; Jossen, A.; Zaeh, M.F. Increasing the Discharge Rate Capability of Lithium-Ion Cells with Laser-Structured Graphite Anodes: Modeling and Simulation. J. Electrochem. Soc. 2018, 165, A1563–A1573. [Google Scholar] [CrossRef]
Figure 2. Approximation of the quasi open-circuit potential (qOCP) under constant current charge at C / 50 and 25 C . Differential voltage analysis (c) was used to reconstruct the measured qOCP vs. full-cell SoC (a) under charge of the full cell (see NCA + Si (FC)) via the (de)lithiation paths of the respective half cells (see NCA (HC) and Si (HC)). The approximation errors vs. SoC as well as the RMSE of the qOCP are shown in subplot (b)).
Batteries 09 00558 g002
Figure 3. quasi open-circuit potential (qOCP) data (dashed lines) and pulsed open-circuit potential (pOCP) data (solid lines) for a current rate of C / 50 (black and gray) as well as C / 10 (red). The relaxed potentials of the 2 h open-circuit phases of the pOCP test were interpolated and are displayed as a gray/red area, indicating the voltage hysteresis effect between charging and discharging. The inset shows one exemplary open-circuit phase in more detail. The data are plotted as a function of the normalized charge capacity of the respective test. The tests were conducted at 25 C .
Batteries 09 00558 g003
Figure 4. Full-cell potentials during the two different fitting procedures compared to measurement data. “No fitting” refers to the initial parametrization taken from literature, “ c s , max fitting” is an intermediate step, and “k fitting” refers to the final parametrization. Data are plotted as a function of the (dis)charge capacity normalized to the capacity during a C / 50 or C / 10 charge for both, the measurement (black) and model (colored), individually. Only CC phases are plotted, CV phases are not shown. (a) shows the improvement due to the fitting of c s , max at C / 50 , and (b) shows the improvement due to the fitting of k at 1 C . The RMSE is that between simulation and measurement and is color-coded according to the legend.
Batteries 09 00558 g004
Figure 5. Full cell potentials as validation data for the final parametrization after fitting using C-rates of C / 10 (a), C / 2 (b), and 2 C (c). Color-coding and representation identical to Figure 4.
Batteries 09 00558 g005
Figure 6. Rate capability of measurements using T-cells (black) and simulation results (red) for CC (dis)charge tests at C-rates of C / 10 , C / 5 , C / 3 , C / 2 , 1 C , 2 C , 3 C , 5 C , and 10 C . The (dis)charge capacity of the CC steps is normalized to the capacity during a C / 10 CC charge for both, the measurements and the model, individually. The test was conducted between 2.8 V and 4.2 V at a constant temperature of 25 C .
Batteries 09 00558 g006
Table 1. Overview of selected slicon models from literature.
Ref.Focal AreaSiliconDimensionality
[18]Voltage hysteresis via asymmetric reactionspure0D model
[19]Current distribution & inhomogeneous lithationcompositep2D
[20]Kinetic limitations & rate capabilitypure0D impedance model
[21]Phase boundaries & diffusivitypure2D SPM
[22]Volume change & (de)insertion processdominant1D SPM
[23]Volume change & electrolyte displacementdominantp2D
[24]Mechanical stress & stress-induced diffusionpure1D SPM
[25]Mechanical stress & geometry dependencydominant1D thin-film & SPM
[26]Coupling of electrochemistry and mechanicspure2D MSM a
[27,28]Capacity fade via SEI interactioncomposite1D model
[29]Voltage hysteresis via mechanical stresspure0D model
[30]First principles model of silicon lithiationpure0D DFT calculation
This workParametrization & validation of an electrode in a full-cell setupdominantp2D
p2D = pseudo two-dimendional model; SPM = single-particle model; MSM = microstructure model; SEI = solid electrolyte interphase; DFT = density functional theory; a microstructure of a single thin-film and a single nanowire.
Table 2. Overview of silicon material parameters as can be found in the literature. The selected parameters are those model parameters that could not be retrieved otherwise.
ParameterUnitValue RangeValue Selected for This WorkReferences
Electrical conductivity S   m 1 0.2 × 10⁻⁹to5 × 10333 [23,33,34,35,36,37]
Solid-phase diffusivity m 2 s 1 1 × 10⁻²⁰to1 × 10−11 a2 × 10−15 [21,38,39]
Exchange current density A   m 2 1 × 10⁻³to1 × 1052.2 b [19,20,22,38,40,41]
Charge transfer coefficient0.2to3.420.5 [22,42,43]
a value might be even higher along defects [32]; b after fitting procedure, more information can be found below.
Table 3. Degree of lithiation and corresponding equilibrium potential at 0% and 100% SoC from Figure 1. The values are given for the full-cell charge (cha) and discharge (dis) as well as the averaged (ave) value at the respective SoC.
SoCAnodeCathode
DoL E eq DoL E eq
in –in Vin –in V
0% χ 0 , Si = 0.0396 0.7531 χ 0 , N C A = 0.7954 3.5518dis
0.7267 3.5635cha
0.7399 3.5577ave
100% χ 1 , Si = 0.3068 0.1932 χ 1 , N C A = 0.1396 4.3797dis
0.1710 4.3764cha
0.1821 4.3781ave
Disclaimer/Publisher’s Note: The statements, opinions and data contained in all publications are solely those of the individual author(s) and contributor(s) and not of MDPI and/or the editor(s). MDPI and/or the editor(s) disclaim responsibility for any injury to people or property resulting from any ideas, methods, instructions or products referred to in the content.

