Article

Performance Analysis of the Liquid Cooling System for Lithium-Ion Batteries According to Cooling Plate Parameters

1
Department of Mechanical Engineering, Graduate School of Chosun University, 309 Pilmundaero, Gwangju 61452, Republic of Korea
2
Department of Mechanical Engineering, Chosun University, 309 Pilmundaero, Gwangju 61452, Republic of Korea
3
Korea Automotive Technology Institute, 303 Pungse-ro, Cheonan 31214, Republic of Korea
*
Author to whom correspondence should be addressed.
Batteries 2023, 9(11), 538; https://doi.org/10.3390/batteries9110538
Submission received: 18 September 2023 / Revised: 25 October 2023 / Accepted: 25 October 2023 / Published: 30 October 2023
(This article belongs to the Special Issue Thermal Management System for Lithium-Ion Batteries)

Abstract

:
In this study, the effects of battery thermal management (BTM), pumping power, and heat transfer rate were compared and analyzed under different operating conditions and cooling configurations for the liquid cooling plate of a lithium-ion battery. The results elucidated that when the flow rate in the cooling plate increased from 2 to 6 L/min, the average temperature of the battery module decreased from 53.8 to 50.7 °C, but the pumping power increased from 0.036 to 0.808 W. In addition, an increase in the width of the cooling channel and number of channels resulted in a decrease in the average temperature of the battery module and a reduction in the pumping power. The most influential variable for the temperature control of the battery was an increase in the flow rate. In addition, according to the results of the orthogonal analysis, an increase in the number of cooling plate channels resulted in the best cooling performance and reduced pumping power. Based on this, a cooling plate with six channels was applied to both the top and bottom parts, and the top and bottom cooling showed sufficient cooling performance in maintaining the average temperature of the battery module below 45 °C.

Graphical Abstract

1. Introduction

Massive consumption of fossil fuels depletes non-environmentally friendly energy sources and exposes the earth to severe problems, including climate change and global warming [1]. Therefore, as concerns about environmental issues and resource depletion have grown worldwide, considerable focus is placed on eco-friendly energy sources for replacing fossil fuels. In light of the current situation, interest in electric vehicles that do not release pollutants like carbon dioxide and nitrogen oxide has increased in many nations, even industrialized nations. Due to its high energy density, extended lifespan, environmental friendliness, and cost-effectiveness, lithium-ion batteries (LIBs) have become popular in electric cars (EVs) and hybrid electric vehicles (HEVs) [2,3]. An important issue to be solved for the stable operation of LIBs is the excessive heat generation owing to rapid charging and discharging. An increase in the generated heat of the battery raises the battery temperature, which boosts the production of more battery heat. Generally, the safe operating temperature of a battery pack is a maximum temperature of 40 °C and a temperature difference between batteries of 5 °C or less. For safe and normal battery operation, maintaining these temperatures below the safe operating temperatures is important [4]. Excessive heat generation in battery packs causes stability problems and decreases the overall performance and lifespan of the battery system. In particular, problems such as the formation of SEI (Solid Electrolyte Interphase) inside the battery occur, gradually reducing battery capacity [5]. Thus, a more efficient battery thermal management system (BTMS) is needed [6,7,8]. Especially as the capacity and current of batteries have rapidly increased, battery safety has become a major concern.
There are three different categories of cooling systems utilized in battery thermal management systems: air cooling, liquid cooling, and phase change (phase change material (PCM) and heat pipe) cooling. First, the air cooling method has a disadvantage because air has a lower heat capacity and thermal conductivity than liquids. However, it was widely used in early BTMS owing to the simplicity of its structure, its light weight, and its low cost in the cycle configuration [9,10]. It was confirmed by Fan et al. [11] and Yu et al. [12] that an air cooling system employing the 18650 battery maintains the temperature of the battery below the safe operating temperature at 0.5 and 1 C-rate and is an appropriate BTMS at a low C-rate. Zhou et al. [13] conducted a study using an air distribution pipe model in an air cooled system. At a rate of 3 C-rate or higher, the air cooling system could maintain the battery below the safe operating temperature. However, as the C-rate increased, the pumping power increased rapidly to control the temperature of the battery. As a result, the air cooling system is not practical for high C-rates because the rapid rise in pumping power impacts the power capacity of the electric vehicle negatively.
Due to its large heat capacity and thermal conductivity, the liquid cooling system is more effective than the air cooling technique. It also has benefits like high-temperature uniformity, high efficiency, and economic viability [14]. The liquid cooling system is divided into a direct cooling method, in which batteries are cooled by directly contacted thermal fluid and an indirect cooling method, in which batteries are indirectly cooled by a cooling plate cooled by thermal fluid. The liquid cooling system is classified into two types: a direct cooling method, where batteries are cooled by thermal fluid that comes into direct contact with them, and an indirect cooling method, where batteries are cooled indirectly by thermal fluid through cooling plates. By reducing contact heat resistance, the direct cooling technique maximizes battery cooling performance [15]. Liu et al. [16] evaluated the thermal behavior of dynamically cycling batteries exposed to static and flowing mineral oil (MO) in a series of tests using oil-immersed battery cooling systems. Even at a 4 C-rate discharge, the battery temperature can be kept below 35 °C at a flow rate of 5 mL/min below 30 °C when the flow rate exceeds 15 mL/min. Kim et al. [17] examined the cooling performance in relation to the heat transfer fluid (HTF), the number of battery cooling block ports, and the header width, and optimized the model by using the liquid immersion cooling method on a 1S16P battery module. The cooling model performed best when there were three ports and a 5 mm header width, which was consistent with low-pressure drop and good cooling performance. When the flow rate of R134a was 3 and 5 L/min, the maximum temperature of the battery and the temperature difference between the batteries were, respectively, 30.5 °C and 4.91 °C and 28.7 °C and 3.28 °C at 25 °C outside settings. The results reached were appropriate for preserving a consistent battery temperature range. However, immersion cooling is not widely used commercially owing to its fluid cost, weight, and performance uncertainties [18].
Despite having less cooling effectiveness than the direct cooling method, indirect cooling has been the subject of several studies since it is an effective method when considering factors like electrical stability, fluid cost, weight, etc. The importance of a range of cold plate channel sizes and designs in battery cooling was numerically supported by Pulugundla et al. [19]. Lai et al. [20] and Zhou et al. [21] applied structures such as a half helical duct and thermally conductive structure (TCS) to the outside of the cell in the battery liquid cooling system. These structures improve the cooling performance by increasing the contact area between the cells and the cooling device. It was confirmed that the half helical duct and TCS kept the battery below the safe operating temperature at 5 C-rate with high heat generation. Zhao et al. [22] and Qian et al. [23] studied improving cooling performance using a liquid cooling system. Their results revealed that increasing the flow rate reduced the temperature of the battery module effectively and improved the temperature uniformity.
The PCM cooling method can maintain the temperature in the battery and release it as needed while using little to no fan power. The benefits of adopting this strategy approach are more obvious when the ambient temperature is low, and the energy utilization efficiency can be significantly increased [4]. However, when the PCM completely changes its phase, achieving accurate control of the battery temperature is difficult. Accordingly, cooling using PCMs requires additional research and is studied along with other cooling methods. Lv et al. [24] employed liquid cooling and PCM to manage the heat generation of a 18650 battery. They reported that at a 2 C-rate, the composite system reduced the maximum temperature of the battery by 15 °C more than the single system. Wu et al. [25] conducted an experimental study that combined a PCM, a heat pipe, and liquid cooling for a 18650 battery. As the discharge cycle of the battery increased at a 3 C-rate, the composite system reduced the maximum temperature by 28 °C or more than the single system. Accordingly, it was confirmed that the combined PCM and liquid cooling system is an appropriate BTMS to maintain the battery below a safe operating temperature. The liquid cooling system is a basic component of battery thermal management in the combined system.
The liquid cooling system can manage the produced heat of the battery at a high C-rate, and it is a basic component for maintaining high efficiency even in a phase-change cooling system. Currently, cylindrical, prismatic, and pouch-type batteries are used in EVs. In particular, the liquid cooling BTMS for a cylindrical battery has a curved surface compared with prismatic pouch-type batteries; thus, it is more difficult to mount a cooling plate on the surface. However, cylindrical batteries have the advantages of better consistency, more material processing, and longer lifetimes, and are more adaptable to situations where multiple batteries must be combined in series and parallel [26]. Much information is available on the cooling capacity according to the structure of the cooling plate in a rectangular battery module. However, due to the structural characteristics of cylindrical batteries, many studies have applied cooling plates to the sides, but few studies have applied cooling plates to the top and bottom. Using a cold plate to the side is complicated because the cold plate must be designed to contact between battery cells. Therefore, in this study, a numerical analysis of cooling performance and pump output was performed to apply cooling plates to the top and bottom of a cylindrical battery. In the 24S16P module structure, the heating characteristics of the 21700 cylindrical battery module and the heating environment of the battery were numerically analyzed. In addition, to effectively control the heating of the cylindrical battery module, the average temperature, cooling capacity, and pumping power of the battery module according to changes in the structure of the cooling plate and operating conditions were compared and analyzed. Additionally, analysis findings for the cooling system, which maintained a temperature that could guarantee stable battery performance, were also provided. The obtained results will help improve the cooling performance of a cylindrical battery using liquid cooling and optimize the parameters of the cooling system. In addition, it can enhance the safety and performance of EVs through battery temperature management.

2. Methods and Simulation

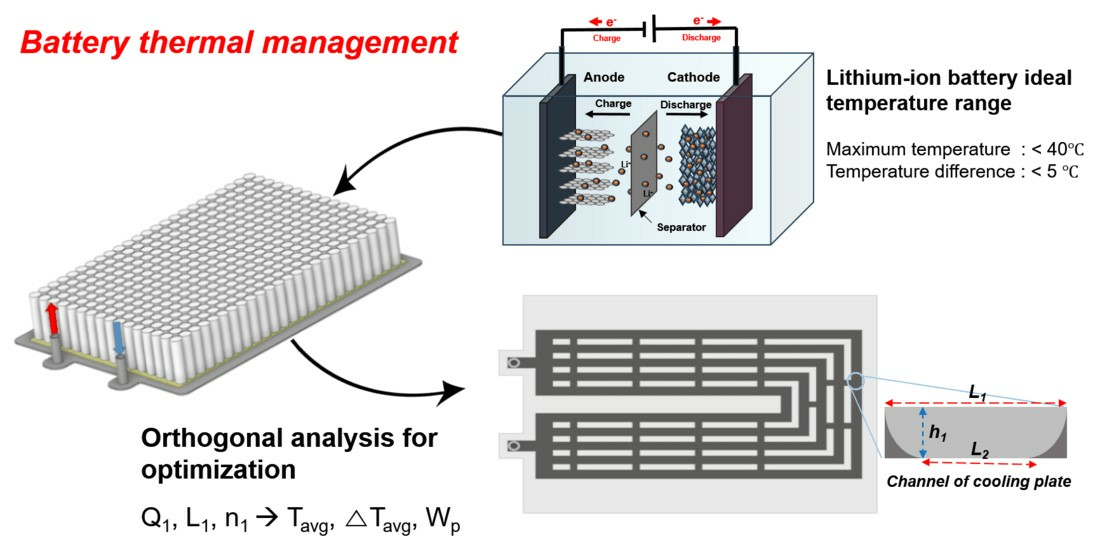
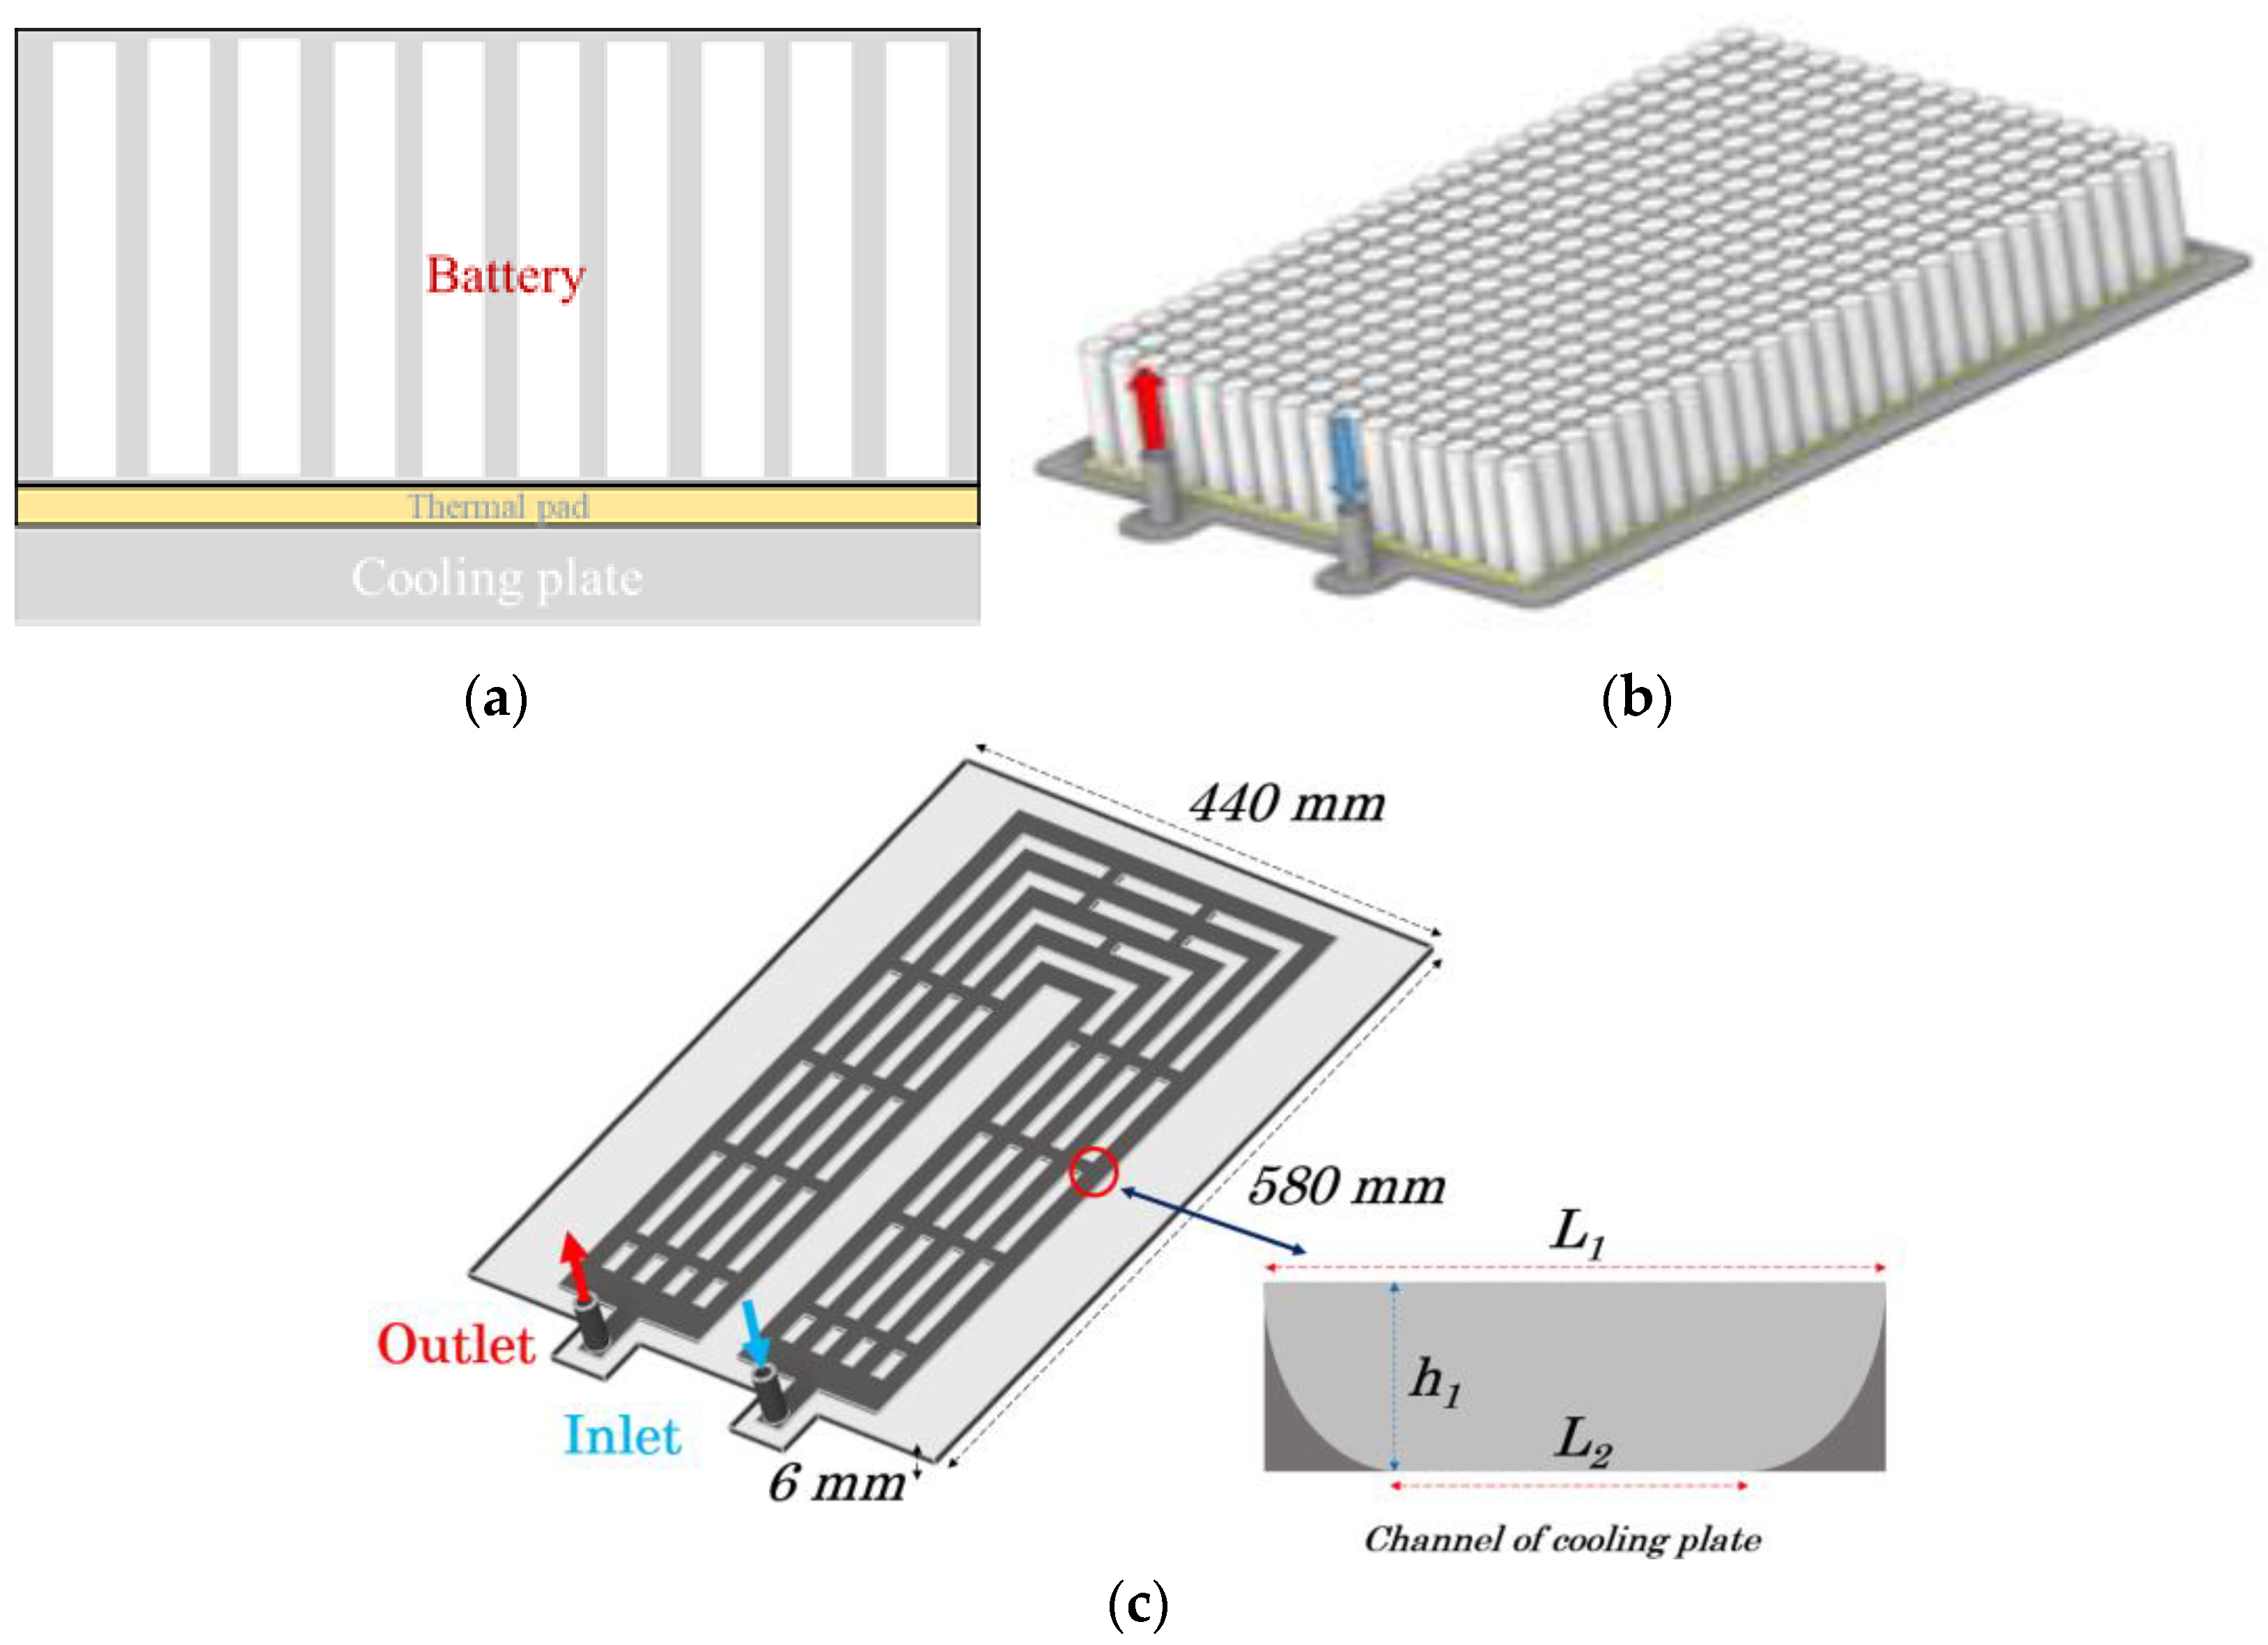
2.1. Simulation Model

The cooling performance of the liquid cooling system using a 21700 cylindrical battery cell was investigated using ANSYS Fluent 2022 R2. The battery model in this study used the battery parameters from the anode and the cathode material of Li(Ni0.8Co0.1Mn0.1)O2, and the battery specifications used in the simulation are presented in Table 1. A schematic and 3D model of the battery module and BTMS used in the simulation are shown in Figure 1 [27]. As shown in Figure 1a, to uniformly dissipate heat from the battery, a thermal pad was positioned between the battery module and cooling plate. A cooling plate was placed at the bottom to control heat generation from the battery. In Figure 1b, the battery module is depicted. The 384 cylindrical battery cells were composed of 24S16P. Figure 1c depicts the internal shape of the cooling plate, which was composed of five U-type channels with dimensions of 440 × 580 × 6 mm3. The cooling water flow path of the cooling plate had a U-shape, and the cooling water entered the inlet branches and flowed in the cooling plate. The gap between the channels was maintained at 10 mm. In this study, the widths of the channels are expressed as L1 and L2, and the height is expressed as h1. Water is the HTF that circulates inside the cooling plate to cool the battery. The correlations of the thermal properties of the water are shown in Table 2.

2.2. Governing Equations

This study was carried out under the following presumptions: first, the fluid flow was a single-phase flow; second, the flow field was completely filled with HTF; third, thermal resistance and radiation emission were neglected; fourth, the HTF was an incompressible fluid. The mass, energy, and momentum conservation equations were used to analyze a cylindrical battery cooling system. The turbulence model of the realizable k–ε model was used because it can be applied to a wide flow range and is highly accurate in stream and heat transfer analysis [29]. It is the same when cold plates are used at the top and bottom of the battery module.
Bernari et al. [28] calculated the heating value of the battery. The proposed internal resistance was used to estimate the heat generation quantity using the heat generation correlation Equation (1).
Q g e n = Q i r + Q r e = I 2 R I T c e l l U O C V T ,
where Q g e n is the total heating value generated by the battery cell, and Q i r and Q r e   are the irreversible and reversible heats generated during charging and discharging, respectively. I and R are the charging/discharging current and resistance, T is the temperature of the battery cell, and U O C V / T is the temperature coefficient of open-circuit voltage. The equation used by Lai et al. [13] for the temperature coefficient of the open-circuit voltage by Lai et al. [20] is given in Equation (2).
U O C V T = 0.355 + 2.154 × 2.154 × S O C 2.869 × S O C 2 + 1.028 × S O C 3 ,
where S O C represents the state of charge of the battery.
Battery heat generation was calculated by averaging the heat generated during the discharge process. The pumping power used for liquid cooling was calculated using Equation (3).
P p u m p = Δ P Q w ,
where P p u m p is the pumping power, Δ P is the pressure drop between the inlet and outlet of the cooling plate, and Q w is the flow rate of HTF.

2.3. Initial and Boundary Conditions

Table 3 shows the test conditions for the simulation. The ambient and initial temperature of the battery module and HTF was set to 25 °C. The number of channels was determined considering the size of the cooling plate, and the channel width was determined by considering the ratio of the top and bottom widths based on standard conditions. The standard condition is marked with a (*) based on the cooling plate of Kim [27]. To investigate the influence on the flow rate (Q1), channel width (L1/L2), and number of channels (n1), the average temperature of the battery module and the average temperature difference between the upper and lower parts were calculated and compared. To examine the cooling performance of the BTMS, the pressure drops at the inlet and outlet of the cooling plate as well as the pumping power were calculated.

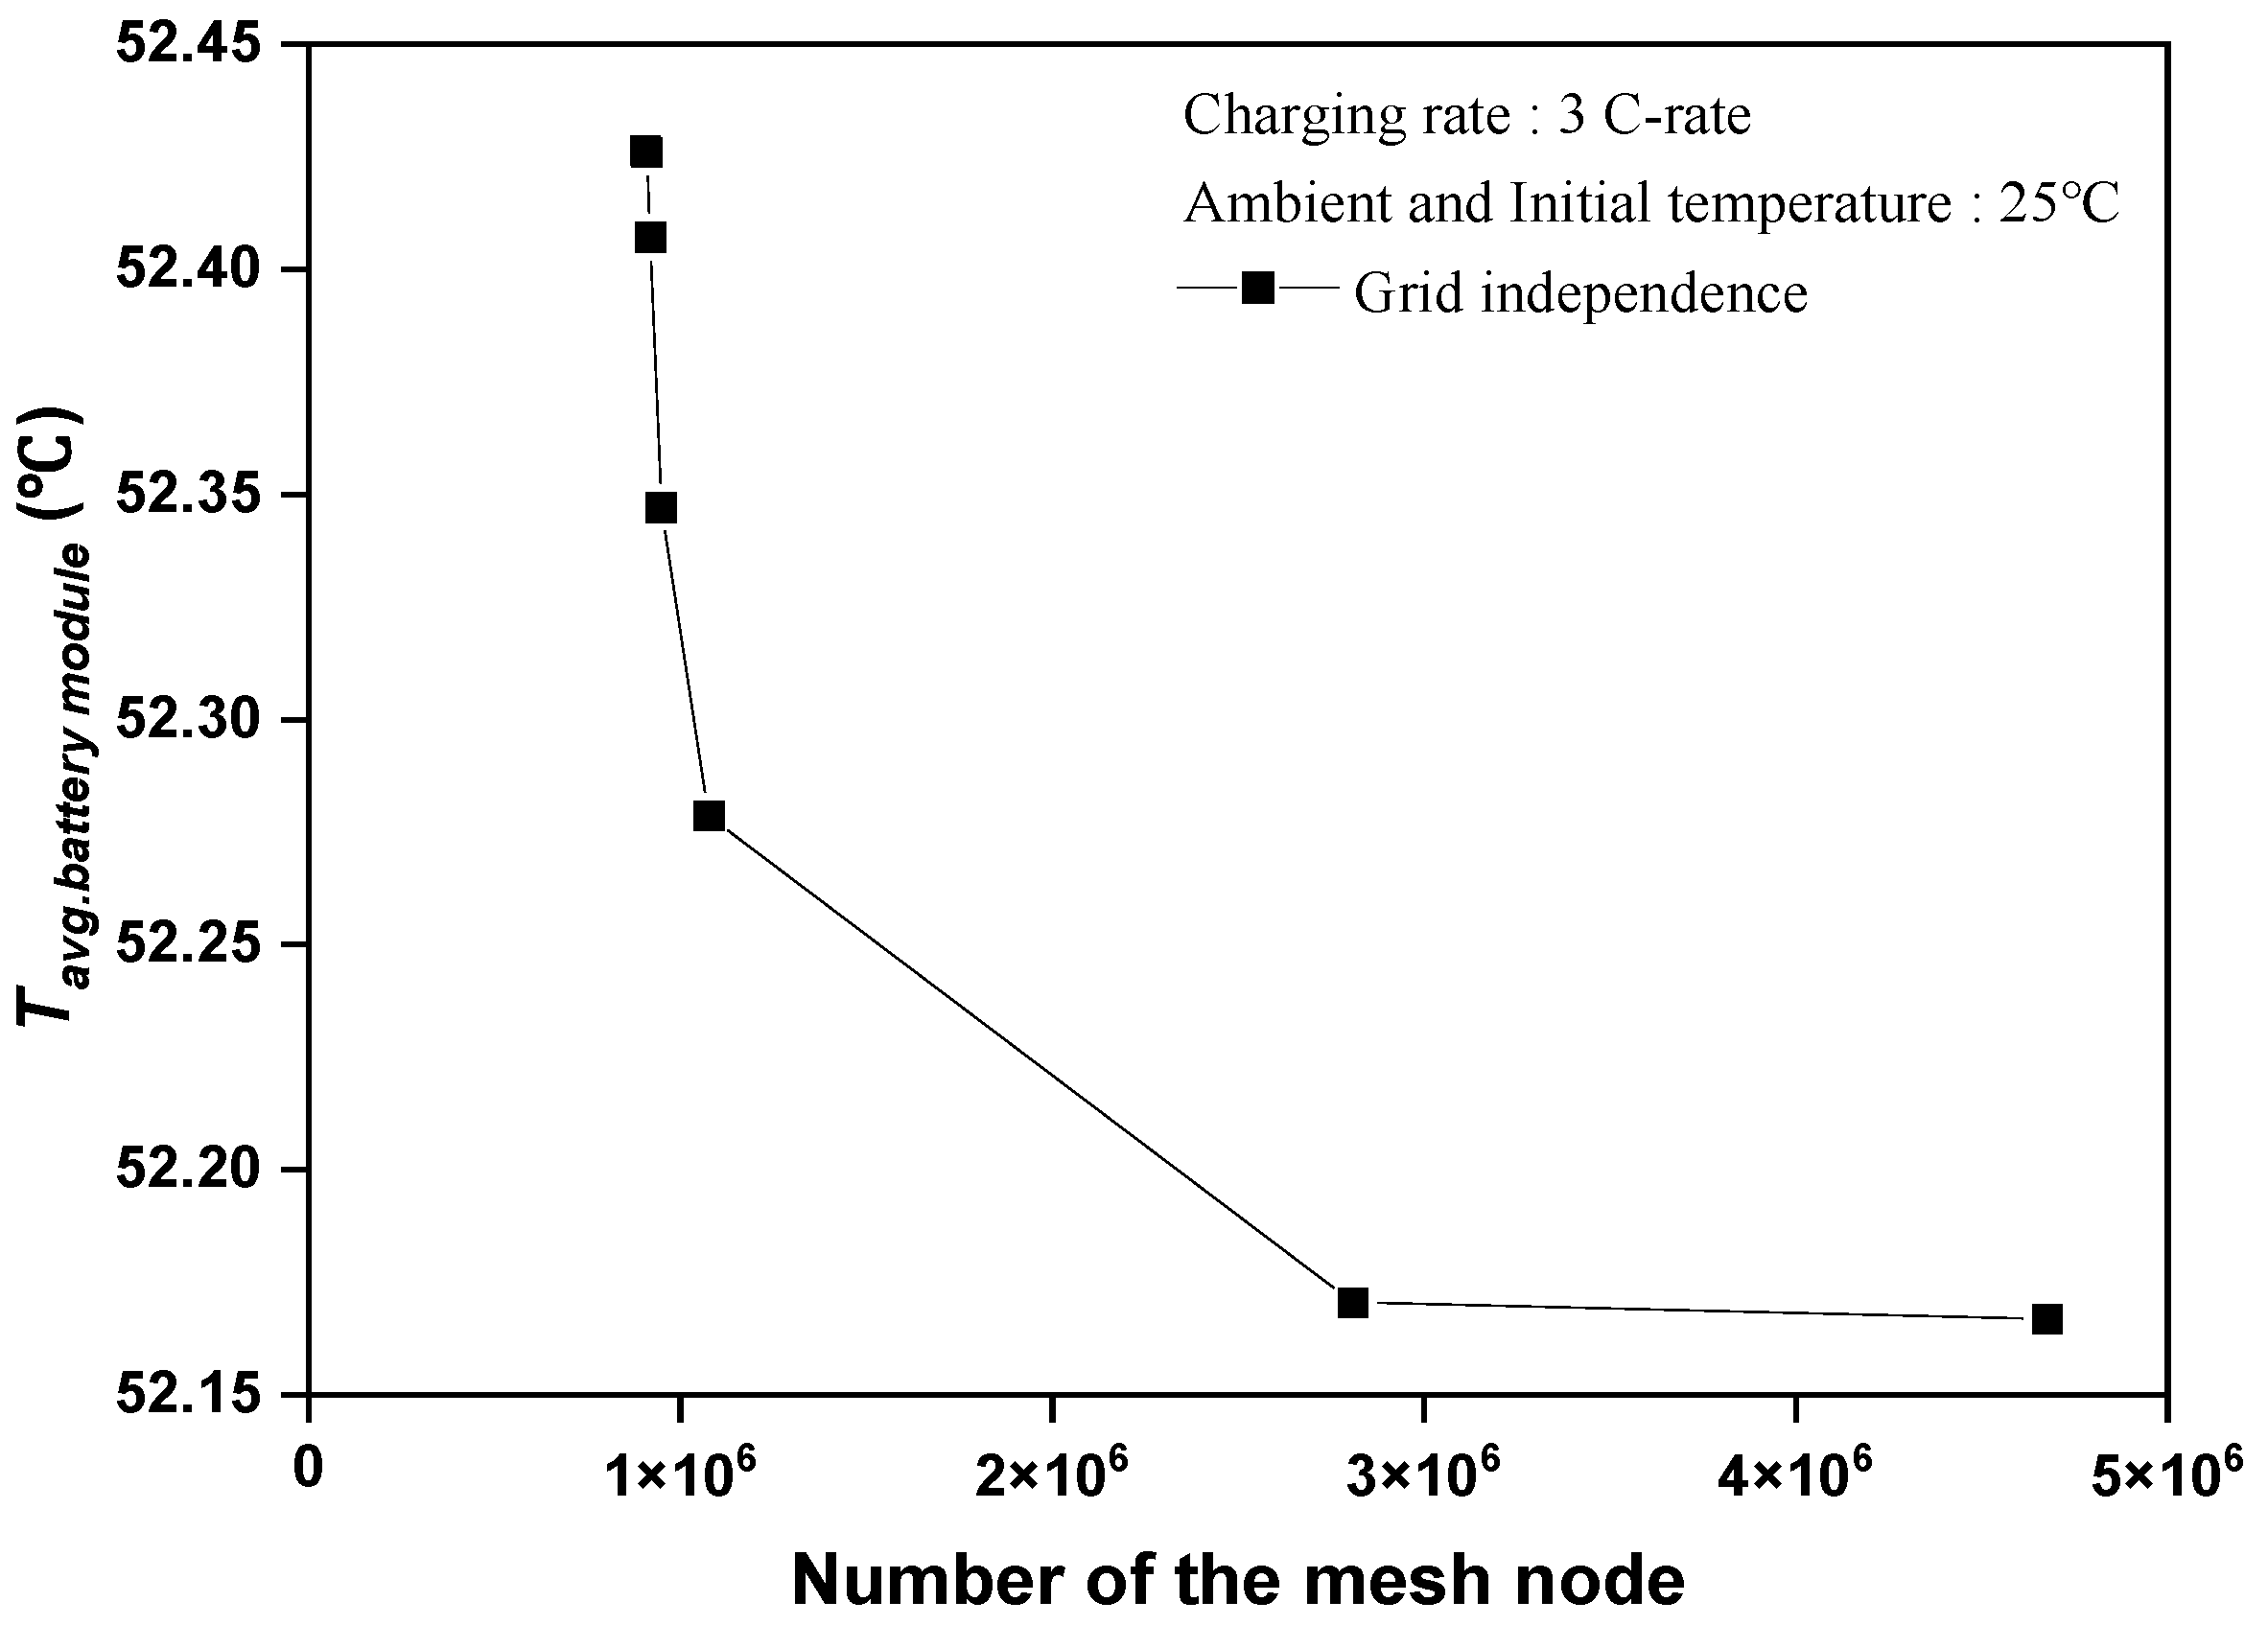
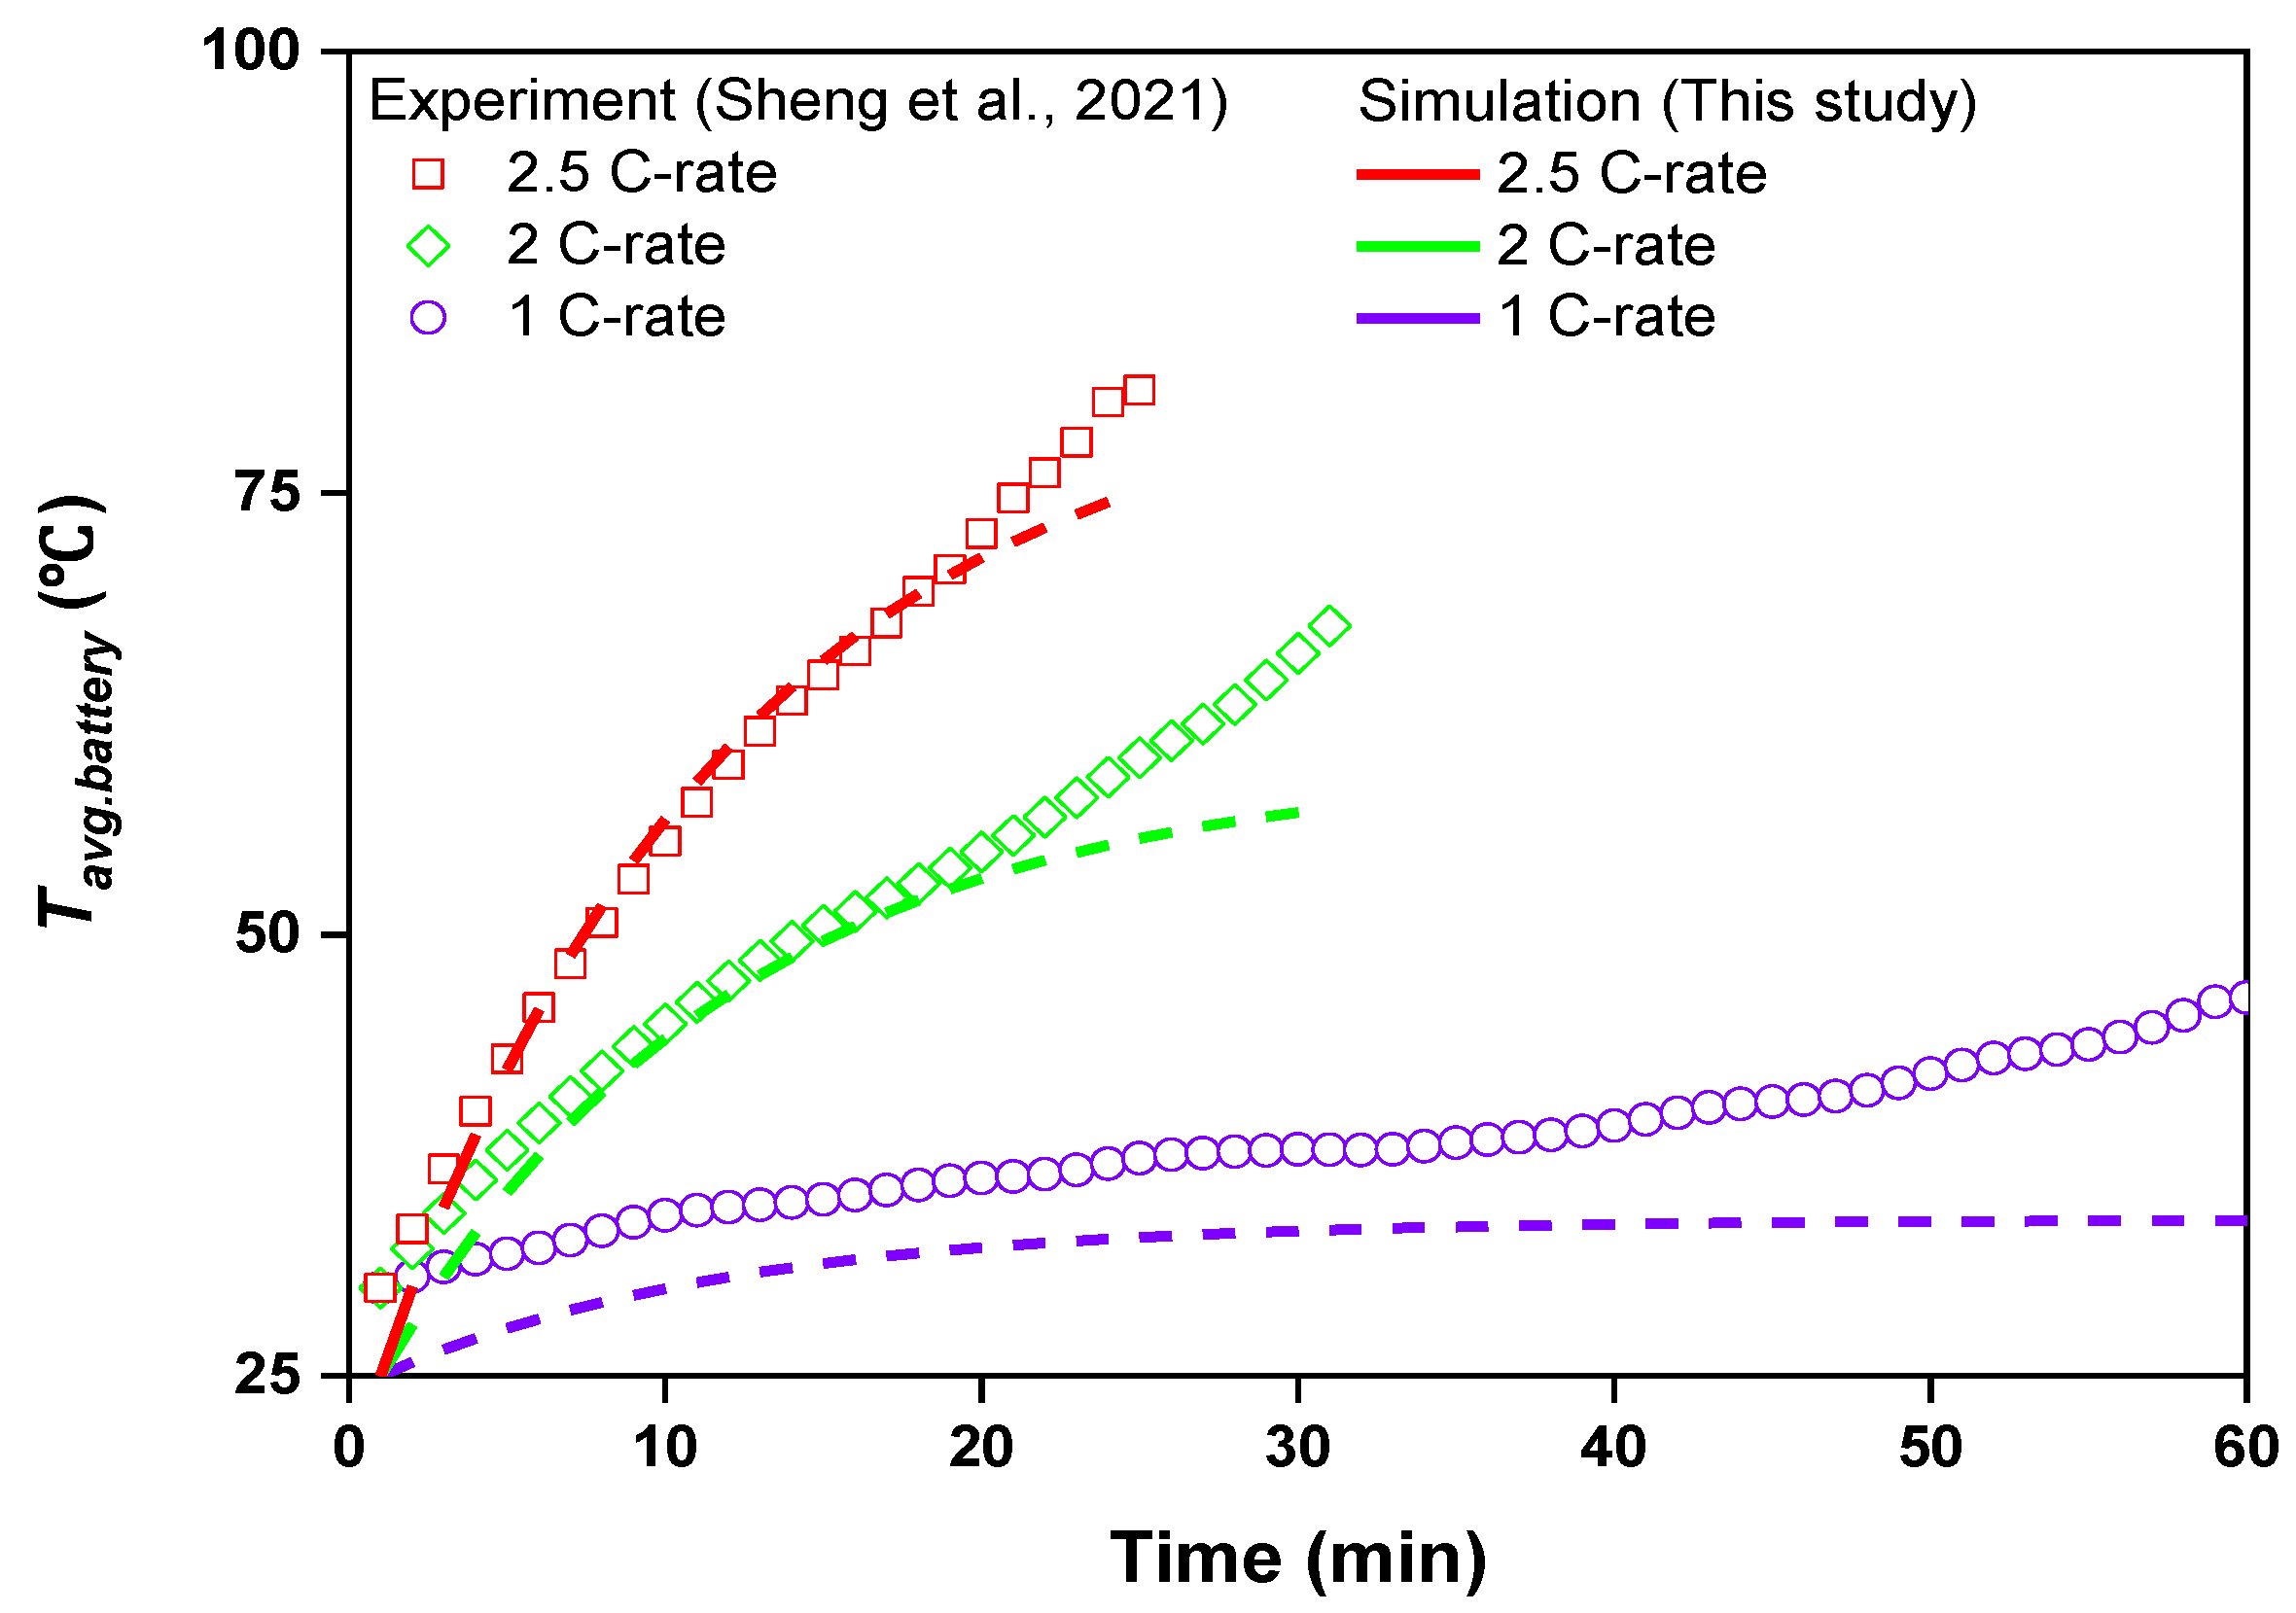
2.4. Validation of Simulation Model

In this study, the open-circuit voltage of the temperature coefficient and internal resistance of a 21700 cylindrical battery was used to predict the heat generated from the cylindrical battery, and a heating value prediction model for the cylindrical battery was developed. The results were also contrasted with those of Sheng et al. [30], who tested the heating value of 21700 cylindrical battery cells at rates of 1–2.5 C. Based on this, the heating value of the cylindrical battery cell was predicted at a rate of 3 C-rate conditions, and the cooling performance was predicted according to the change in the cooling plate structure and operating conditions during the cylindrical battery module cooling.
Because computational fluid dynamics analyze physical phenomena using a divided grid, the number of grids dramatically influences the overall analysis results. Therefore, ensuring the reliability of the analysis results through a grid-independent test based on the number of grids is necessary. Figure 2 shows the average temperature of the battery module for each mesh node under the heating value condition of the 3 C-rate. As the number of mesh nodes increased, the temperature of the battery module decreased, and it was 52.17 °C when the number of mesh nodes reached 2,809,041. As mesh nodes increased to 4,675,798, it was 52.17 °C, and the temperature did not change significantly as the number of mesh nodes increased. Therefore, in this study, 2,809,041 mesh nodes were used to analyze the battery modules.
Figure 3 shows a comparison of the results of the heating value prediction model of this study with the experimental results of the 1–2.5 C rate of Sheng et al. [30]. The change over time in the average temperature of the battery predicted in the simulation exhibited a trend similar to that of the experimental values at all C-rates. The average battery temperature, as reported by Sheng et al. [30] under the 1 C-rate discharging process, was 46.7 °C, and the predicted temperature of this study was 34.8 °C. The maximum and average error rates were 27% and 15%, respectively. The battery’s average temperature during the 2 C-rate discharging condition was 67.5 °C and 57.1 °C, respectively; the maximum error rate was 15%, and the average error rate was 5.6%. The average temperature of the battery at 2.5 C-rate was 80.8 and 75.1 °C, respectively. Compared to high C-rate discharge conditions, low-rate discharge conditions require longer discharge times and are more affected by the charging environment. In the case of low-rate discharge conditions, because the discharge time is extended, the total heat loss of the cell during discharge is more significant than that under high-rate discharge conditions. Therefore, under low-rate discharge conditions, the uncertainty due to heat loss is considerable, which causes greater errors in experimental and analysis results. Additionally, the initial temperature is 30 °C in the experiment of Sheng et al. [29], but it is 25 °C in this study; therefore, it is 5 °C higher than the initial temperature of this study. It affected the battery heat generation and loss, leading to a rather significant inaccuracy. The simulation error, however, is within the reliable error range and is a maximum of 9.8%.

3. Results and Discussion

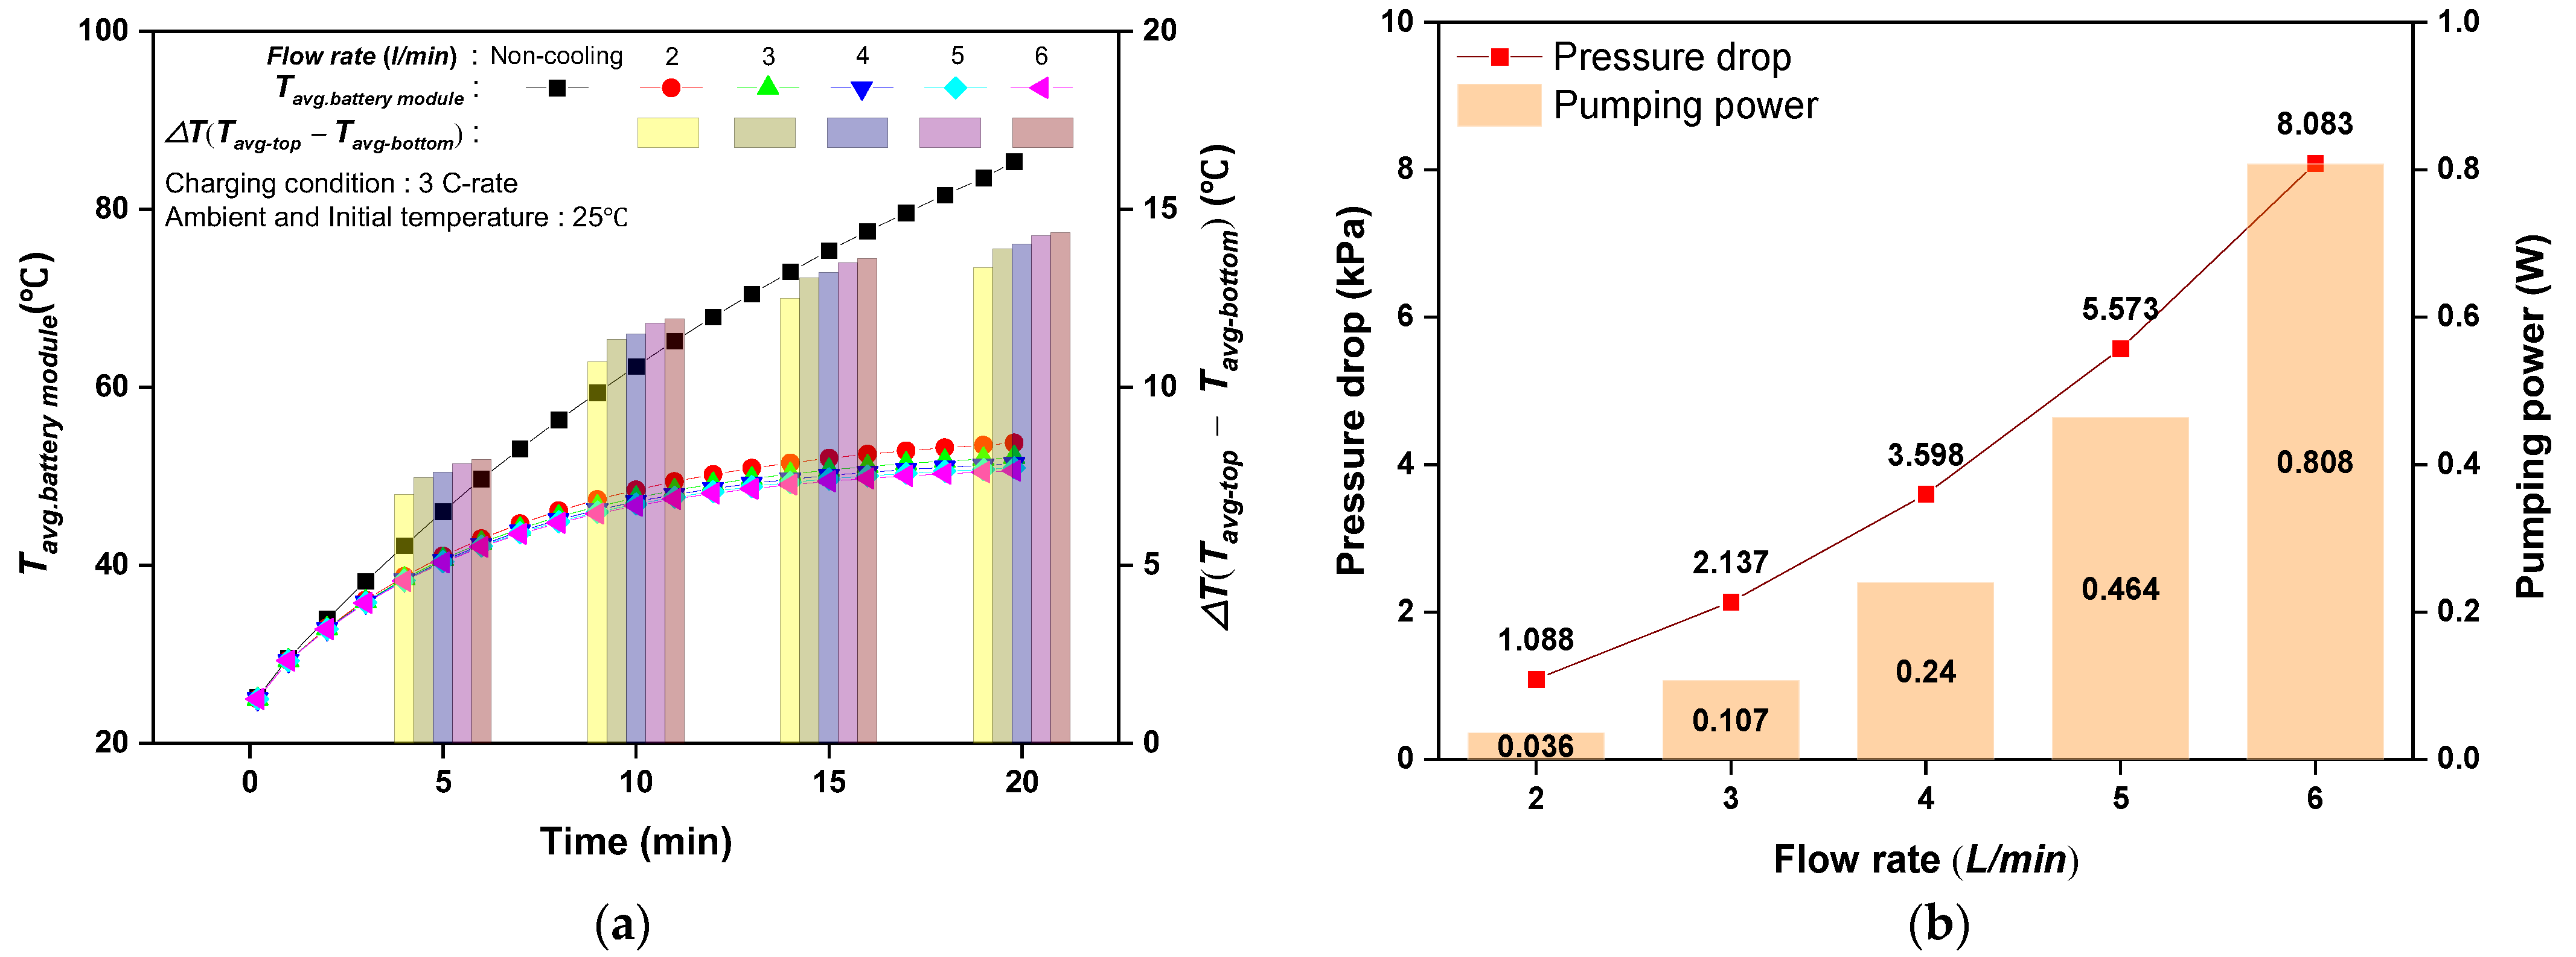
3.1. Effect of the Inlet Flow Rate of Cooling Fluid

Figure 4 depicts the impact on the cylindrical battery’s cooling performance at a flow rate of 2 to 6 L per minute under a three-cycle discharging process. After 3 C-rate discharges, the battery module’s average temperature was 85.4 °C; when the flow rate increased, this temperature reduced to 79.4 °C on average. The average battery temperature decreased by 3.12 °C, from 53.8 °C to 50.7 °C, as the flow rate rose from 2 to 6 L/min. The average temperature difference between the top and bottom of the battery increased with the flow rate; however, this difference was small. Figure 4b depicts the pressure drop and pumping power of the cylindrical battery cooling according to the flow rate. The flow rate increases with an increase in the pressure drop. The pressure drop increased from 1.09 to 8.08 kPa when the flow rate was raised from 2 to 6 L/min. As the flow rate rose, the pressure drop rose. Accordingly, the pumping power increased from 0.04 to 0.81 W. The pumping power increased 22 times when the flow rate rose from 2 to 6 L/min, although the battery temperature drop was just 3.1 °C. Raising the pump power for cooling in an electric vehicle can reduce the driving range due to increased electric power consumption. Despite a higher flow rate, battery cooling capability has a limit. Because of the cylindrical shape of the 21700 battery, installing the cooling plate at the bottom does not provide a sufficient heat transfer area for cooling. Thus, a wide heat transfer area needs to be designed to manage local excessive heat when a battery is used in a fast-charging and discharging environment.

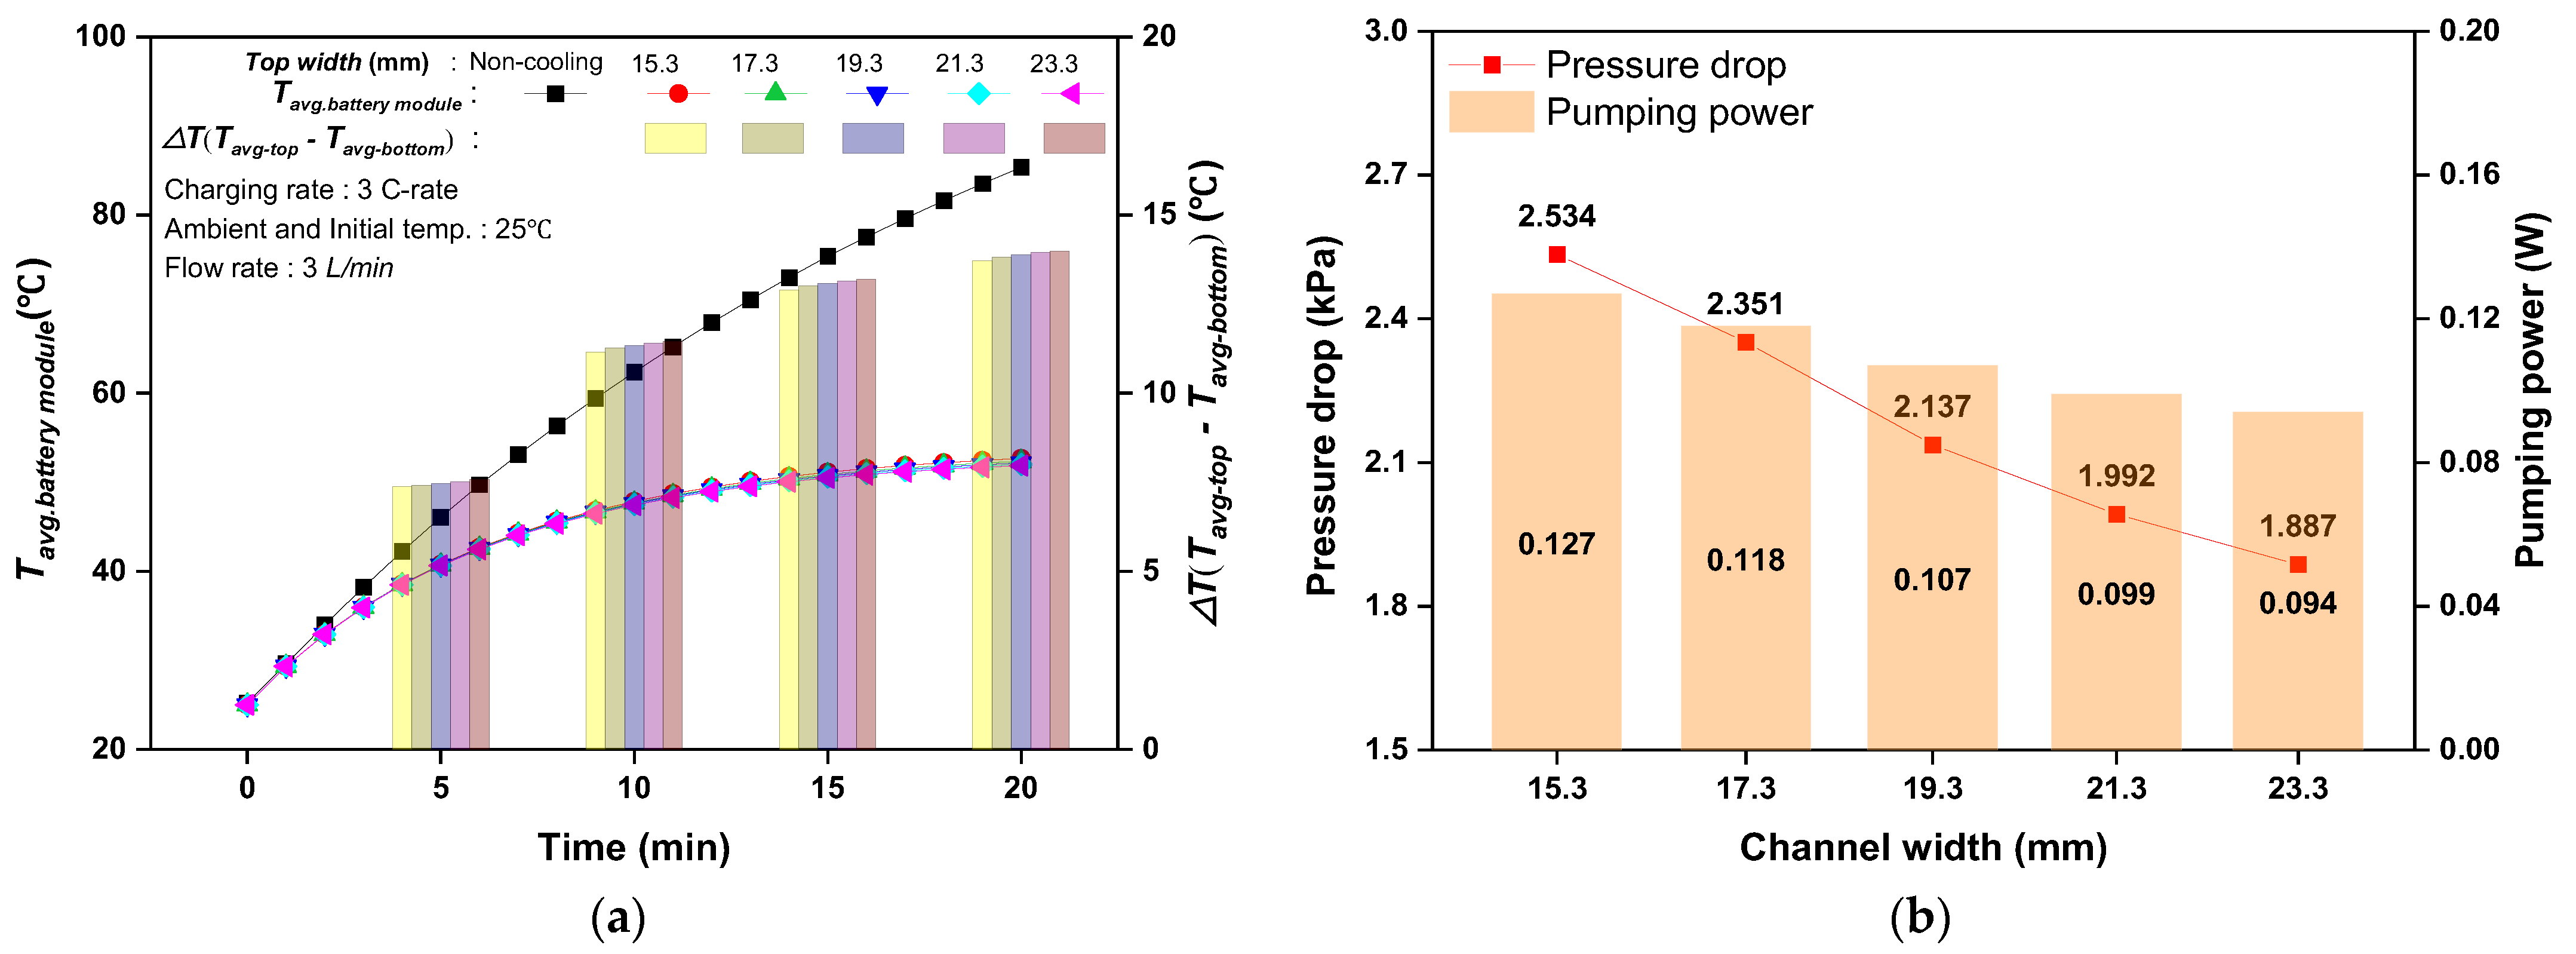
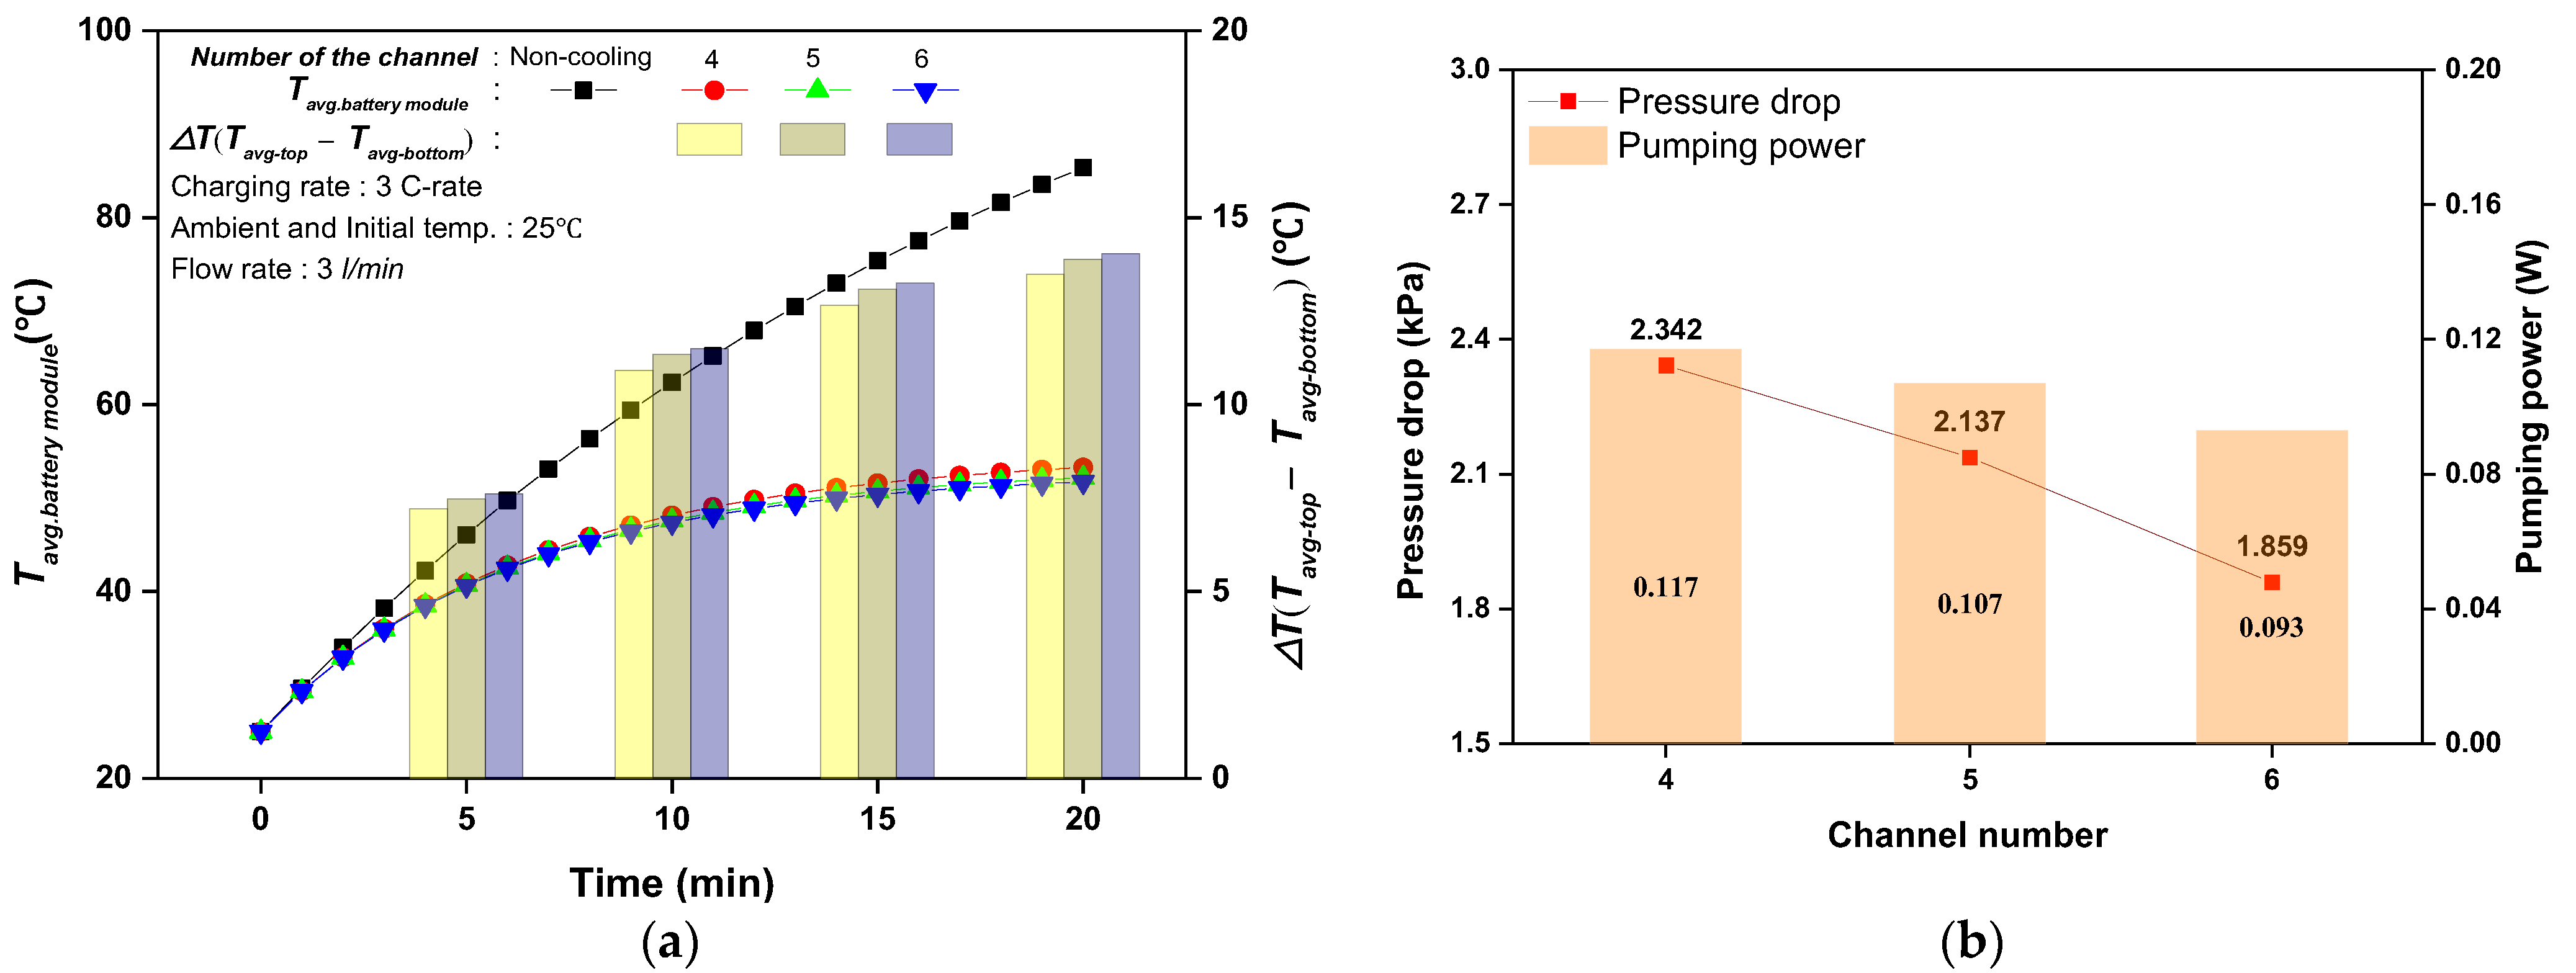
3.2. Effect of Channel Width and Number

Figure 5 shows the change in the cooling performance according to the change in the channel width of the cylindrical battery cooling plate. The average temperature of the battery module varies with channel width, as shown in Figure 5a. The width of the channel was varied, while the gap between the channels was maintained at 10 mm. When cooling was not performed during the 3 C-rate discharge process, the average temperature of the battery module was 85.4 °C. As the channel width increased, the average temperature of the battery module decreased. The average temperature of the battery module was 52.7 °C when the cooling plate’s width was 15.3 mm and fell to 51.9 °C when it was 23.3 mm—a 0.81 °C difference. Compared with the case without cooling, the highest battery temperature reduction rate was 39.2% at a channel width of 23.3 mm. In addition, the average temperature difference between the upper and bottom regions of the battery increased by 0.27 °C, from 13.7 °C to 14.0 °C, while the width of the cooling plate channel increased from 15.3 to 23.3 mm. This was due to an increase in the contact area between the lower portion of the battery module and the area through which the cooling fluid flowed when the cooling plate channel’s width widened. As such, the temperature of the battery module decreased, but the upper part of the battery module was not significantly affected. The pressure drop and pumping power in regard to channel width are shown in Figure 5b. The pressure drop on the cooling plate decreased from 2.53 to 1.89 kPa as the width rose from 15.3 to 23.3 mm. As a result, the pumping power dropped from 0.13 to 0.09 W by 26%. This is due to the fact that the pressure drop was minimized by widening the cooling path, while maintaining the same flow rate. As the channel width of the cooling plate increased, the average temperature of the battery module decreased; however, the temperature difference between the upper and lower parts of the module increased.
Figure 6 depicts the cylindrical battery’s cooling performance according to the quantity of cooling plate channels. The average temperature of the battery module is shown in Figure 6a as a function of the quantity of cooling plate channels. As the number of cooling plate channels increased from four to six under the 3 C-rate discharging condition, the average temperature of the battery module decreased by 1.55 °C from 53.3 °C to 51.7 °C. Consequently, the average rate of temperature decrease reached a maximum of 39.4%. In addition, as the number of cooling plate channels increased from four to six, the average temperature difference between the upper and lower parts of the battery module increased from 13.5 °C to 14.0 °C. Thus, it was established that improving the cooling performance of the cylindrical battery could be accomplished by increasing the number of cooling plate channels. This was due to an increased contact area between the battery module and the cooling route caused by the increased number of cooling plate channels. The differences in pressure drop and pumping power based on the quantity of cooling plate channels are depicted in Figure 6b. As the number of cooling plate channels increased from four to six, the pressure drop decreased from 2.34 to 1.86 kPa, and the pumping power decreased by 20.5% from 0.12 to 0.09 W. The fluid flow rate through each channel on the cooling plate reduced as the number of channels rose, minimizing the pressure drop in the cooling plate. Additionally, as the number of cooling plate channels increased, the pumping power was reduced and the cooling plate’s performance was enhanced. It was confirmed that the design of the optimal channel number in the cooling plate is an essential factor in battery thermal management and the pumping power of electric vehicles.

3.3. Result of the Orthogonal Analysis

The orthogonal analysis method reflects the degree of influence of a variable on the evaluation index within the influence range of the variable. The larger the range of influence ( R i ), the greater the degree of influence of the variable [31]. The influence of flow rate, channel width, and channel number on battery thermal management performance and pumping power were assessed in this study utilizing the results of the orthogonal analysis approach. R i is the influence range, and Equation (4) can be used to assess it.
R i = max k 1 ,   k 2 ,   k 3 min k 1 ,   k 2 ,   k 3 ,
where k 1 is the result obtained under conditions smaller than the standard condition, k 2 is the result obtained under the standard conditions, and k 3 is the result obtained under conditions larger than the standard condition. The results of the orthogonal analysis are shown in Table 4.
In the average temperature ( T a v g ) and average temperature difference ( T a v g ) of the battery module, the largest R was obtained in the flow rate change and the lowest R in the channel width change. Therefore, the degree of influence on the average temperature and average temperature difference was in the order of Q 1 > n 1 > L 1 . In terms of the pumping power, the largest R was in the flow rate change, and the smallest R was in the channel width change. Therefore, the degree of influence of the pumping power was similar to that of the average temperature. When considering the average battery temperature, the larger the influence range, the more advantageous it is for temperature control performance. On the other hand, the smaller the pumping power influence range, the smaller the electric vehicle’s power consumption. In terms of battery thermal management, the influence range of the number of channels has the second largest value. Additionally, its pumping power value is the lowest. Therefore, the quantity of channels in the cooling plate is the variable that affect BTM most significantly.

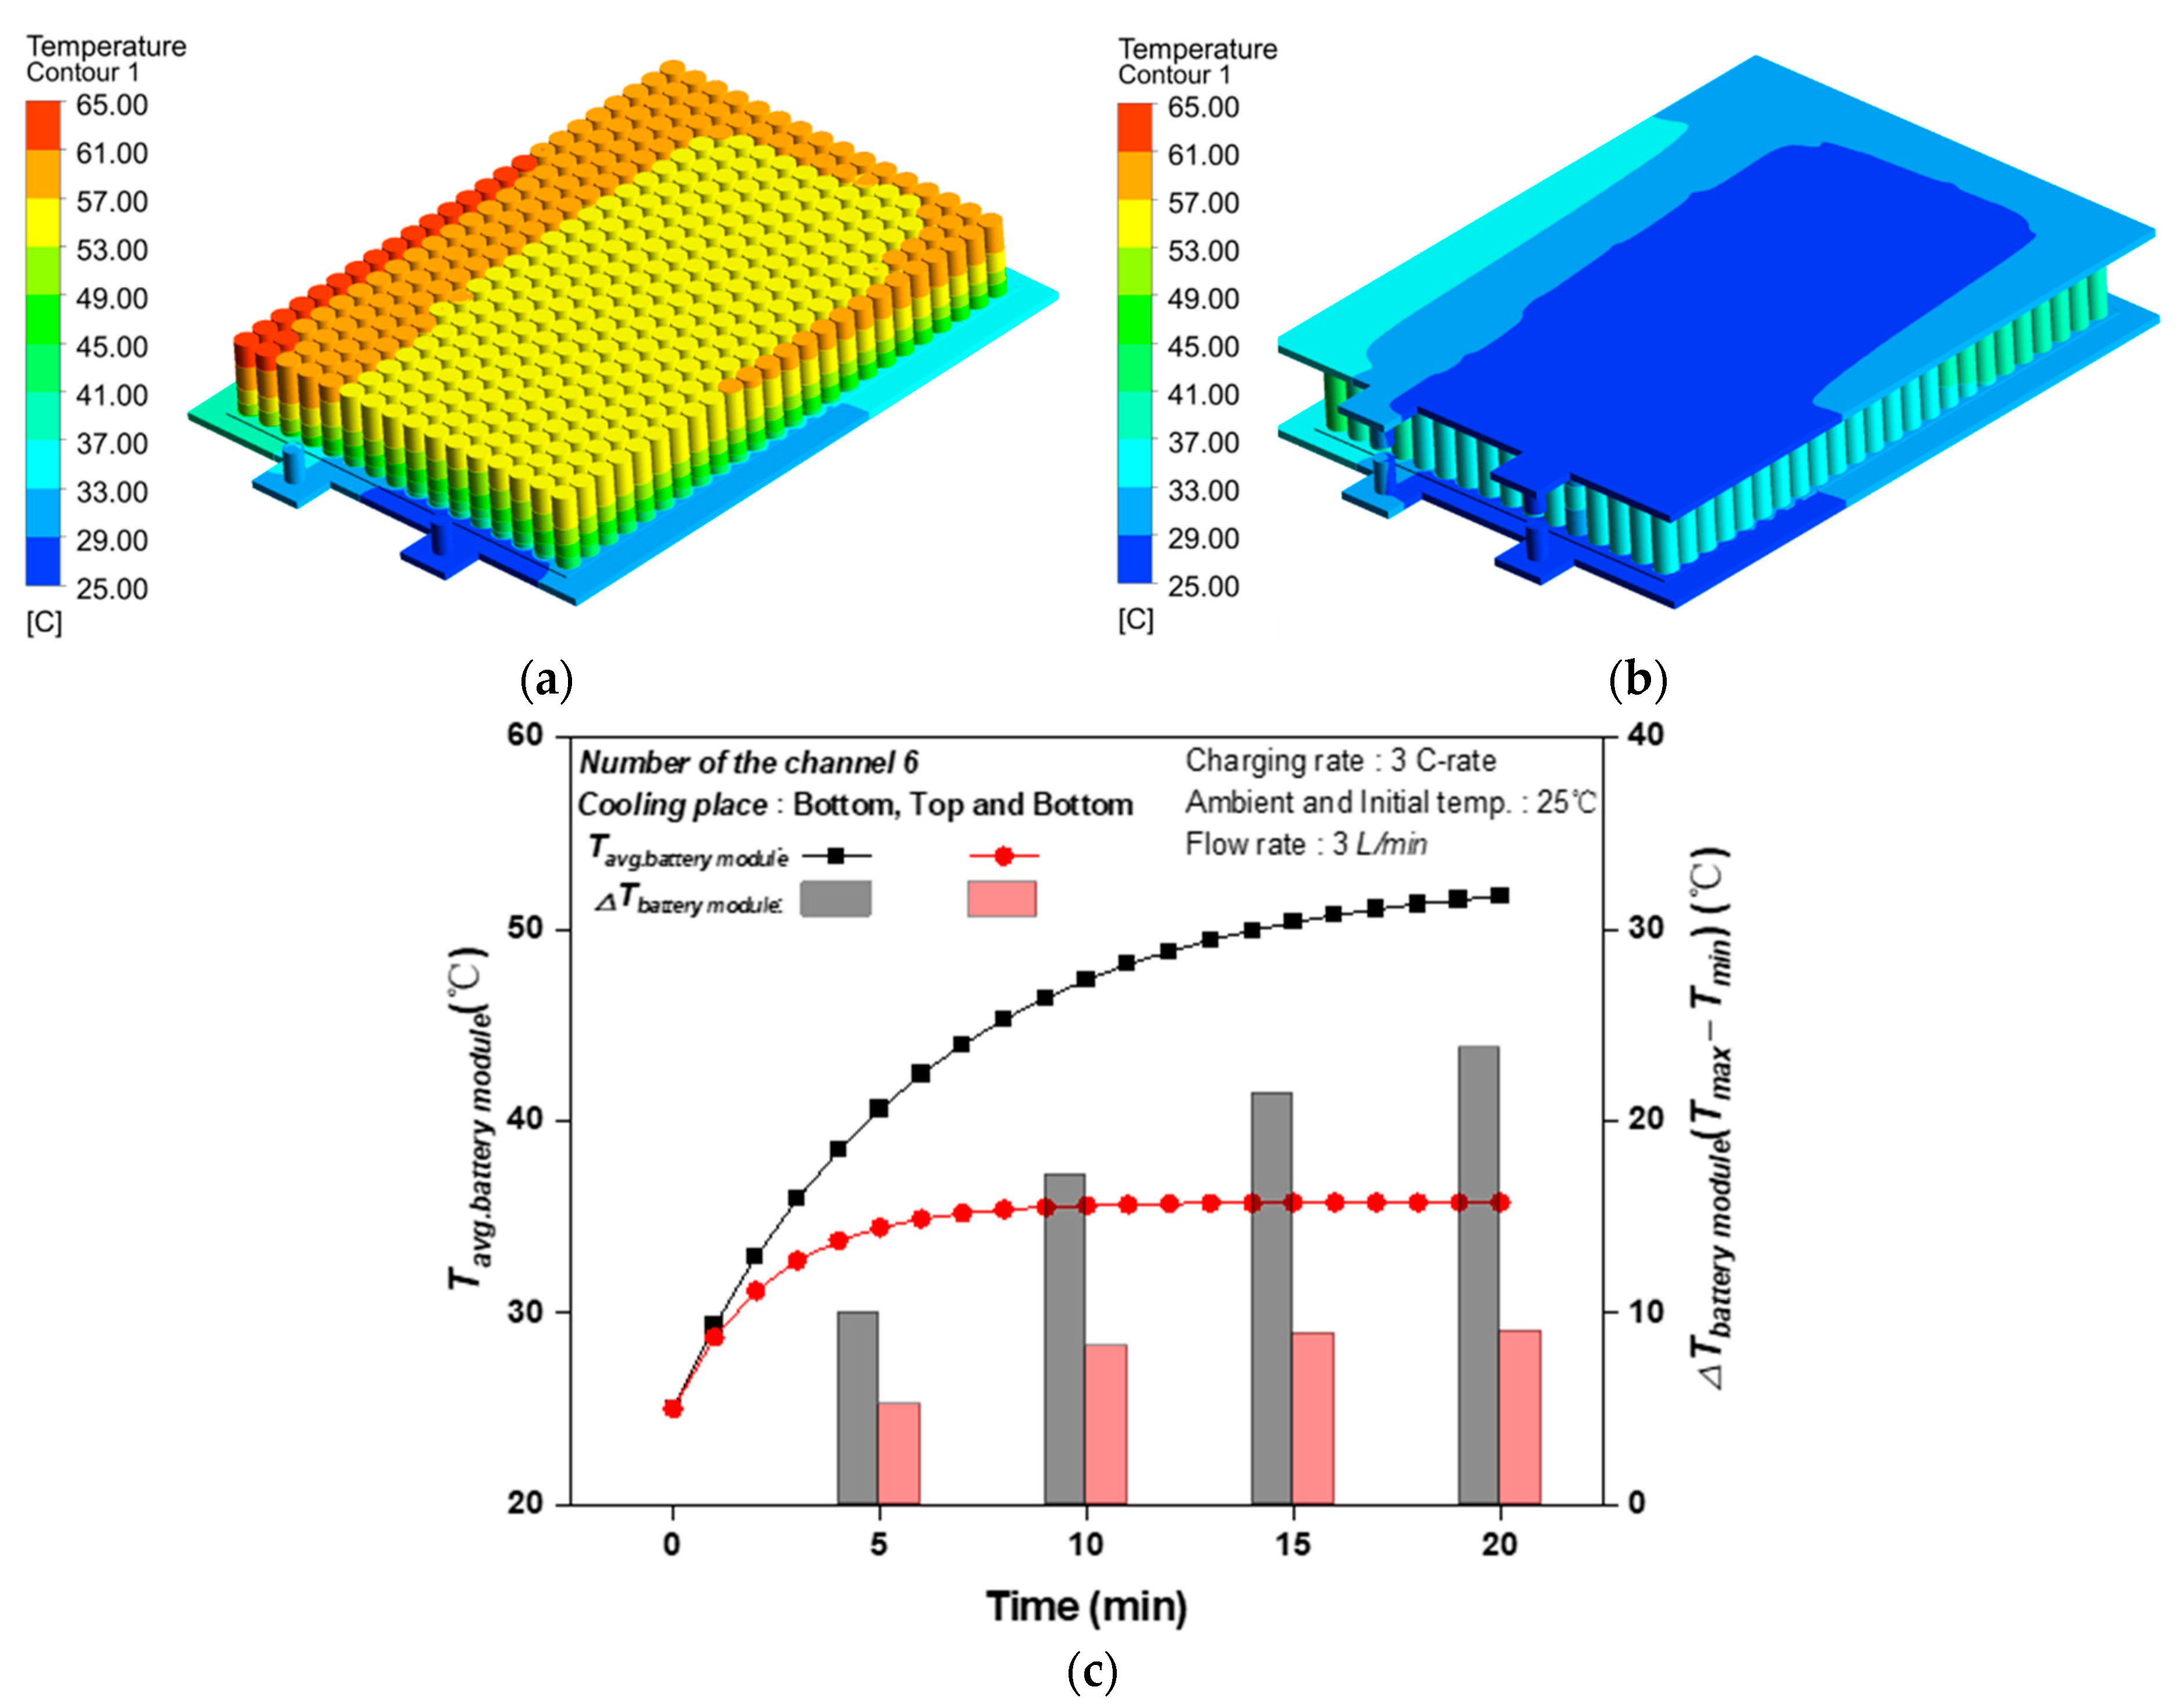
3.4. Result of Cooling Performance by Adapting an Improved Cooling System

Based on the optimized model from the orthogonal analysis results, considering the cooling performance under the 3 C-rate discharging condition, it was confirmed that the optimal cooling performance could be obtained in the model with Q = 3 L/min, L = 19.3 mm, and n = 6. However, when the cooling plate was applied only to the lower part, the temperature of the battery module was higher than the safe operating temperature of 40 °C. In particular, the temperature was slightly higher in the upper part where the cooling plate was not in contact. To reduce the heat generation of the battery module effectively, the cooling performance was investigated by applying a cooling plate to the top and bottom of the battery module. Figure 7 depicts the variances in the average temperatures of three C-rate discharge situations. The temperature contours of the battery modules with bottom cooling are shown in Figure 7a,b, respectively. When only bottom cooling was applied, the highest temperature of the battery module was 62.3 °C at the outlet side. In addition, the average temperature of the battery module was 51.7 °C. When top and bottom cooling were applied, the highest temperature of the battery module was 41.5 °C at the outlet side of the battery module, and the average temperature was 35.8 °C. As a result, the battery module’s maximum temperature dropped by 20.7 °C in comparison to when only bottom cooling was used.
The average temperature and temperature differential of the battery module for bot-tom cooling and top and bottom cooling are compared in Figure 7c. The average temperatures of the battery module for only bottom cooling and top and bottom cooling were 51.7 °C and 35.8 °C, respectively. By applying top and bottom cooling, the average temperature of the battery module could be reduced by 16 °C compared to only bottom cooling. The maximum and minimum temperature differences of the battery module in bottom cooling and top and bottom cooling were 22.8 °C and 7.1 °C, respectively. The cooling plate’s pressure drop rose by around 2.03 times, from 1.86 kPa for bottom cooling to 3.78 kPa for top and bottom cooling. As top and bottom cooling was applied, the pumping power was slightly higher, but the average temperature of the battery module could be maintained below 40 °C. Battery cell temperatures above 40 °C during charging and discharging have a negative impact on the formation of SEI inside the battery [32], but the top and bottom cooling in this study was robust enough to withstand this, and performance degradation and capacity reduction were minimized. Therefore, it was confirmed that maintaining a safe operating temperature could be accomplished when cooling plates were simultaneously applied to the top and bottom of the battery module. The temperature difference of the battery module was relatively uniform compared to bottom cooling, even though it did not reach the recommended level (5 °C). It is believed that the recommendations for temperature difference within the module can be achieved through improvements in the battery cooling plate.

4. Conclusions

This study investigated the influence of a number of variables, including the flow rate, channel width, and channel number, on the liquid cooling performance of a 21700 cylindrical battery module. The results showed that the average temperature of the battery module decreased from 53.8 °C to 50.7 °C when the flow rate in the cooling plate increased from 2 to 6 L/min, but that the pumping power increased from 0.04 to 0.81 W due to the higher pressure drop. Therefore, increasing the cooling flow rate improves the cooling performance; however, selecting an appropriate flow rate is important because the pumping power increases. In addition, as the width increased from 15.3 to 23.3 mm, the average temperature of the battery module decreased from 52.7 °C to 51.9 °C. Pumping power dropped from 0.13 to 0.09 W by 26%. Under the 3 C-rate discharging condition, the average battery module temperature was reduced by 1.55 °C and the pumping power by 20.5% as the number of cooling plate channels rose from four to six. Nevertheless, it was difficult to achieve the safe operating temperature of the battery module under 3 C-rate discharge conditions by installing a cooling plate at the bottom. To achieve a safe operating temperature, it is necessary to increase the heat transfer area of the battery.
Orthogonal analysis was conducted to investigate the influence of each variable on the cooling performance of the battery module. It was confirmed that increasing the number of channels was the most effective method for improving the cooling performance and reducing the pumping power. Based on the optimized model from the orthogonal analysis results, the cooling performance was investigated by applying top and bottom cooling to enhance cooling. As a result, when compared to the case where just bottom cooling was used, the average temperature and maximum temperature of the battery module dropped by 16.0 °C and 20.7 °C, respectively. Moreover, the average temperature could be maintained below 40 °C for safe operation. Therefore, a safe operating temperature could be effectively maintained when cooling plates were simultaneously applied to the top and bottom of the battery module, and the reliability and lifetime of the battery system could be improved by significantly reducing the temperature difference in the battery module.

Author Contributions

Conceptualization, H.C. and D.S.; methodology N.Y. and J.H.; validation, H.C. and D.S.; formal analysis, N.Y.; investigation, N.Y. and J.H.; resources, N.Y. and J.H.; writing—original draft preparation, N.Y.; writing—review and editing, J.H. and H.C.; supervision, H.C. All authors have read and agreed to the published version of the manuscript.

Funding

This work was supported by “Eco-friendly Car Sector in Development Technology” of the Korea Institute of Industrial Technology Evaluation and Management (KEIT), granted financial resource from the Ministry of Trade, Industry & Energy, Republic of Korea. (No. 20011906) and “Regional Innovation Strategy (RIS)” through the National Research Foundation of Korea (NRF) funded by the Ministry of Education (MOE) (2021RIS-002).

Data Availability Statement

Not applicable.

Conflicts of Interest

The authors declare no conflict of interest.

Nomenclature

LIBLithium-ion battery
EVElectric vehicle
HEVHybrid electric vehicle
BTMSBattery management system
PCMPhase change material
TCSThermally conductive structure
L1Top width of cooling channel (mm)
L2Bottom width of cooling channel (mm)
h1Height of cooling channel (mm)
QgenTotal heating value of battery cells (W)
QirCharge/discharge irreversible heat (W)
QreCharge/discharge reversible heat
ICurrent (A)
RResistance (Ω)
TcellBattery cell temperature (°C)
UOCVOpen circuit voltage (V)
WpumpPumping power (W)
ΔPInlet and outlet pressure difference (kPa)
QwFlow rate of water (L/min)
Q1Flow rate (L/min)
TavgAverage temperature of battery module ((°C)
ΔTavgAverage temperature difference of battery module ((°C)
K1Smaller condition result
K2Standard condition result
K3Larger condition result
RiInfluence range
*Standard condition

References

  1. Falih, H.; Hamed, A.J.; Khalifa, A.H.N. Techno-Economic Assessment of a Hybrid Connected PV Solar System. Int. J. Air-Cond. Refrig. 2022, 30, 1–15. [Google Scholar] [CrossRef]
  2. Liu, X.; Chen, Z.; Zhang, C.; Wu, J. A Novel Temperature-Compensated Model for Power Li-Ion Batteries with Dual-Particle-Filter State of Charge Estimation. Appl. Energy 2014, 123, 263–272. [Google Scholar] [CrossRef]
  3. Zhang, K.; An, Y.; Wei, C.; Qian, Y.; Zhang, Y.; Feng, J. High-Safety and Dendrite-Free Lithium Metal Batteries Enabled by Building a Stable Interface in a Nonflammable Medium-Concentration Phosphate Electrolyte. ACS Appl. Mater. Interfaces 2021, 13, 50869–50877. [Google Scholar] [CrossRef]
  4. Fang, Y.; Ye, F.; Zhu, Y.; Li, K.; Shen, J.; Su, L. Experimental Investigation on System Performances and Transient Response of a Pumped Two-Phase Battery Cooling System Using R1233zd. Energy Rep. 2020, 6, 238–247. [Google Scholar] [CrossRef]
  5. Pinson, M.B.; Bazant, M.Z. Theory of SEI Formation in Rechargeable Batteries: Capacity Fade, Accelerated Aging and Lifetime Prediction. J. Electrochem. Soc. 2013, 160, A243–A250. [Google Scholar] [CrossRef]
  6. Ramadass, P.; Haran, B.; White, R.; Popov, B.N. Capacity Fade of Sony 18650 Cells Cycled at Elevated Temperatures: Part, I. Cycling Performance. J. Power Sources 2002, 112, 606–613. [Google Scholar] [CrossRef]
  7. Wu, M.S.; Chiang, P.C.J. High-Rate Capability of Lithium-Ion Batteries after Storing at Elevated Temperature. Electrochim. Acta 2007, 52, 3719–3725. [Google Scholar] [CrossRef]
  8. Ping, P.; Wang, Q.; Huang, P.; Sun, J.; Chen, C. Thermal Behaviour Analysis of Lithium-Ion Battery at Elevated Temperature Using Deconvolution Method. Appl. Energy 2014, 129, 261–273. [Google Scholar] [CrossRef]
  9. Giuliano, M.R.; Prasad, A.K.; Advani, S.G. Experimental Study of an Air-Cooled Thermal Management System for High Capacity Lithium–Titanate Batteries. J. Power Sources 2012, 216, 345–352. [Google Scholar] [CrossRef]
  10. Wang, H.; Ma, L. Thermal Management of a Large Prismatic Battery Pack Based on Reciprocating Flow and Active Control. Int. J. Heat. Mass. Transf. 2017, 115, 296–303. [Google Scholar] [CrossRef]
  11. Fan, Y.; Bao, Y.; Ling, C.; Chu, Y.; Tan, X.; Yang, S. Experimental Study on the Thermal Management Performance of Air Cooling for High Energy Density Cylindrical Lithium-Ion Batteries. Appl. Therm. Eng. 2019, 155, 96–109. [Google Scholar] [CrossRef]
  12. Yu, X.; Lu, Z.; Zhang, L.; Wei, L.; Cui, X.; Jin, L. Experimental Study on Transient Thermal Characteristics of Stagger-Arranged Lithium-Ion Battery Pack with Air Cooling Strategy. Int. J. Heat. Mass. Transf. 2019, 143, 118576. [Google Scholar] [CrossRef]
  13. Zhou, H.; Zhou, F.; Xu, L.; Kong, J. QingxinYang Thermal Performance of Cylindrical Lithium-Ion Battery Thermal Management System Based on Air Distribution Pipe. Int. J. Heat. Mass. Transf. 2019, 131, 984–998. [Google Scholar] [CrossRef]
  14. Liu, H.; Wei, Z.; He, W.; Zhao, J. Thermal Issues about Li-Ion Batteries and Recent Progress in Battery Thermal Management Systems: A Review. Energy Convers. Manag. 2017, 150, 304–330. [Google Scholar] [CrossRef]
  15. Dubey, P.; Pulugundla, G.; Srouji, A.K. Direct Comparison of Immersion and Cold-Plate Based Cooling for Automotive Li-Ion Battery Modules. Energies 2021, 14, 1259. [Google Scholar] [CrossRef]
  16. Liu, J.; Fan, Y.; Wang, J.; Tao, C.; Chen, M. A Model-Scale Experimental and Theoretical Study on a Mineral Oil-Immersed Battery Cooling System. Renew. Energy 2022, 201, 712–723. [Google Scholar] [CrossRef]
  17. Kim, M.; Ham, J.; Shin, D.; Cho, H. Comparison of Cooling Performance in a Cylindrical Battery with Single-Phase Direct Contact Cooling under Various Operating Conditions. Batteries 2022, 8, 195. [Google Scholar] [CrossRef]
  18. Roe, C.; Feng, X.; White, G.; Li, R.; Wang, H.; Rui, X.; Li, C.; Zhang, F.; Null, V.; Parkes, M.; et al. Immersion Cooling for Lithium-Ion Batteries—A Review. J. Power Sources 2022, 525, 231094. [Google Scholar] [CrossRef]
  19. Pulugundla, G.; Dubey, P.; Srouji, A. Time-Accurate CFD Analysis of Liquid Cold Plates for Efficient Thermal Performance of Electric Vehicle Li-Ion Battery Modules. SAE Tech. Pap. 2019, 2019, 01-0500. [Google Scholar] [CrossRef]
  20. Lai, Y.; Wu, W.; Chen, K.; Wang, S.; Xin, C. A Compact and Lightweight Liquid-Cooled Thermal Management Solution for Cylindrical Lithium-Ion Power Battery Pack. Int. J. Heat. Mass. Transf. 2019, 144, 118581. [Google Scholar] [CrossRef]
  21. Zhou, H.; Zhou, F.; Zhang, Q.; Wang, Q.; Song, Z. Thermal Management of Cylindrical Lithium-Ion Battery Based on a Liquid Cooling Method with Half-Helical Duct. Appl. Therm. Eng. 2019, 162, 114257. [Google Scholar] [CrossRef]
  22. Zhao, C.; Cao, W.; Dong, T.; Jiang, F. Thermal Behavior Study of Discharging/Charging Cylindrical Lithium-Ion Battery Module Cooled by Channeled Liquid Flow. Int. J. Heat. Mass. Transf. 2018, 120, 751–762. [Google Scholar] [CrossRef]
  23. Qian, Z.; Li, Y.; Rao, Z. Thermal Performance of Lithium-Ion Battery Thermal Management System by Using Mini-Channel Cooling. Energy Convers. Manag. 2016, 126, 622–631. [Google Scholar] [CrossRef]
  24. Lv, Y.; Zhou, D.; Yang, X.; Liu, X.; Li, X.; Zhang, G. Experimental Investigation on a Novel Liquid-Cooling Strategy by Coupling with Graphene-Modified Silica Gel for the Thermal Management of Cylindrical Battery. Appl. Therm. Eng. 2019, 159, 113885. [Google Scholar] [CrossRef]
  25. Wu, W.; Yang, X.; Zhang, G.; Chen, K.; Wang, S. Experimental Investigation on the Thermal Performance of Heat Pipe-Assisted Phase Change Material Based Battery Thermal Management System. Energy Convers. Manag. 2017, 138, 486–492. [Google Scholar] [CrossRef]
  26. Nelson, P.; Dees, D.; Amine, K.; Henriksen, G. Modeling Thermal Management of Lithium-Ion PNGV Batteries. J. Power Sources 2002, 110, 349–356. [Google Scholar] [CrossRef]
  27. Kim, M. Performance Analysis of a Direct Contact Battery Cooling System Using R134a. Master’s Thesis, Chosun University, Gwangju, Republic of Korea, 2023. [Google Scholar]
  28. Yadav, V.; Baghel, K.; Kumar, R.; Kadam, S.T. Numerical Investigation of Heat Transfer in Extended Surface Microchannels. Int. J. Heat. Mass. Transf. 2016, 93, 612–622. [Google Scholar] [CrossRef]
  29. Panchal, S.; Khasow, R.; Dincer, I.; Agelin-Chaab, M.; Fraser, R.; Fowler, M. Numerical Modeling and Experimental Investigation of a Prismatic Battery Subjected to Water Cooling. Numer. Heat. Transf. Part A Appl. 2017, 71, 626–637. [Google Scholar] [CrossRef]
  30. Sheng, L.; Zhang, Z.; Su, L.; Zhang, H.; Zhang, H.; Li, K.; Fang, Y.; Ye, W. A Calibration Calorimetry Method to Investigate the Thermal Characteristics of a Cylindrical Lithium-Ion Battery. Int. J. Therm. Sci. 2021, 165, 106891. [Google Scholar] [CrossRef]
  31. Wang, J.; Liu, X.; Liu, F.; Liu, Y.; Wang, F.; Yang, N. Numerical Optimization of the Cooling Effect of the Bionic Spider-Web Channel Cold Plate on a Pouch Lithium-Ion Battery. Case Stud. Therm. Eng. 2021, 26, 101124. [Google Scholar] [CrossRef]
  32. An, S.J.; Li, J.; Daniel, C.; Mohanty, D.; Nagpure, S.; Wood, D.L. The State of Understanding of the Lithium-Ion-Battery Graphite Solid Electrolyte Interphase (SEI) and Its Relationship to Formation Cycling. Carbon 2016, 105, 52–76. [Google Scholar] [CrossRef]
Figure 1. Battery module and BTMS with a cooling plate for liquid cooling: (a) schematic diagram of the battery module; (b) 3D model of the battery module; (c) structure of a cooling plate.
Batteries 09 00538 g001
Figure 2. Grid independence test of the mesh node.
Batteries 09 00538 g002
Figure 3. Comparison of the results between this study and those reported by Sheng et al. [30].
Batteries 09 00538 g003
Figure 4. Cooling performance according to the flow rate of the HTF: (a) average temperature variation of the battery module; (b) pressure drop and pumping power.
Batteries 09 00538 g004
Figure 5. Cooling performance according to channel width: (a) average temperature variation of the battery module; (b) pressure drop and pumping power.
Batteries 09 00538 g005
Figure 6. Result of cooling performance according to channel number: (a) average temperature variation of the battery module; (b) pressure drop and pumping power.
Batteries 09 00538 g006
Figure 7. Comparison of bottom cooling and top and bottom cooling; (a) bottom cooling of the battery module; (b) top and bottom cooling of the battery module; (c) temperature variation of the bottom cooling and top and bottom cooling.
Batteries 09 00538 g007
Table 1. Specifications of a 21700 battery.
ParameterSpecification
Diameter (mm)21
Height (mm)70
Weight (g)67.5
Nominal capacity (Ah)4.95
Nominal voltage (V)3.69
Charge cut-off voltage (V)4.25
Table 2. Thermal properties of HTF [28].
ParameterSpecification
Density (kg/m3)765.33 + 1.8142T − 0.0035T2
Specific heat (J/kg∙K)28070 − 281.7T + 1.25T2 − 2.48 × 10⁻³T3 + 1.857 × 10⁻⁶T4
Thermal conductivity (W/m∙K)−0.5752 + 6.397 × 10⁻³T − 8.151 × 10⁻⁶T2
Viscosity (Pa·s)9.67 × 10⁻² − 8.207 × 10⁻⁴T + 2.344 × 10⁻⁶T2 − 2.244 × 10⁻⁹T3
Table 3. Simulation conditions.
ParametersRange
Boundary condition and flow rateAmbient temperature (°C)25
Initial temperature (°C)25
Battery volumetric heat generation (W/m3)225,000
Heat transfer coefficient (W/m2∙K)10
Flow rate (L/min)2, 3 *, 4, 5, 6
Channel shapeTop (L1)/Bottom width (L2) (mm)15.3/8.1, 17.3/10.1, 19.3/12.1 *, 21.3/14.1, 23.3/16.1
Height (h1) (mm)3.6
Number of the channel (n1)4, 5 *, 6
* Standard condition.
Table 4. Results of the orthogonal analysis.
T a v g [°C] T a v g [°C] W p [W]
Q 1 k 1 53.7713.370.04
k 2 52.1713.880.11
k 3 51.4314.020.24
R i 2.340.650.20
L 1 k 1 52.3613.820.12
k 2 52.1713.880.11
k 3 52.0013.940.10
R i 0.360.120.02
n 1 k 1 53.2713.480.12
k 2 52.1713.880.11
k 3 51.7214.040.09
R i 1.550.560.03
Disclaimer/Publisher’s Note: The statements, opinions and data contained in all publications are solely those of the individual author(s) and contributor(s) and not of MDPI and/or the editor(s). MDPI and/or the editor(s) disclaim responsibility for any injury to people or property resulting from any ideas, methods, instructions or products referred to in the content.

