Article

The Polarization and Heat Generation Characteristics of Lithium-Ion Battery with Electric–Thermal Coupled Modeling

1
Department of Power Mechanical Engineering, Beijing Jiaotong University, Beijing 100044, China
2
Tsinghua University, State Key Laboratory of Automotive Safety and Energy, Beijing 100084, China
3
National International Science and Technology Cooperation Base, Beijing Jiaotong University, Beijing 100044, China
*
Authors to whom correspondence should be addressed.
Batteries 2023, 9(11), 529; https://doi.org/10.3390/batteries9110529
Submission received: 23 September 2023 / Revised: 22 October 2023 / Accepted: 23 October 2023 / Published: 25 October 2023

Abstract

:
This paper investigates the polarization and heat generation characteristics of batteries under different ambient temperatures and discharge rates by means of using a coupled electric–thermal model. This study found that the largest percentage of polarization is ohmic polarization, followed by concentration polarization and electrochemical polarization. The values of the three types of polarization are generally small and stable under normal-temperature environments and low discharge rates. However, they increase significantly in low-temperature environments and at high discharge rates and continue to rise during the discharge process. Additionally, ohmic heat generation and polarization generation also increase significantly under these conditions. Reversible entropy heat is less sensitive to ambient temperature but increases significantly with the increase in the discharge rate. Ohmic heat generation and polarization heat generation contribute to the total heat generation of the battery at any ambient temperature, while reversible entropy heat only contributes to the total heat generation of the battery at the end of discharge.

Graphical Abstract

1. Introduction

Currently, electric vehicles powered by lithium-ion batteries face several challenges, including limited driving range [1], slow charging times [2,3], battery temperature inconsistencies [4,5,6], the risk of thermal runaway [7,8], and short battery life [9,10]. Researchers have concentrated on increasing the energy density of lithium-ion batteries to tackle the issue of restricted range. This is achieved through innovations in electrode materials, battery weight reduction, and pack optimization. The ternary system batteries’ energy density has already surpassed 200–300 Wh/kg, and further developments such as high nickel ratio [11,12,13], silicon carbon cathodes [14,15,16,17], and CTP or CTC technology [18] promise even higher energy densities. Most electric vehicles rely on a 400 V voltage platform and increasing charging current to achieve faster charging, but this can exacerbate internal polarization effects leading to reduced chargeable and dischargeable capacity, substance decomposition, and lithium precipitation [19,20,21]. These effects are more pronounced at low temperatures and high charge or discharge rates, indicating a need for further research in these areas. Therefore, it is imperative to conduct research on the characteristics of lithium-ion batteries under high current conditions.
The difference between the equilibrium potential and the terminal voltage is known as polarization, which is more evident at low temperatures and high currents. Temperature has a significant impact on the performance of lithium-ion batteries as well as the risk of thermal runaway during charging and discharging [22,23]. Charging or discharging the battery at a high rate at very low temperatures may cause lithium precipitation, and if the growing lithium dendrites pierce the battery separator, it might result in thermal runaway and an internal short circuit [24,25]. The polarization phenomenon and heat generation mechanism of the battery are complex and influenced by various factors such as battery characteristics (internal resistance and entropy thermal coefficient), operating conditions (ambient temperature and load current), and the scheme, structure, and control strategy of the battery thermal management system. Therefore, it is essential to investigate changes in the battery’s internal polarization and heat generation characteristics by using electrical and heat generation models.
Ohmic, electrochemical, and concentration polarization are the three different forms of polarization [26,27]. The polarization phenomenon reduces the power density of the battery, which results in reduced energy conversion efficiency and more energy waste. It also reduces the cycle stability of the battery and affects the structural stability of the electrode material and SEI membranes. The polarization phenomenon is influenced by the temperature and charge–discharge rate of the battery, especially in low-temperature environments and at high discharge rates, showing sudden changes in load current connection and disconnection and in voltage transient, early termination of discharge, and a reduction in the discharge plateau period. The highest polarization voltage dips are caused by concentration and ohmic polarization, with electrochemical polarization producing minor drops. In numerical models, both the pseudo-two-dimensional (P2D) electrochemical model and the resistor–capacitance (RC) equivalent circuit model successfully depict the battery polarization phenomenon. Researchers have also developed new models to study the polarization phenomenon and improve simulation accuracy. He investigated several model parameters under varied beginning polarization conditions and current ratios to examine both short- and long-time scale polarization characteristics [28]. In comparison with the traditional RC model, the root-mean-square errors of the voltage and current simulations were reduced by 79.65% and 79.27%, respectively. Lin developed a new polarization voltage model based on current and time by using the battery’s electrochemical mode [29]. Simulation results showed that when charging the battery from a 0% SOC (state of charge), i.e., 100% DOD (depth of discharge), to the cut-off voltage using a 3C rate, the discrepancies in terminal voltage and polarization voltage at the cutoff voltage are 1.4% and 4.9%, respectively. The average errors for the entire process were 1.14% and 4%, respectively. Fan examined the polarization characteristics of lithium-ion batteries using various charging techniques [30]. They analyzed the time-varying characteristics of the three polarizations and the relationship between battery voltage, polarization voltage, and SOC at different constant current charging rates based on the spatial distribution of battery voltage and electrolyte salt concentration. The findings showed that charge current and SOC had a direct impact on polarization voltage, which in turn had an impact on battery voltage. Qiu’s investigation into the polarization characteristics of lithium-ion batteries during cycling charge and discharge processes using the hybrid pulse power test indicates that higher charge and discharge rates lead to greater polarization internal resistance [21]. Lv’s study suggests that the SOC has a substantial impact on the internal resistance of batteries, with polarization internal resistance having the most significant influence. However, current research on the polarization characteristics of lithium-ion batteries mostly focuses on qualitative analyses of various discharge modes, and there is a scarcity of quantitative analyses regarding environmental temperature and various types of polarization [31].
Several elements, including heat creation, transport, and dissipation, have an impact on a battery’s temperature. In 1958, JM Sherfey developed an isothermal calorimeter to measure the thermal effect of batteries [32]. Bernardi derived the battery heat balance equation in 1985, which includes four main heat generation components: reversible entropy heat, ohmic heat, polarization heat, and side reaction heat [33]. As a result, precise determination of the battery’s heat generation characteristics is essential for battery modeling and thermal control [34,35,36,37,38,39,40,41,42,43].
The current, open-circuit voltage, terminal voltage, temperature, and entropy heat coefficient can all be used to compute the battery heat generation rate. The rate of battery heat generation is frequently determined using this equation. The properties of the battery’s heat generation can be assessed using methods like differential scanning calorimetry (DSC) and adiabatic accelerated calorimetry (ARC). The Bernardi battery heat generation rate calculation equation is commonly used in numerical models. However, to optimize the efficiency of the coupling calculation of the electric field and the thermal field, some researchers use the heat generation power of a single battery as a fixed value. This approach can only reflect heat generation under specific working conditions. Understanding the overall impacts of battery heat generation, transport, and dissipation is essential for precisely modeling and controlling the temperature of batteries [42,44]. Zhu compared the theoretical calculation results of the Bernardi model with and without considering reversible entropy heat with experimental results obtained via ARC testing, and better agreement was shown when considering reversible entropy heat [45]. Chen [46] and Ren [47] both established electrochemical–thermal coupling models to analyze the effects of electrochemical parameters on heat generation, and proposed models to predict total heat generation at various discharge rates. Mei introduced an electrochemical–thermal cycling model to assess and compare the thermal characteristics of lithium-ion batteries. The results indicate that when charging at a higher rate under constant voltage conditions, more capacity is charged, and more heat is generated [48]. Xu conducted experimental explorations on the thermal characteristics and thermal performance of large-capacity commercial lithium-ion batteries exceeding 100 Ah. The results indicate that the discharge rate has minimal impact on the entropy coefficient and direct current internal resistance [49]. Joula has developed a comprehensive electrochemical–thermal battery model to analyze the proposed novel and reliable battery thermal management system (BTMS). This system ensures the efficient operation of electric vehicles under extreme temperature conditions [50]. Nevertheless, there is limited research reporting quantitative analyses of the environmental temperature and heat generation in lithium-ion batteries. The current research on battery polarization and heat generation characteristics primarily focuses on the influence of discharge rate, with less attention given to ambient temperature, different types of polarization, and quantitative analysis of heat generation. This research uses a coupled electric–thermal model that is accurate and effective to address this gap. The convective heat coefficient and entropy heat transfer coefficient were tested in order to determine the model’s main parameters, allowing for the analysis of the reversible entropy thermal effects under conditions of low discharge rate and high ambient temperature. To determine the resistance and capacitance offline parameters of the equivalent circuit model, a pulse discharge test was carried out at various ambient temperatures. Using the established electric–thermal coupling model, this study quantitatively examines the polarization and heat generation characteristics of the battery, analyzes the impact of ambient temperature and discharge rate on three types of polarization and three types of heat generation, and explores the dominant types under different operating conditions.

2. Setup and Calibration for the Experiment

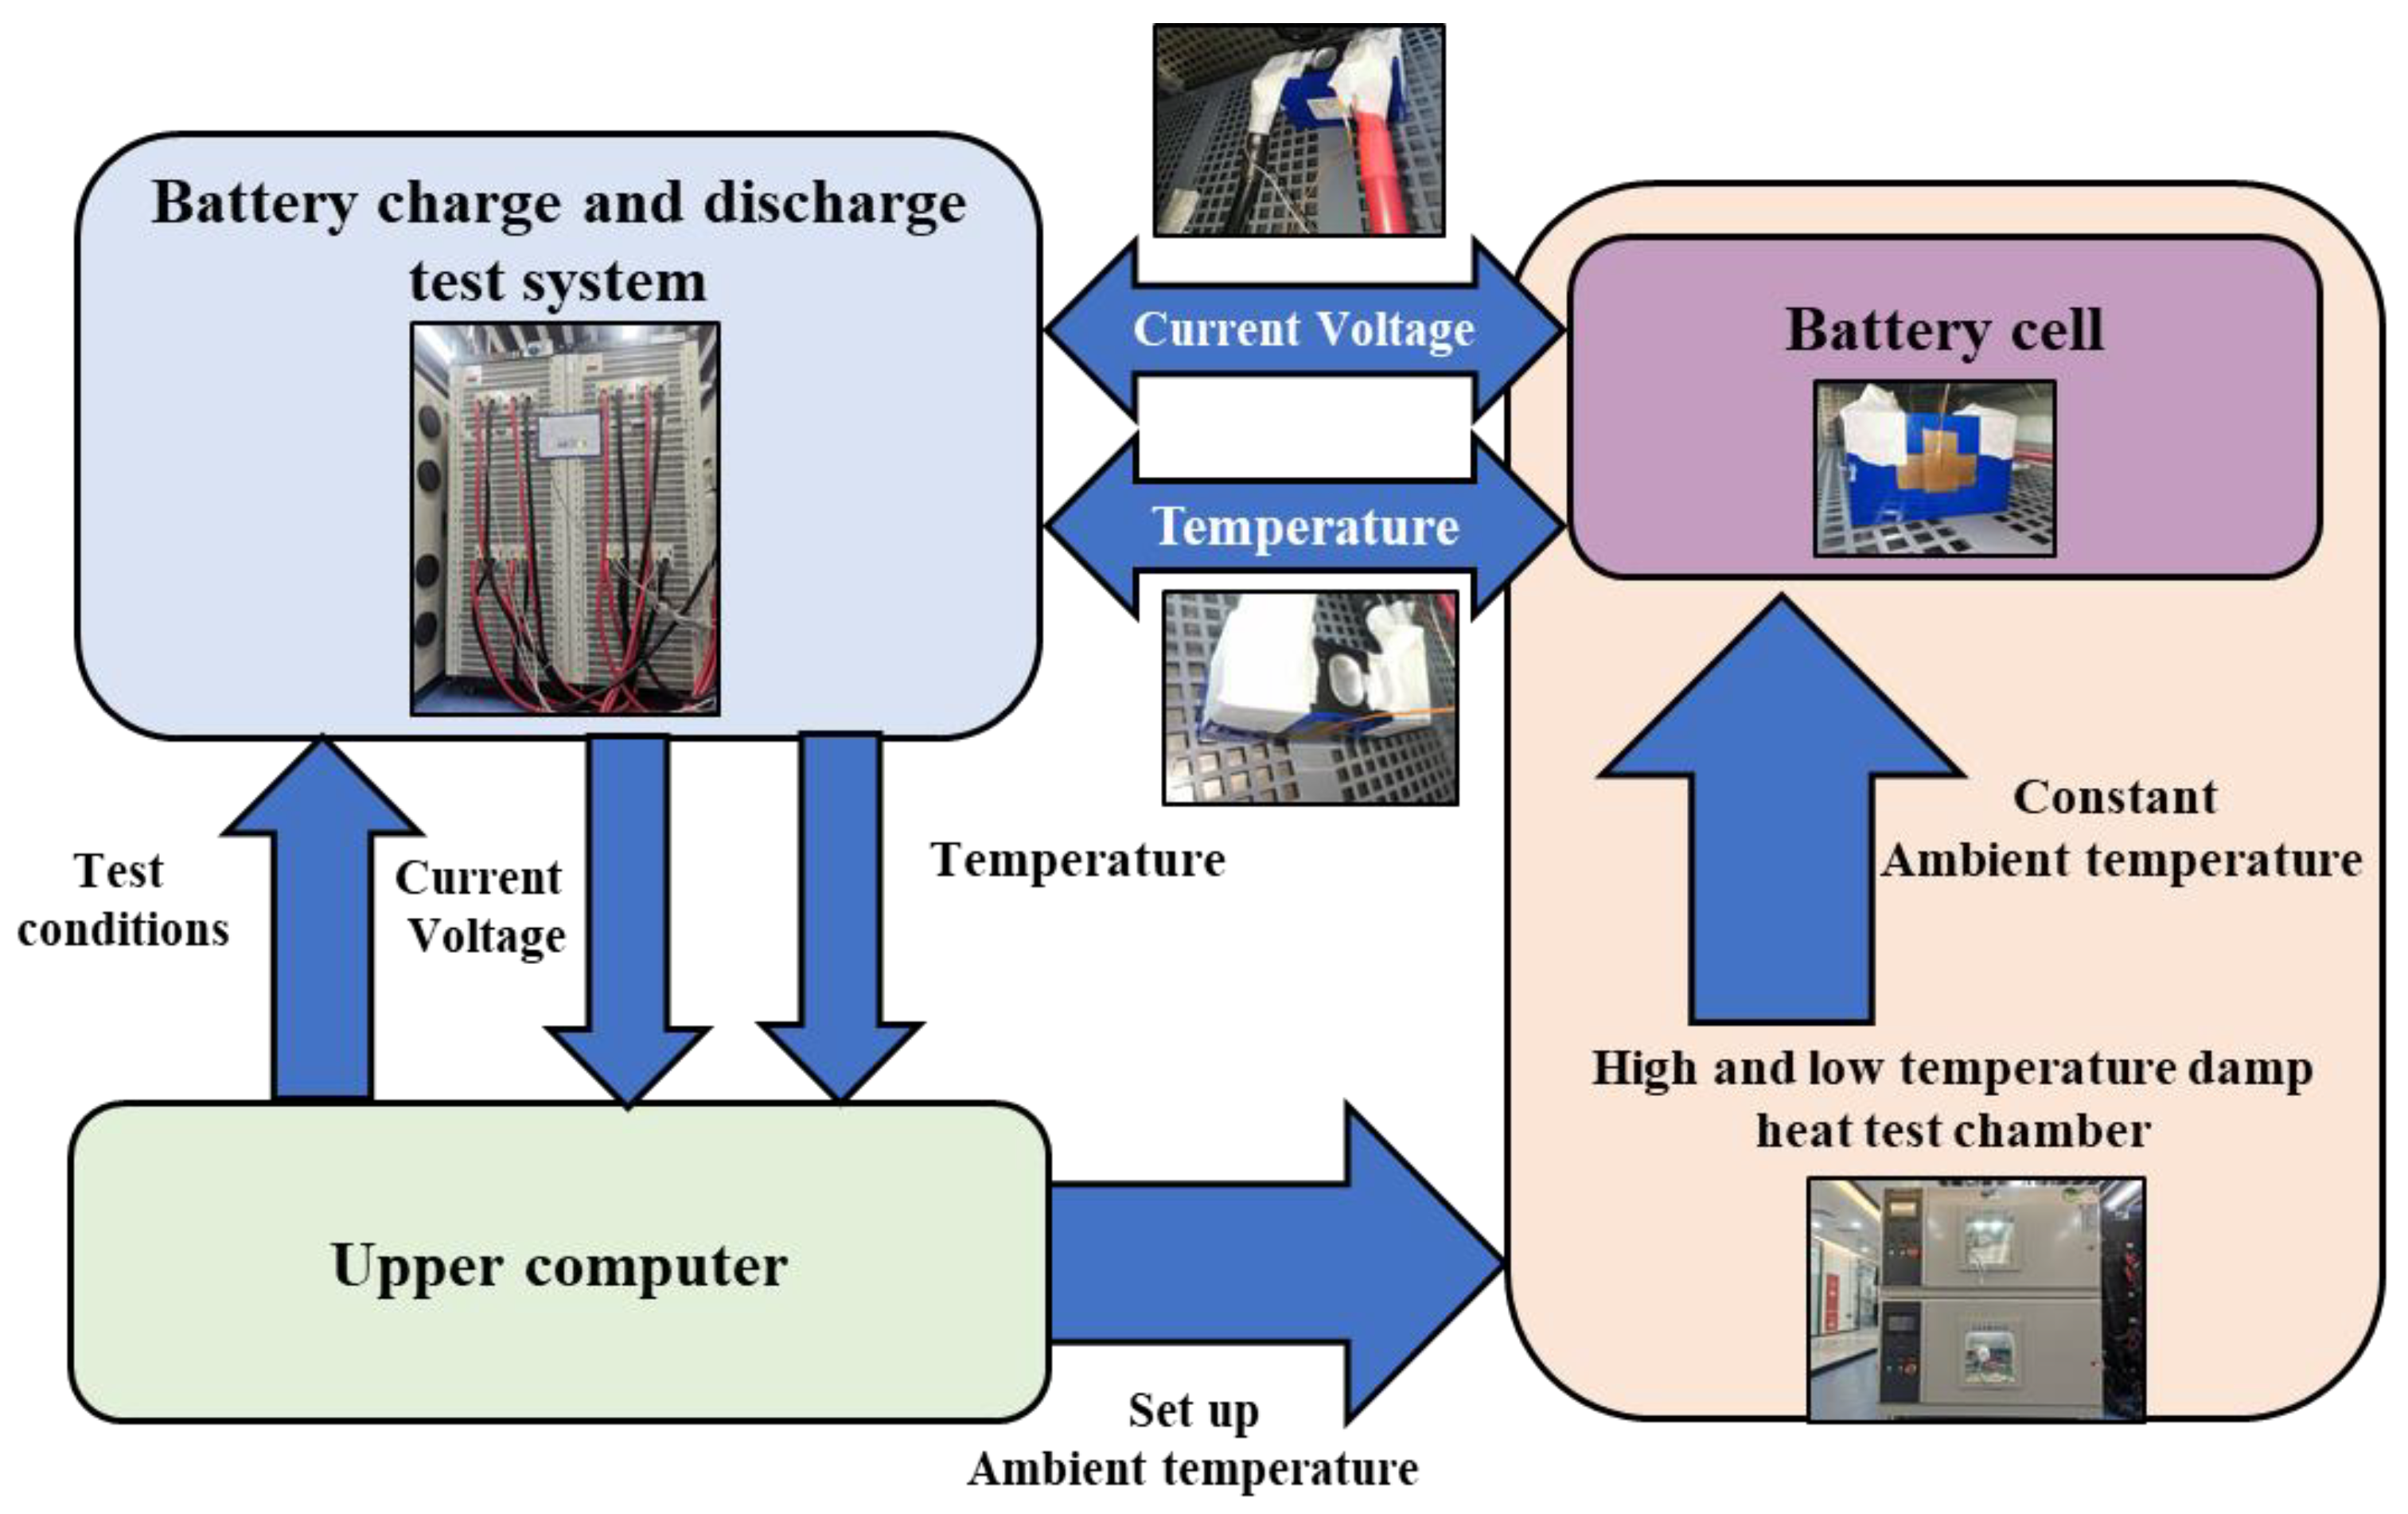
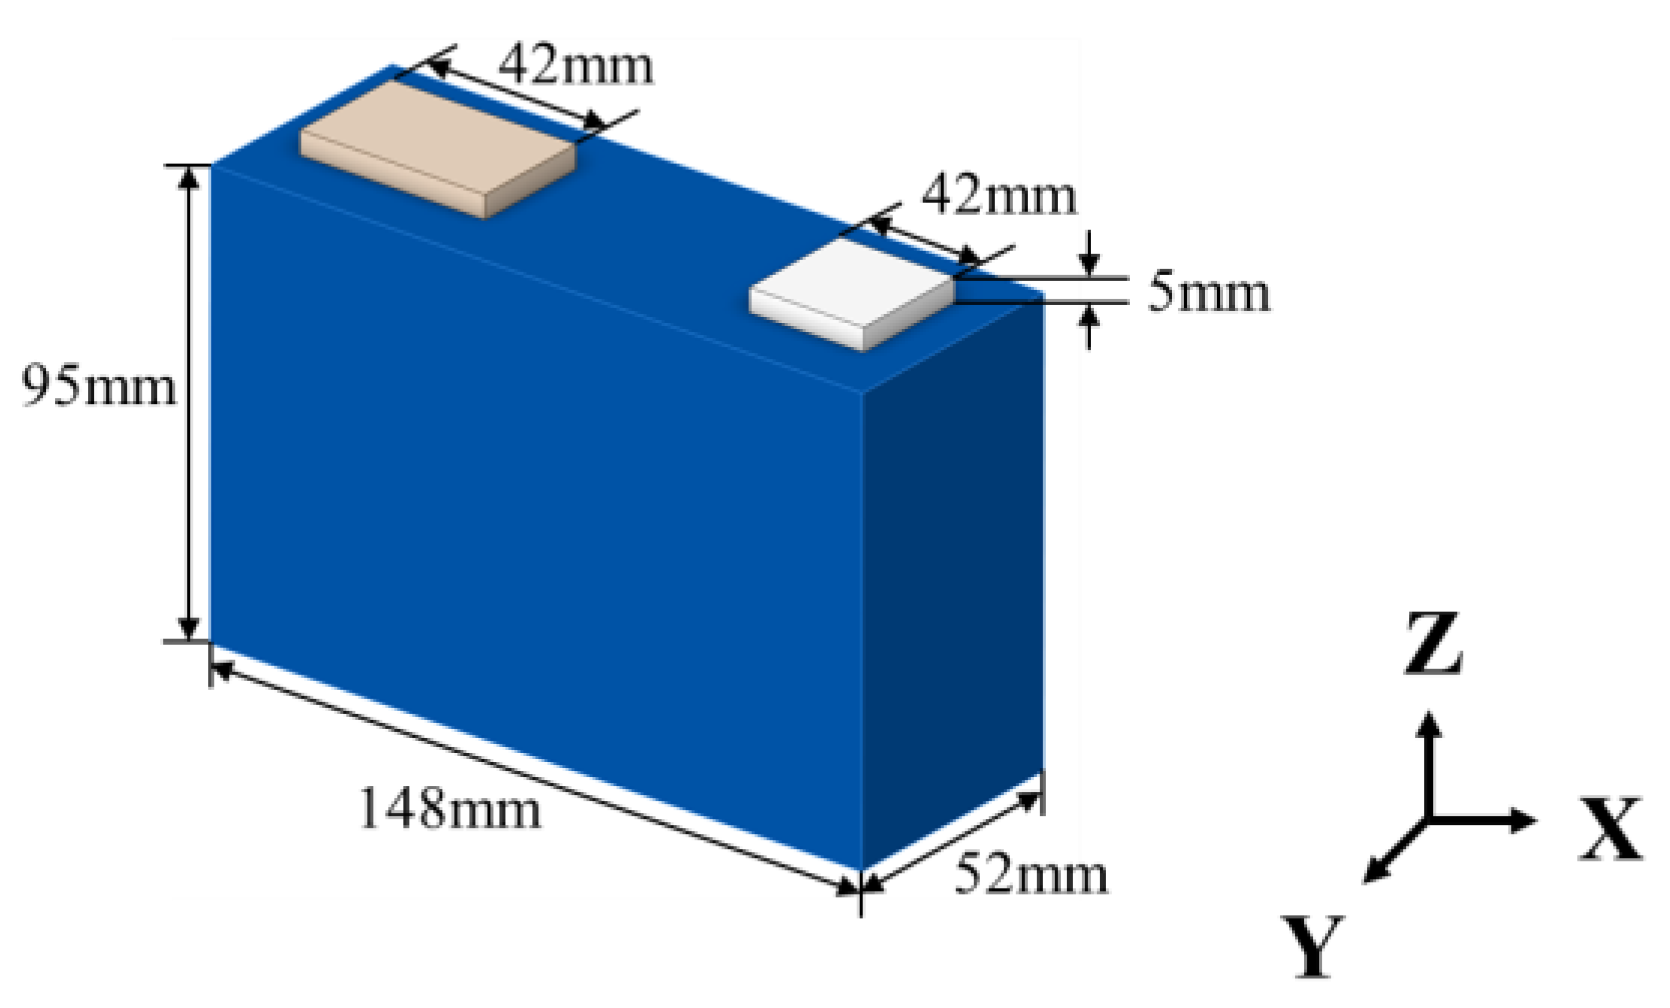
2.1. Details of the Battery and Apparatus

A commercial ternary square shell lithium-ion battery was employed for this study, with graphite as the negative electrode material and Li[Ni8/10CO1/10Mn1/10]O2 as the positive electrode material, and its key characteristics are presented in Table 1.
A battery charge/discharge test system, a high- and low-temperature humidity test chamber, a thermocouple, and other pieces of equipment are among the items used in the battery performance test process. Figure 1 depicts the signal input and output relationships among the various devices, and Table 2 provides detailed information about the equipment. During the actual experiment, each condition was repeated three times to ensure accuracy and consistency.

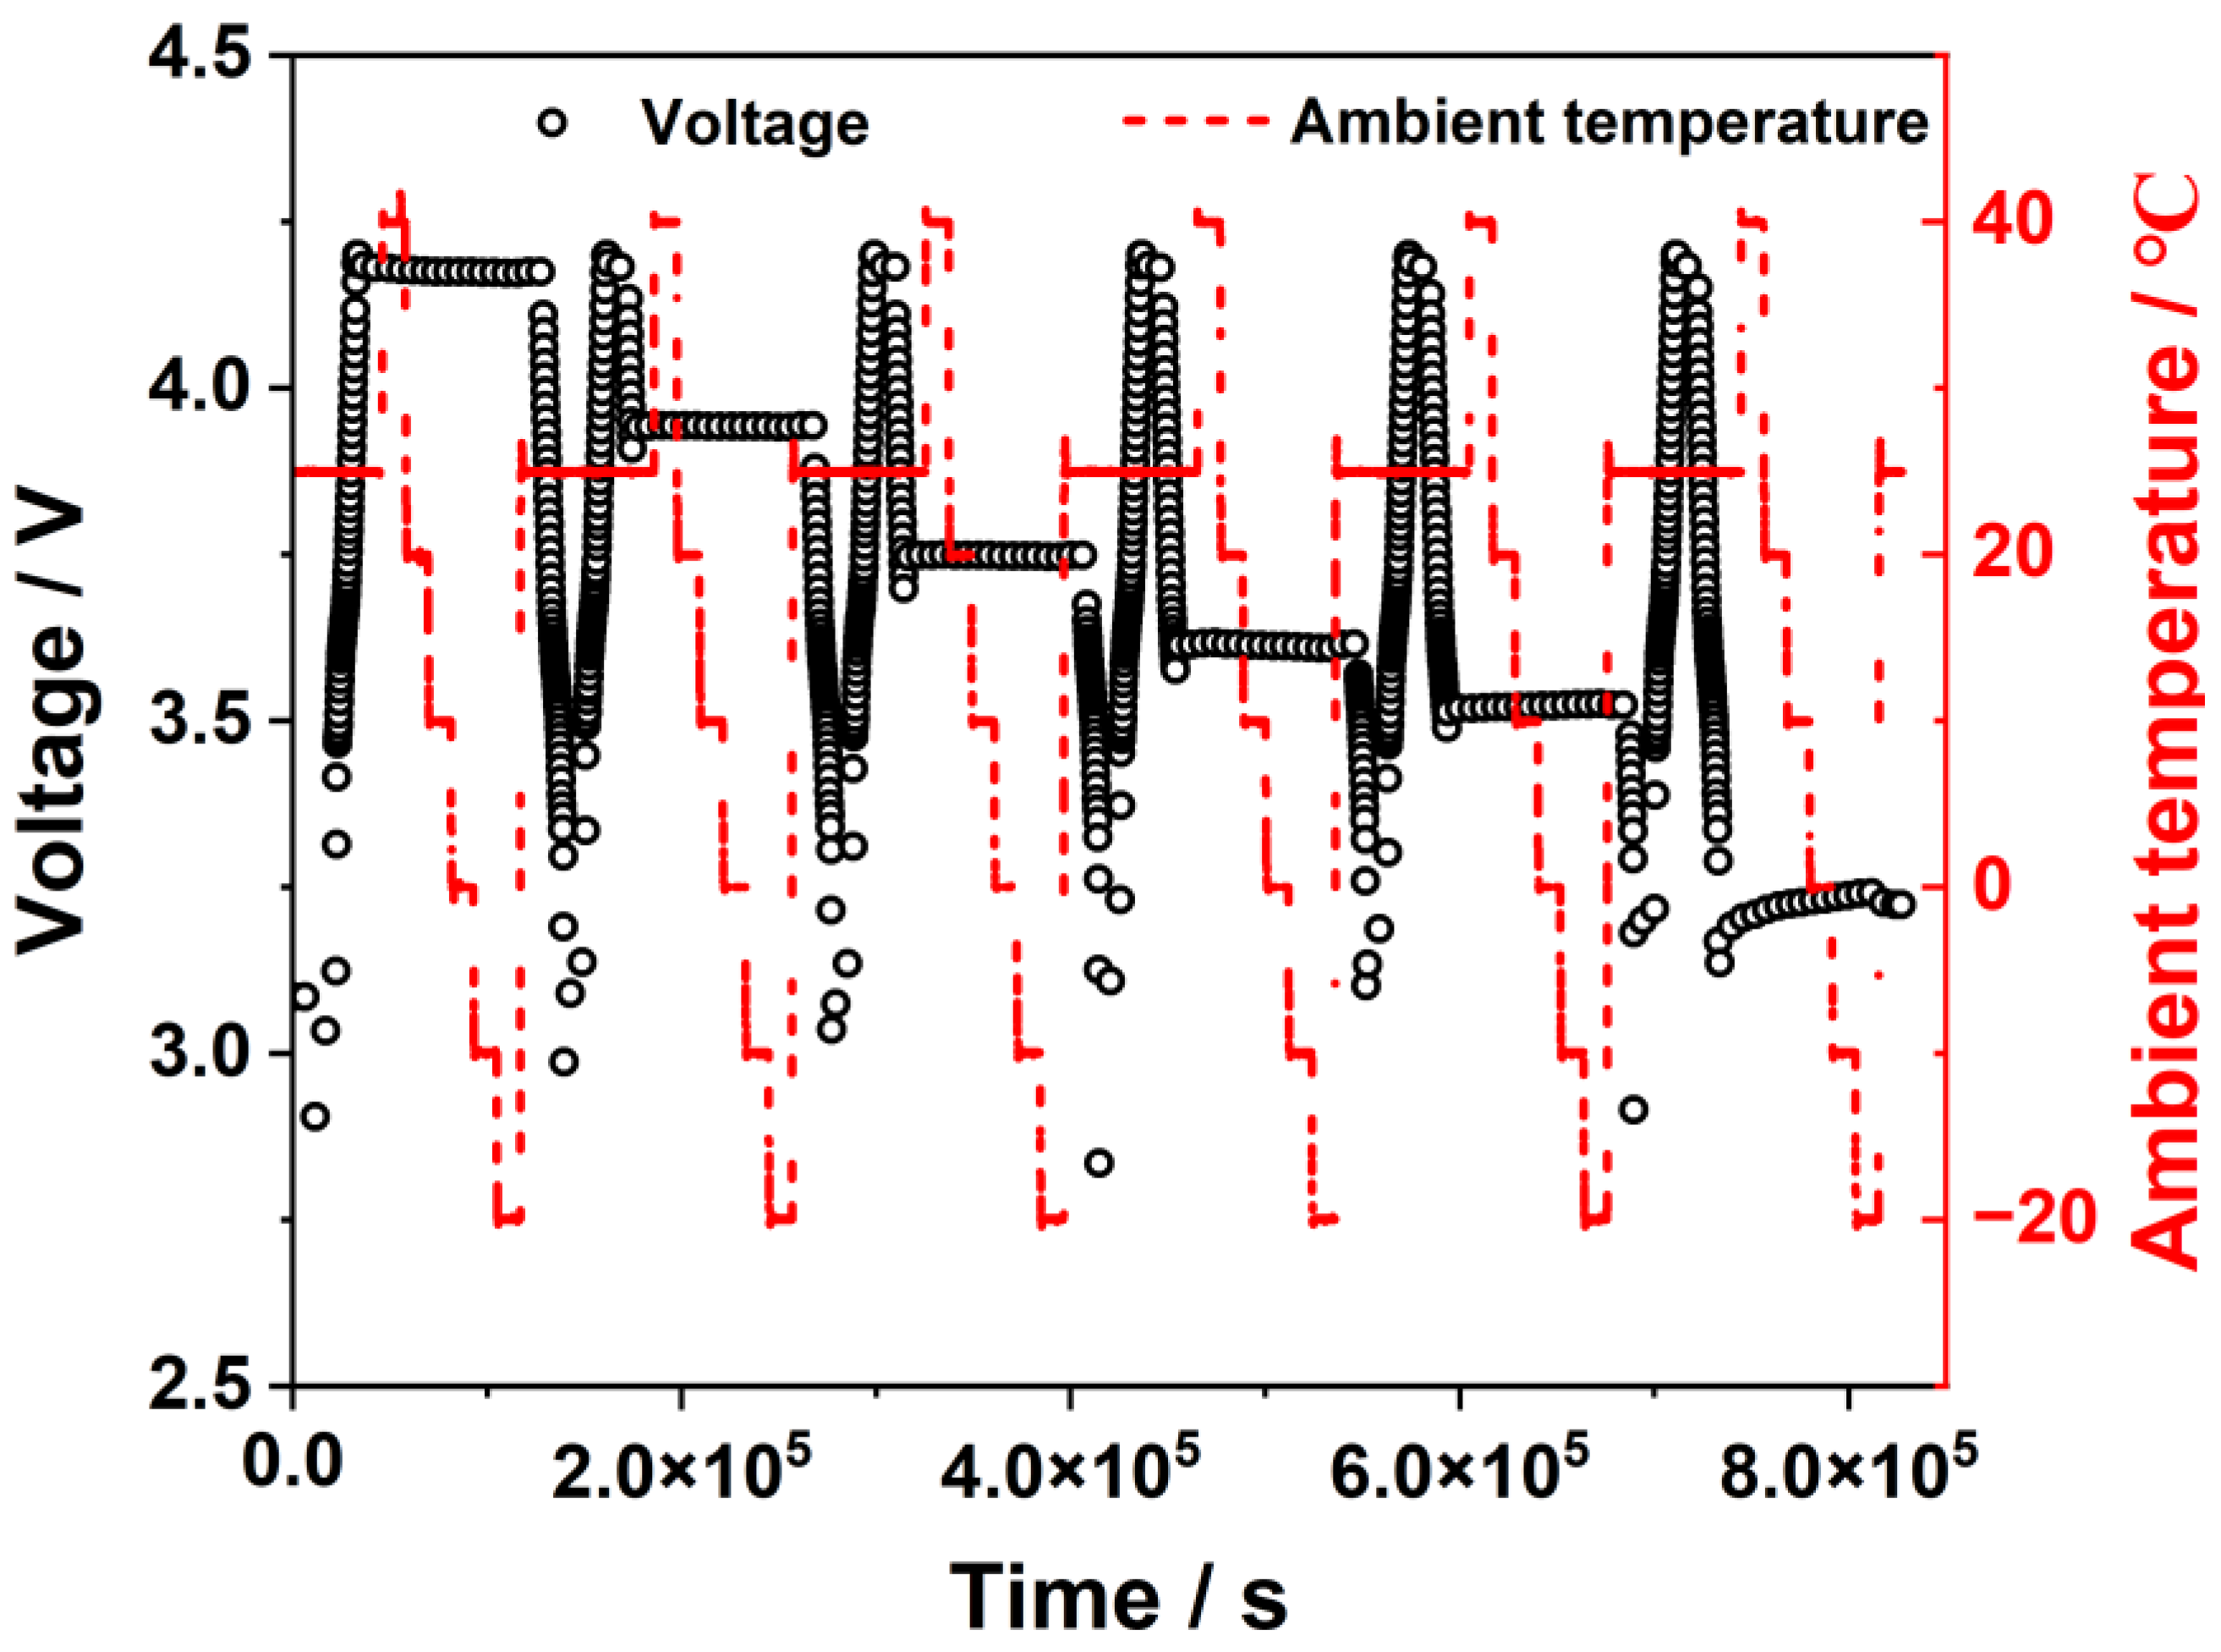
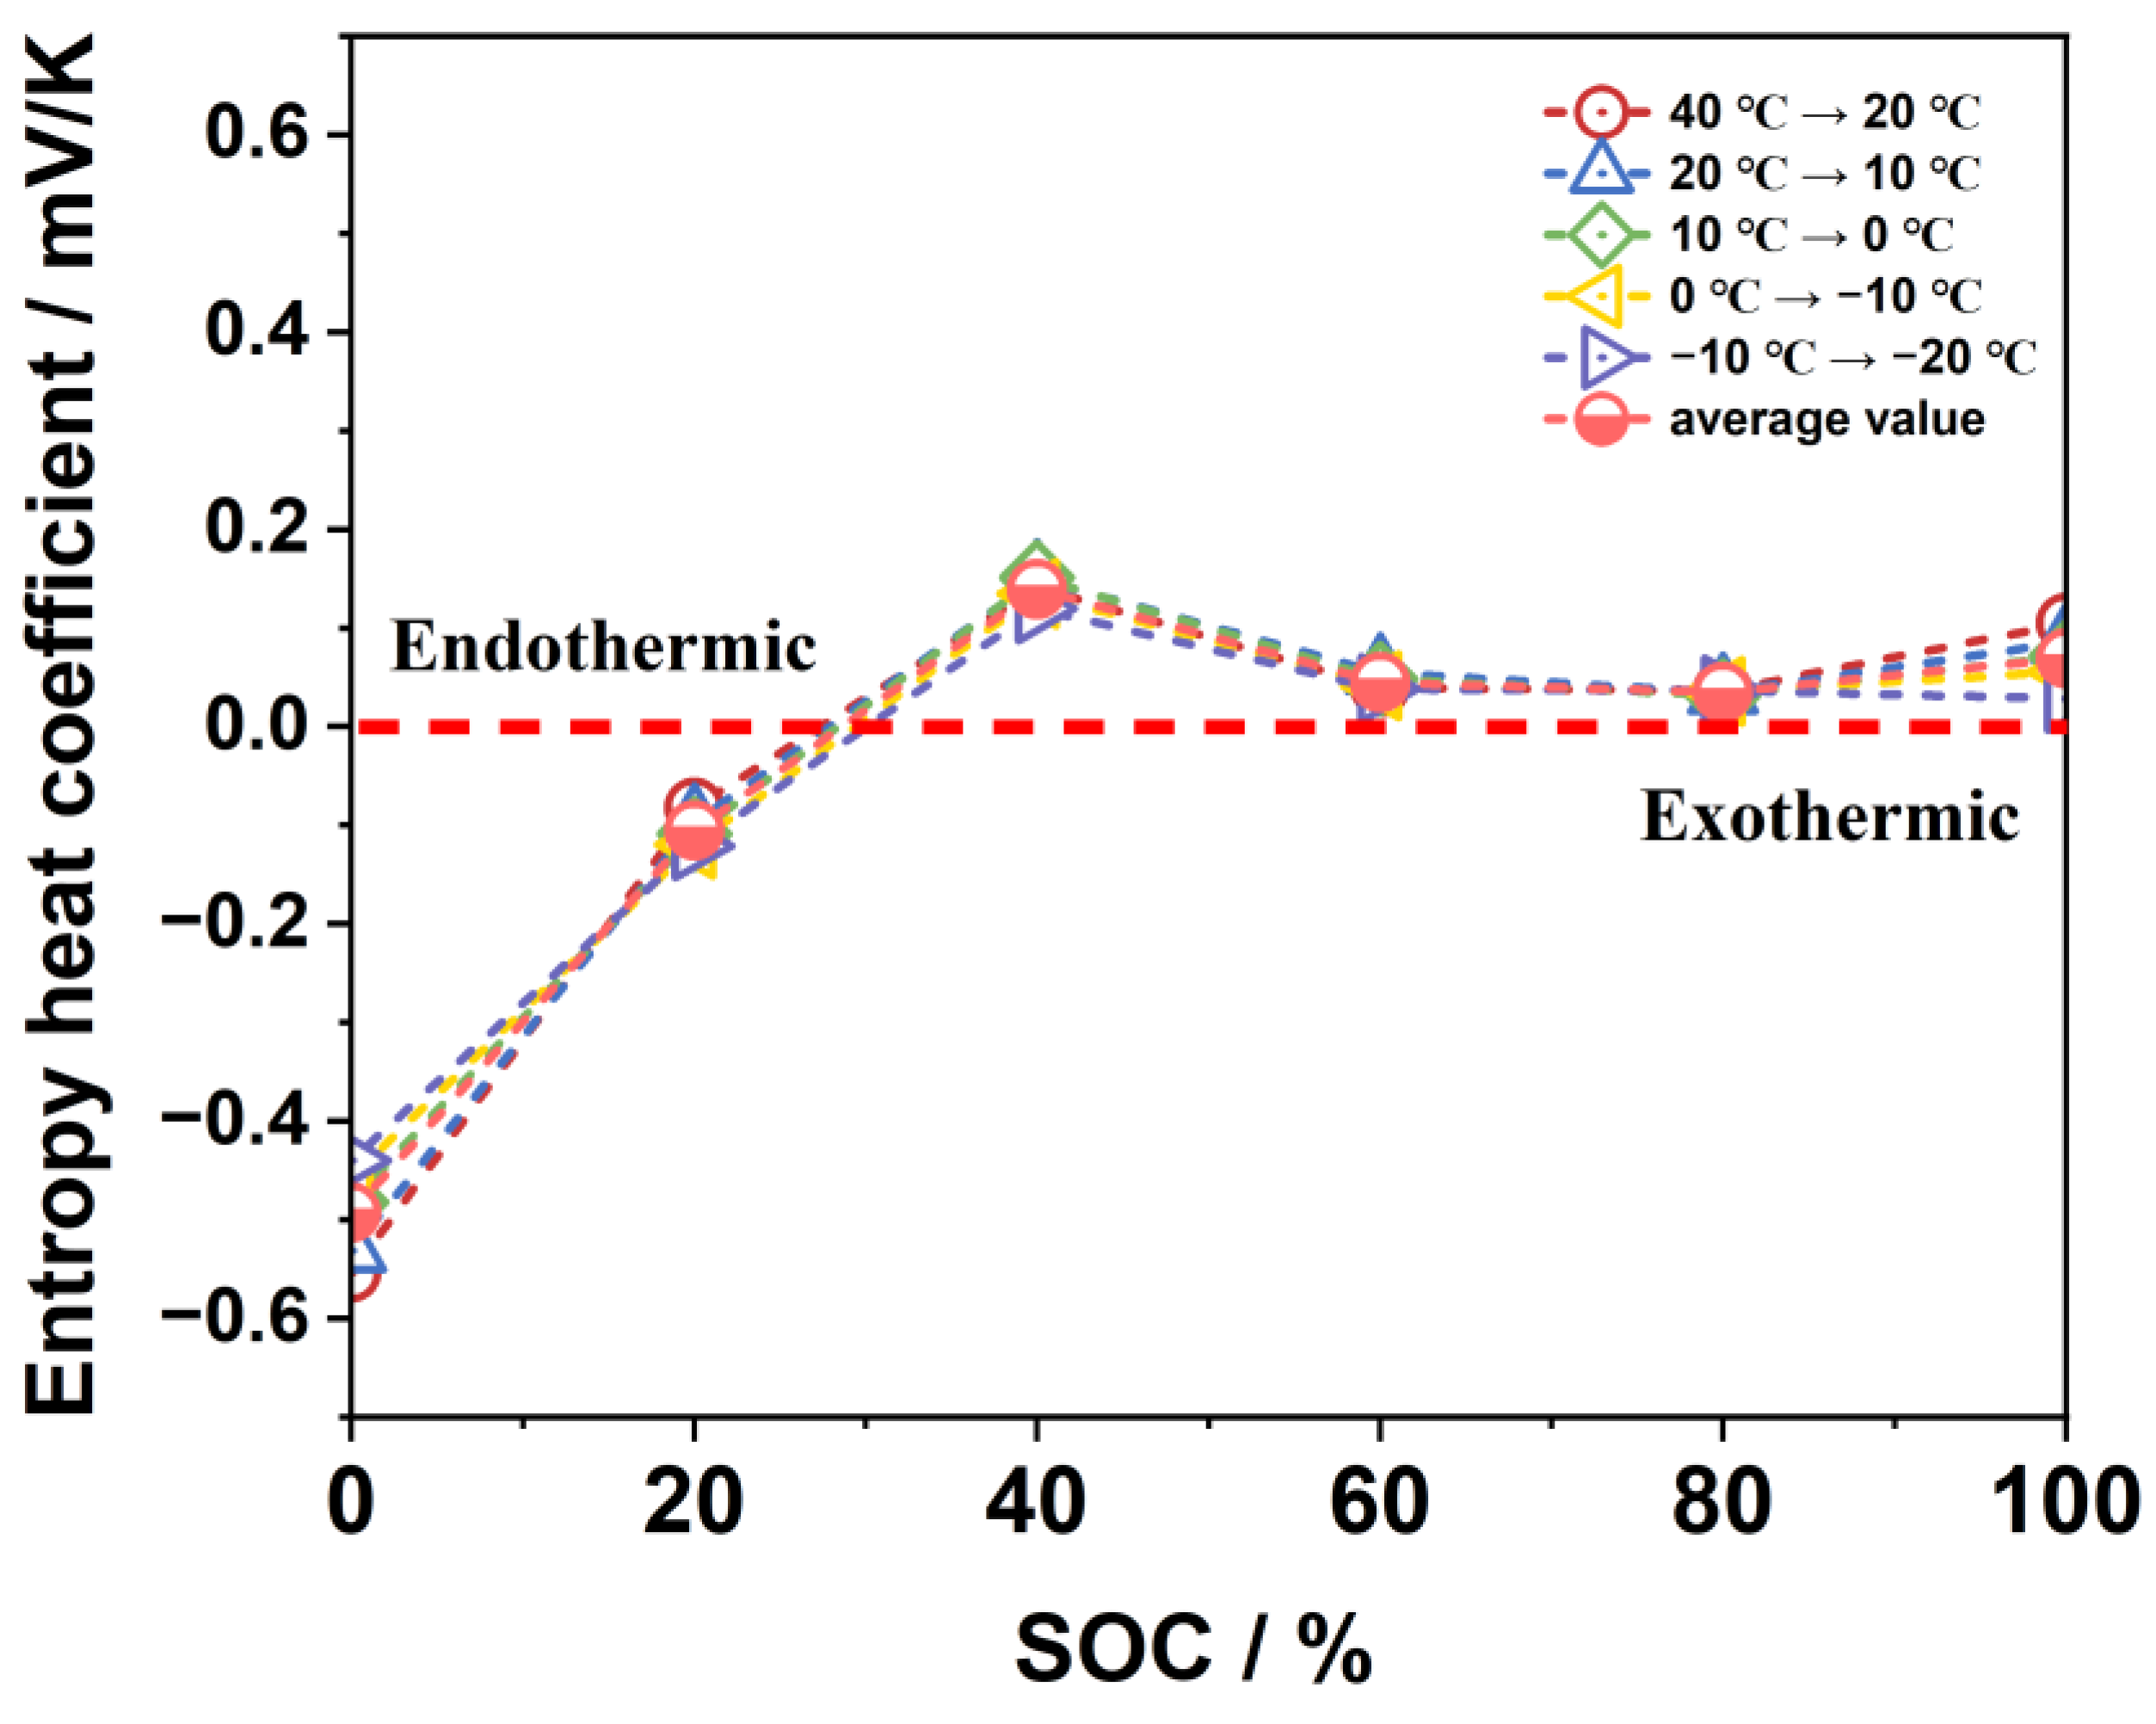
2.2. Determination of the Entropy Heat Coefficient

With varying SOCs, the battery’s reversible entropy heat can exhibit exothermic or endothermic reactions and directly lower the temperature of the battery. Therefore, it has a significant impact on the accuracy of the battery thermal model. As the open-circuit voltage and battery temperature directly affect the entropy heat coefficient, the battery’s open-circuit voltage was measured at varied ambient temperatures and SOCs for the purpose of calculating the entropy heat coefficient. Figure 2 illustrates the relationship between voltage and ambient temperature over time during the entropy heat experiment.
After a long period in a shelving state, the battery’s voltage at this point can be thought of as being equivalent to the open-circuit voltage because it is anticipated that the battery’s internal physicochemical parameters will stabilize at some point. The entropy heat coefficients of various SOCs can be calculated based on the open-circuit voltage change caused by the ambient-temperature change, as shown in Figure 3. With a peak value at about 40% SOC, the entropy heat coefficient exhibits an increase–decrease–increase trend. The entropy heat coefficient is negative when the battery capacity is less than 30% SOC, and the reversible entropy heat term encourages the battery’s overall heat generation, increasing the battery’s heat generation and temperature. When the entropy heat coefficient is positive, the irreversible entropy heat is negative, which restricts the battery’s overall heat generation and results in an endothermic reaction that lowers the temperature of the battery. Thus, the entropy heat coefficient is of great significance for accurately modeling heat generation in power batteries.

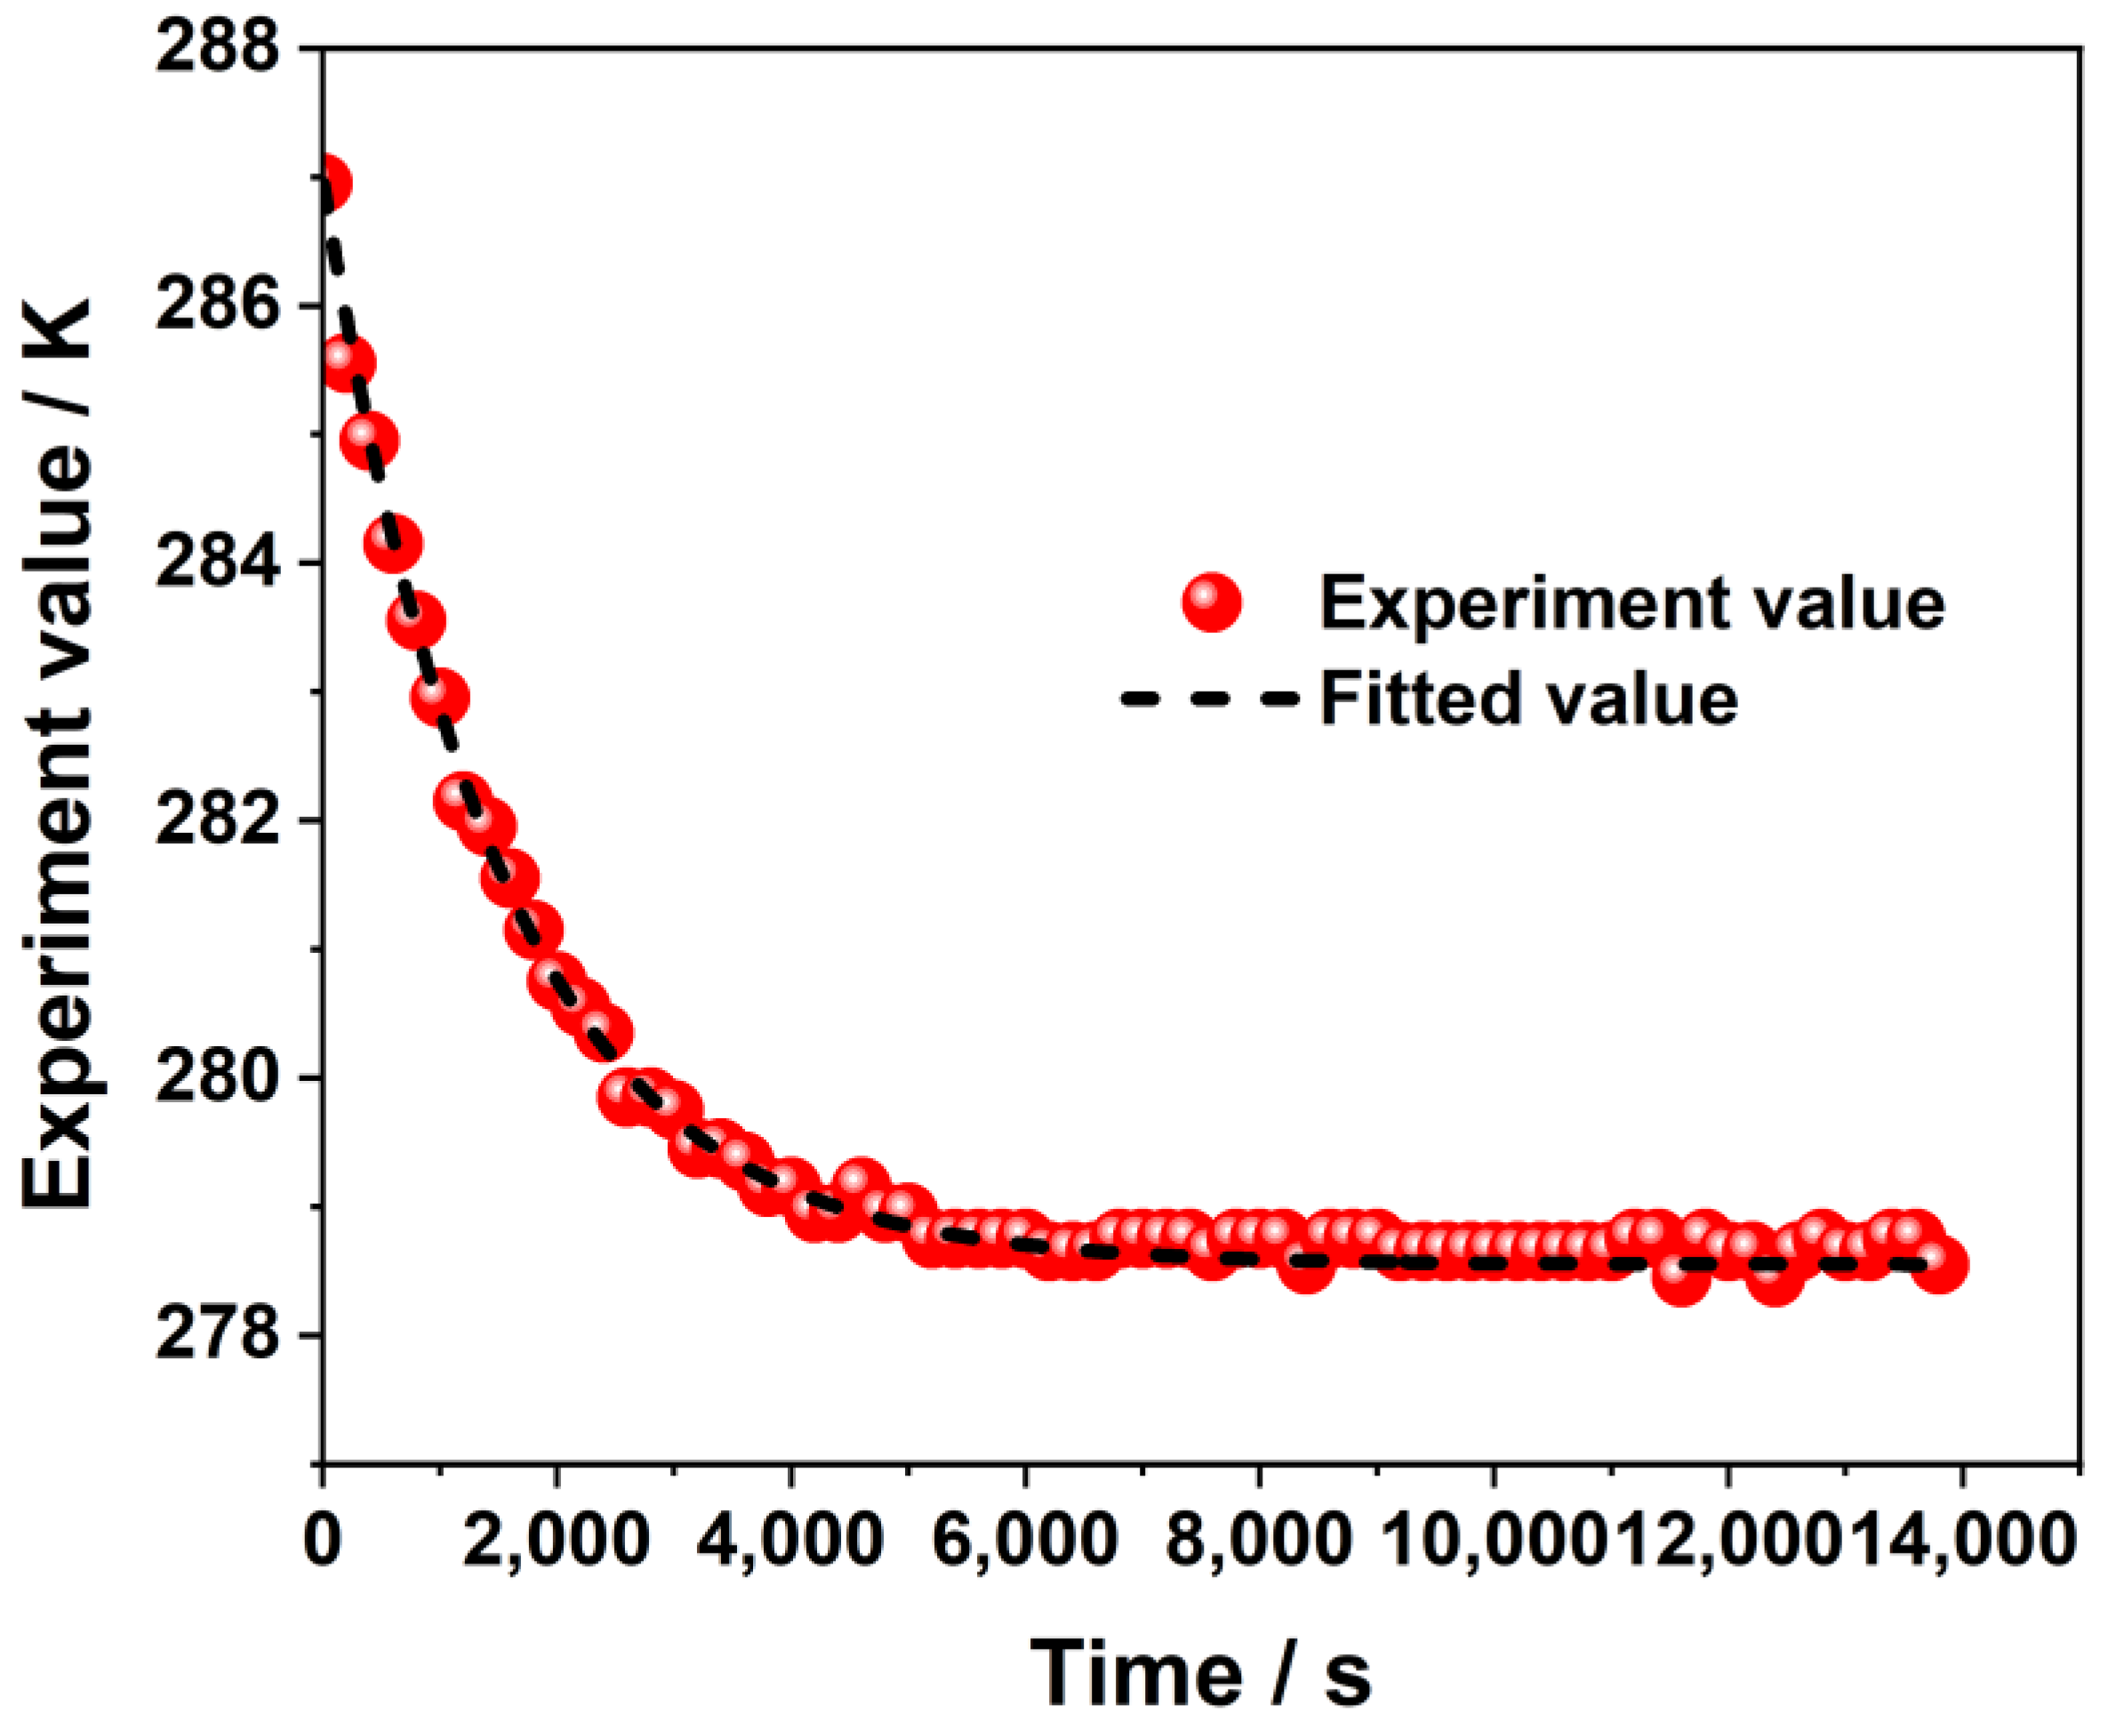
2.3. Convective Heat Transfer Coefficient Test

A crucial factor in effectively simulating the battery’s heat generation is the convective heat transfer coefficient, which depicts the battery’s capacity to exchange heat with its surroundings. To obtain this coefficient, an incubator is used to test the battery’s capacity to adapt to temperature changes. The test involves two stages: a constant current discharge stage and a shelving stage. First, the fully charged battery is discharged to the cutoff voltage under a constant current discharge mode. Second, it is put on hold while the incubator’s temperature is raised to 5 °C until the battery temperature reaches that temperature. In order to determine the battery surface’s convective heat transfer coefficient, the temperature change that occurs during the stocking process is recorded.
The battery temperature can be calculated according to the heat balance equation, shown as Equation (1):
C p m d T d t + h A ( T T ) = 0
where Cp represents the battery-specific heat capacity, J/(kg·K); m represents the battery mass, kg; T is the battery temperature, K; t is the time, s; h is the convective heat transfer coefficient, W/(m2·K); A is the battery surface area, m2; and T is the final stable battery temperature, K.
Equation (1) can be transformed to obtain Equation (2):
h A C p m = 1 T T d T d t
Equation (3) results from the simultaneous integration of both sides.
0 t h A C p m d t = T 0 T 1 T T d T
Equation (4) can be formulated as a result:
T = T + ( T 0 T ) e h A C p m t
Figure 4 illustrates the temperature change in the battery when placed in a constant-temperature chamber at 5 °C after 1C-rate discharge at 25 °C. A curve fitting using Equation (4) reveals that h is equal to 20.6 W/(m²·K).

2.4. Additional Thermophysical and Physical Parameters

There are numerous components that make up the internal structure of lithium-ion batteries, including separators, current collectors, positive and negative electrode materials, and others, which can number in hundreds. However, current internal lithium-ion battery models do not consider the layers of these materials. Instead, it is assumed that the internal materials are homogeneous and that the physical properties of each layer remain constant. A weighted average method is used to calculate the battery’s average specific heat capacity and thermal conductivity. The necessary thermophysical parameter values are presented in Table 3.

3. Construction of a Model of the Electric–Thermal Connection

This part involves the use of a pulse discharge test scheme to identify and collect the electrical parameters of the second-order RC model, which is based on the fundamental principles of the equivalent circuit model. Examination of the connection between the SOC, surrounding temperature, and the variation rules of open-circuit voltage, ohmic resistance, polarized internal resistance, and polarized capacitance was performed. The electric–thermal coupling model for a battery module was then created using COMSOL 5.5 software, and the simulation model was validated via comparing it with the results of the experiment.

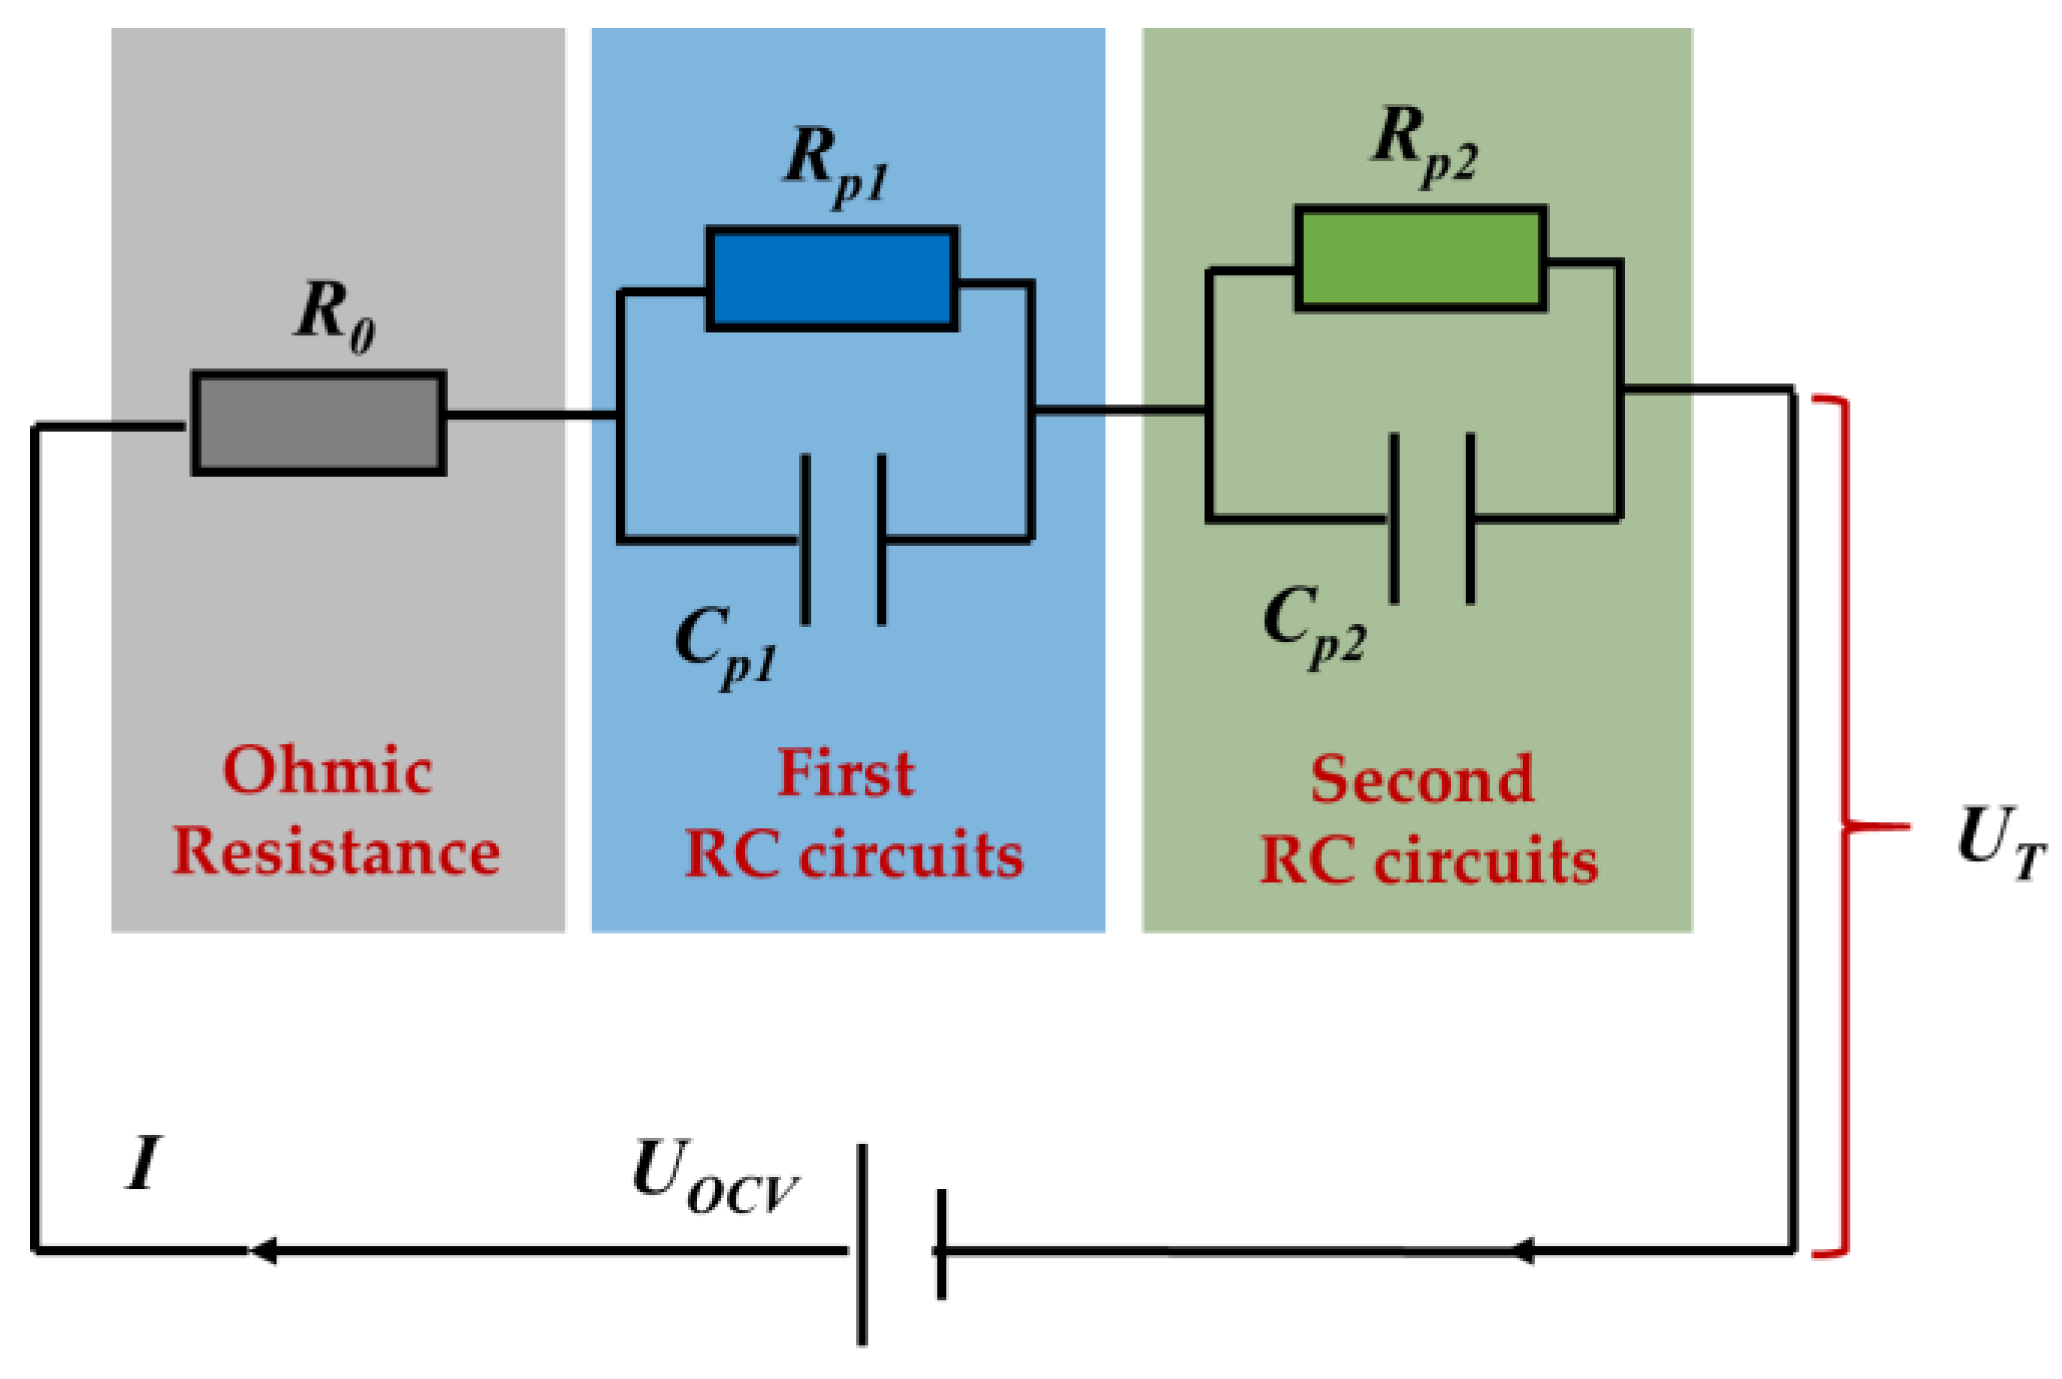
3.1. Battery Electrical Model

The equivalent circuit model that uses electrical components, such as resistance and capacitance, has better overall performance compared with the electrochemical model in terms of model complexity, prediction accuracy, and response time. Hence, it is widely employed in battery management systems. The electrical characteristics of the battery are illustrated in this paper using a second-order RC model. The battery’s polarization characteristics can be accurately represented by the model’s straightforward structure, exhibiting its nonlinear properties. As shown in Figure 5, the second-order RC equivalent circuit model consists of an ideal voltage source, two RC circuits, and an ohmic resistance.
According to Kirchhoff’s voltage law (KVL) and Kirchhoff’s current law (KCL), Equations (5)–(7) can be derived:
d U 1 ( t ) d t = I ( t ) C 1 U 1 ( t ) R 1 C 1
d U 2 ( t ) d t = I ( t ) C 2 U 2 ( t ) R 2 C 2
U T ( t ) = U O C V + I ( t ) R 0 + U 1 ( t ) + U 2 ( t )
In these equations, UOCV represents the open-circuit voltage of the battery, V; R0 is the battery’s internal resistance, Ω; R1 and R2 denote the resistance related to concentration and electrochemical polarization, Ω; C1 and C2 are the capacitance associated with concentration and electrochemical polarization, C; U1 and U2 denote the voltages across the corresponding RC components, V; UT is the terminal voltage of the battery, V; and I represents the current passing through the battery, A, with the convention of positive for charging and negative for discharging.
If the time constant τ1 = R1C1, τ2 = R2C2, Equations (5) and (6) can be obtained as Equations (8) and (9), respectively:
U 1 ( t ) = U 1 ( 0 ) e t τ 1 + I ( t ) R 1 ( 1 e t τ 1 )
U 2 ( t ) = U 2 ( 0 ) e t τ 2 + I ( t ) R 2 ( 1 e t τ 2 )
In these equations, U1(0) and U2(0) respectively represent the voltages across the two ends of the corresponding RC circuits at the initial time, V.
Hence, when the current remains constant, the voltage curve of a lithium-ion battery adheres to Equation (10):
U T ( t ) = U O C V I R 0 U 1 ( 0 ) e t τ 1 I R 1 ( 1 e t τ 1 ) U 2 ( 0 ) e t τ 2 I R 2 ( 1 e t τ 2 )
The above-mentioned electrical parameters change with the battery state of charge (SOC), which is also called residual power and is the ratio of the remaining capacity of the battery after a period of discharge to the rated capacity of the battery in the fully charged state. SOC = 0% means fully discharged, and SOC = 100% means fully charged, and the SOC can be calculated using Equation (11):
SOC = ( 1 η 0 t I d t Q ) × 100 %
where η is the discharge efficiency of the battery, %; and Q is the rated capacity of the battery, Ah. I is the current flowing through the battery, A, stipulating that discharging is negative and charging is positive.

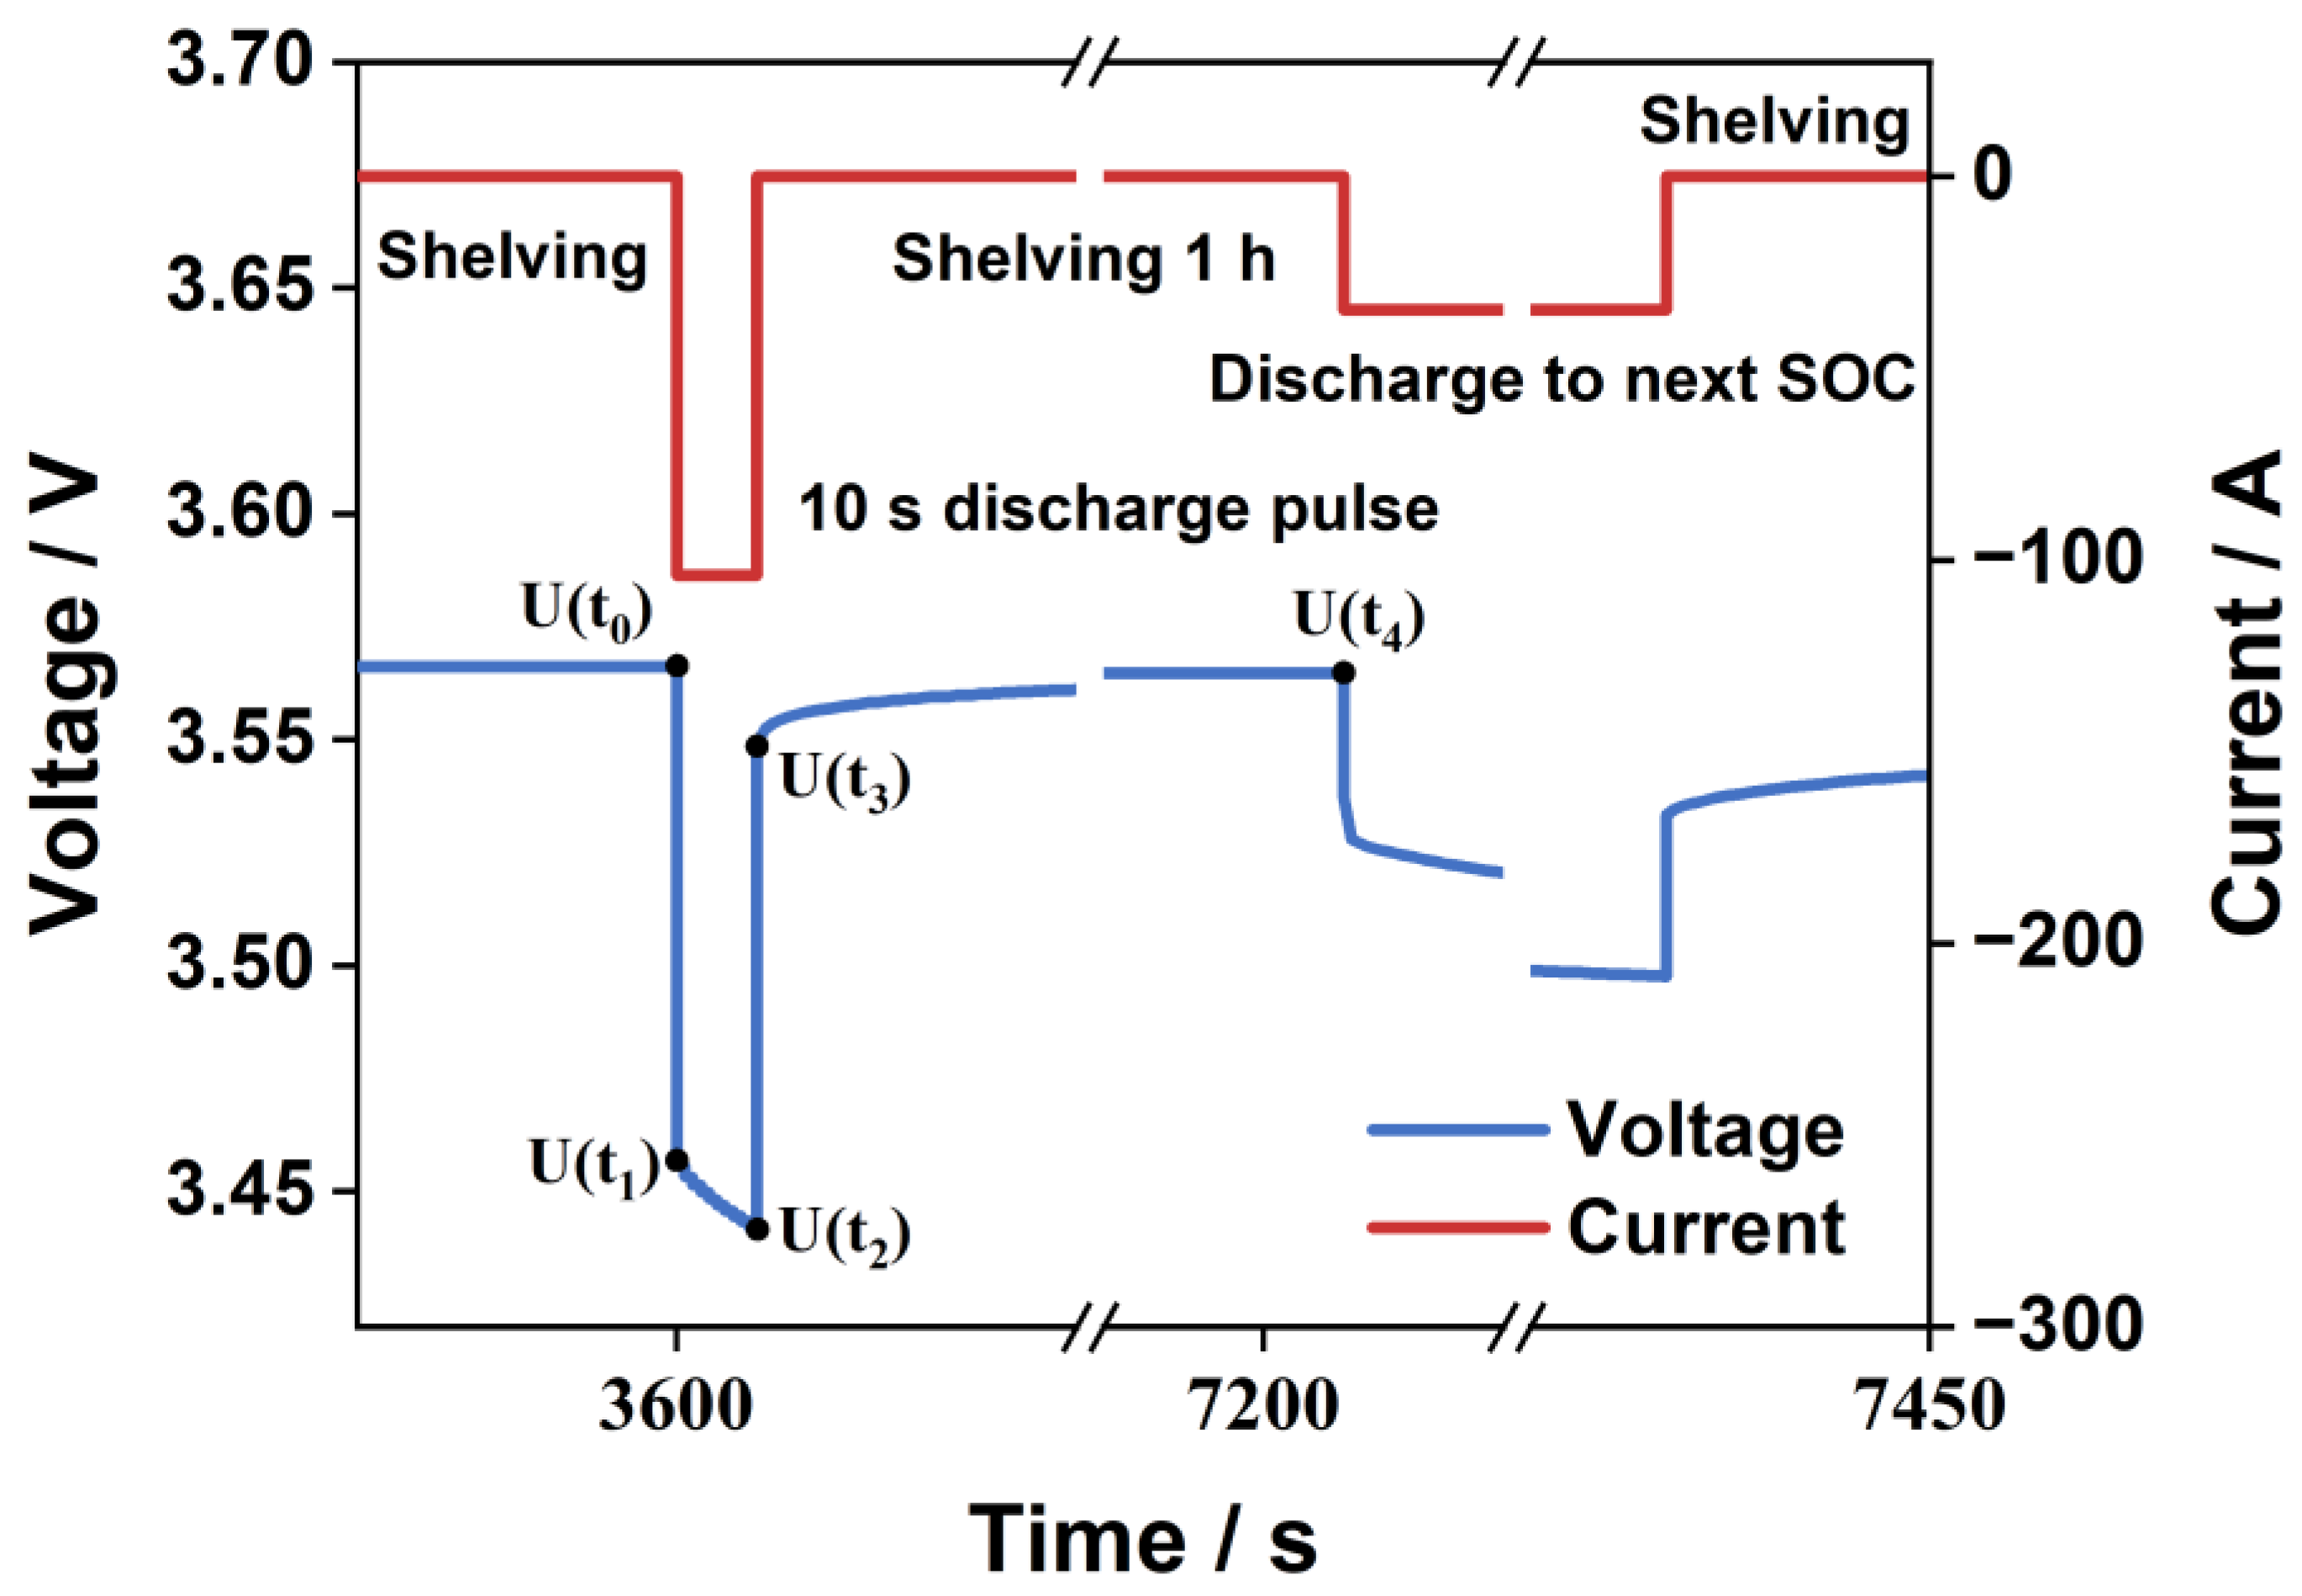
Electrical Parameter Identification Method

  • Determination of the open-circuit voltage in the initial shelving stage:
Figure 6 illustrates the analysis of the battery terminal voltage response properties during a single-pulse discharge. Since the battery has been left for a long time before the single-pulse discharge, the open-circuit voltage and terminal voltage of the battery are typically thought to be numerically equivalent. The battery terminal voltage U(t0) is therefore taken to be the open-circuit voltage UOCV in accordance with the results of the pulse discharge test.
2.
Calculation of the ohmic resistance via voltage mutation:
Equation (12) can be used to compute the ohmic resistance value in the state of charge:
R 0 = ( U ( t 0 ) U ( t 1 ) ) + ( U ( t 3 ) U ( t 2 ) ) 2 I
Among these terms, U(t0), U(t1), U(t2), and U(t3) are the battery terminal voltages at different times t. I represents the absolute value of the current during the pulse current application process, and the state of charge of the battery does not change at the instant the current is applied or withdrawn.
3.
Identification of RC parameters in the shelving stage:
From t3 to t4 is the shelving period, and the battery terminal voltage meets the zero-input response condition during this period, as shown in Equation (13):
U T = U O C V U 1 ( t 3 ) e t τ 1 U 2 ( t 3 ) e t τ 2
Among these terms, U1(t3) and U2(t3) represent the voltages at both ends of the RC circuit corresponding to the moment when the current is removed. The expressions are shown in Equations (14) and (15):
U 1 ( t 3 ) = I R 1
U 2 ( t 3 ) = I R 2
In the period between t3 and t4 during a pulse discharge, the least square method is used to obtain the parameters U1(t3), U2(t3), t1, and t2 from the voltage–time relationship. C1 and C2 are determined from the relationship between the resistance and capacitance parameters and the time constant. Given the SOC remains unchanged before and after the pulse discharge, the open-circuit voltage recorded before the discharge is taken as the SOC after the discharge, and the values of UOCV, R0, R1, R2, C1, and C2 can be obtained for that SOC. These parameters are crucial in accurately describing the battery’s electrical characteristics by using the second-order equivalent circuit model. Among them, R0, R1, R2, C1, and C2 are closely related to the SOC and are affected by changes in ambient temperature. Thus, parameter identification is necessary under different SOCs and temperature conditions.

3.2. The Battery’s Thermal Model

3.2.1. Battery Heat Generation Model

Most of the heat generation inside a lithium-ion battery comes from reversible entropy heat Qr, ohmic heat Qj, polarization heat Qp, and side reaction heat Qs.
(1) Reversible entropy enthalpy Qr: The heat generated during the reversible insertion and extraction of lithium ions between the positive and negative electrodes in a lithium-ion battery during normal charging and discharging processes. Its calculation formula is given in Equation (16):
Q r = I T Δ S n F
where I represents the charge–discharge current, A; T is the operating temperature of the battery, K; ΔS is the change in entropy before and after the chemical reaction, J/(mol·K); n is the quantity of electron material exchanged in the chemical reaction process, mol; and F is the Faraday constant with a numerical value of 96,484.5 C/mol.
(2) Ohmic heat Qj: This heat arises from the presence of ohmic resistance in the internal materials of the battery, generated as electrons or lithium ions pass through the battery’s internal materials. Because this heat follows Ohm’s law, it can be calculated using Equation (17):
Q j = I 2 R j
where R0 represents the ohmic internal resistance of the battery.
(3) Polarization heat Qp: During the charging and discharging of a battery, polarization occurs at the electrode surfaces, leading to a deviation between the working voltage and the open-circuit voltage of the battery. The heat generated by this voltage drop is referred to as polarization heat. Polarization heat can be equivalently viewed as the heat generated by a polarization internal resistance, as expressed in Equation (18):
Q p = I 2 R p
where Rp represents the polarization internal resistance of the battery.
(4) Side reaction heat: The heat generated by additional reactions occurring within the battery’s interior, Qs.
However, side reactions typically do not occur during normal charging or discharging under normal temperature conditions. Therefore, when calculating the total heat generation, only ohmic heat, polarization heat, and reversible entropy heat need to be taken into account, as shown in Equation (19):
Q t o t a l = Q j + Q p + Q r
The calculating model that is most frequently employed is the Bernardi battery heat generation rate model [33], which presupposes that the battery’s internal heat supply is steady and uniform, as indicated in Equation (20):
q = Q t o t a l V b = 1 V b [ ( I 2 R p + I 2 R j ) + I T d E d T ] = 1 V b [ ( E U T ) + I T d E d T ]
where Qtotal is the total heat generation, W; q is the battery volume heat generation rate, W/m3; I is the battery charge and discharge current, A; Vb is the battery volume, m3; E is the battery electromotive force whose value is equal to the open-circuit voltage, V; UT is the battery operating voltage, V; and T is the battery temperature, K.

3.2.2. Battery Heat Transfer Model

Heat conduction and heat convection are the primary modes of heat transfer for lithium-ion batteries during typical operation. However, heat radiation is typically negligible due to the low temperatures involved.
The interior of the battery follows the basic equation of solid heat transfer, as shown in Equation (21):
ρ C p T t = ( λ T ) + q
where ρ is the battery density, kg/m3; Cp is the specific heat capacity of the battery, J/(kg·K); λ is the thermal conductivity of the battery, W/(m·K); and q is the volumetric heat generation rate of the battery, W/m3.
When the external medium is air, coolant, or other fluids, Equation (22) can be used to describe the convective heat transfer process on the exterior surface of the battery:
λ T = h ( T s u r f T a m b )
where h is the surface convective heat transfer coefficient, W/(m2·K); Tamb is the temperature of the external heat transfer medium, K; and Tsurf is the battery surface temperature, K.

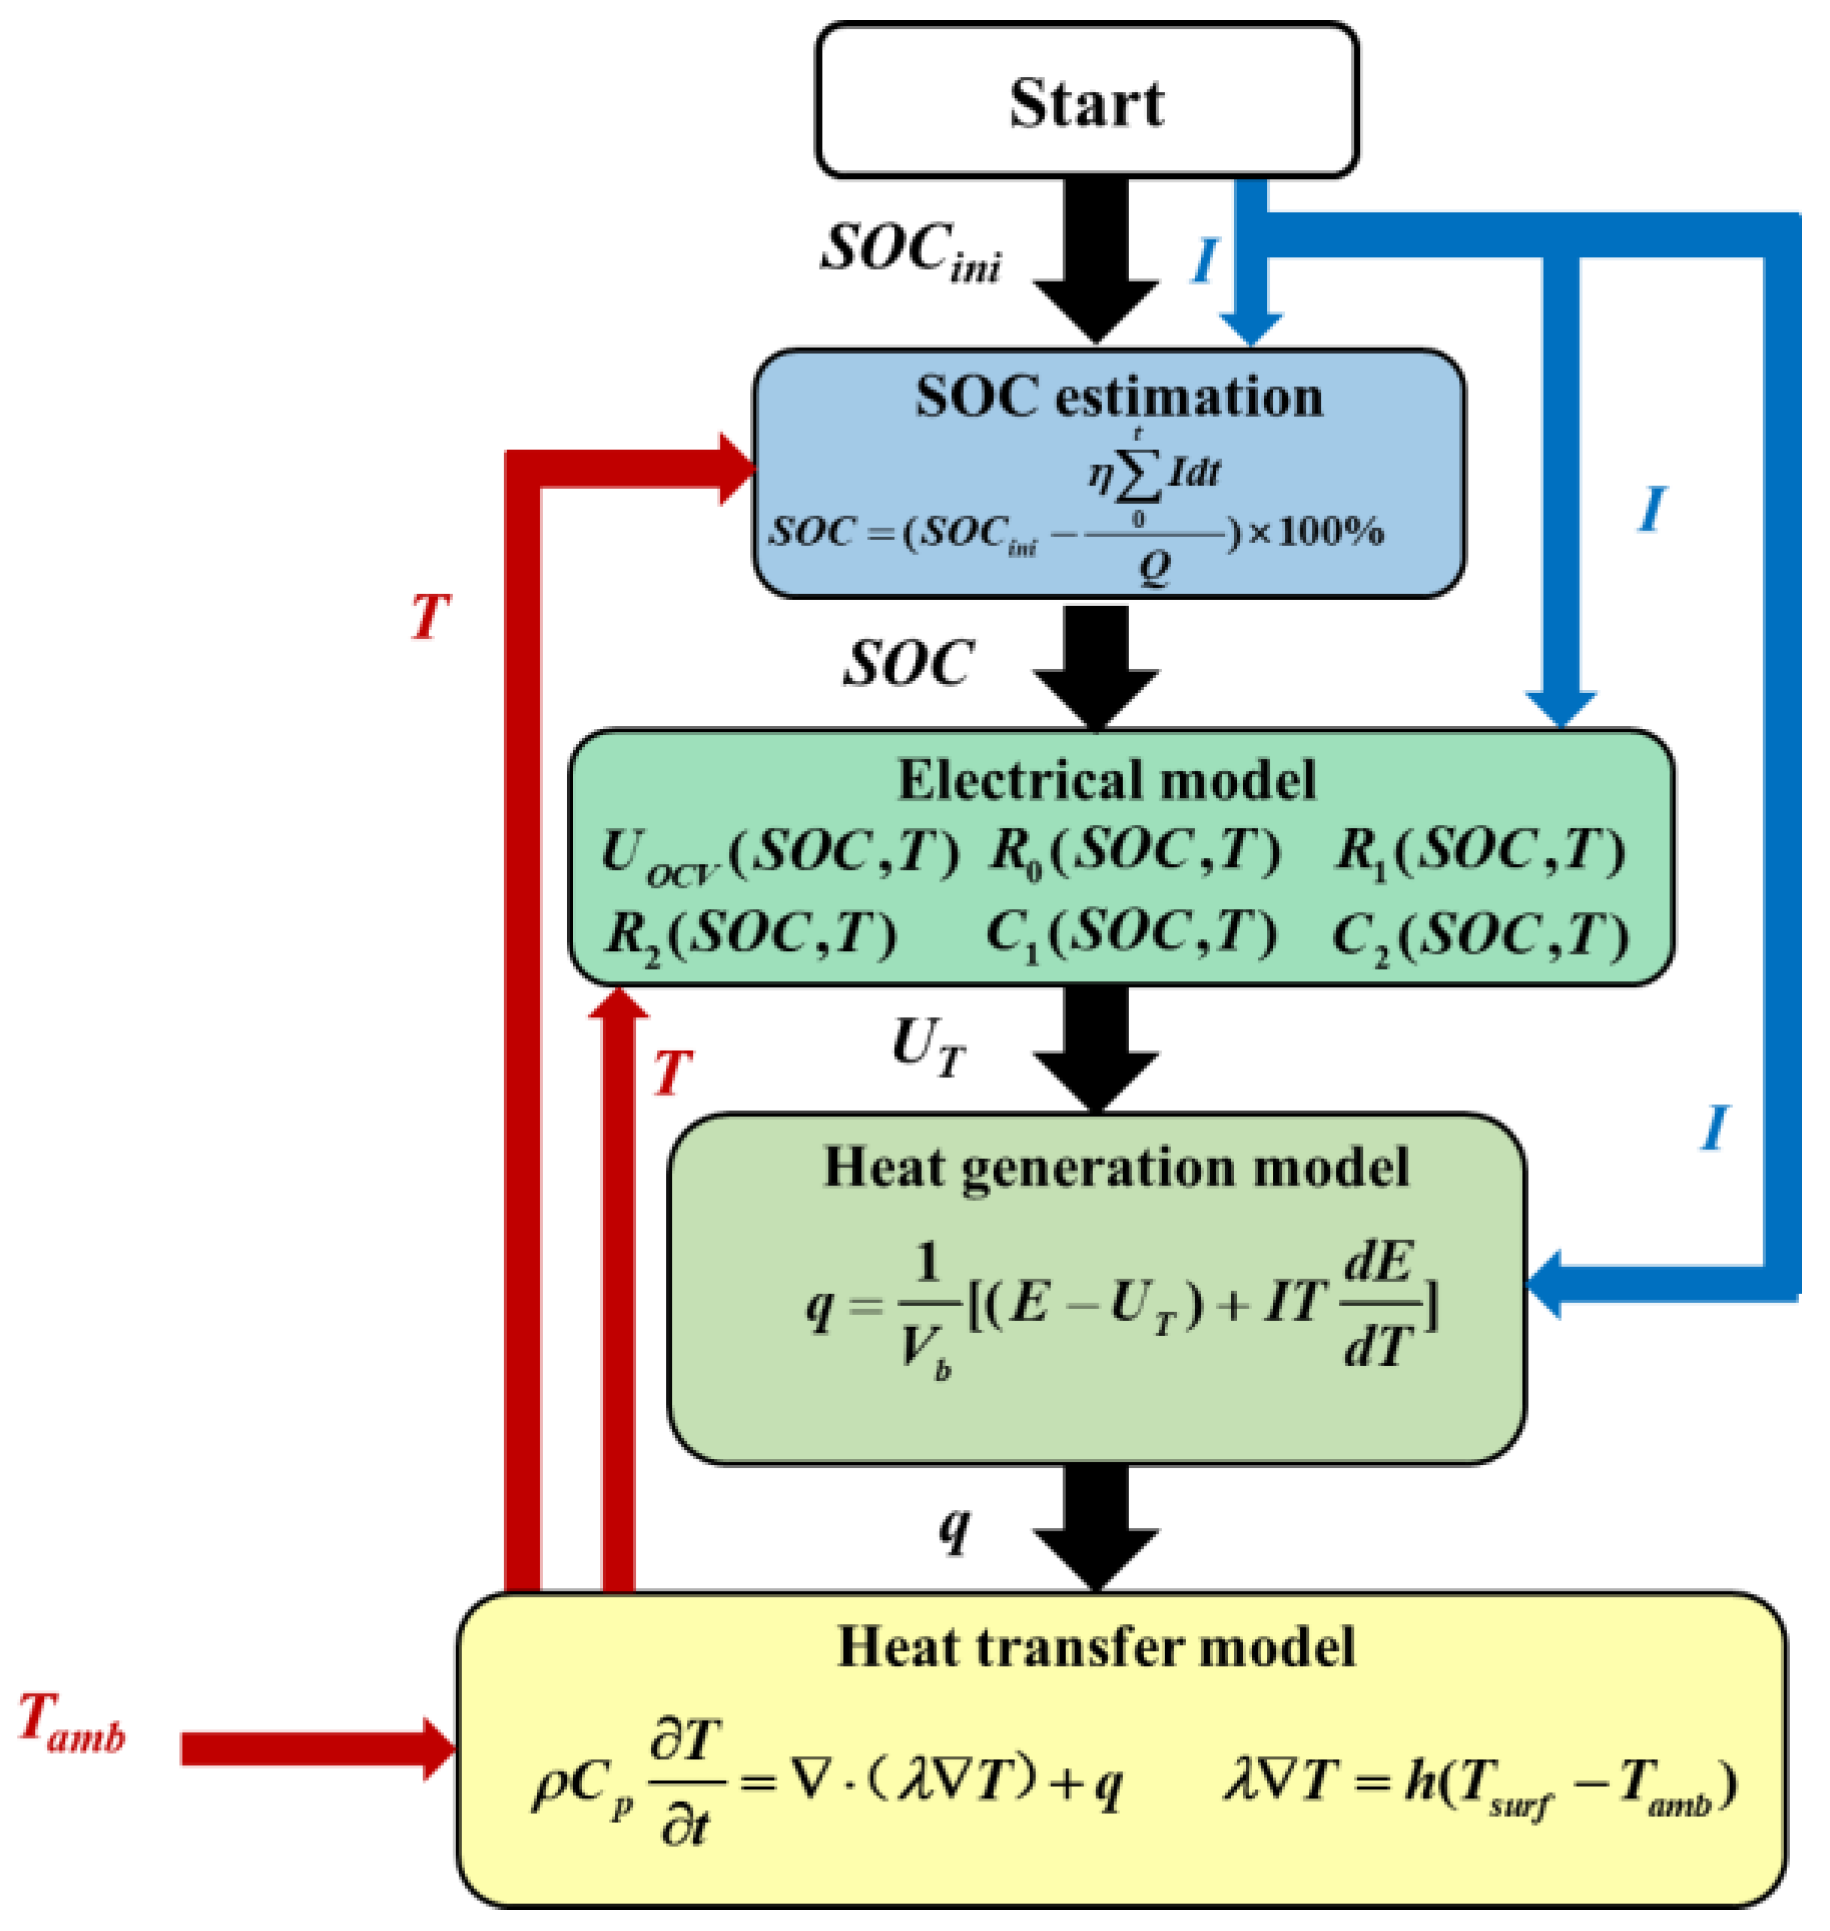
3.3. Electric–Thermal Coupling Model

Figure 7 illustrates the schematic representation of the electric–thermal coupling approach. Based on the difference between the battery’s terminal voltage and open-circuit voltage, current, and battery entropy heat coefficient, the heat generation model calculates the volumetric heat generation rate of the battery.
The electrical model accounts for initial SOC, battery current, ohmic resistance, and open-circuit voltage to estimate the battery’s SOC and terminal voltage while charging and discharging. The heat transfer model is used to anticipate the battery temperature using the volumetric heat generation rate of the battery and the ambient temperature as inputs. To link the electrical and thermal models of the battery in the simulation, the battery temperature, combined with the SOC, adjusts the ohmic resistance, open-circuit voltage, and other electrical model parameters associated with SOC and temperature dynamically.

COMSOL Model Building

In this study, the battery heat generation simulation was performed using COMSOL 5.5 Multiphysics software. To avoid excessive consumption of computational resources, a reasonably simplified geometric model of the battery was used. The stacked pole pieces were considered as a nonlayered structure, and the battery core, top cover, and shell were integrated. Additionally, small internal air spaces and safety valves, as well as the chamfering of the pole and the insulating cover, were ignored. Figure 8 depicts the final three-dimensional geometric model of the battery.

3.4. Verification of the Electrical and Thermal Performance of Batteries

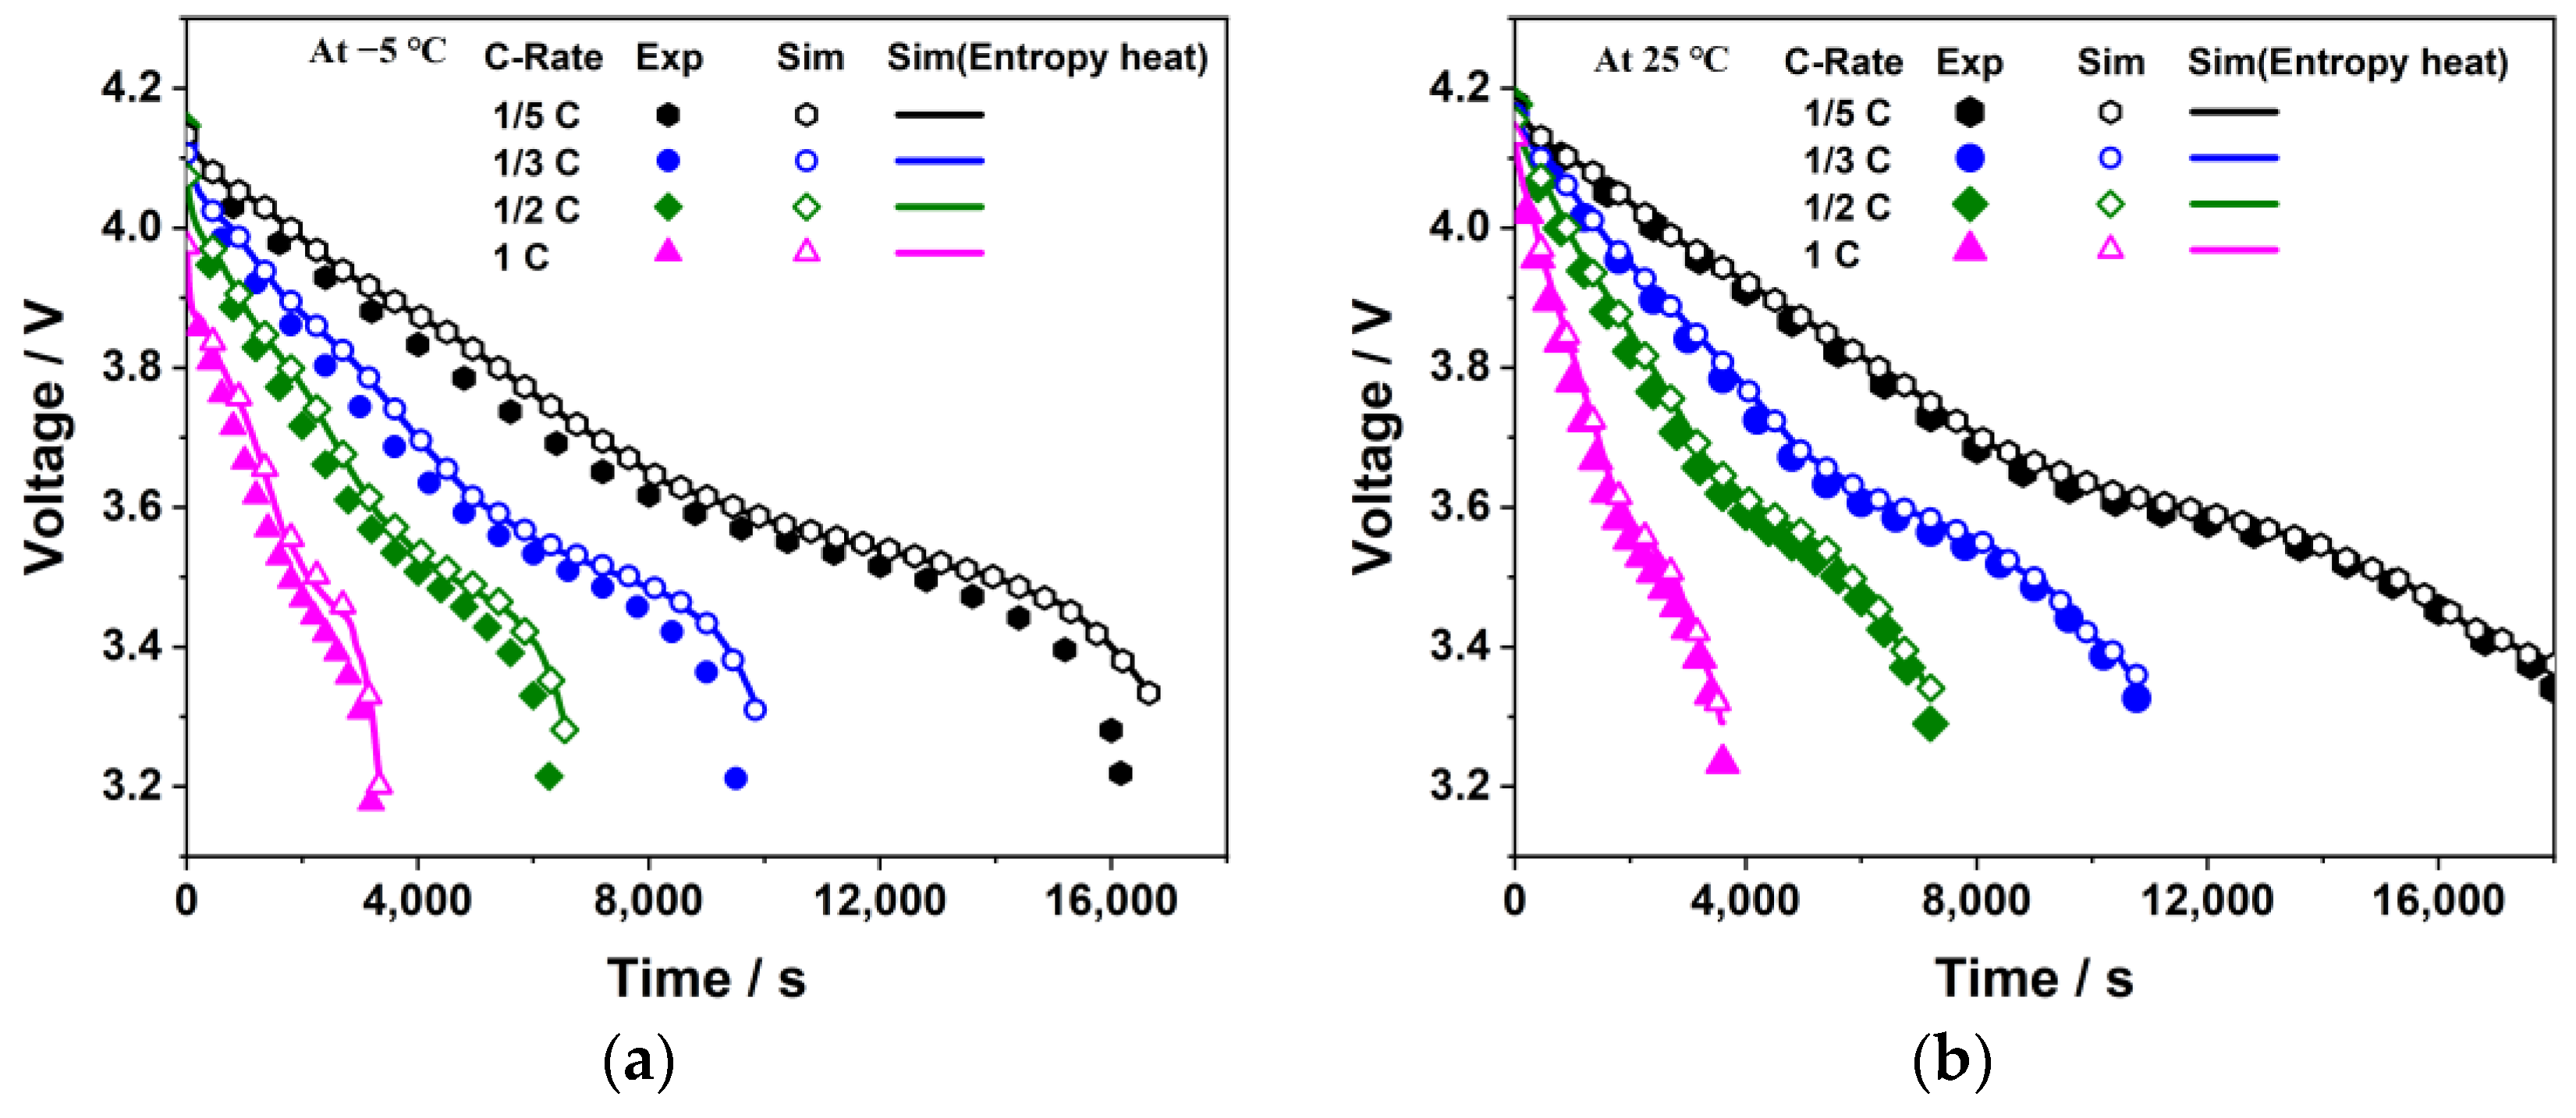
3.4.1. Verification of Electrical Properties

As shown in Figure 9, the associated test data collected at various discharge rates and ambient temperatures were compared with the voltage modeling data and validated. The voltage-changing trend observed in both the modeling and experimental results was similar, and the deviations were very small. Furthermore, it is believed that the impact of reversible entropy heat on the precision of the voltage simulation value was negligible.

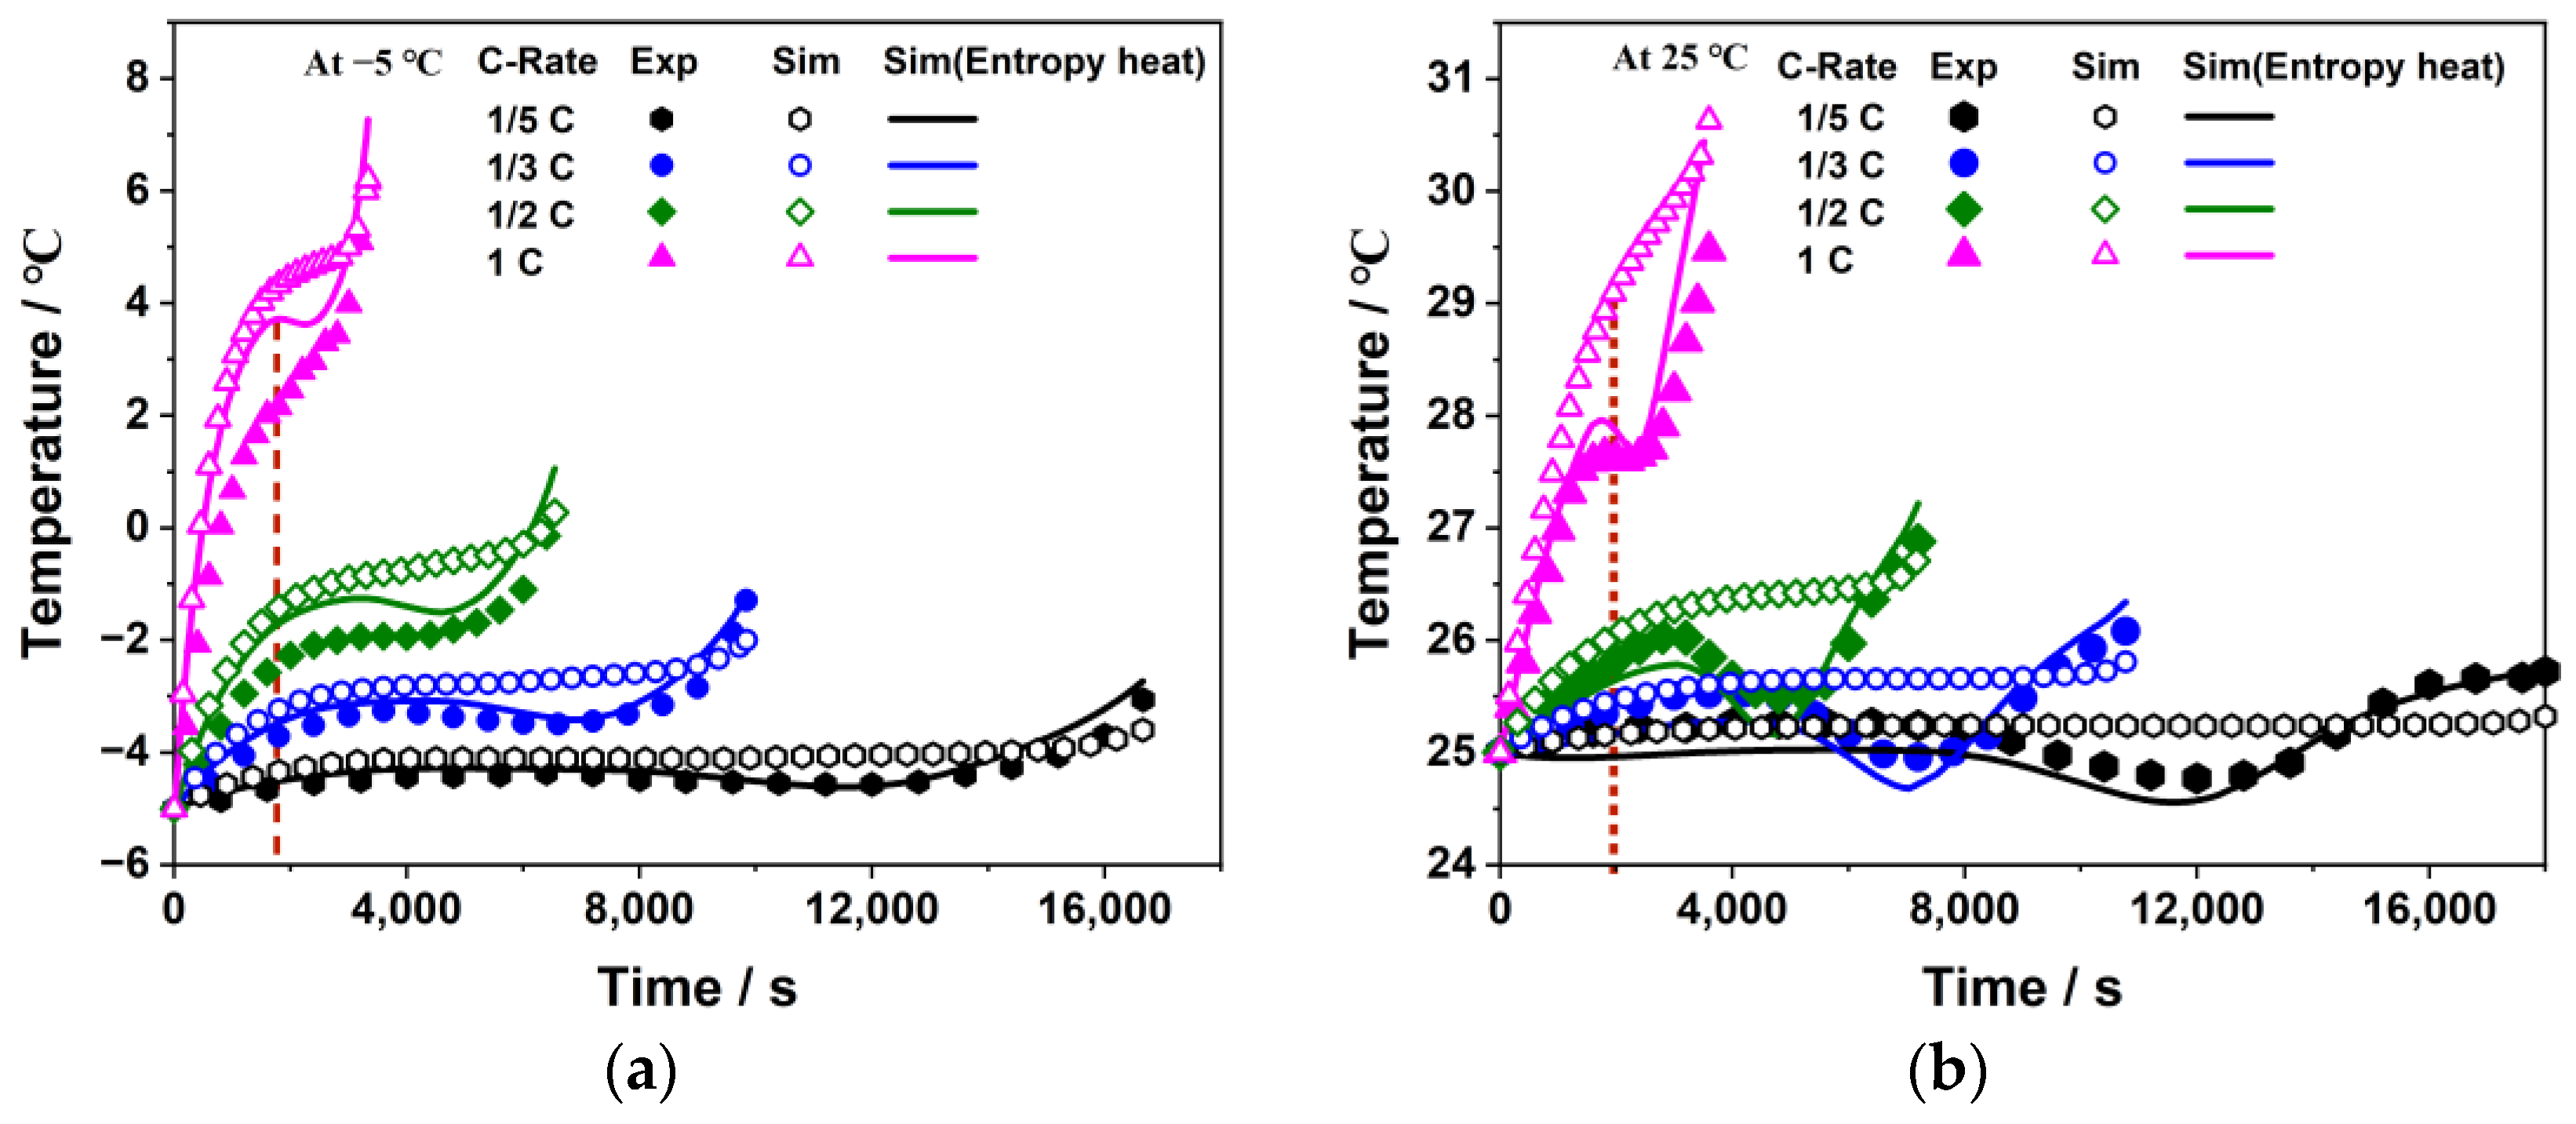
3.4.2. Validation of Thermal Properties

Figure 10 shows how the experimental results for different discharge rates and ambient temperatures were compared with and validated against the temperature simulation data. The results of both the experiment and simulation show excellent consistency in the battery temperature and its changing trend. The temperature initially increases, drops slightly, and then rises sharply during the discharge process. Furthermore, the reversible entropy heat in the simulation leads to more accurate results compared with those results of the simulation that ignore this factor. For example, at 25 °C, when the battery is discharged at 1C for 2000 s, the error between the simulation without entropy heat and the experiment reaches 5.87%, while the error for the simulation with entropy heat is only 0.87%. Nevertheless, at −5 °C, due to the influence of a frigid ambient environment, the propensity for lithium dendrite formation is exacerbated during high-rate discharges, resulting in a decline in battery activity. This, in turn, amplifies the challenge of achieving congruence between simulations and experimental outcomes. However, simulations employing the entropic model manifest a closer approximation to the experimental results.

4. Results and Discussion

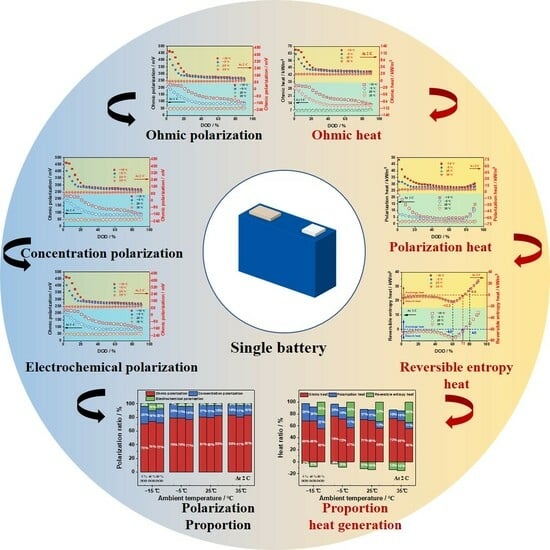
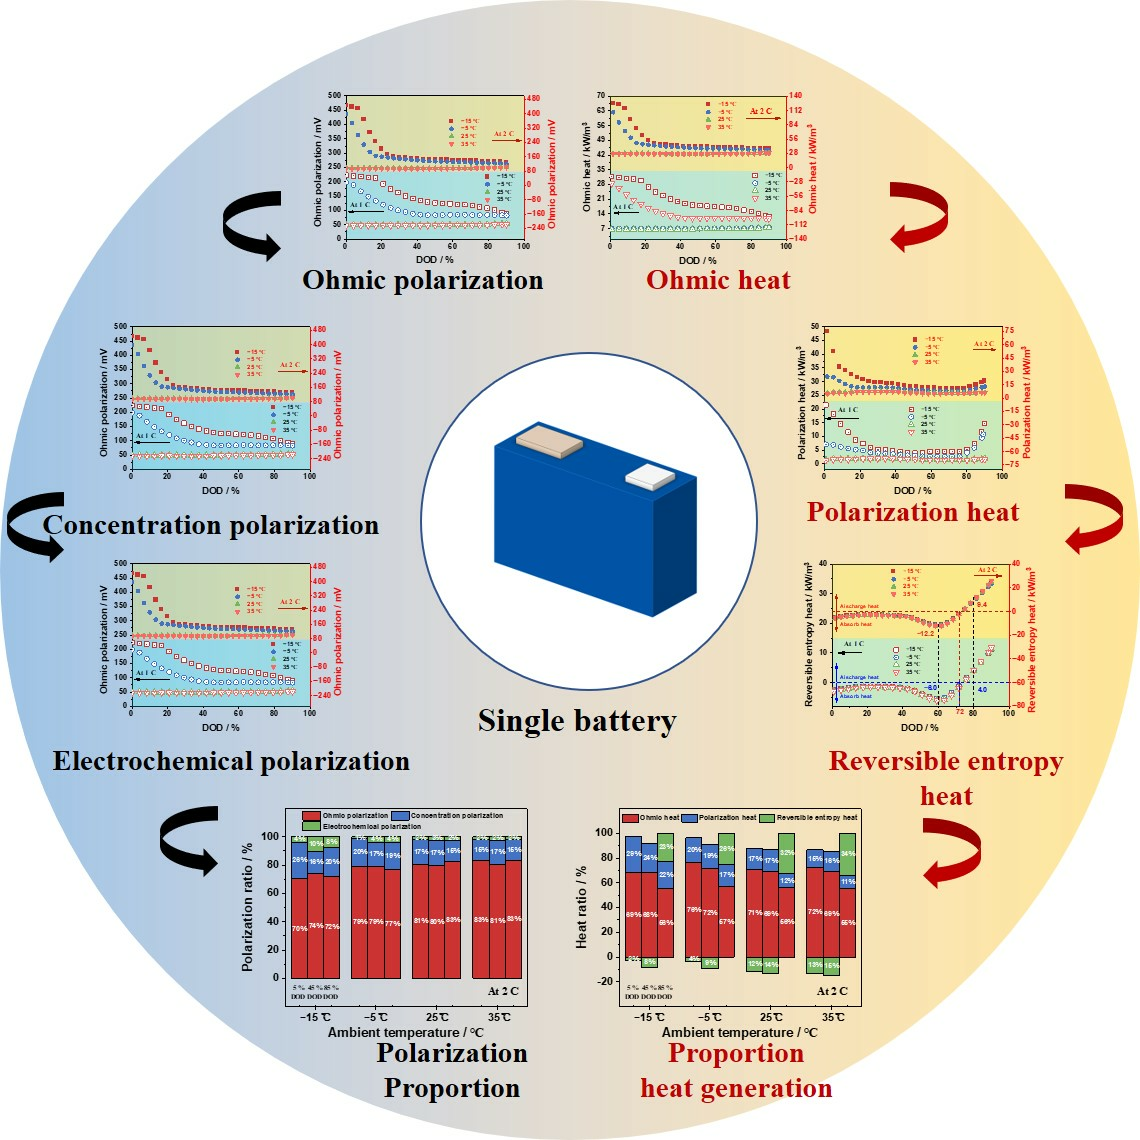
4.1. Polarization Characteristics of the Battery

This section contains an analysis of the effects of ambient temperature and discharge rate on the battery’s ohmic polarization, concentration polarization, and electrochemical polarization. These effects are investigated under different temperature conditions, including −15 °C, −5 °C, 25 °C, and 35 °C, and various discharge rates, including 1/5 C, 1/2 C, 1 C, and 2 C. These conditions were selected to represent a range of realistic operating conditions.

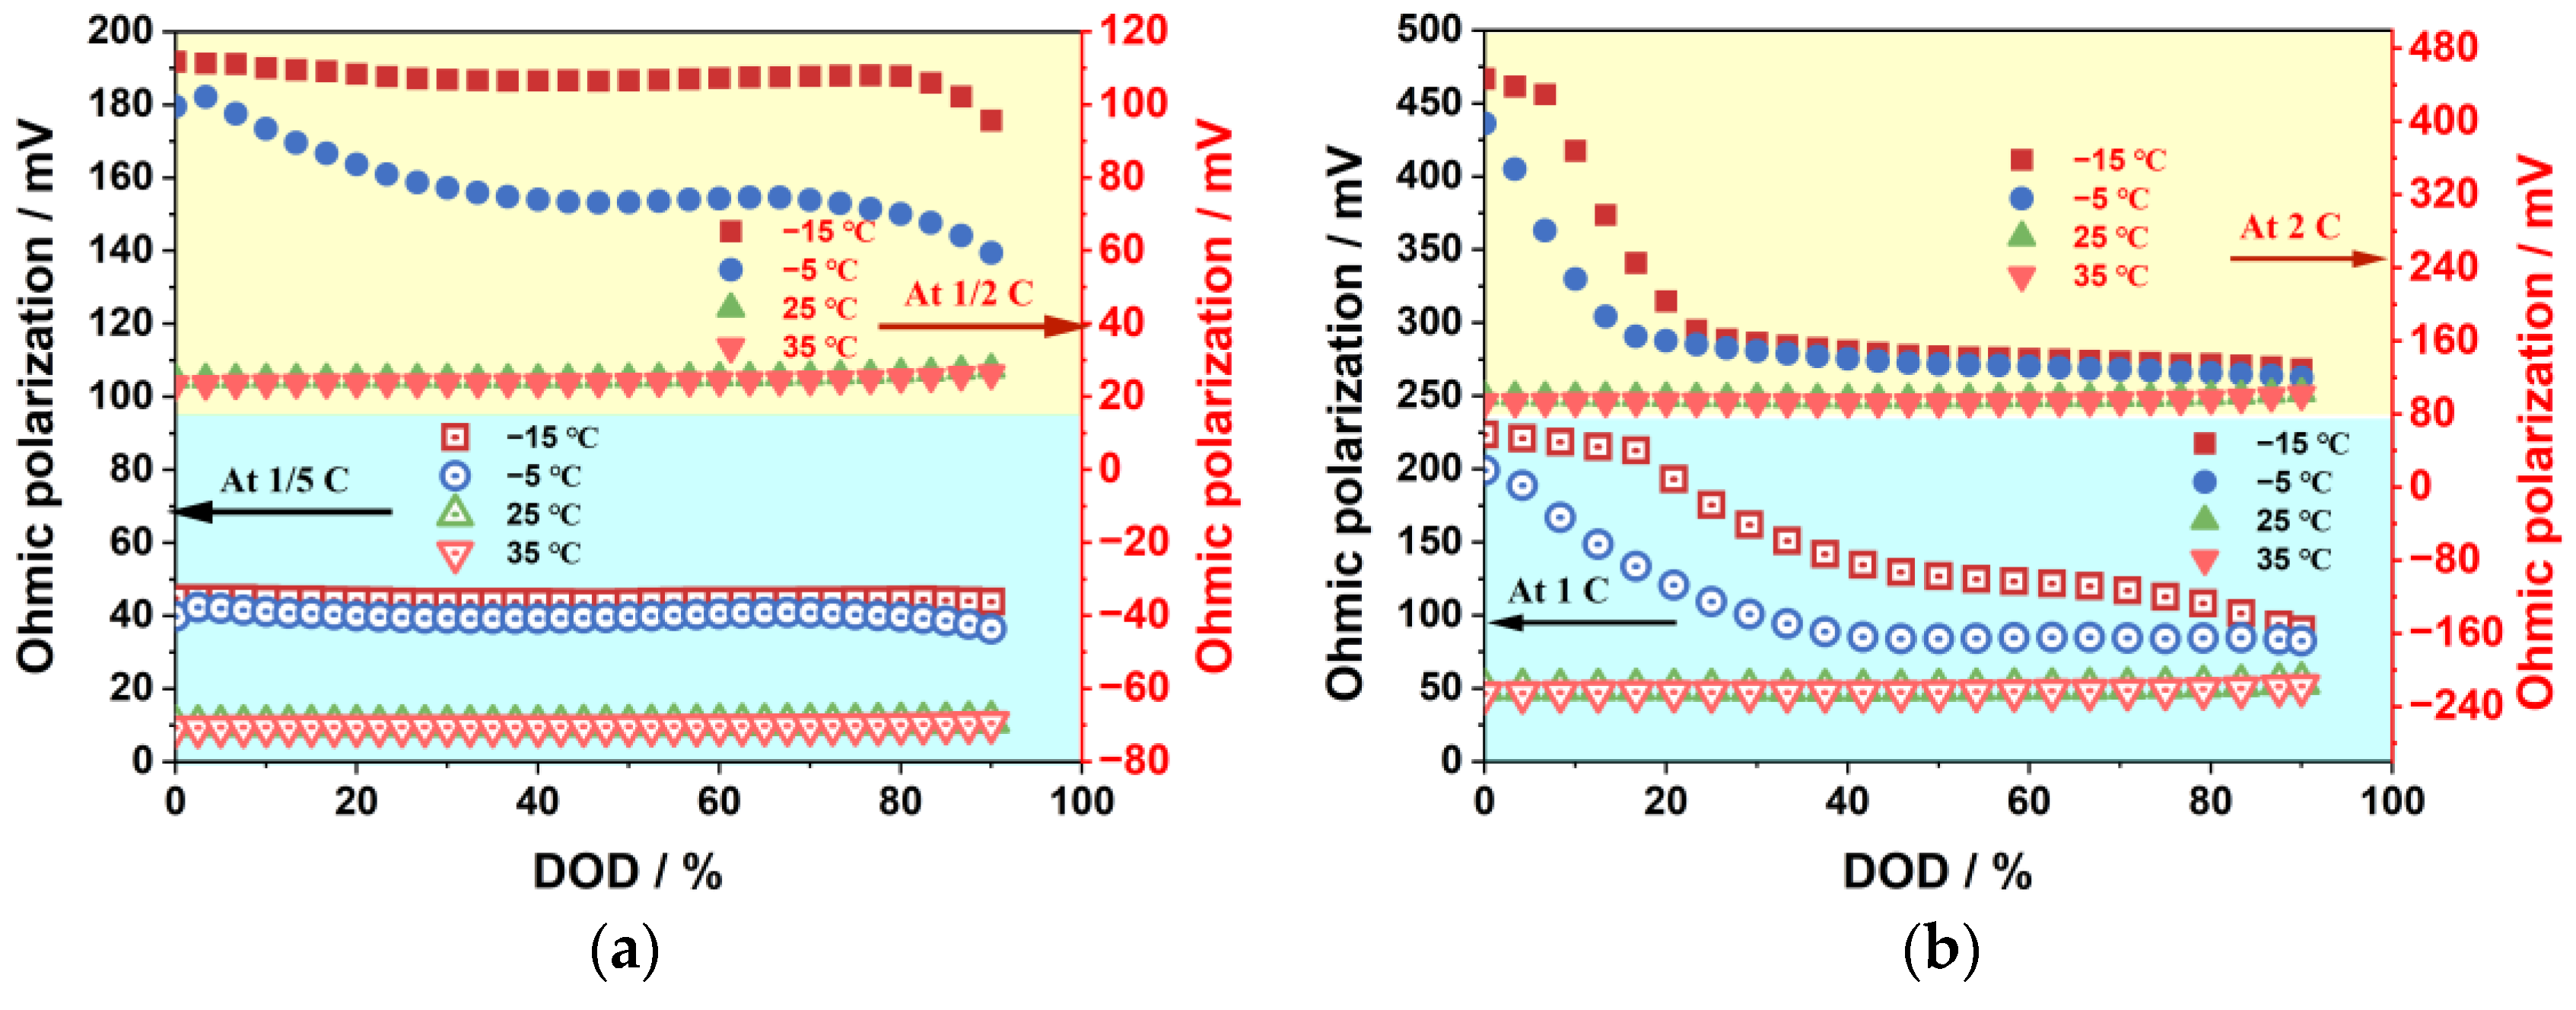
4.1.1. Ohmic Polarization Characteristics

Figure 11 illustrates the impact of ambient temperature and discharge rate on the ohmic polarization of the battery. At low temperatures, particularly below 0 °C (such as −15 °C and −5 °C), the ohmic polarization increases significantly and decreases overall with an increase in DOD (depth of discharge). In contrast, the ohmic polarization is considerably low at high temperatures (25 °C and 35 °C) and remains almost constant throughout the discharge. Since the battery temperature change during discharge is higher under low-temperature conditions than high-temperature conditions for the same discharge rate, the ohmic resistance change value under low-temperature conditions is larger than that under high-temperature conditions. Furthermore, since the battery temperature rises during discharge, the ohmic polarization decreases with discharge in low-temperature environments; however, small or almost constant values are observed in ambient and high-temperature environments. Moreover, as the discharge rate increases, the ohmic polarization rises significantly due to an increase in current. Under low-temperature conditions, it is affected by the change in ohmic resistance, while in ambient- and high-temperature environments, it is proportional to the discharge rate change. Thus, if the discharge rate increases from 1/5 C to 2 C, the initial ohmic polarization increases by approximately ten times.

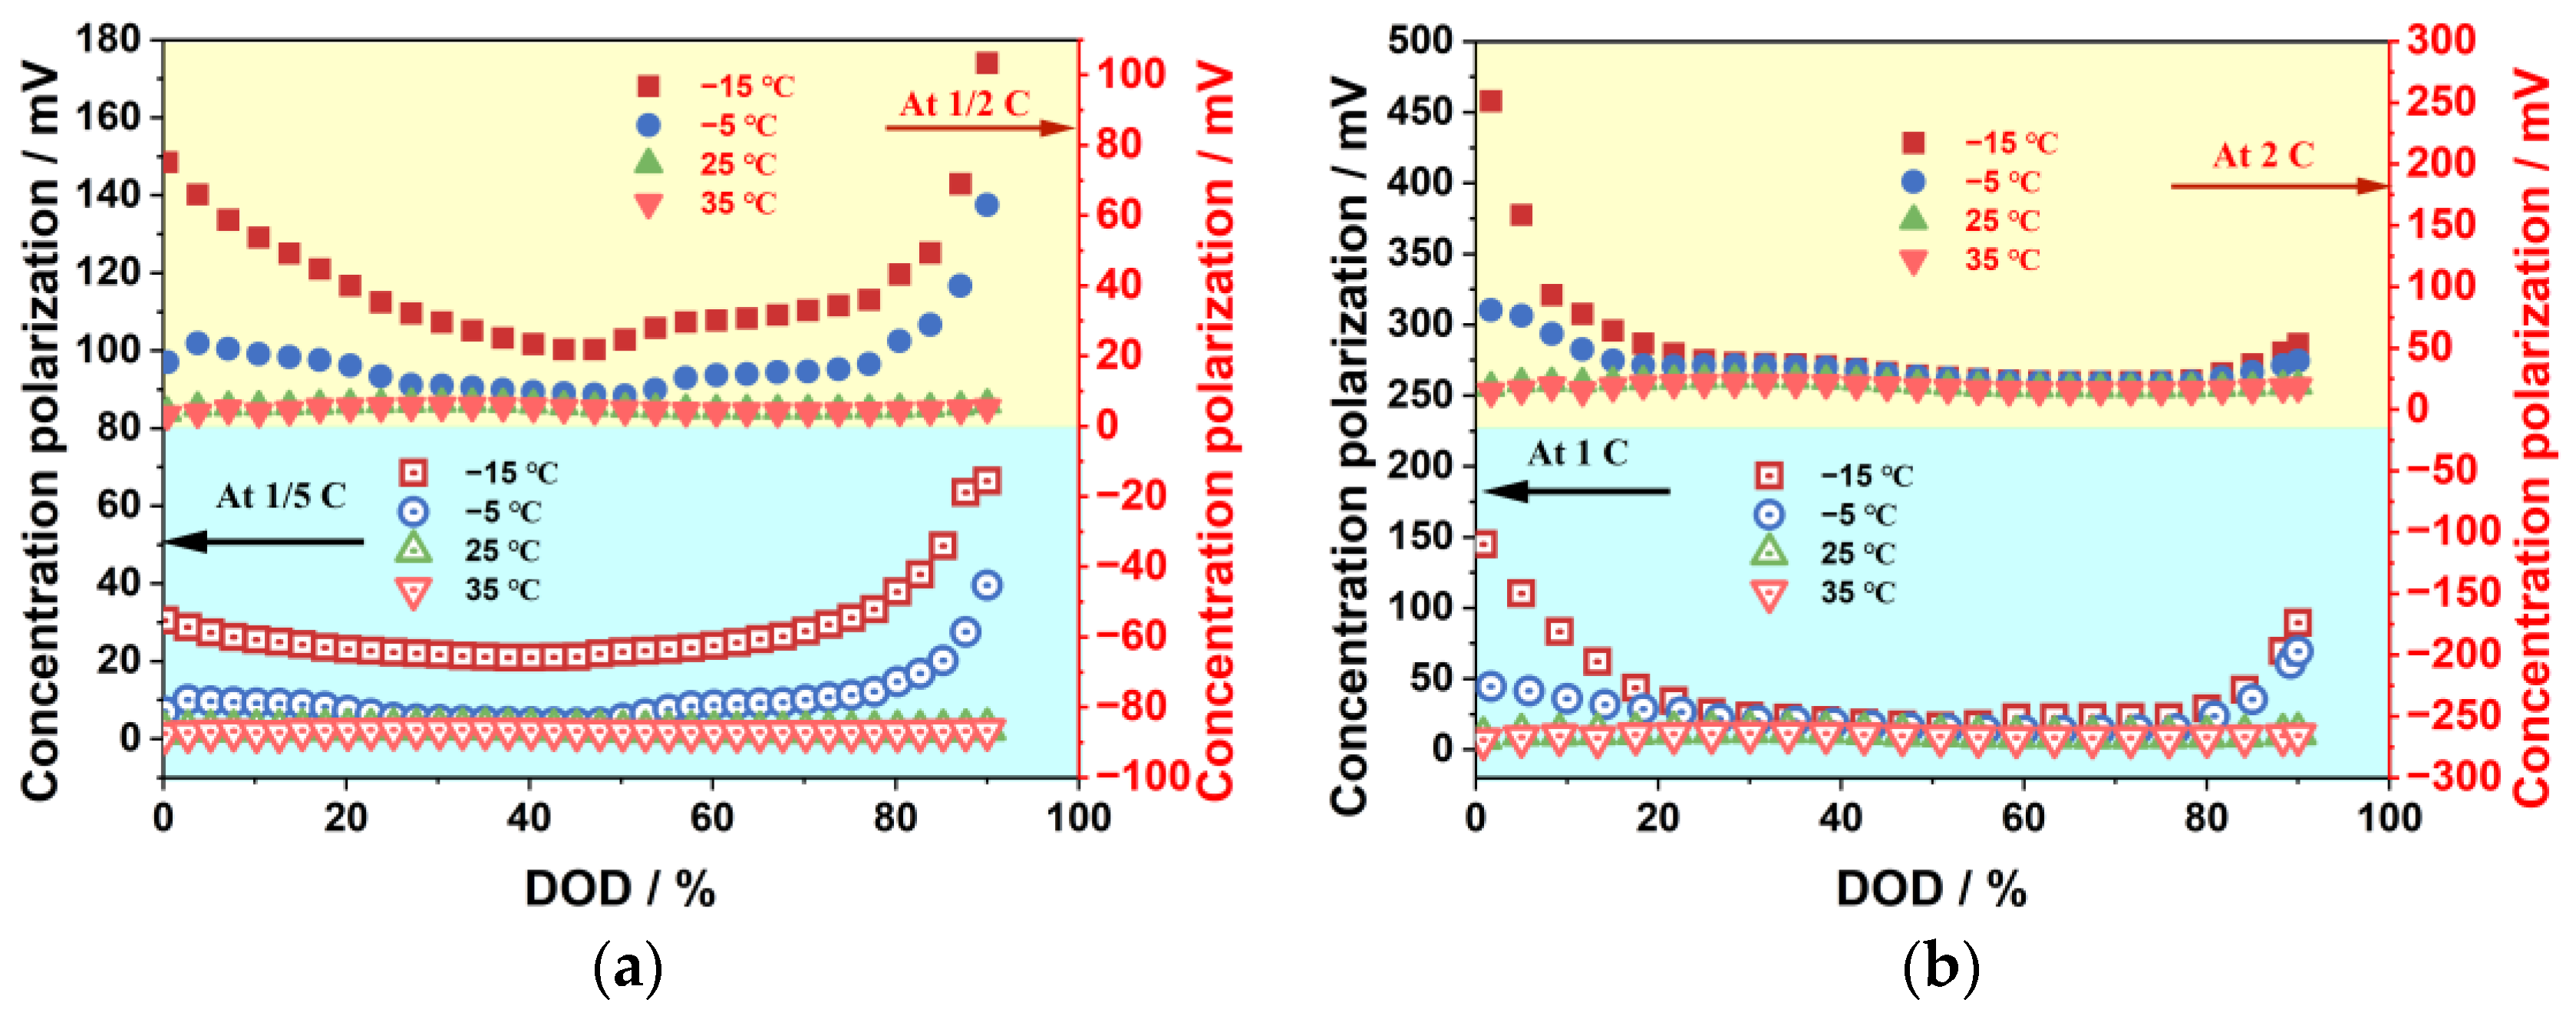
4.1.2. Concentration Polarization Characteristics

Figure 12 depicts the impact of discharge rate and ambient temperature on concentration polarization. The concentration polarization increases noticeably as the ambient temperature decreases. Moreover, it exhibits a “U”-shaped trend with the increase in DOD under low-temperature conditions, while remaining relatively stable under ambient- and high-temperature conditions. The higher concentration polarization at the initial discharge stage may be due to the higher overpotential required to initiate the motion of lithium ions from a static state to a moving state when the current is connected. The high concentration polarization at the end of discharge may be attributed to the movement of lithium ions from the negative to the positive electrode inside the battery, where the lithium-ion concentration at the negative electrode is much lower than that at the positive electrode. Nevertheless, the lithium ions still move towards the high-concentration areas, resulting in a reverse concentration gradient, which is unfavorable for the diffusion process according to Fick’s law. Therefore, a considerable overpotential is needed, causing a serious polarization phenomenon. The low-temperature environment severely exacerbates this physicochemical behavior, changing the motion state of the lithium ions.
Additionally, as the discharge rate is increased, concentration polarization rises as well. This is because of the excessive accumulation of electrons at the positive electrode, which requires the transfer of more lithium ions from the negative electrode to the positive electrode per unit time. However, the electrochemical reaction at the positive electrode is hampered by the low rate of diffusion of lithium ions, which causes a rise in concentration polarization.

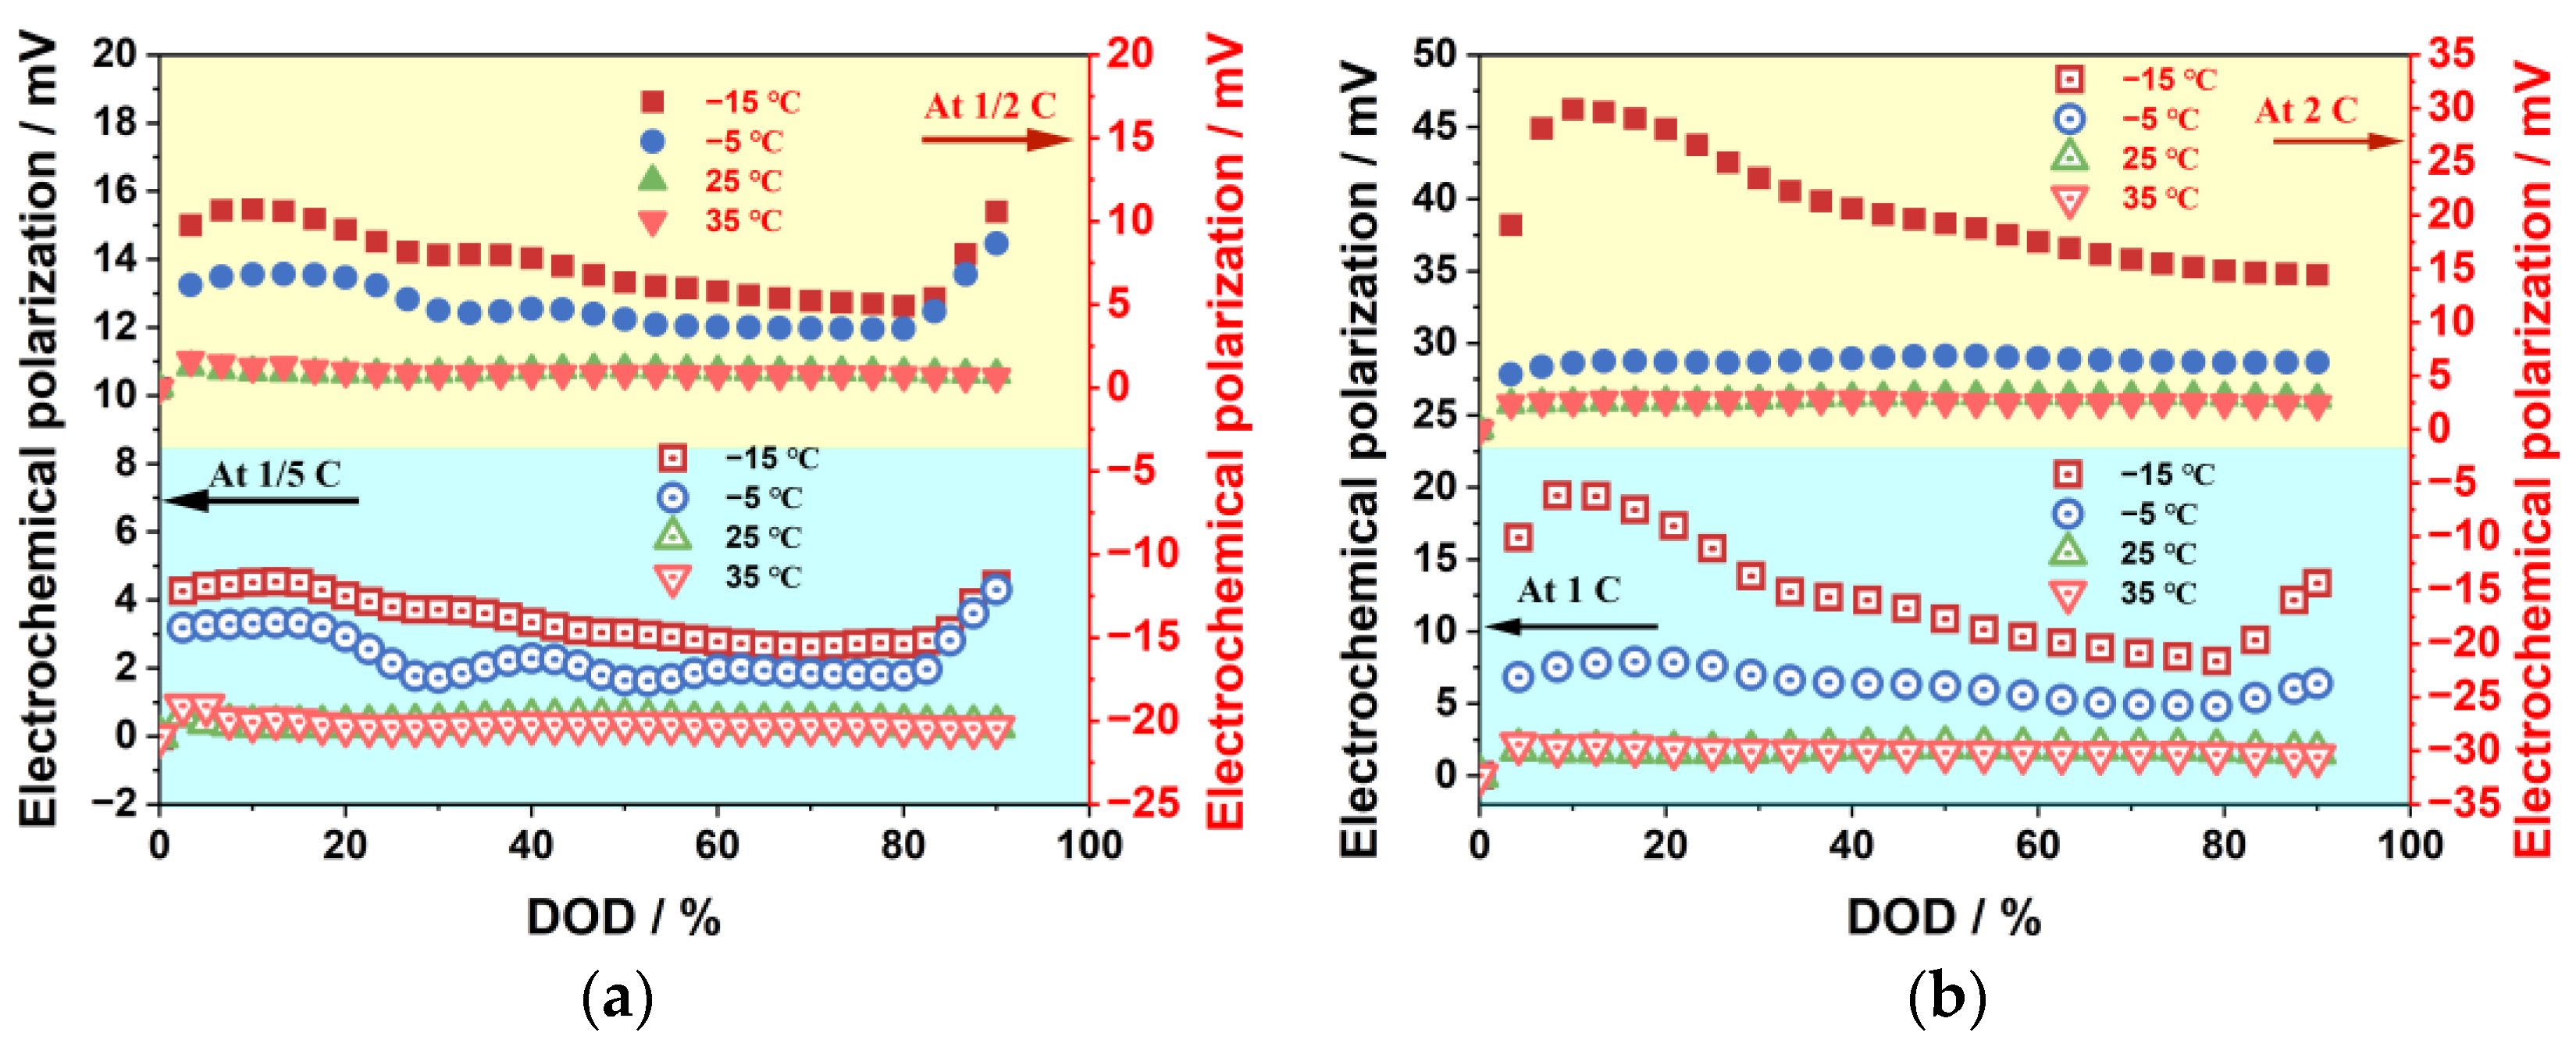
4.1.3. Electrochemical Polarization Characteristics

Figure 13 illustrates the impact of ambient temperature and discharge rate on electrochemical polarization. Electrochemical polarization increases with decreasing ambient temperature, and it rises sharply at the beginning of the discharge process, then gradually decreases and finally increases again at the end of the discharge process under low-temperature conditions. In contrast, electrochemical polarization is relatively stable and maintained at a low level at room temperature and in high-temperature environments. This may be because the electron transport rate is significantly faster than the lithium-ion transport rate, and at the beginning of the discharge process, the electrons arrive at the anode before the lithium ions, leading to a slower electrochemical reaction and thus causing electrochemical polarization. As the discharge process proceeds, the lithium-ion concentration gradient between the negative and positive electrodes gradually decreases, which facilitates the lithium-ion transport process and thus reduces electrochemical polarization. However, at the end of the discharge process, when the concentration gradient is reversed, the reverse transport process of lithium ions becomes more difficult, resulting in a sharp increase in electrochemical polarization. Moreover, electrochemical polarization increases with an increasing discharge rate.

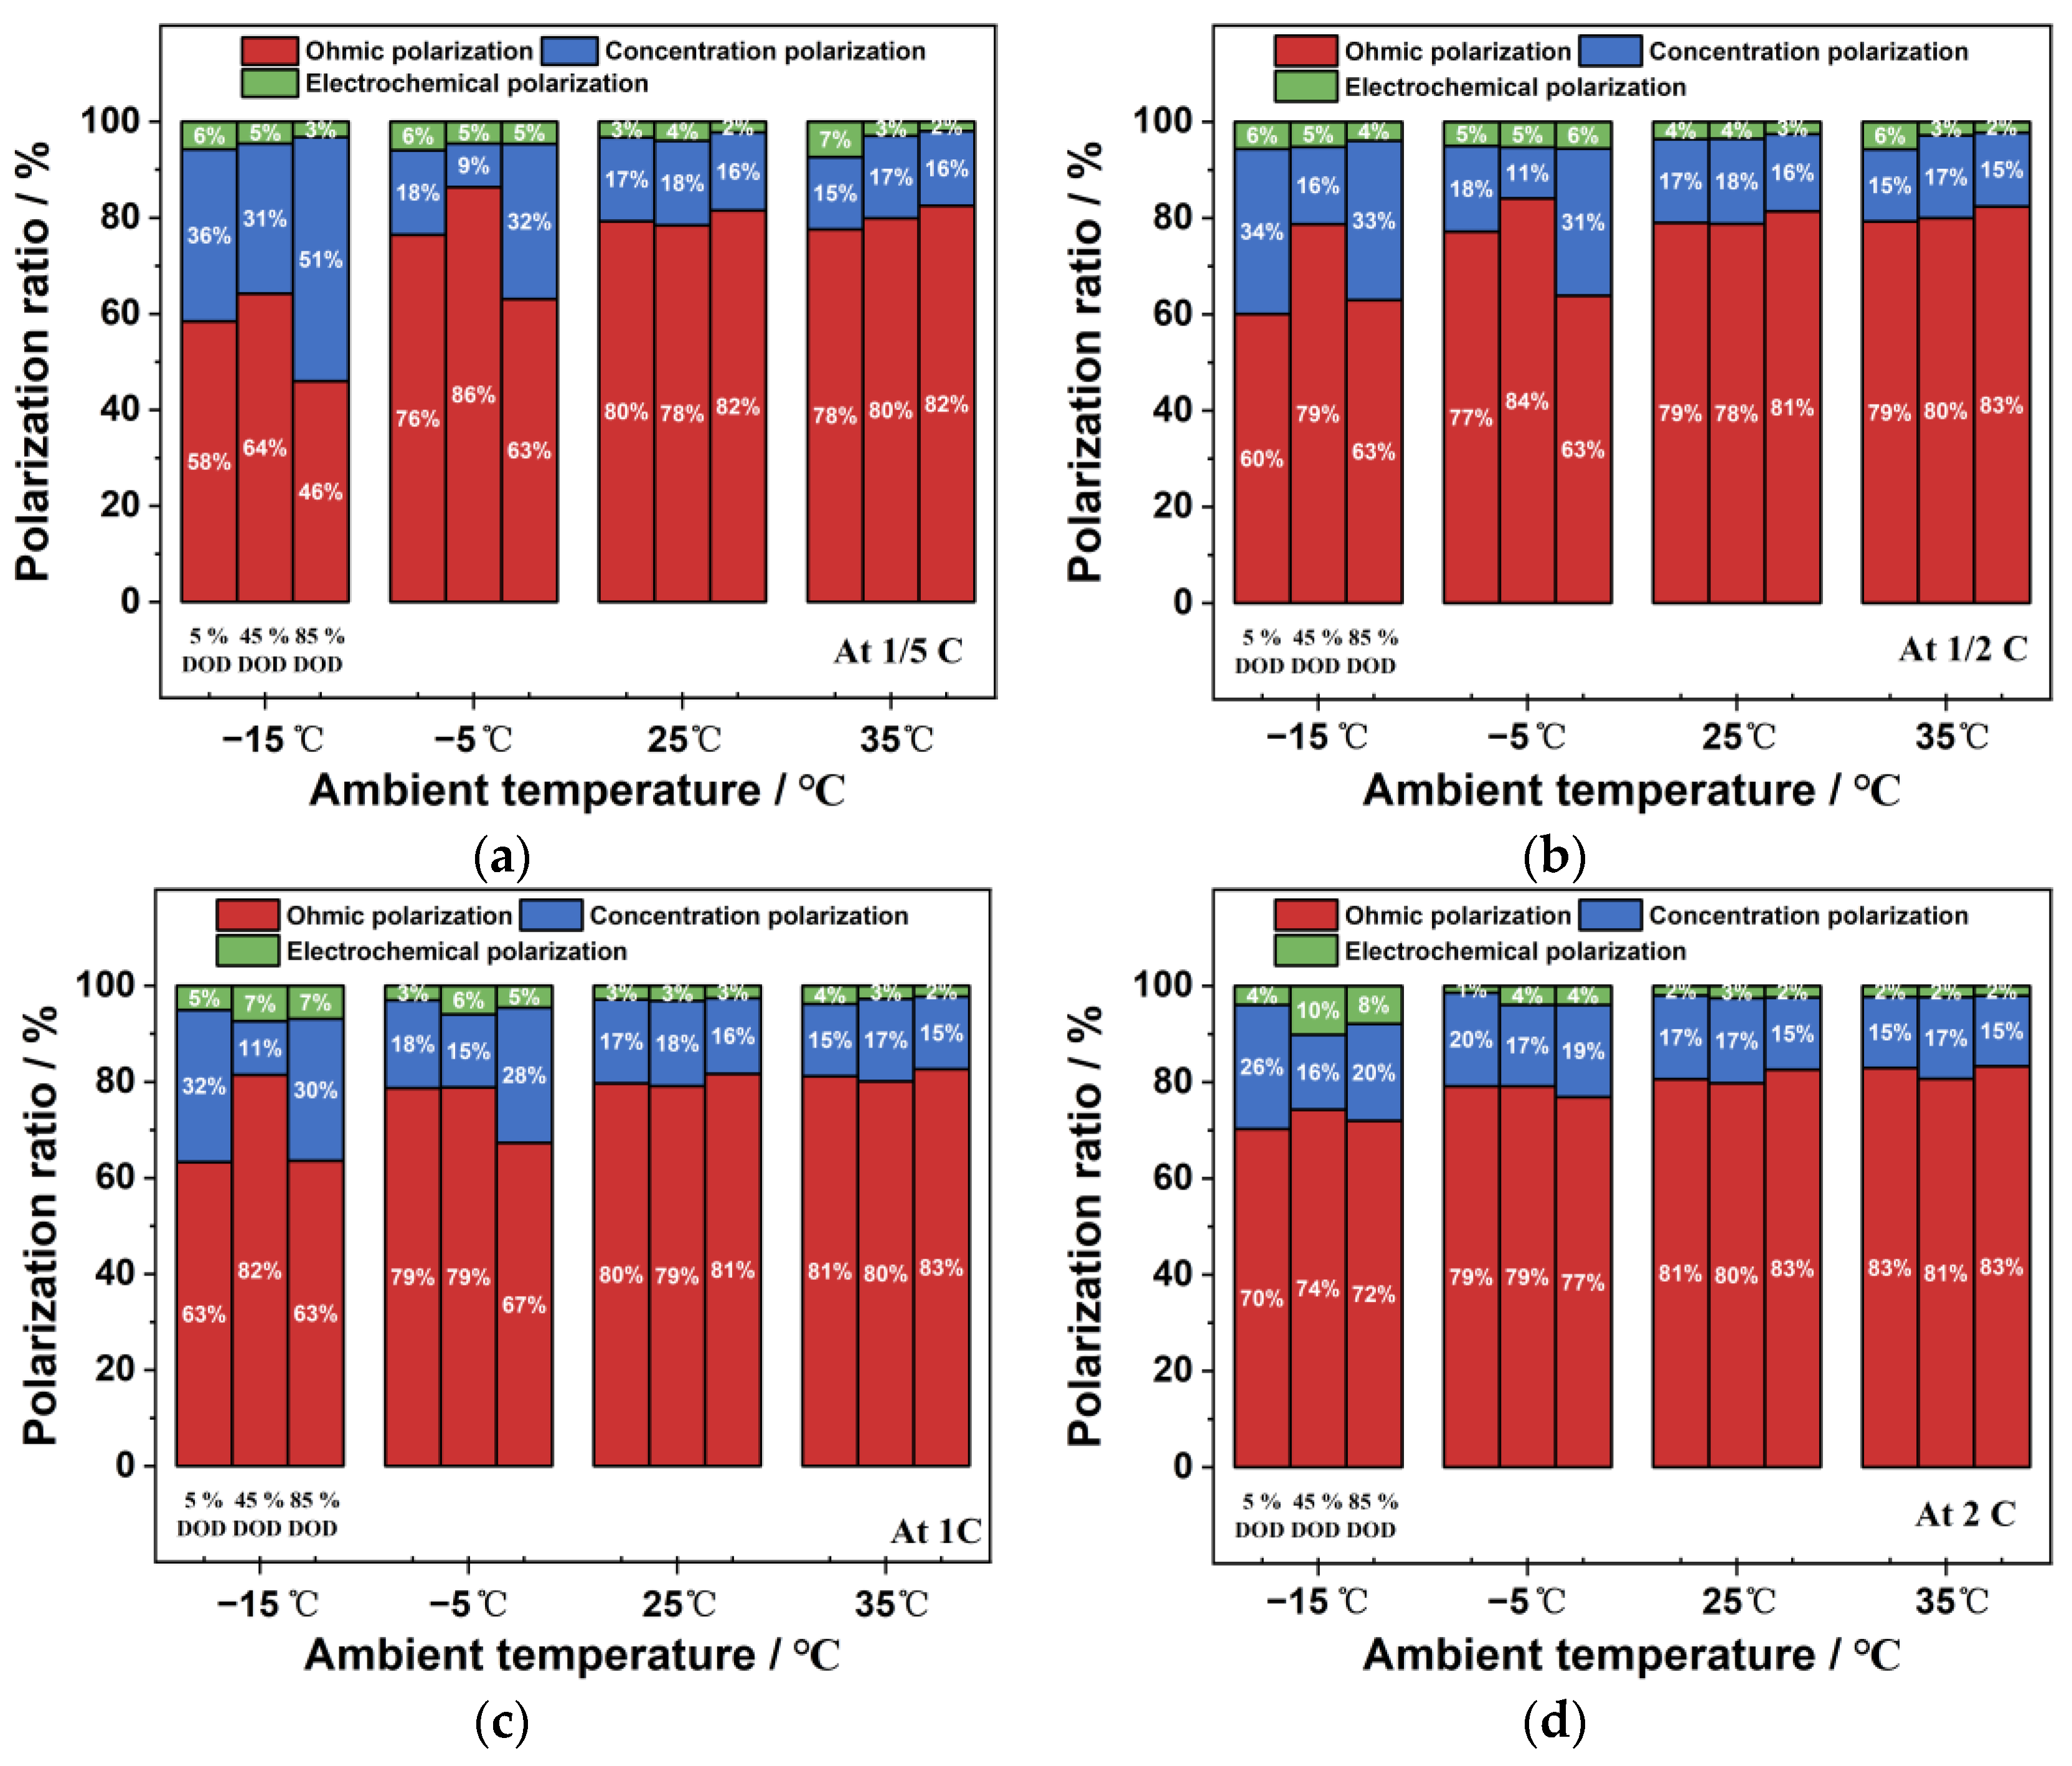
4.1.4. Proportion of Polarization Types

The effect of ambient temperature and discharge rate on the percentages of various polarizations is shown in Figure 14. The results show that the ohmic polarization has the highest percentage, accounting for approximately 80% in most cases, followed by concentration polarization at around 17%, while electrochemical polarization has the lowest proportion, approximately 3%. The percentage of ohmic polarization gradually rises as the ambient temperature rises, whereas the percentages of concentration polarization and electrochemical polarization steadily decrease.
Moreover, under the low-temperature environments of −15 °C and −5 °C, the percentages of concentration polarization at 5% and 85% DOD are notably higher than those at 45% DOD. This is because the concentration polarization is more pronounced at the beginning and end of discharge in low-temperature environments. Additionally, the proportion of ohmic polarization increases, and the proportion of the other two polarizations decreases with the increase in discharge rate under low-temperature conditions. In contrast, in high-temperature and room-temperature environments, the percentages of the three polarizations are relatively stable and less affected by the change in discharge rate.

4.2. The Battery’s Characteristics for Producing Heat

In this section, the impacts of ambient temperature and discharge rate on the production of ohmic heat, polarization heat, and reversible entropy heat in batteries are examined. Specifically, four representative ambient temperature conditions are considered: low-temperature conditions of −15 °C and −5 °C, room-temperature conditions of 25 °C, and high-temperature conditions of 35 °C. Additionally, four discharge rate conditions are investigated: lower discharge rates of 1/5 C and 1/2 C, and higher discharge rates of 1 C and 2 C.

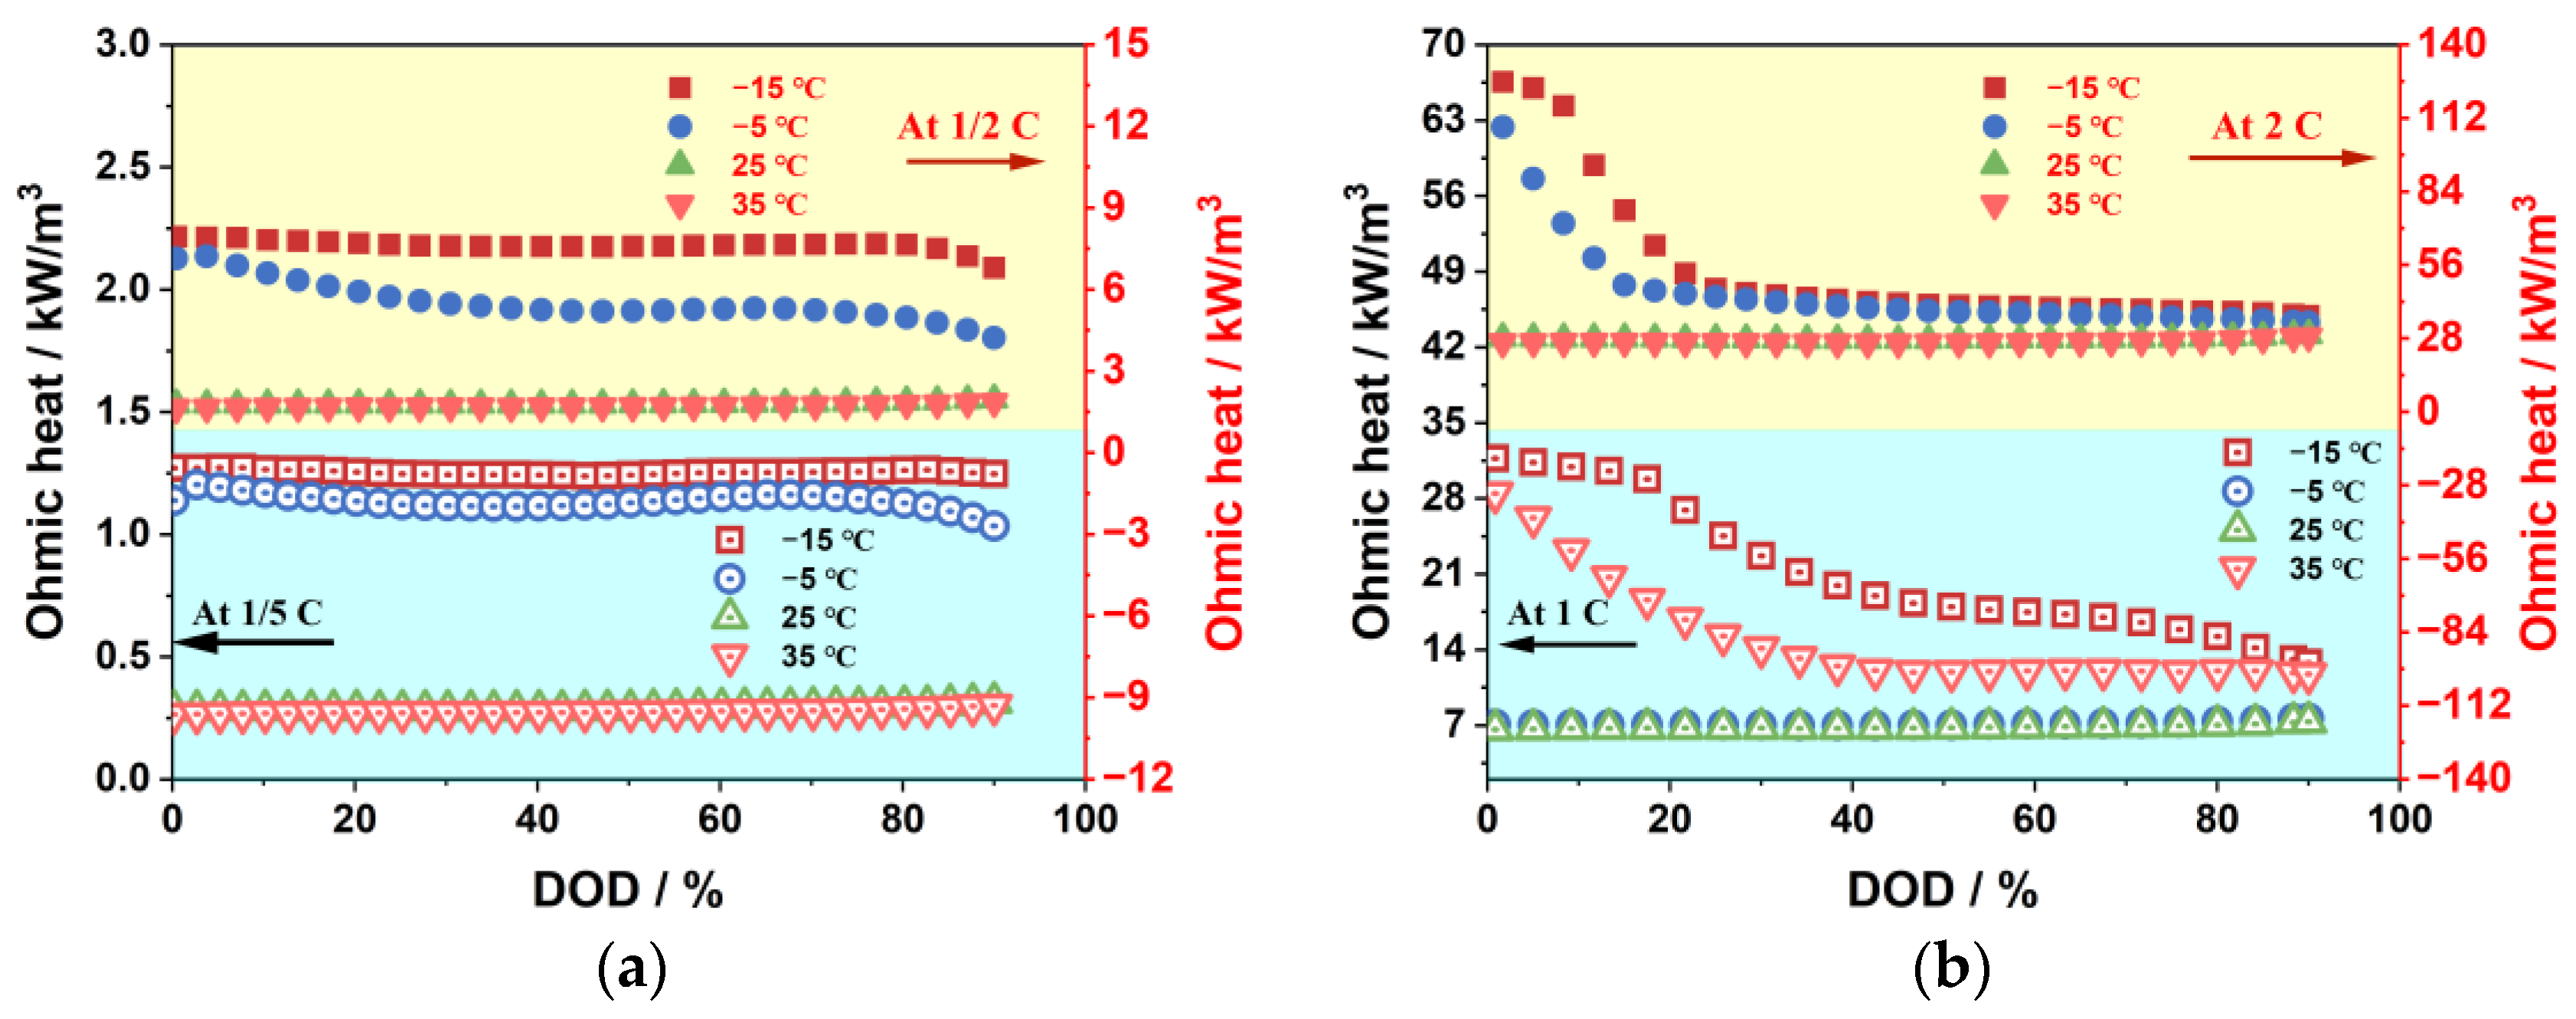
4.2.1. Ohmic Heat Generation Characteristics

The effects of ambient temperature and discharge rate on the production of ohmic heat are shown in Figure 15. The trend in ohmic heat generation characteristics is similar to that in ohmic polarization characteristics. As the ambient temperature decreases, especially below 0 °C, the ohmic heat generation increases significantly. Additionally, the ohmic heat generation decreases with an increase in the DOD. Furthermore, the ohmic heat generation is significantly lower in ambient-temperature and high-temperature environments, and it remains stable throughout the discharge process.
The creation of ohmic heat considerably increases with the increased current as the discharge rate rises. The generation of ohmic heat is more affected by the change in ohmic resistance under low-temperature conditions; nevertheless, it is basically proportional to the change in discharge rate under normal- and high-temperature conditions. According to Ohm’s law, if the discharge rate increases 10 times from 1/5 C to 2 C, the generation of ohmic heat will increase by approximately 100 times. The discharge rate has a bigger impact on ohmic heat generation than ohmic polarization.

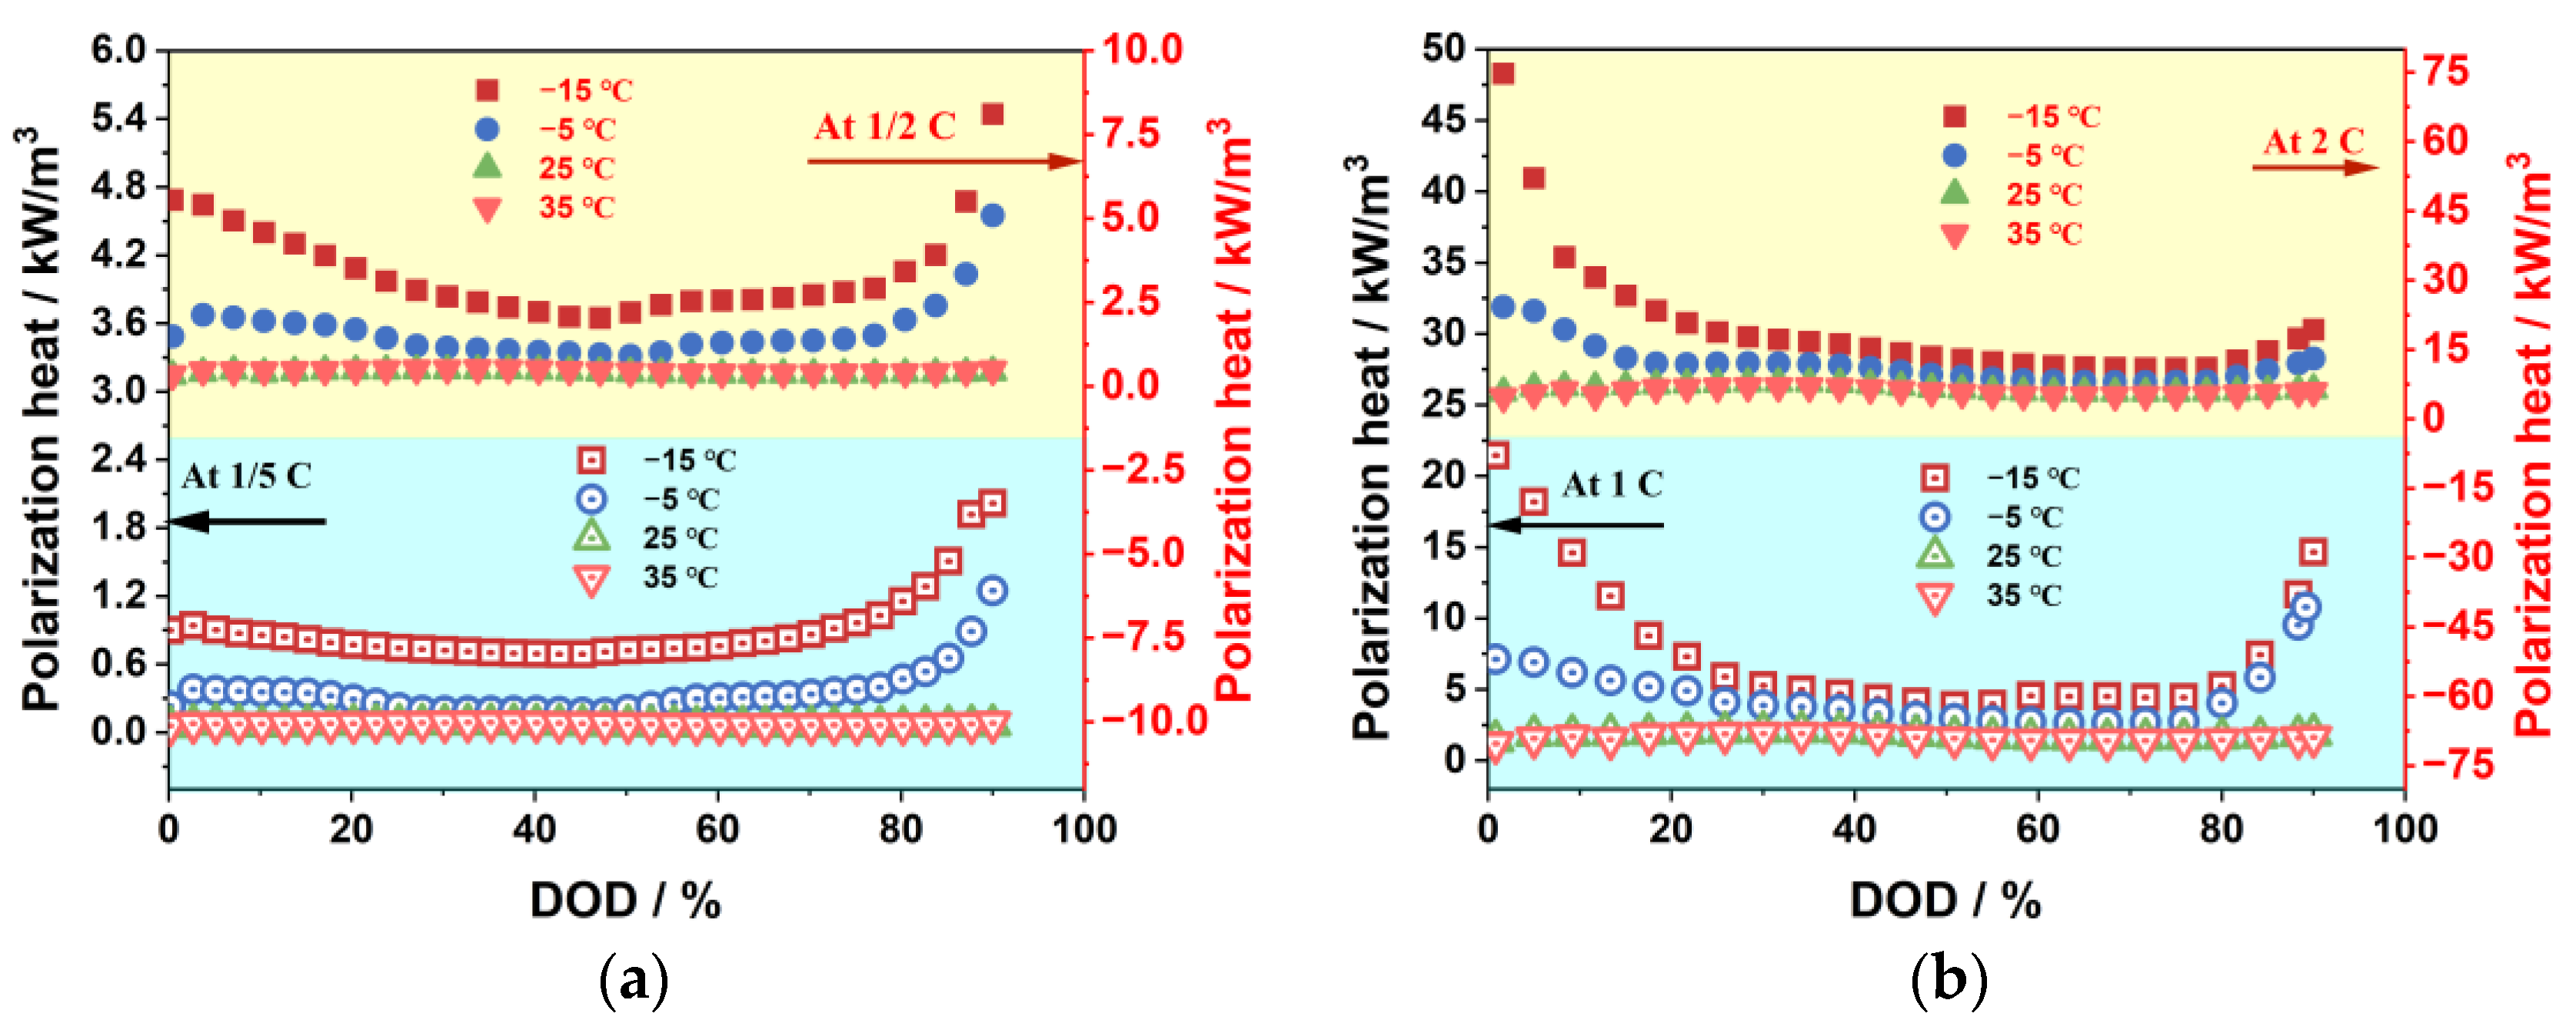
4.2.2. Polarization Heat Generation Characteristics

Figure 16 shows how discharge rate and ambient temperature affect the generation of polarization heat. Since the concentration polarization is greater than the electrochemical polarization, the polarization heat generation is dominated by the concentration polarization, and the trend of the polarization heat generation is similar to that of the concentration polarization. As the ambient temperature decreases, the polarization heat generation increases significantly. It shows a “U”-shaped change with the increase in DOD under low-temperature conditions, and it is more stable under room- and high-temperature conditions. Additionally, when the discharge rate rises, so does the amount of heat generated by polarization.

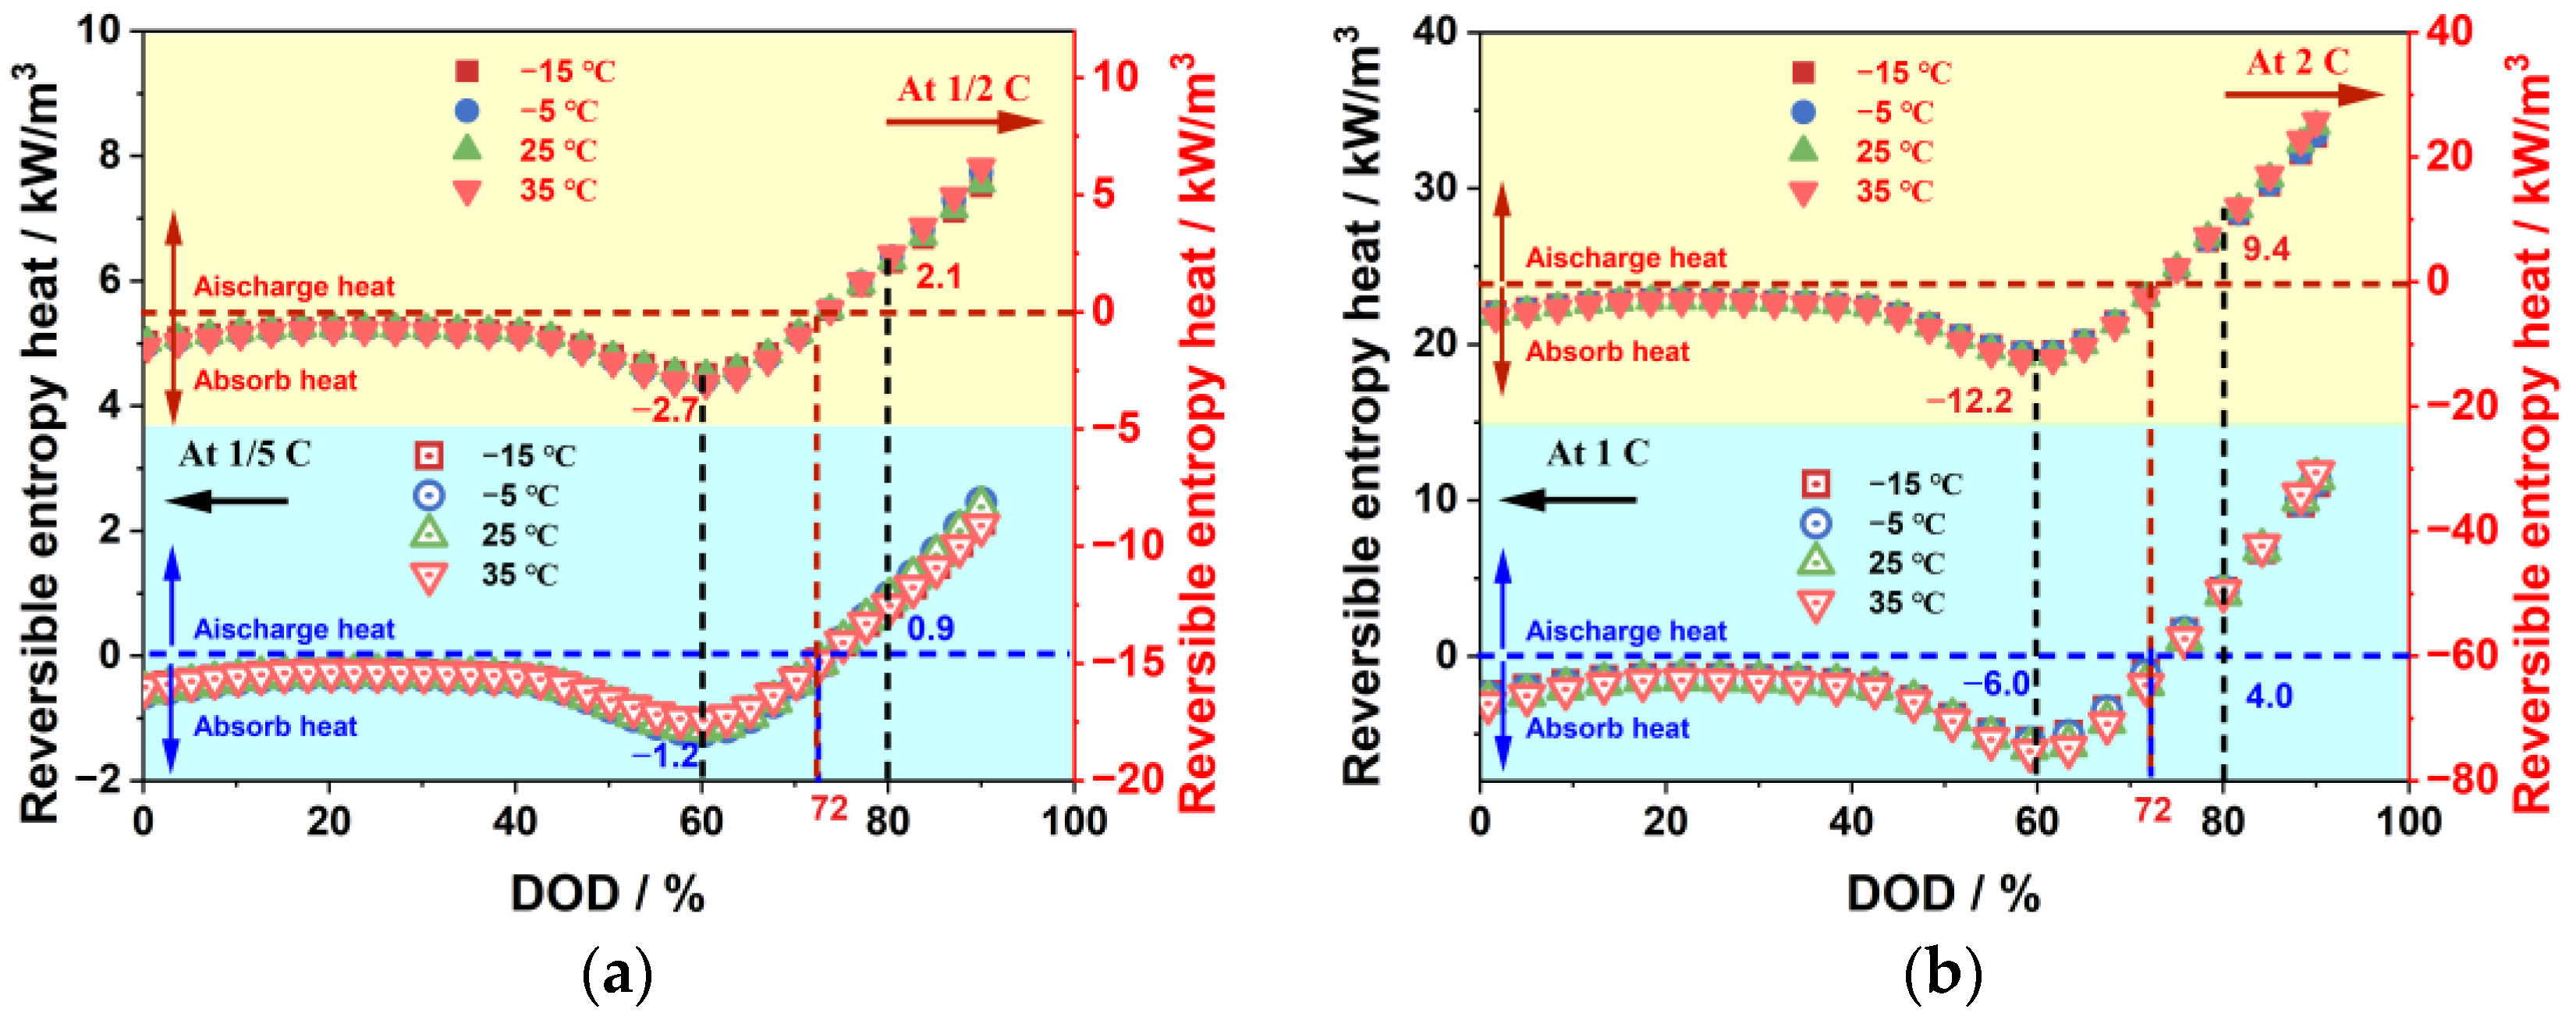
4.2.3. Reversible Entropy Heat Characteristics

Figure 17 illustrates how discharge rate and ambient temperature affect reversible entropy heat. The reversible entropy heat is mostly negative in the 0% to 72% DOD interval and positive in the 72% to 90% DOD interval, with a relatively small value throughout the discharge process. For consistency with other types of heat generation, the reversible entropy heat is defined as positive when discharging heat and negative when absorbing heat. Thus, the reversible entropy heat suppresses the total heat generation of the battery in the 0% to 72% DOD range and promotes it in the 72% to 90% DOD range. It is noteworthy that within the 40% to 60% DOD range, this inhibitory effect becomes increasingly pronounced with the escalation in DOD. Conversely, within the 72% to 90% DOD range, the enhancing influence of reversible entropy enthalpy on total heat generation becomes more conspicuously evident as DOD rises.
Overall, the influence of ambient temperature on reversible entropy enthalpy appears relatively minor, whereas the discharge rate exhibits a more pronounced impact on reversible entropy enthalpy. Within the 0% to 72% discharge depth range, reversible entropy enthalpy increasingly restrains battery heat generation with rising discharge rates. Specifically, at 25 °C and a 60% depth of discharge (DOD), the reversible entropy enthalpy values for 1/5 C, 1/2 C, 1 C, and 5 C are −1.2, −2.7, −6.0, and −12.2 kW/m³, respectively. However, within the 72% to 90% discharge depth range, reversible entropy enthalpy promotes battery heat generation with increasing discharge rates. For instance, at an 80% DOD, the reversible entropy enthalpy values for 1/5 C, 1/2 C, 1 C, and 5 C are 0.9, 2.1, 4.0, and 9.4 kW/m³, respectively.

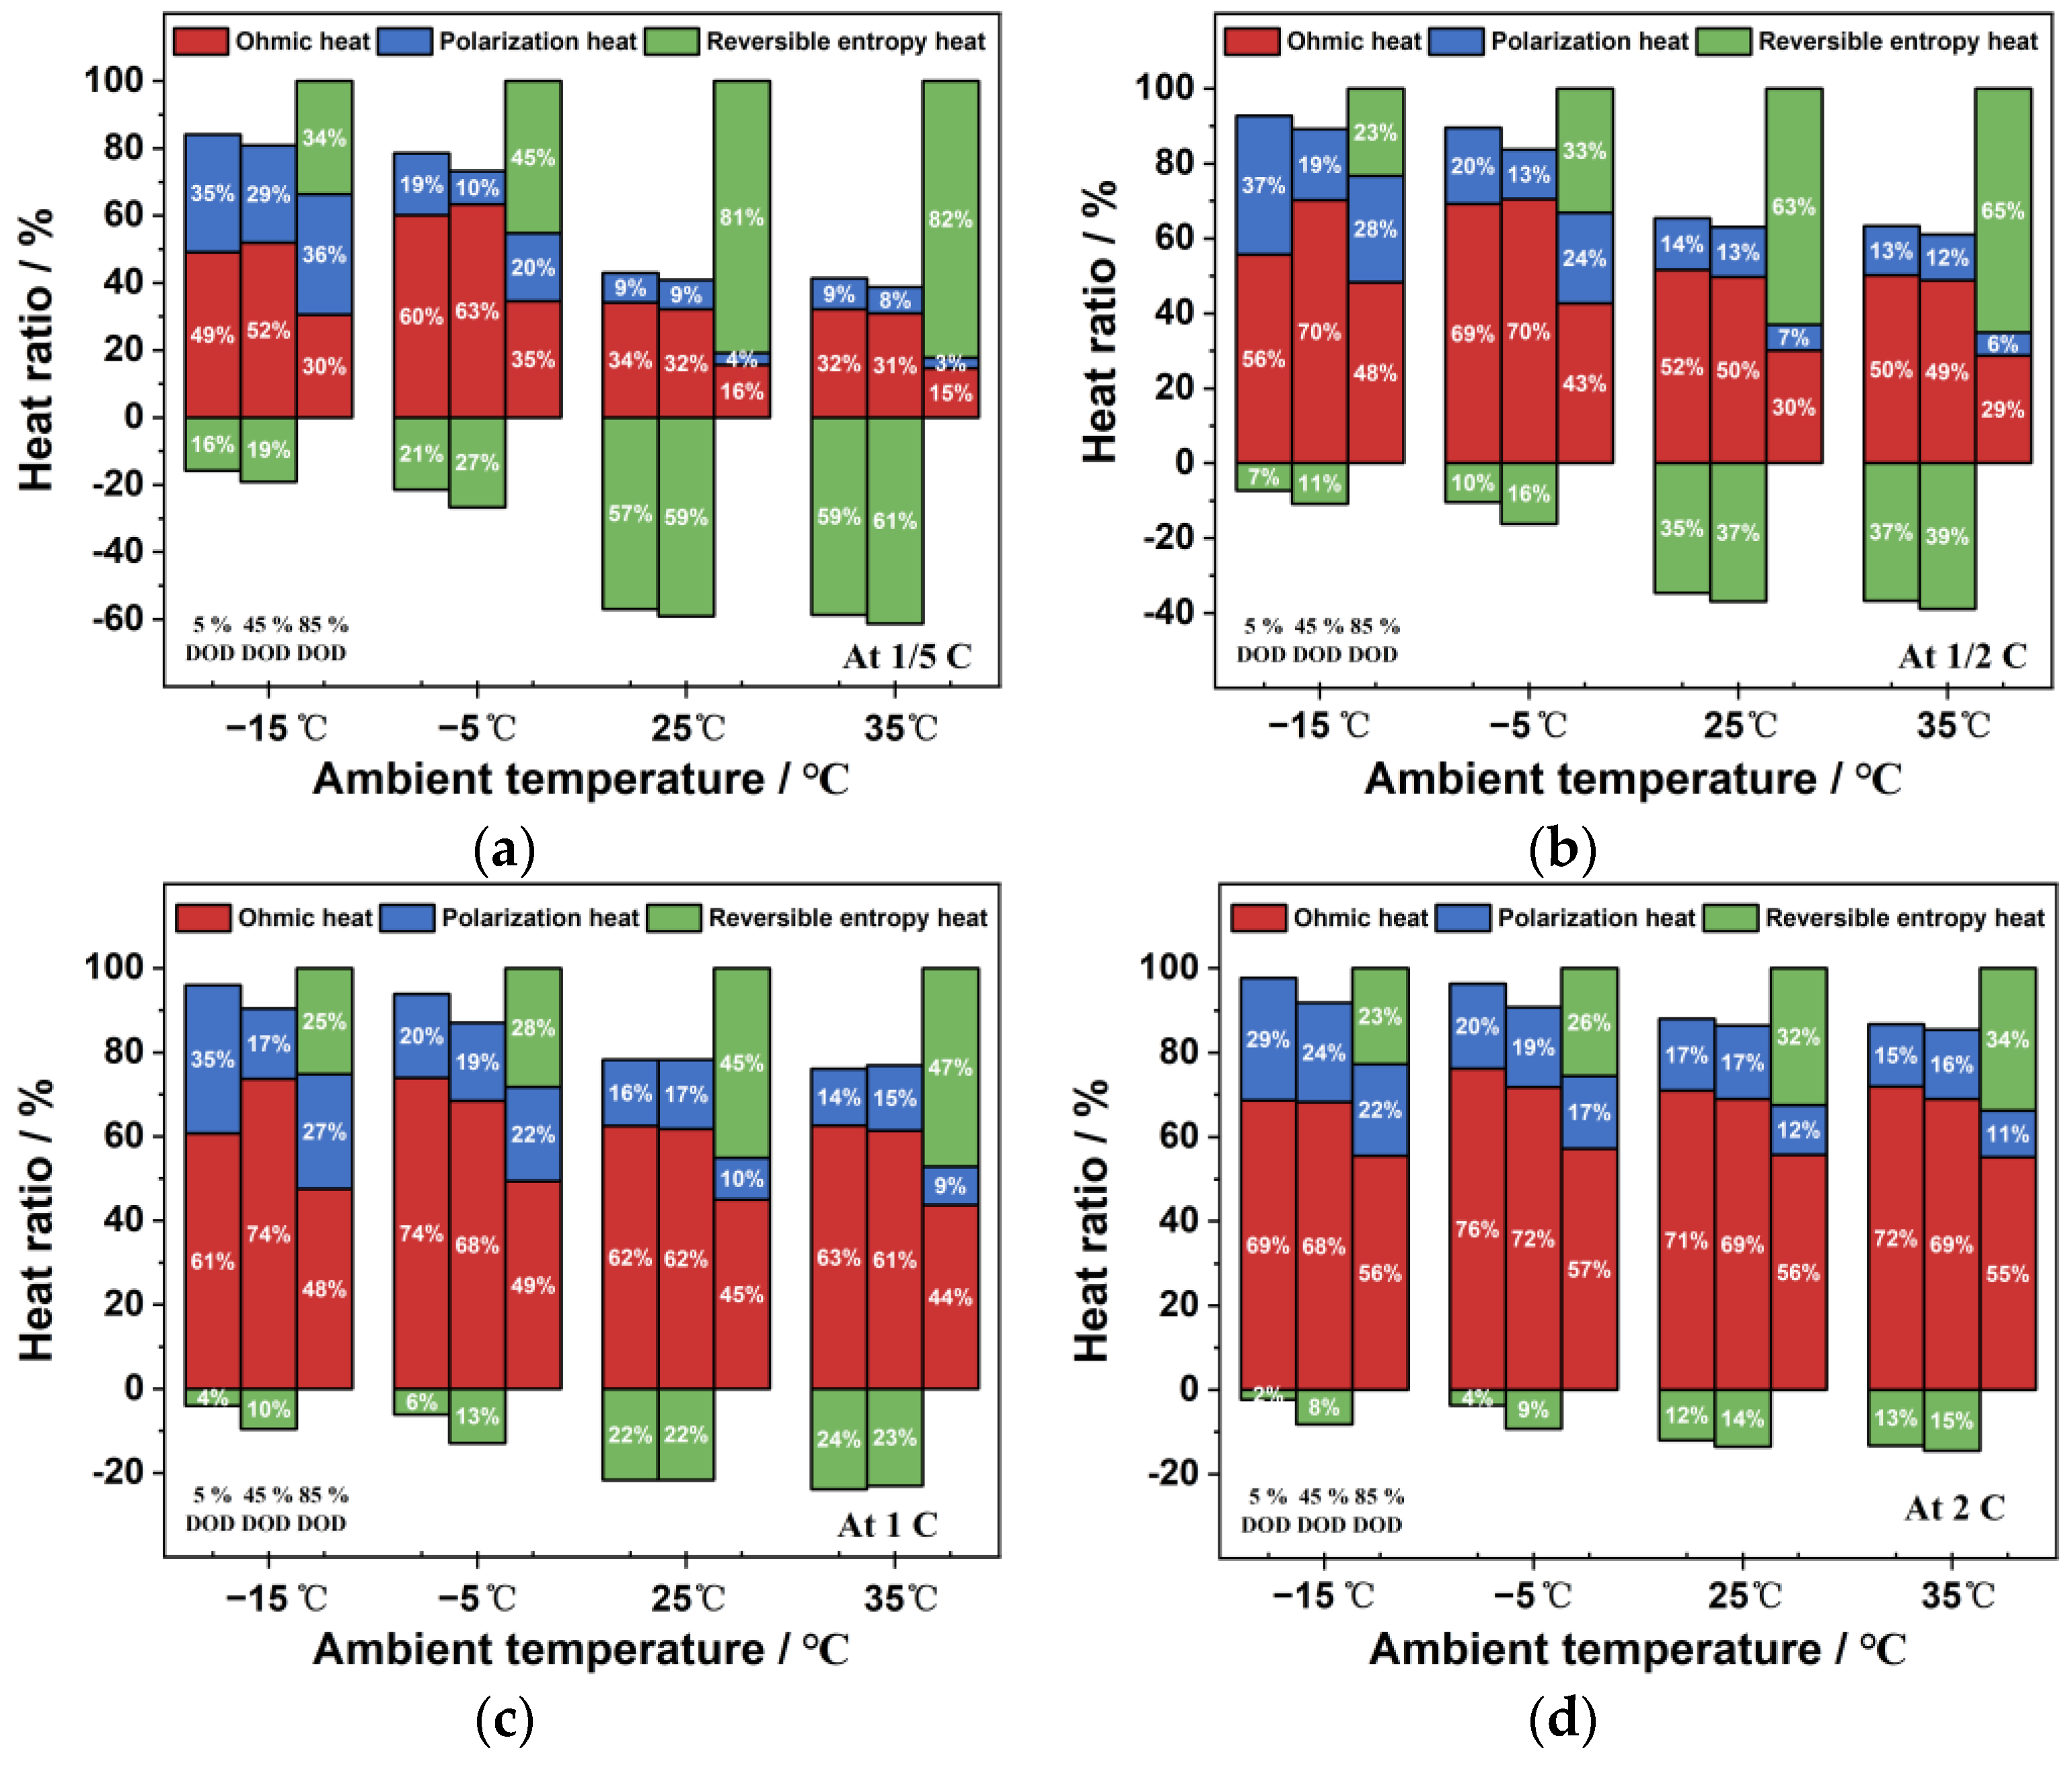
4.2.4. Proportion of Heat Generation Types

Figure 18 illustrates the impact of discharge rate and ambient temperature on the proportion of various types of heat generation. Both ohmic heat generation and polarization heat generation contribute to the total heat generation of the battery at any ambient temperature, while reversible entropy heat only promotes the total heat generation of the battery at the end of discharge. As the ambient temperature increases, the proportion of ohmic heat generation and polarization heat generation gradually decreases, while the proportion of the reversible entropy heat effect increases. Therefore, when simulating battery thermal behavior in a high-temperature environment, it is crucial to consider the entropy heat coefficient and reversible entropy heat to enhance simulation accuracy. As the discharge rate increases, the proportion of ohmic heat generation gradually increases, and the proportion of polarization heat generation decreases in low-temperature environments, but it increases in normal- and high-temperature environments. The concentration polarization heat generation is highly sensitive to ambient temperature. The proportion of reversible entropy heat effect decreases with the increase in the discharge rate, as the ohmic heat generation dominates under high-rate discharge since it is proportional to the square of the current, whereas the reversible entropy heat in the Bernardi heat generation rate equation is proportional to the current.

5. Conclusions

This study sought to evaluate the electric–thermal characteristics of batteries through the development of an electric–thermal coupling model. Under varied ambient temperatures and discharge rates, the battery’s polarization and heat generation characteristics were examined. The following are the primary conclusions:
  • The electric–thermal coupling simulation model was validated by using experimental data under different discharge rates and ambient temperatures. The comparisons show how effectively the generated model simulates the electrical and thermal characteristics of the battery under various operation conditions.
  • The impact of discharge rate and ambient temperature on the battery’s ohmic, electrochemical, and concentration polarizations was analyzed, revealing that these factors have a significant effect on these polarization types. Specifically, low-temperature environments and high discharge rates resulted in a significant increase in these polarization values, with the greatest changes observed during the discharge process. In contrast, these values remained stable at ambient temperature and low discharge rates. The proportion of ohmic polarization was found to be the highest among the three types, accounting for approximately 80% of the total polarization, while electrochemical polarization was the least significant at about 3%, and concentration polarization was about 17%.
  • The ohmic heat generation and polarization heat generation increase significantly at high discharge rates and low ambient temperatures, while the reversible entropy heat is less affected by ambient temperatures and increases significantly with the increase in discharge rates. The ohmic heat generation and polarization heat generation contribute to the total heat generation of the battery at any ambient temperature, and the reversible entropy heat contributes to the total heat generation of the battery only at the end of the discharge period. At low discharge rates and high ambient temperatures, the entropy heat coefficient and reversible entropy heat are crucial factors in the thermal simulation of batteries.

Author Contributions

Conceptualization, J.L.; data curation, J.G.; supervision, J.L.; writing—review and editing, J.G., Q.G., J.L. and H.W. All authors have read and agreed to the published version of the manuscript.

Funding

This study is supported by the National Key Research and Development Program of China (no. 2022YFB2502304).

Data Availability Statement

All relevant data are within the paper.

Conflicts of Interest

The authors declare no conflict of interest.

References

  1. Voskuijl, M. Cruise Range in Formation Flight. J. Aircr. 2017, 54, 2184–2191. [Google Scholar] [CrossRef]
  2. Xue, Q.; Li, J.; Chen, Z.; Zhang, Y.; Liu, Y.; Shen, J. Online Capacity Estimation of Lithium-Ion Batteries Based on Deep Convolutional Time Memory Network and Partial Charging Profiles. IEEE Trans. Veh. Technol. 2022, 72, 444–457. [Google Scholar] [CrossRef]
  3. Mathieu, R.; Briat, O.; Gyan, P.; Vinassa, J.-M. Fast charging for electric vehicles applications: Numerical optimization of a multi-stage charging protocol for lithium-ion battery and impact on cycle life. J. Energy Storage 2021, 40, 102756. [Google Scholar] [CrossRef]
  4. Hales, A.; Prosser, R.; Diaz, L.B.; White, G.; Patel, Y.; Offer, G. The Cell Cooling Coefficient as a design tool to optimise thermal management of lithium-ion cells in battery packs. Etransportation 2020, 6, 100089. [Google Scholar] [CrossRef]
  5. Hua, X.; Heckel, C.; Modrow, N.; Zhang, C.; Hales, A.; Holloway, J.; Jnawali, A.; Li, S.; Yu, Y.; Loveridge, M. The prismatic surface cell cooling coefficient: A novel cell design optimisation tool & thermal parameterization method for a 3D discretised electro-thermal equivalent-circuit model. Etransportation 2021, 7, 100099. [Google Scholar]
  6. Qin, P.; Sun, J.; Yang, X.; Wang, Q. Battery thermal management system based on the forced-air convection: A review. Etransportation 2021, 7, 100097. [Google Scholar] [CrossRef]
  7. Koch, S.; Birke, K.; Kuhn, R. Fast Thermal Runaway Detection for Lithium-Ion Cells in Large Scale Tractiones Batteri. Batteries 2018, 4, 16. [Google Scholar] [CrossRef]
  8. Aiello, L.; Hanzu, I.; Gstrein, G.; Ewert, E.; Ellersdorfer, C.; Sinz, W. Analysis and Investigation of Thermal Runaway Propagation for a Mechanically Constrained Lithium-Ion Pouch Cell Module. Batteries 2021, 7, 49. [Google Scholar] [CrossRef]
  9. Lai, X.; Chen, Q.; Tang, X.; Zhou, Y.; Gao, F.; Guo, Y.; Bhagat, R.; Zheng, Y. Critical review of life cycle assessment of lithium-ion batteries for electric vehicles: A lifespan perspective. Etransportation 2022, 12, 100169. [Google Scholar] [CrossRef]
  10. Su, L.; Wu, M.; Li, Z.; Zhang, J. Cycle life prediction of lithium-ion batteries based on data-driven methods. Etransportation 2021, 10, 100137. [Google Scholar] [CrossRef]
  11. Du, M.; Li, Q.; Pang, H. Oxalate-derived porous prismatic nickel/nickel oxide nanocomposites toward lithium-ion battery. J. Colloid Interface Sci. 2020, 580, 614–622. [Google Scholar] [CrossRef] [PubMed]
  12. Xia, R.; Zhao, K.; Kuo, L.Y.; Zhang, L.; Cunha, D.M.; Wang, Y.; Huang, S.; Zheng, J.; Boukamp, B.; Kaghazchi, P.; et al. Nickel Niobate Anodes for High Rate Lithium-Ion Batteries. Adv. Energy Mater. 2021, 12, 2102972. [Google Scholar] [CrossRef]
  13. Zheng, W.; Bi, W.; Gao, X.; Zhang, Z.; Yuan, W.; Li, L. A nickel and cobalt bimetal organic framework with high capacity as an anode material for lithium-ion batteries. Sustain. Energy Fuels 2020, 4, 5757–5764. [Google Scholar] [CrossRef]
  14. Xiaomei, J.; Yanjun, C.; Xiaokai, M.; Weiguo, C.; Changcheng, L.; Que, H.; Nithesh, N.; Vignesh, M.; Mina, H.; Zhanhu, G. The impact of electrode with carbon materials on safety performance of lithium-ion batteries: A review. Carbon 2022, 191, 448–470. [Google Scholar]
  15. Onishchenko, D.V.; Popovich, A.A.; Boiko, Y.N. Carbon-silicon anode composites for lithium-ion (polymer) rechargeable batteries. Russ. J. Non-Ferr. Met. 2010, 51, 169–172. [Google Scholar] [CrossRef]
  16. Wang, L.; Ding, C.X.; Zhang, L.C.; Xu, H.W.; Zhang, D.W.; Cheng, T.; Chen, C.H. A novel carbon–silicon composite nanofiber prepared via electrospinning as anode material for high energy-density lithium ion batteries. J. Power Sources 2010, 195, 5052–5056. [Google Scholar] [CrossRef]
  17. Wenjie, T.; Shuai, L.; Sandile, F.; Jiangang, H.; Jiaxin, W.; Chen, W.; Jianqiang, C. Ionic liquid-induced interfacially bonding of bio-based RH-Si/SiOx@C anodes for enhanced ultra-long cycling of Li-ion batteries. Mater. Chem. Phys. 2022, 291, 126671. [Google Scholar]
  18. Yang, X.-G.; Liu, T.; Wang, C.-Y. Thermally modulated lithium iron phosphate batteries for mass-market electric vehicles. Nat. Energy 2021, 6, 176–185. [Google Scholar] [CrossRef]
  19. Yue, M.; Lv, Z.; Zheng, Q.; Li, X.; Zhang, H. Battery assembly optimization: Tailoring the electrode compression ratio based on the polarization analysis in vanadium flow batteries. Appl. Energy 2018, 235, 495–508. [Google Scholar] [CrossRef]
  20. Haber, S.; Leskes, M. Dynamic Nuclear Polarization in battery materials. Solid State Nucl. Magn. Reson. 2021, 117, 101763. [Google Scholar] [CrossRef]
  21. Qiu, C.; He, G.; Shi, W.; Zou, M.; Liu, C. The polarization characteristics of lithium-ion batteries under cyclic charge and discharge. J. Solid State Electrochem. 2019, 23, 1887–1902. [Google Scholar] [CrossRef]
  22. Luyao, Z.; Minxue, Z.; Junming, Z.; Hong, L.; Wei, L.; Mingyi, C. Numerical modeling of thermal runaway for low temperature cycling lithium-ion batteries. J. Energy Storage 2023, 63, 107053. [Google Scholar]
  23. Zhizuan, Z.; Xiaodong, Z.; Bei, C.; Lizhong, Y.; Liew, K.M. Investigating the relationship between heating temperature and thermal runaway of prismatic lithium-ion battery with LiFePO4 as cathode. Energy 2022, 256, 124714. [Google Scholar]
  24. Kalaf, O.; Solyali, D.; Asmael, M.; Zeeshan, Q.; Safaei, B.; Askir, A. Experimental and simulation study of liquid coolant battery thermal management system for electric vehicles: A review. Int. J. Energy Res. 2021, 45, 6495–6517. [Google Scholar] [CrossRef]
  25. Jiang, Z.; Li, H.; Qu, Z.; Zhang, J. Recent progress in lithium-ion battery thermal management for a wide range of temperature and abuse conditions. Int. J. Hydrogen Energy 2022, 47, 9428–9459. [Google Scholar] [CrossRef]
  26. Ji, H.; Luo, T.; Dai, L.; He, Z.; Wang, Q. Numerical investigation on the polarization and thermal characteristics of LiFePO4-based batteries during charging process. Appl. Therm. Eng. 2022, 214, 118709. [Google Scholar] [CrossRef]
  27. Yu, Z.; Yang, J.; Yuan, Y.; Zhang, H.; Tian, S.; Lu, X.; Zhang, X.; Jiang, F.; Liu, Z.; Zhang, J.; et al. Distributed Measurement of Polarization Characteristics for a Multifunctional Integrated Optical Chip: A Review. IEEE Trans. Instrum. Meas. 2018, 68, 1543–1553. [Google Scholar] [CrossRef]
  28. He, X.; Sun, B.; Zhang, W.; Fan, X.; Su, X.; Ruan, H. Multi-time scale variable-order equivalent circuit model for virtual battery considering initial polarization condition of lithium-ion battery. Energy 2022, 244, 123084. [Google Scholar] [CrossRef]
  29. Lin, P.; Jin, P.; Hong, J.; Wang, Z. Battery voltage and state of power prediction based on an improved novel polarization voltage model. Energy Rep. 2020, 6, 2299–2308. [Google Scholar] [CrossRef]
  30. Fan, Y.; Yanlong, Q.; Degang, G. Lithium-ion battery polarization characteristics at different charging modes. Trans. China Electrotech. Soc. 2017, 32, 171. [Google Scholar]
  31. Lv, S.; Wang, X.; Lu, W.; Zhang, J.; Ni, H. The influence of temperature on the capacity of lithium ion batteries with different anodes. Energies 2021, 15, 60. [Google Scholar] [CrossRef]
  32. Sherfey, J.; Brenner, A. Electrochemical calorimetry. J. Electrochem. Soc. 1958, 105, 665. [Google Scholar] [CrossRef]
  33. Bernardi, D.; Pawlikowski, E.; Newman, J. A General Energy Balance for Battery Systems. J. Electrochem. Soc. 1985, 132, 5. [Google Scholar] [CrossRef]
  34. Renfeng, C.; Xingjuan, Z.; Han, Y.; Chao, W. Experimental study on heat generation characteristics of lithium-ion batteries using a forced convection calorimetry method. Appl. Therm. Eng. 2022, 219, 119559. [Google Scholar]
  35. Rui, H.; Yidan, X.; Qichao, W.; Junxuan, C.; Fenfang, C.; Xiaoli, Y. Simulation Study on Heat Generation Characteristics of Lithium-Ion Battery Aging Process. Electronics 2023, 12, 1444. [Google Scholar]
  36. Xie, Y.; Shi, S.; Tang, J.; Wu, H.; Yu, J. Experimental and analytical study on heat generation characteristics of a lithium-ion power battery. Int. J. Heat Mass Transf. 2018, 122, 884–894. [Google Scholar] [CrossRef]
  37. Hu, G.; Huang, P.; Bai, Z.; Wang, Q.; Qi, K. Comprehensively analysis the failure evolution and safety evaluation of automotive lithium ion battery. Etransportation 2021, 10, 100140. [Google Scholar] [CrossRef]
  38. Kong, D.; Wang, G.; Ping, P.; Wen, J. A coupled conjugate heat transfer and CFD model for the thermal runaway evolution and jet fire of 18650 lithium-ion battery under thermal abuse. Etransportation 2022, 12, 100157. [Google Scholar] [CrossRef]
  39. Peiyan, Q.; Jie, Z.M.; Da, J.; Kai, Y.; Jianling, L.; Yilin, L.; Fei, G.; Hao, L. Combustion characteristics of lithium–iron–phosphate batteries with different combustion states. Etransportation 2022, 11, 100148. [Google Scholar] [CrossRef]
  40. Piao, N.; Gao, X.; Yang, H.; Guo, Z.; Hu, G.; Cheng, H.-M.; Li, F. Challenges and development of lithium-ion batteries for low temperature environments. Etransportation 2022, 11, 100145. [Google Scholar] [CrossRef]
  41. Wang, H.; Xu, H.; Zhang, Z.; Wang, Q.; Jin, C.; Wu, C.; Xu, C.; Hao, J.; Sun, L.; Du, Z. Fire and explosion characteristics of vent gas from lithium-ion batteries after thermal runaway: A comparative study. Etransportation 2022, 13, 100190. [Google Scholar] [CrossRef]
  42. Zhang, Z.; Li, Z.; Yang, X.; Gong, J.; Zhang, J. Thermal management of parallel cells—Methodology based on non-linear dynamics. Etransportation 2022, 13, 100187. [Google Scholar] [CrossRef]
  43. Joula, M.; Dilibal, S.; Owusu-Danquah, J. Smart adaptronic thermal management system designs for the Li-ion battery packs. In Proceedings of the 2021 IEEE International Conference on Mechatronics (ICM), Kashiwa, Japan, 7–9 March 2021; IEEE: New York, NY, USA, 2021; pp. 1–6. [Google Scholar]
  44. Wang, X.; Wei, X.; Zhu, J.; Dai, H.; Zheng, Y.; Xu, X.; Chen, Q. A review of modeling, acquisition, and application of lithium-ion battery impedance for onboard battery management. Etransportation 2021, 7, 100093. [Google Scholar] [CrossRef]
  45. Zhu, L.; Xiong, F.; Chen, H.; Wei, D.; Li, G.; Ouyang, C. Thermal analysis and optimization of an EV battery pack for real applications. Int. J. Heat Mass Transf. 2020, 163, 120384. [Google Scholar] [CrossRef]
  46. Chen, Z.; Qin, Y.; Dong, Z.; Zheng, J.; Liu, Y. Numerical study on the heat generation and thermal control of lithium-ion battery. Appl. Therm. Eng. 2023, 221, 119852. [Google Scholar] [CrossRef]
  47. Ren, H.; Jia, L.; Dang, C.; Qi, Z. An electrochemical-thermal coupling model for heat generation analysis of prismatic lithium battery. J. Energy Storage 2022, 50, 104277. [Google Scholar] [CrossRef]
  48. Mei, W.; Li, H.; Zhao, C.; Sun, J.; Wang, Q. Numerical study on thermal characteristics comparison between charge and discharge process for lithium ion battery. Int. J. Heat Mass Transf. 2020, 162, 120319. [Google Scholar] [CrossRef]
  49. Xu, X.; Zhang, H.; Cao, L.; Yi, Z.; Li, P.; Guo, H. Heat generation and surrogate model for large-capacity nickel-rich prismatic lithium-ion battery as against 18650 battery. J. Loss Prev. Process Ind. 2022, 77, 104783. [Google Scholar] [CrossRef]
  50. Joula, M.; Dilibal, S.; Mafratoglu, G.; Danquah, J.O.; Alipour, M. Hybrid Battery Thermal Management System with NiTi SMA and Phase Change Material (PCM) for Li-ion Batteries. Energies 2022, 15, 4403. [Google Scholar] [CrossRef]
Figure 1. Schematic diagram of the performance test platform.
Batteries 09 00529 g001
Figure 2. Test for the entropy heat coefficient involves voltage and the ambient temperature.
Batteries 09 00529 g002
Figure 3. Entropy heat coefficients at different ambient temperatures.
Batteries 09 00529 g003
Figure 4. Variations in temperature in the experiment on the convective heat transfer coefficient.
Batteries 09 00529 g004
Figure 5. Second-order RC model circuit structure schematic diagram.
Batteries 09 00529 g005
Figure 6. The schematic diagram of pulse condition at an SOC point.
Batteries 09 00529 g006
Figure 7. The electric–thermal coupling mechanism’s schematic diagram.
Batteries 09 00529 g007
Figure 8. The single battery’s geometric model diagram.
Batteries 09 00529 g008
Figure 9. Experiment and simulation voltage verification: (a) −5 °C; (b) 25 °C.
Batteries 09 00529 g009
Figure 10. Experiment and simulation temperature verification: (a) −5 °C; (b) 25 °C.
Batteries 09 00529 g010
Figure 11. The effects of ambient temperature on ohmic polarization: (a) −1/5 C and 1/2 C; (b) 1/C and 2 C.
Batteries 09 00529 g011
Figure 12. The effects of ambient temperature on concentration polarization: (a) −1/5 C and 1/2 C; (b) 1/C and 2 C.
Batteries 09 00529 g012
Figure 13. The effects of ambient temperature on electrochemical polarization: (a) −1/5 C and 1/2 C; (b) 1/C and 2 C.
Batteries 09 00529 g013
Figure 14. The effects of ambient temperature on the proportion of polarization types: (a) −1/5 C; (b)1/2 C; (c) 1/C; (d) and 2 C.
Batteries 09 00529 g014
Figure 15. The effects of ambient temperature on ohmic heat: (a) −1/5 C and 1/2 C; (b) 1/ C and 2 C.
Batteries 09 00529 g015
Figure 16. The effects of ambient temperature on polarization heat: (a) −1/5 C and 1/2 C; (b) 1/ C and 2 C.
Batteries 09 00529 g016
Figure 17. The effects of ambient temperature on reversible entropy heat: (a) −1/5 C and 1/2 C; (b) 1/C and 2 C.
Batteries 09 00529 g017
Figure 18. Effect of ambient temperature on the proportion of heat types: (a) −1/5 C; (b)1/2 C; (c) 1/C; (d) and 2 C.
Batteries 09 00529 g018
Table 1. The parameters of the battery.
ParameterUnitValue
Nominal capacityAh104
Nominal voltageV3.66
Working voltageV2.8~4.2
Sizemm52 ∗ 148 ∗ 95
Weightkg1.7
Energy densityWh/kg220
State of charge window%5~100
Table 2. Equipment specification.
EquipmentTypeManufacturerRangeAccuracy
Battery charge/discharge test systemCT-8008-5 V 300 A-NTFAShenzhen Xinwei Electronics Co., Ltd., Shenzhen, China0 V~5 V
−200 A~+200 A
±0.05% FSR
High- and low-temperature humidity test chamberSC2-400-SD-3Guangdong Sanmu Technology Co., Ltd., Guangdong, China−70 °C~180 °C±1 °C
Thermocouple −200~260 °C±1 °C
Table 3. Additional thermophysical variables.
ParameterUnitValue
Average specific heat capacity of the batteryJ/(kg·K)1020
Thermal conductivity 17.8 (X direction)
W/(m·K)4.9 (Y direction)
8.8 (Z direction)
Densitykg/m32353
Surface convective heat transfer coefficientW/(m2·K)20.6
Positive terminal material-Al
Negative terminal material-Cu
Disclaimer/Publisher’s Note: The statements, opinions and data contained in all publications are solely those of the individual author(s) and contributor(s) and not of MDPI and/or the editor(s). MDPI and/or the editor(s) disclaim responsibility for any injury to people or property resulting from any ideas, methods, instructions or products referred to in the content.

