1. Introduction
In-depth research has recently focused on the large-scale application of Li-ion batteries in hybrid electric vehicles (HEVs) and backup power systems. Although LiCoO
2 is already successfully commercialized in small lithium-ion batteries, using it as the cathode material in large-scale lithium-ion batteries is still challenging due to safety problems and high cost [
1,
2]. Due to its relatively low cost and safer operation, LiFePO
4 is considered an ideal material to utilize as the cathode in large-scale lithium-ion batteries [
3,
4]. The additional benefits of LiFePO
4-based batteries for powering electric vehicles (EVs) and plug-in hybrid electric vehicles (PHEVs) are their high theoretical capacity (170 mAh g
−1), good electrochemical window (2–4 V), superior cycle performance, excellent thermal stability, environmental friendliness, low self-discharge, and the safety of olivine-type LiFePO
4 [
5,
6,
7,
8]. For two decades, LiFePO
4 has been the subject of extensive research for both scientific and engineering applications [
9]. Despite the numerous benefits, LiFePO
4 in LIBs still faces challenges, particularly because of the suboptimal low-temperature electrochemical performance in its transportation applications [
10,
11]. The low electrical conductivity of LiFePO
4 (around 10
−9 to 10
−10 S cm
−1 at room temperature) and its slow lithium-ion diffusivity (around 10
−14 to 10
−16 cm
2 s
−1 at room temperature) are the main reasons for its relatively poor low-temperature electrochemical performance [
12]. This is contrary to earlier reports that claim that the choice of the cathode material largely determines the low-temperature electrochemical performance of the battery [
13]. It is being highlighted that electrolytes, as well as electrodes, play a role in the low-temperature performance of LIBs. Since electrolytes not only function as a Li-ion running phase but additionally take on a role in electrolyte-interface reactions, like the development of solid electrolyte interfaces (SEI) and electrode reactions, substantial attempts have been made over the past ten years to enhance the low-temperature conductivity of electrolytes [
14]. It is clear that inadequate performance at low temperatures is directly correlated with the decreased ionic conductivity of electrolytes and the SEI. Nevertheless, a slow electrode reaction caused by the electrolyte part is related to the electrolyte-interface properties, including the wettability of the electrode and the composition of solvated Li-ion, in addition to ionic conductivity [
15]. Ionic conductivity affects the rate of charge and decreases in discharge, leading to reduced battery capacity and power output. Low temperatures can cause the electrolyte to become more viscous [
16]. The low-temperature environment can significantly slow down the diffusion of ions as well as impact the safety of the battery [
17]. Addressing these limitations often involves designing or selecting a battery system that can maintain its performance at low temperatures. Additionally, improving the overall thermal management of the battery can help mitigate the impact of low temperatures on performance.
Shin et al. discovered, in 2013, that pure LiFePO
4 improves battery cycle stability at lower operating temperatures (20 °C) [
18]. It was also found that bulk- and surface-deterioration was significantly reduced for low temperatures. In addition, significant efforts were made to improve the low-temperature electrochemical performance of the LiFePO
4 cathode, which include the following: (i) coating the surface of LiFePO
4 with carbon or other conducting materials to increase the electronic conductivity [
19], (ii) reducing the particle size to shorten diffusion distances and increase the surface area [
20], and (iii) doping with super-valent cations or metal oxides to improve the intrinsic electronic conductivity [
21]. Moreover, both the surface reaction kinetics and the rate of charge (for lithium-ions and electrons) diffusion inside the electrode bulk slow down with decreasing operating temperature [
22,
23]. Consequently, the electrode faces a greater challenge under such conditions.
Generally, carbon coating is considered highly efficient as it hinders particle growth during sintering, leading to reduced particle size. Additionally, it enhances the electronic conductivity of the active particles’ surface [
24,
25,
26]. This method is widely used and extensively studied. In other words, the combination of smaller particle size and carbon coating should significantly enhance the electrochemical performance of LiFePO
4 [
27]. In LFP (LiFePO
4)-based cathodes, various conductive fillers have been investigated, revealing a wide range of materials and techniques aimed at improving the electrochemical performance of these energy storage systems [
28]. These are alternative fillers, whereas conventional carbon additives, such as carbon black and graphite, have historically been crucial in improving electronic conductivity within LFP cathodes [
29]. Due to their exceptional electrical conductivity and mechanical toughness, carbon nanotubes (CNTs) have emerged as a promising candidate [
30]. Additionally, conductive polymer coatings have drawn attention for their potential to improve electronic and ionic conductivity while minimizing problems with carbon agglomeration. These coatings can be used alone or in conjunction with conventional carbon materials. LiFePO
4 materials with carbon coatings were successfully created by Zhao et al. in 2016, using polystyrene spheres (50–300 nm) as the carbon source [
31]. The results showed that LiFePO
4/C, which contains 3.0 percent carbon weight, performed well electrochemically at 20 °C, delivering 147 mAh g
−1 and 79.3 mAh g
−1 at 0.1 C and 1 C. Moreover, LiFePO
4/C showed approximately 100% capacity retention—even after 100 cycles at 1 C. This is due to the ideal thickness (2.5 nm) and suitable shape of the carbon coating [
32]. As an alternative, Yang et al. studied LiFePO
4/C porous microspheres with a double carbon coating and found an outstanding specific discharge capacity of 120 mAh g
−1 (10 C) at 20 °C [
33]. Additionally, utilizing polyvinylpyrrolidone and citric acid as complex carbon sources, Liu et al. examined LiFePO
4/C nanoparticles with a diameter of roughly 80 nm [
34]. Due to their small size and uniformly thin carbon coating, these nanoparticles demonstrated a good discharge capacity (126 mAh g
−1) at a discharge rate of 0.1 C at 20 °C.
In addition to conductive carbon coatings, metal ion doping is often used to increase LiFePO
4 conductivity [
35]. In order to effectively increase the low-temperature and high-rate performance of LiFePO
4, Zhang et al. combined carbon aerogel coating and metal-ion doping (lanthanum- and cerium-doped LiFePO
4/C) [
36]. Co-precipitation was used by Yang et al. to create a LiMn
0.8Fe
0.2PO
4/C cathode. In this way, both improved rates and low-temperature capabilities could be obtained [
37]. Nano-LiMn
0.8Fe
0.2PO
4/C supplied 97 mAh g
−1 at 0.1 C—even at low temperatures (15 °C). LiFePO
4/C-Sn exhibited excellent electrochemical performance across a wide range of operating temperatures, particularly at low temperatures, when Lin et al. coated the surface of LiFePO
4 with Sn nanoparticles [
38]. It appears that all prior studies of the low-temperature performance of LiFePO
4 consistently showed that its reversible capacity and rate capability could be significantly reduced during operation at low temperatures [
39].
Increasing the driving range and enhancing lithium-ion battery longevity are the two primary development goals for electric cars. The energy density of lithium-ion batteries directly affects their longevity, and their endurance increases with increasing energy density, as well as extending the operational temperature range and reducing charging time. In addition, enhancing the energy density of lithium-ion batteries can be achieved in several ways [
40]. The injection volume of the entire battery can be reduced by increasing the difference between the median voltages of the positive and negative electrode, as well as the gram capacity of the positive and negative electrode [
41,
42]. If the positive electrode materials are of identical types and the lithium-ion battery’s overall weight and positive electrode volume are fixed, the energy density can be increased by increasing the positive electrode material’s proportion rather than its overall volume [
43]. Furthermore, reduced capacitance during fast charge and discharge can be due to very high resistance, inadequate adhesion, and a decreased ratio of conductive carbon to binder [
44]. Presently, cathode materials constitute 70% of the materials used in academic research. Thus, the percentage of LFP was increased in this study to 88%, and the electrochemical performance and mechanical stability were taken into account using the best active carbon–material balance ratio.
2. Results and Discussion
FE-SEM images of Super P conductive carbon at different magnifications are shown in
Figure 1a–d. Super P appears granular, and stacking occurs. This characteristic of Super P can facilitate the filling of the positive electrode material’s particles. To develop positive LFP electrode materials with the optimal amount of conductive additive and binder, the LiFePO
4 mother powder was supplemented with varying quantities of Super P conductive carbon material as an additive.
The adhesion force measurement was carried out with an adhesion tester (MIT-AT12). To obtain samples for the adhesion test, we cut 100 tiny squares (0.25 × 0.25 cm
2) into the surface of a positive LiFePO
4 electrode sheet made with different Super P ratios. The cutting speeds were 20 to 50 mm/s in the horizontal and vertical directions. To evaluate the adherence of the LiFePO
4 cathode coating, any burrs were removed with a soft brush, and the sample was attached to the grid’s surface with a special test tape. The peeling of the surface coat was evaluated according to six different categories—see
Table 1.
Figure 2a–f show the adhesion test results of the SP_3%, SP_4%, SP_5%, SP_5.5%, SP_6%, and SP_7% samples. The SP_3% sample showed the strongest adhesion, with only small pieces peeling off at the incision’s intersection. On the other hand, the SP_7% sample showed large pieces that peeled off at the edges of the squares, which suggests the weakest adhesion. The adhesion steadily declines as the amount of conductive carbon material increases (and the amount of binder decreases).
Table 2 shows the adhesion grade for all samples. AC impedance analysis is one of the most complex techniques in electrochemical research. It is an AC test technique where a sine wave signal with a specific amplitude, but variable frequency, is applied to the electrochemical system to receive current feedback. The charge transfer resistances and Li
+ ion diffusion coefficients of LiFePO
4 cathode material samples were determined using a coin cell battery configured as a “prepared LiFePO
4 cathode//lithium hexafluorophosphate LiPF
6+ ethylene carbonate (EC)/dimethyl carbonate (DMC)+ vinylene carbonate (VC) electrolyte//Li metal” in the frequency range of 7 × 10
6—0.01 Hz under open circuit voltage.
The curve features two distinct segments: a high-frequency semicircle and a low-frequency oblique straight line. These represent the charge-transfer process and the diffusion resistance of the Li
+ ion in the electrochemical reaction, respectively, when the electrode reaction is controlled by both charge transfer and Li
+ ion diffusion [
45]. Here the Randles equivalent circuit [
46] was used as a fitting model, and EIS was used to simulate the Li
+ diffusion process. R
e denotes the combined resistance of the electrolyte and electrode material, also known as the solution resistance. This value is indicated by the high-frequency region’s semicircle intercept. The charge transfer resistance of the positive electrode/electrolyte interface, represented by R
ct, is the diameter of the semicircle. Z
w is the reaction-diffusion process’s Warburg impedance, which corresponds to the oblique line in the low-frequency region, from which the Li
+ ion diffusion coefficient can be calculated. The resulting AC impedance curves are shown in
Figure 3. It can also be plotted as a function of ω
−1/2 (ω is the angular frequency, ω = 2πƒ) using the real impedance (Z′), which is shown in
Figure 4. The slope σ (Equation (1)) [
47] is obtained from the linear fit of Z′ to ω
−1/2 from
Figure 4, and the value of the slope is substituted in Equation (2) [
48] to calculate the Li
+ ion diffusion coefficient (D
EIS) of the battery.
where R: gas constant (J K
−1 mol
−1), T: working temperature (K), A: pole piece area (cm
2), n: number of electrons transferred, F: Faraday’s constant (C mol
−1), and C: concentration of lithium ions in the cathode material (mole cm
−3).
Table 3 shows the results of the impedance simulation and the resulting Li
+ ion diffusion coefficient. Based on these findings, SP_5.5% has the lowest charge-transfer resistance (67 Ω) and the highest Li
+ ion diffusion coefficient, whereas SP_4% has the highest electrode resistance (9.97 Ω) and the lowest Li
+ ion diffusion coefficient. SP_5.5% has a lower Re than all other samples, and the sample battery has a higher Re before the discharge test. This suggests that the diffusion resistance of Li
+ ions between solutions is higher. Additionally, it has been shown that the sample’s charge-transfer resistance first increases before it decreases as the amount of conductive carbon increases. The trend remains unchanged despite an order of magnitude divergence from the Li
+ ion diffusion coefficient determined based on CV. Hence, the ideal fractions for LiFePO
4, Super P, and PVDF are LiFePO
4 = 88%, Super P = 5.5%, and PVDF = 6.5%.
The redox behavior of materials throughout the charging/discharging process was examined using cyclic voltammetry. To determine the relationship between voltage and current, testing involved fixing the scan cut-off voltage range, setting a certain scan rate, and repeated scanning. Here, six different scan rates (0.1, 0.2, 0.25, 0.5, 0.75, and 1 mV s
−1) were chosen, with the cut-off voltage varying from 2.8 to 4.0 V. The oxidation of the samples can be seen in
Figure 5. The figure shows the CV curves for the SP_3%, SP_4%, SP_5%, SP_5.5%, SP_6%, and SP_7% samples and a scan rate of 0.1 mV s
−1. The most symmetrical and sharply decreasing peak indicates the highest electrochemical reversibility as well as the easiest intercalation and deintercalation of Li
+ ions for the given ratio. The redox findings of the samples SP_3%, SP_4%, SP_5%, SP_5.5%, SP_6%, and SP_7% at various scan rates are shown in
Figure 6a–f. Furthermore, the peak currents associated with the oxidation and reduction peaks increase with the scan rate. The voltage difference (ΔV) between the redox peaks also widens gradually, which reflects the polarization of the positive electrode. It also increases and changes to a higher potential and lower potentials, respectively. The smaller the ΔV is, the less pronounced the polarization is.
Table 4 shows the ΔV values for every sample at different scan speeds. SP_5.5% has the smallest ΔV (representing the intercalation/deintercalation of Li
+ ions into LFP) among all scan rates—as well as excellent reversibility. In addition, SP_5.5% also shows the lowest polarization, the best kinetic performance, and the best electrochemical reversibility.
The peak current (I
p) was plotted as a function of the square root of the scan rate (ν
1/2)—see
Figure 7a–d. After linear fitting, a slope (dI/dν
1/2) can be obtained, which is substituted into the Randles–Sevcik Equation (Equation (3)) [
49], and the D
CV value of the diffusion coefficient for the Li
+ ions in the battery can be calculated:
where D
CV: Li
+ ion diffusion coefficient (cm
2 s
−1), I
P: peak indicated current (A), C: lithium ion concentration in the electrode (mole), S: pole piece area (cm
2), n: number of electrons transferred (mol), F: Faraday’s constant (96,500 C·mol
−1), ν: scan rate (V), R: gas constant (8.314 J K
−1 mol
−1), and T: working temperature (K).
Table 5 shows the calculated diffusion coefficients for the Li
+ ions. According to the results, the maximum diffusion coefficient (2.6 × 10
−10 cm
2 s
−1) of the Li
+ ion was observed for SP_5.5%, and when the carbon content and the conductivity increased, the diffusion coefficient increased before it decreased.
Lithium served as the negative electrode in the battery, while LiFePO
4 with different quantities of conductive carbon was used as the positive electrode, with 1 M LiPF
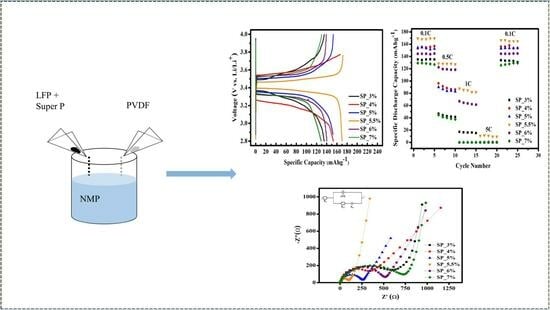
6 and EC/EMC/DMC = 1:1:1 + 1 vol% VC as the electrolyte. The battery was placed in the Jiayou Technology BAT-750B charge/discharge apparatus and subjected to four distinct charge/discharge rates—0.1 C (600 min), 0.5 C (120 min), 1 C (60 min), 5 C (12 min), and 10 C (6 min)—at room temperature. Each sample had a cut-off voltage range of 2.8–4.0 V. The charge/discharge curves for the samples SP_3%, SP_4%, SP_5%, SP_5.5%, SP_6%, and SP_7% are shown in
Figure 8a, with a charge/discharge rate of 0.1 C. The discharge capacities of SP_3%, SP_4%, SP_5%, SP_5.5%, SP_6%, and SP_7% were 135.1 mAh g
−1, 152.2 mAh g
−1, 152.9 mAh g
−1, 169.8 mAh g
−1, 139.2 mAh g
−1, and 129.2 mAh g
−1, respectively. SP_5.5% had the highest discharge capacity as well as the highest charge/discharge window. The intercalation and deintercalation of Li
+ ions during the charge/discharge process are the basis of the charge/discharge platform. In other words, this ratio improves Li
+ diffusion during the charge/discharge process and increases the discharge capacity.
Furthermore, as the conductive carbon content increases, the sample’s discharge capacity increases, peaking at 6% carbon. Subsequently, the capacity starts to decline due to insufficient binder presence. Taking into account the adhesion test results, this behavior is likely due to a weak bond between the particles and the Al substrate.
Figure 8b displays the charge/discharge curves of each sample at different charge/discharge rates. The rates range from low to high, and the discharge capacity of every sample shows different degrees of decline. Notably, only SP_5.5% can successfully manage a 5 C high-rate charge/discharge. After four different charge/discharge rate tests and returning to 0.1 C, the discharge capacity was 166.5 mAh g
−1 with a retention of 98%. These numbers indicate that, for this ratio, the structure did not collapse even following a high-rate charge/discharge, and the battery remained stable.
3. Materials and Methods
In this work, the positive electrode sample was prepared using LiFePO
4, Super P (99%, Taiwan Libo, Taichung City, Taiwan), and poly (vinylidene fluoride), PVDF, (99%, Jingming Chemical, Taipei, Taiwan), which were mixed in the solvent N-methyl pyrrolidone, NMP, (99%, Jingming Chemical) with different weight ratios. The amount of Super P varied (3%, 4%, 5%, 5.5%, 6%, and 7%) to study the effect on the electrochemical properties. The sample ratios used are shown in
Table 6. Firstly, PVDF was added to NMP, centrifuged, and left for 1 h so that the powder dissolved completely. Then, LiFePO
4 powder was added with different amounts of Super P, centrifuged, and left again for 1 h to form a slurry after mixing. The slurry was evenly applied to the aluminum foil using the doctor blade method with a 200 μm squeegee. The sample was then subjected to a vacuum at 100 °C for 48 h to remove residual solvent, resulting in the preparation of the LiFePO
4 cathode sheet. In addition to the Super P content, the coating thickness is very important to improve the homogeneity of the Li-ion flux. Therefore, we controlled the coating thickness by adjusting the viscosity of the slurry and the withdrawal speed during the doctor blade coating process. Specifically, we prepared slurries with different viscosities by varying the NMP solvent content and adjusting the coating speed to obtain the desired coating thickness. We also used a micrometer to measure the thickness to ensure consistency and accuracy. Furthermore, the sheet was rolled and cut into small discs with a diameter of 13 mm to complete the production of the positive electrode. The vacuum-dried cathode piece was then cut into a small disc with a diameter of 13 mm for use in a standard R2032 coin cell. The coin cells were assembled inside a glove box in an argon atmosphere with lithium as the anode and 1 mol LiPF
6 + EC/EMC/DMC = 1:1:1 vol% + 1% VC electrolyte, while keeping a standardized electrolyte-to-electrode ratio of 5 µL/mg. After keeping the sample in the same atmosphere for one day, the electrochemical performance test was carried out. The gravimetric loading of the LFP cathodes was 24.18 mg/cm
2 and the 1C current density was 0.54604 mA/cm
2.
An electrochemical analysis and examination of the properties of the prepared cathodes were performed as follows: The particle size and morphology of the Super P conductive carbon material powder were observed using field emission scanning electron microscopy (FE-SEM, JEOL JSM-6701F, Tokyo, Japan). A laser particle size analyzer (Beckman Coulter Particle Analyzer PN A54412, Brea, CA, USA) was used for the dynamic light scattering (DLS) analysis. An adhesion tester (MIT-AT12, Taichung City, Taiwan) was used to evaluate the positive LiFePO4 electrodes made of different amounts of conductive carbon. For the adhesive force measurement, after cutting the grid pattern and penetrating the coating, it was pasted with a special test tape according to the peeling of the coating. The adhesion of the coating to the substrate separation was evaluated and classified into six grades to assess its quality. Cyclic voltammetry (CV) was performed using a potentiostat (Jihan-5640, Taipei, Taiwan) at different scan rates (0.1, 0.2, 0.25, 0.5, 0.75, and 1 mVs−1) with a voltage range of 2.8–4.0 V. Electrochemical impedance spectroscopy (EIS) was performed using a potentiostat (VSP-300, BioLogic, Seyssinet-Pariset, France) at 0.01–7 MHz under open circuit voltage. The capacity and rate performance of the fabricated coin cells were evaluated using a charge/discharge cell test instrument (Acutech Systems, BAT-750B, New Taipei City, Taiwan).


