Article

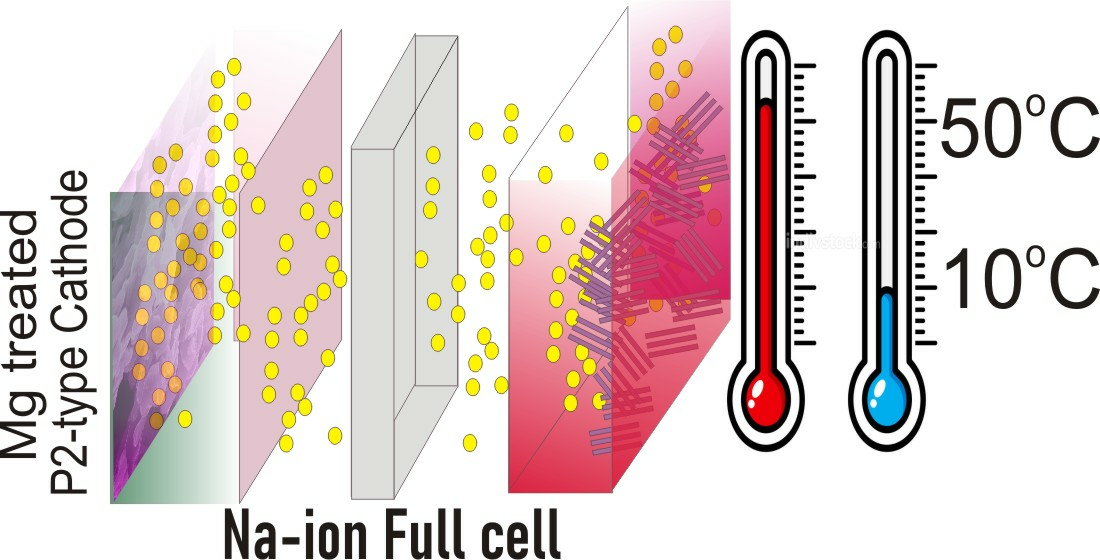
High-Performance Full Sodium Cells Based on MgO-Treated P2-Type Na0.67(Mn0.5Fe0.5)1−xCoxO2 Cathodes

1
Physics Department, Inonu University, 44280 Malatya, Turkey
2
Institute of General and Inorganic Chemistry, Bulgarian Academy of Sciences, 1113 Sofia, Bulgaria
3
Vocational School of Health Service, Inonu University, 44280 Malatya, Turkey
4
Nanoscience & Technology Department, National Centre for Physics, Islamabad 45320, Pakistan
5
Physics Department, Istanbul Medeniyet University, 34720 Istanbul, Turkey
6
Department of Chemistry, Bogazici University, 34342 Istanbul, Turkey
7
TÜBITAK Rail Transport Technologies Institute, Energy Storage Division, TÜBİTAK Gebze Campus, 41470 Kocaeli, Turkey
*
Authors to whom correspondence should be addressed.
Batteries 2023, 9(10), 497; https://doi.org/10.3390/batteries9100497
Submission received: 30 August 2023 / Revised: 19 September 2023 / Accepted: 25 September 2023 / Published: 28 September 2023
(This article belongs to the Special Issue Advances in Electrode Materials for Advanced Batteries)

Abstract

:
Herein, we design a cathode material based on layered Na2/3(Mn1/2Fe1/2)O2 for practical application by combining the Co substitution and MgO treatment strategies. The oxides are prepared via solid-state reactions at 900 °C. The structure, morphology, and oxidation state of transition metal ions for Co-substituted and MgO-treated oxides are carefully examined via X-ray diffraction, IR and Raman spectroscopies, FESEM with EDX, specific surface area measurement, and XPS spectroscopy. The ability of oxides to store sodium reversibly is analyzed within a temperature range of 10 to 50 °C via CV experiments, galvanostatic measurements, and EIS, using half and full sodium ion cells. The changes in the local structure and oxidation state of transition metal ions during Na+ intercalation are monitored via operando XAS experiments. It is found that the Co substituents have a positive impact on the rate capability of layered oxides, while Mg additives lead to a strong increase in the capacity and an enhancement of the cycling stability. Thus, the highest capacity is obtained for 2 at.%-MgO-treated Na2/3(Mn1/2Fe1/2)0.9Co0.1O2 (175 mAh/g, with a capacity fade of 28% after 100 cycles). In comparison with Co substituents, the Mg treatment has a crucial role in the improvement of the lattice stability during the cycling process. The best electrode materials, with a chemical formula of 2 at.%-MgO treated Na2/3(Mn1/2Fe1/2)0.9Co0.1O2, were also used for the full cells design, with hard carbon as an anode. In the voltage window of 2–4 V, the capacity of the cells was obtained as 78 mAh/g and 51 mAh/g for applied current densities of 12 mA/g and 60 mA/g, respectively.

Graphical Abstract

1. Introduction

Sodium-ion batteries (SIBs) have long been recognized as being among the most competitive alternatives to Li-ion batteries due to their abundance on the planet, low cost, and similar operation chemistry [1,2]. The main class of electrode materials for SIBs comprises sodium transition metal oxides (NaxTMO2) due to their flexible layered structure and metal constituents (comprising Ni, Fe, V, Mn, Co, Cr, etc.) changing the valence states in a broad range [3,4]. The state-of-the-art studies showed that the cathode materials consisting of mixed double and triple metal ions (such as Mn/Co, Mn/Ni, Mn/Ni/Ti, Mn/Fe/Co, Cr/Ti, etc.) demonstrate better electrochemical properties than single ones [5]. Among these cathodes, Nax(Mn, Fe)O2 materials are of particular significance due to their cheap and abundant components, among other factors [6,7,8,9]. Depending on the Na content, these oxides adopt a layered structure with two structural peculiarities: O3 and P2. The unique Na capacity of Nax(Mn, Fe)O2 is a result of the participation of both Fe and Mn ions in the electrochemical reaction (i.e., Fe3+/Fe4+ and Mn3+/Mn4+ redox couples). However, despite its environmentally friendly properties, Nax(Mn, Fe)O2 displays poor cycling stability and low moist air stability, which prevents its commercialization [6,7,8,9]. One approach to overcoming this drawback is to use a metal substitution for Mn/Fe with electrochemically active (such as Cr, Co, etc.) and/or inactive elements (such as Ti, Al, Mg, Cu, etc.). When the substituents participate in electrochemical reactions (such as Co, etc.), both the capacity and cycling stability are improved, while the electrochemically inactive elements contribute mainly to the cycling stability and rate capability [10]. The replacement of Jahn–Teller Mn3+ ions with smaller Co3+ ions enables the attaining of a higher capacity and the enhancement of the Na+ kinetics [11,12,13]. Contrary to Co-ions, Mg-ions do not take part in the electrochemical reaction. However, the Mg-substituted oxides, in which Mg2+ ions replace Fe-ions, display an enormously high storage capacity [14]. This is a consequence of the oxygen redox activity operating in addition to the TM redox reaction [14,15,16]. In addition, the Mg-substitution yields an enhancement of the moist air resistance of layered oxides, thus contributing to their practical applications [14].
The coating of the electrode surface is seen as an alternative to the metal substitution material engineering process for improved battery performance. Different coating materials, such as Al2O3, TiO2, MgO, etc., were used for the Na-ion cathode materials, and the structured samples were found to have better cycling performance than the uncoated samples [17,18,19]. Among the other examples, MgO coating studies have special importance since an increase in the performance of the cells was observed. It is stated that the MgO layer on Nax(Mn, Fe)O2 electrodes caused the decrease in the charge transfer resistance, which is important for battery performance [20]. The MgO coating effect on Na0.67Ni0.33Mn0.67O2 and Na0.67Ni0.17Co0.17Mn0.66O2 was investigated, and it was found that the rate capability and cycling stability of the cathodes were improved [21,22]. Similarly, A. Kamiyama et al. investigated the effect of MgO template synthesis on hard carbon and found high coulombic efficiency and stability [23]. Y. Zang et al. studied the doping of Mg in the transition metal (TM) side in the NaTMO2 structure and claimed that Mg has a synergetic role in the lattice, improving the Na-diffusion in the lattice [24].
Herein, we design a cathode material based on layered Na2/3(Mn1/2Fe1/2)O2 for practical application by combining the Co substitution and MgO treatment strategies. This strategy is developed in such a way as to improve the Na+ diffusion kinetics, specific capacity, and lattice stability of layered Na2/3(Mn1/2Fe1/2)O2 simultaneously. The Co-substituted and MgO-treated oxides are prepared via solid-state reactions at 900 °C. The structure, morphology, and oxidation state of transition metal ions for Co-substituted and MgO-treated oxides are carefully examined via X-ray diffraction, IR and Raman spectroscopies, FESEM with EDX, specific surface area measurement, and XPS spectroscopy. The ability of oxides to store sodium reversibly is analyzed within the temperature range of 10 to 50 °C via CV experiments, galvanostatic measurements, and EIS, using half and full sodium ion cells. The changes in the local structure and oxidation state of transition metal ions during Na+ intercalation are monitored via operando XAS experiments.

2. Materials and Methods

The Mg-treated Na0.67(Mn0.5Fe0.5)1−xCoxO2 oxides (where x = 0–0.3, x = 0 denote NR0) were obtained via solid-state reaction using Na2O2 (Sigma Aldrich, St. Louis, MO, USA, ≥95%), MnO2 (Alfa Aesar, Haverhill, MA, USA, 99.9%), Fe2O3 (Alfa Aesar, 99.9%), Co3O4 (Alfa Aesar, 99.7%), and MgO (Sigma Aldrich, ≥99%) reagents. All reagents in desired ratios were weighed on a Radwag-sensitive balance, and the powder mixture was carried out via an agate mortar for 0.5–1 h in an inert atmosphere. The stoichiometrically prepared powders were transformed into pellet forms under 5 tons and then heated at 900 °C for 6 h under air convection. Finally, the pellets in the furnace were quenched in liquid N2. For the sake of convenience, the samples were named as set out in Table 1.
The structural analysis was performed via Rigaku RINT2000 powder diffractometer with CuKα radiation (λKα = 1.5405 Å). The Rietveld refinement of XRD patterns was carried out using the GSAS-II software [25,26]. For the registration of FTIR spectra, a Perkin Elmer Spectrum One spectrophotometer was applied, with the samples being mixed with KBr tablets. An NRS-4500 Confocal Raman Microscope using a 532 nm laser with an Air-cooled Peltier CCD detector and 20 mW power via a 5× magnification lens at the AYBU-MERLAB, Ankara, Turkey, was utilized for collecting Raman spectra. The morphology and element mapping were determined via a Leo EVO-40 VPX SEM microscope combined with an EDX analyzer, Bruker X-flash detector 4010. The specific surface area was monitored via Micromeritics-TriStar 3000 at DAYTAM, Erzurum, Turkey. The assessment of the oxidation state and local structure around the transition metal ions was carried out in the frameworks of X-ray absorption near-edge (XANES) and extended X-ray absorption fine structure (EXAFS) spectroscopy utilizing ROCK Beamline at SOLEIL in France, with the spectra being collected in a transmission mode. For calibration and alignment purposes, we used Mn, Co, and Fe foils. For the operando XAS experiments, a specially designed cell is used [27]. The cell is cycled between 1.5 and 4.3 V at a rate of C/10. XAS spectra were calculated via Fastosh and Artemis programs [28,29].
The electrochemical testing of oxides was carried out in coin cells CR2032 with an electrolyte (~0.2 mL for each cell) of 1M NaClO4 (PC/EC = 50/50, wt/wt). The electrodes consist of a mixture of the active materials, super carbon, and PVDF in a weight ratio of 70:15:15. Using a doctor blade, the mixture was cast on Al-foil with a coating thickness of 100 µm. The electrodes were dried in a vacuum oven at 110 °C for 24 h then pressed with a rolling press and punched on a disc with a 15 mm diameter. For each electrode, the active mass varied between 1.4 mg and 1.9 mg. For the half-cell configuration, the anode consists of Na foil, while for the full cell, commercial hard carbon was used as an anode.
The cyclic voltammetry (CV) curves were measured at Ivium Octostat30 potentiostat/galvanostat integrated with NUVE EN-120 in a temperature range of 10–50 °C. Galvanostatic testing, including measurement of the specific capacity, cycling stability, and rate capability, was performed via a Neware BTS4000 and Hefacycle BA100A battery analyzer. ZIVE SP1 potentiostat/galvanostat from 0.1 mHz to 200 kHz, using 10 mV AC voltage, was applied for the electrochemical impedance spectroscopy (EIS) analysis.

3. Results and Discussion

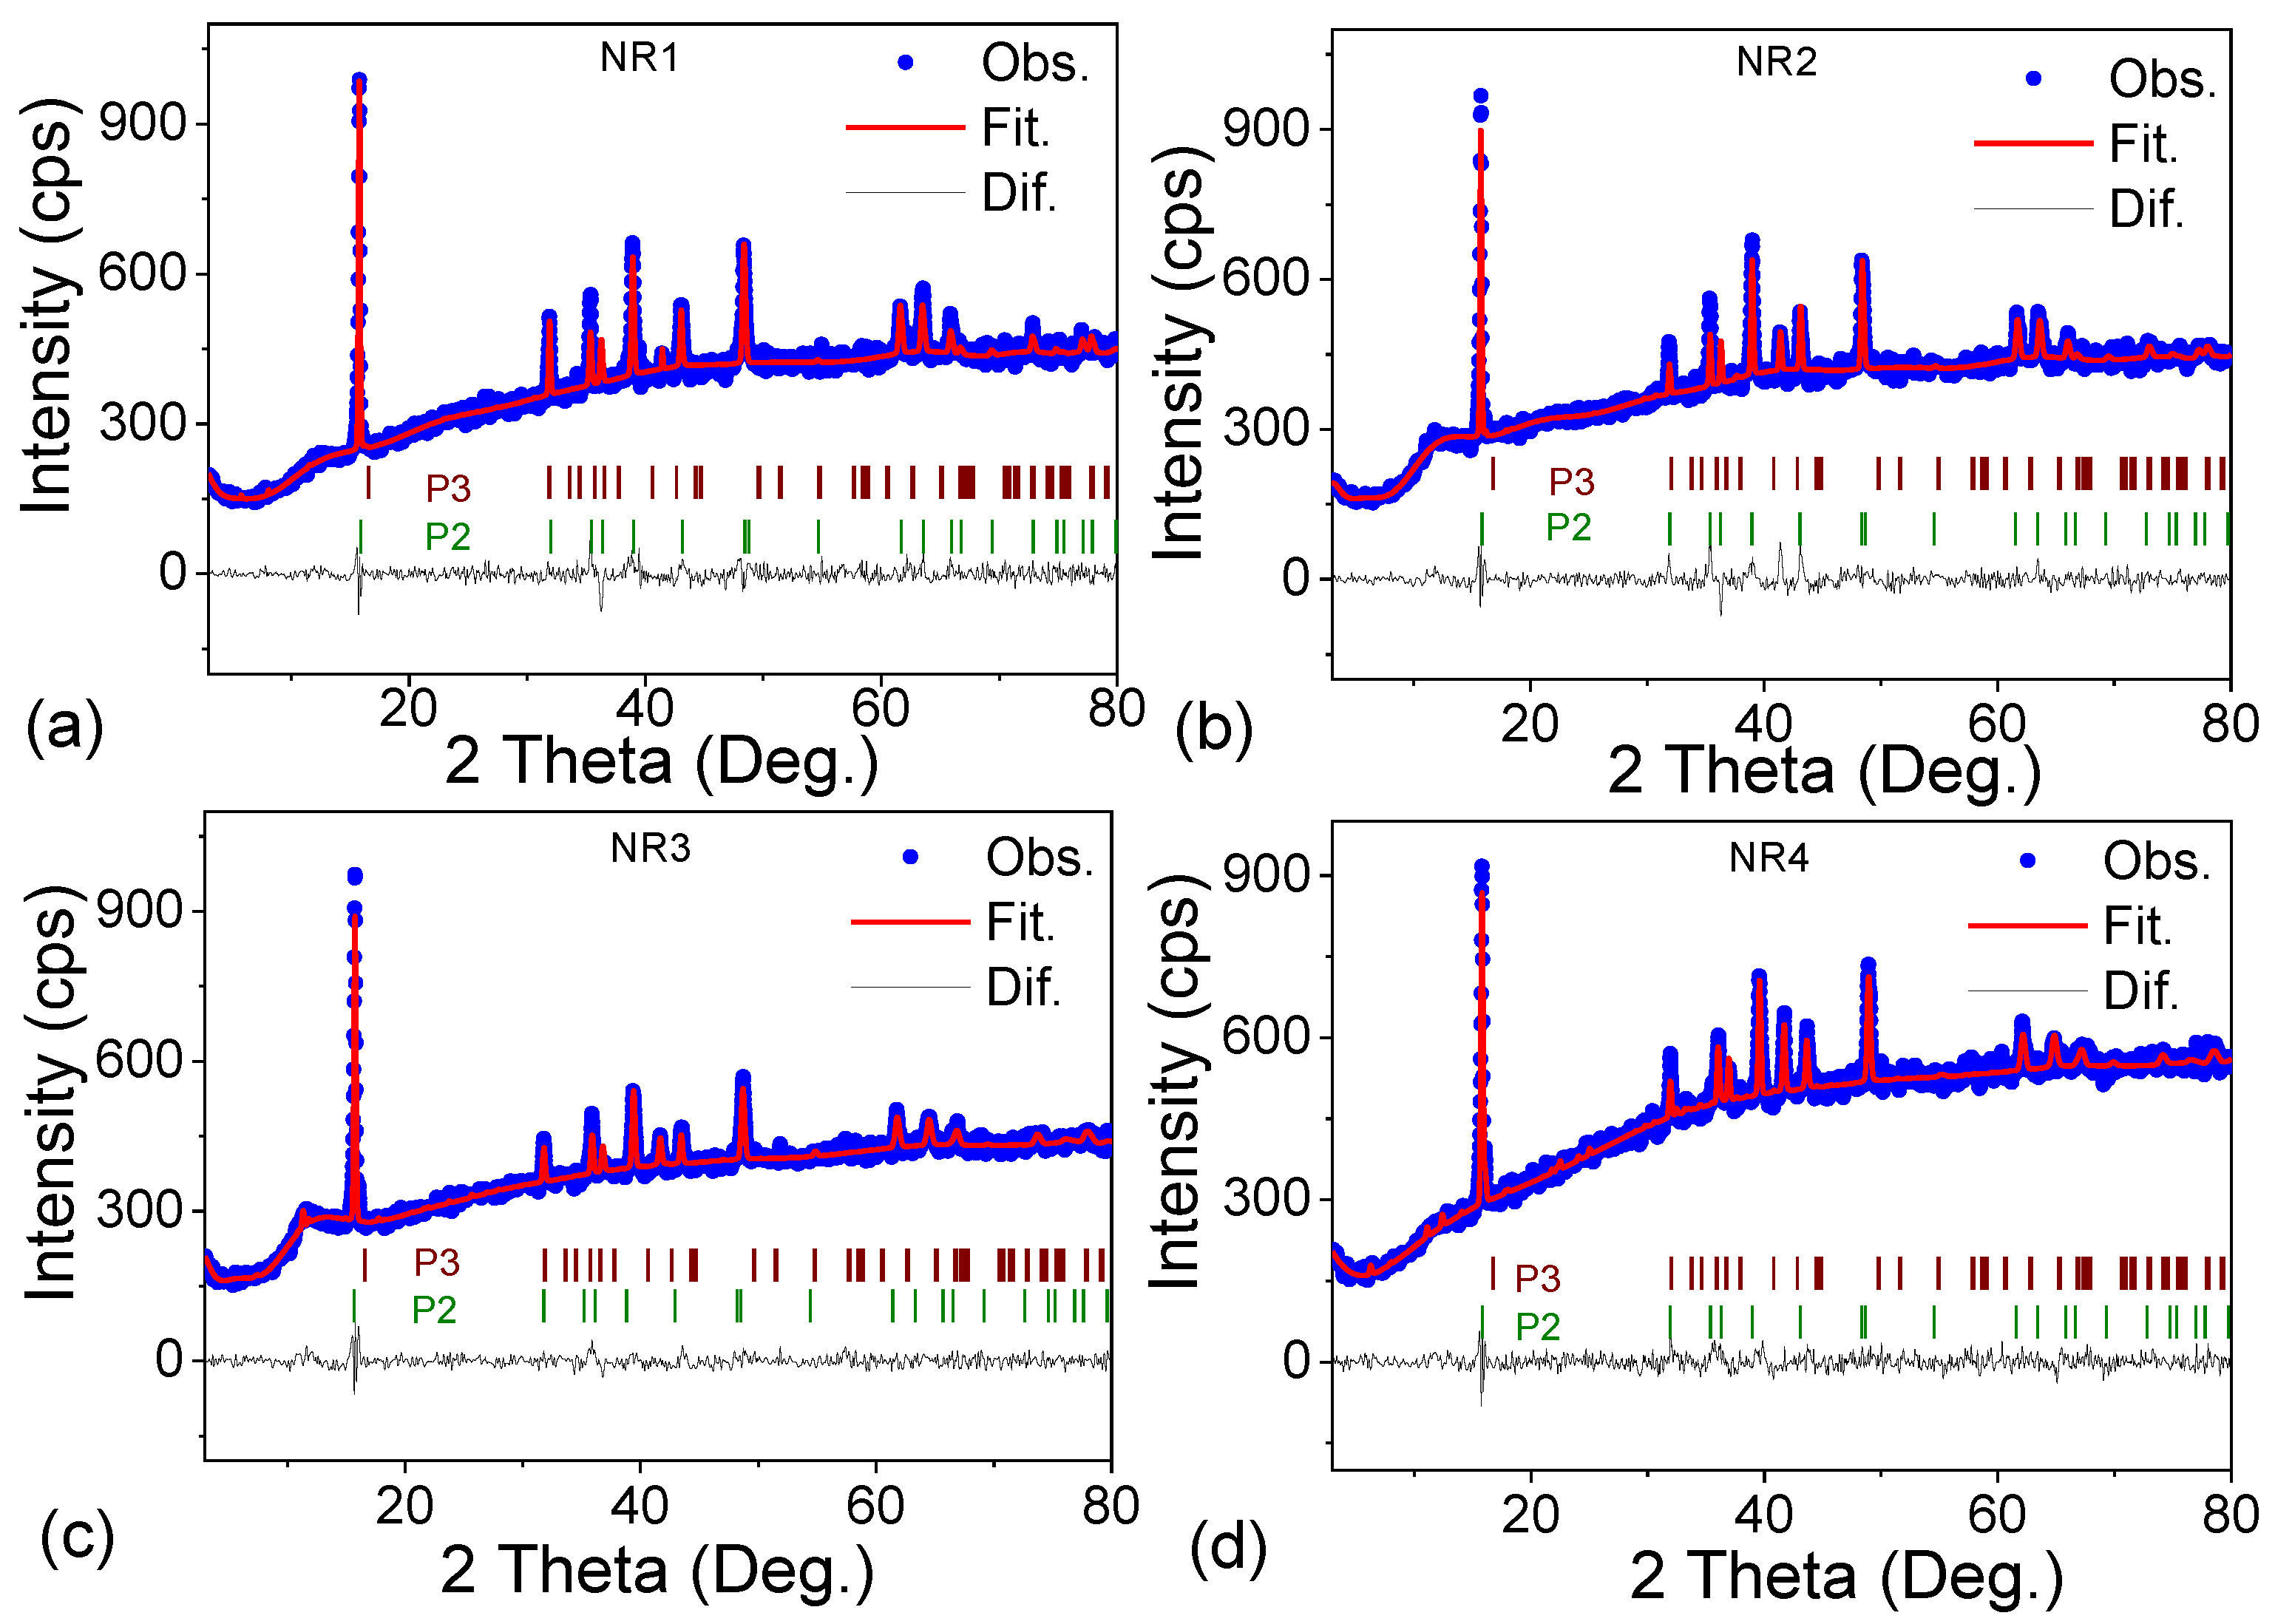
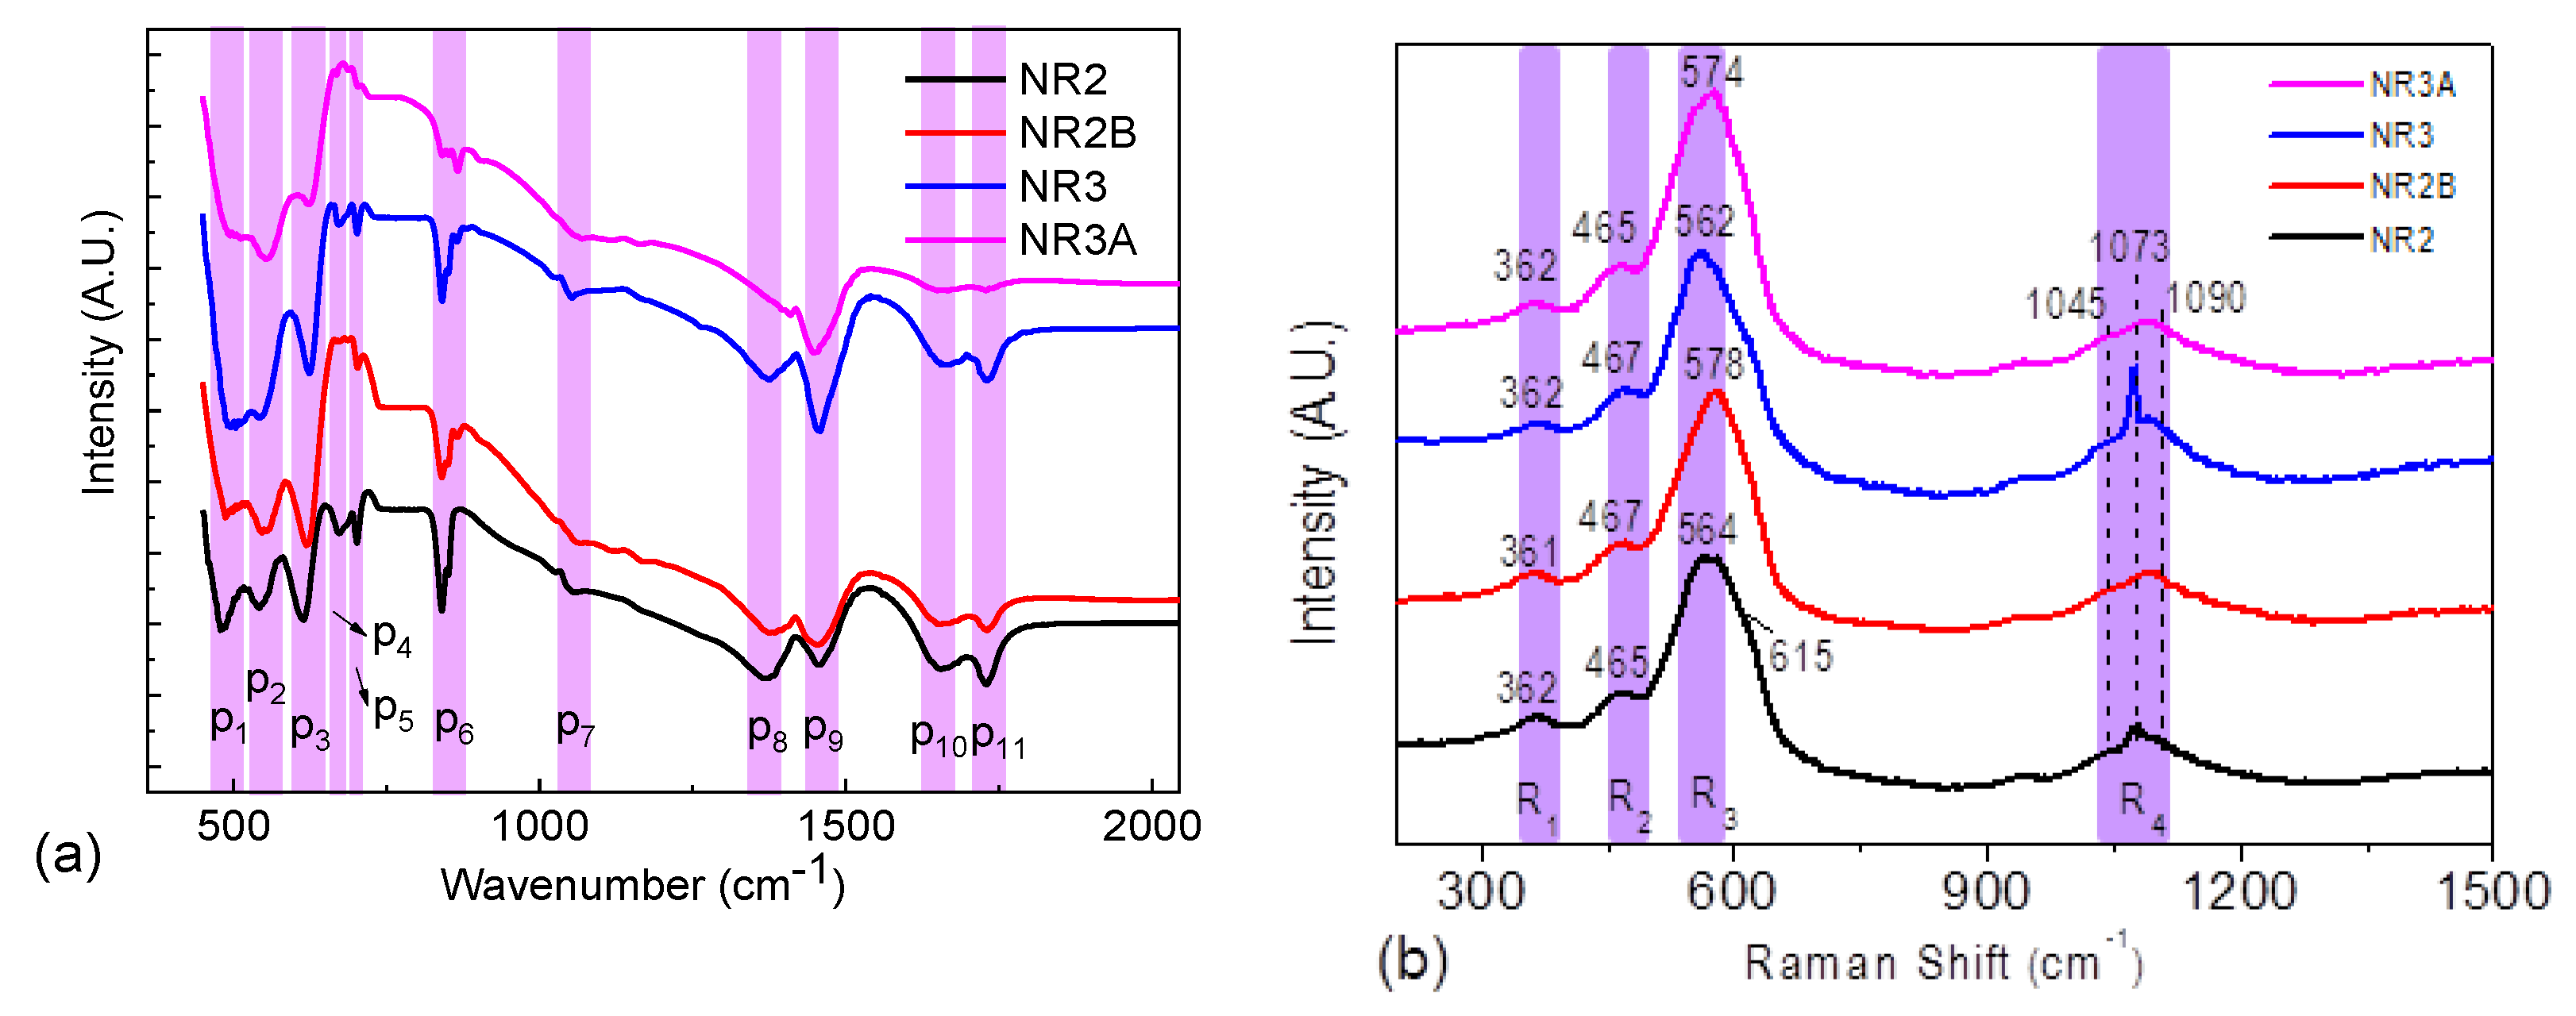
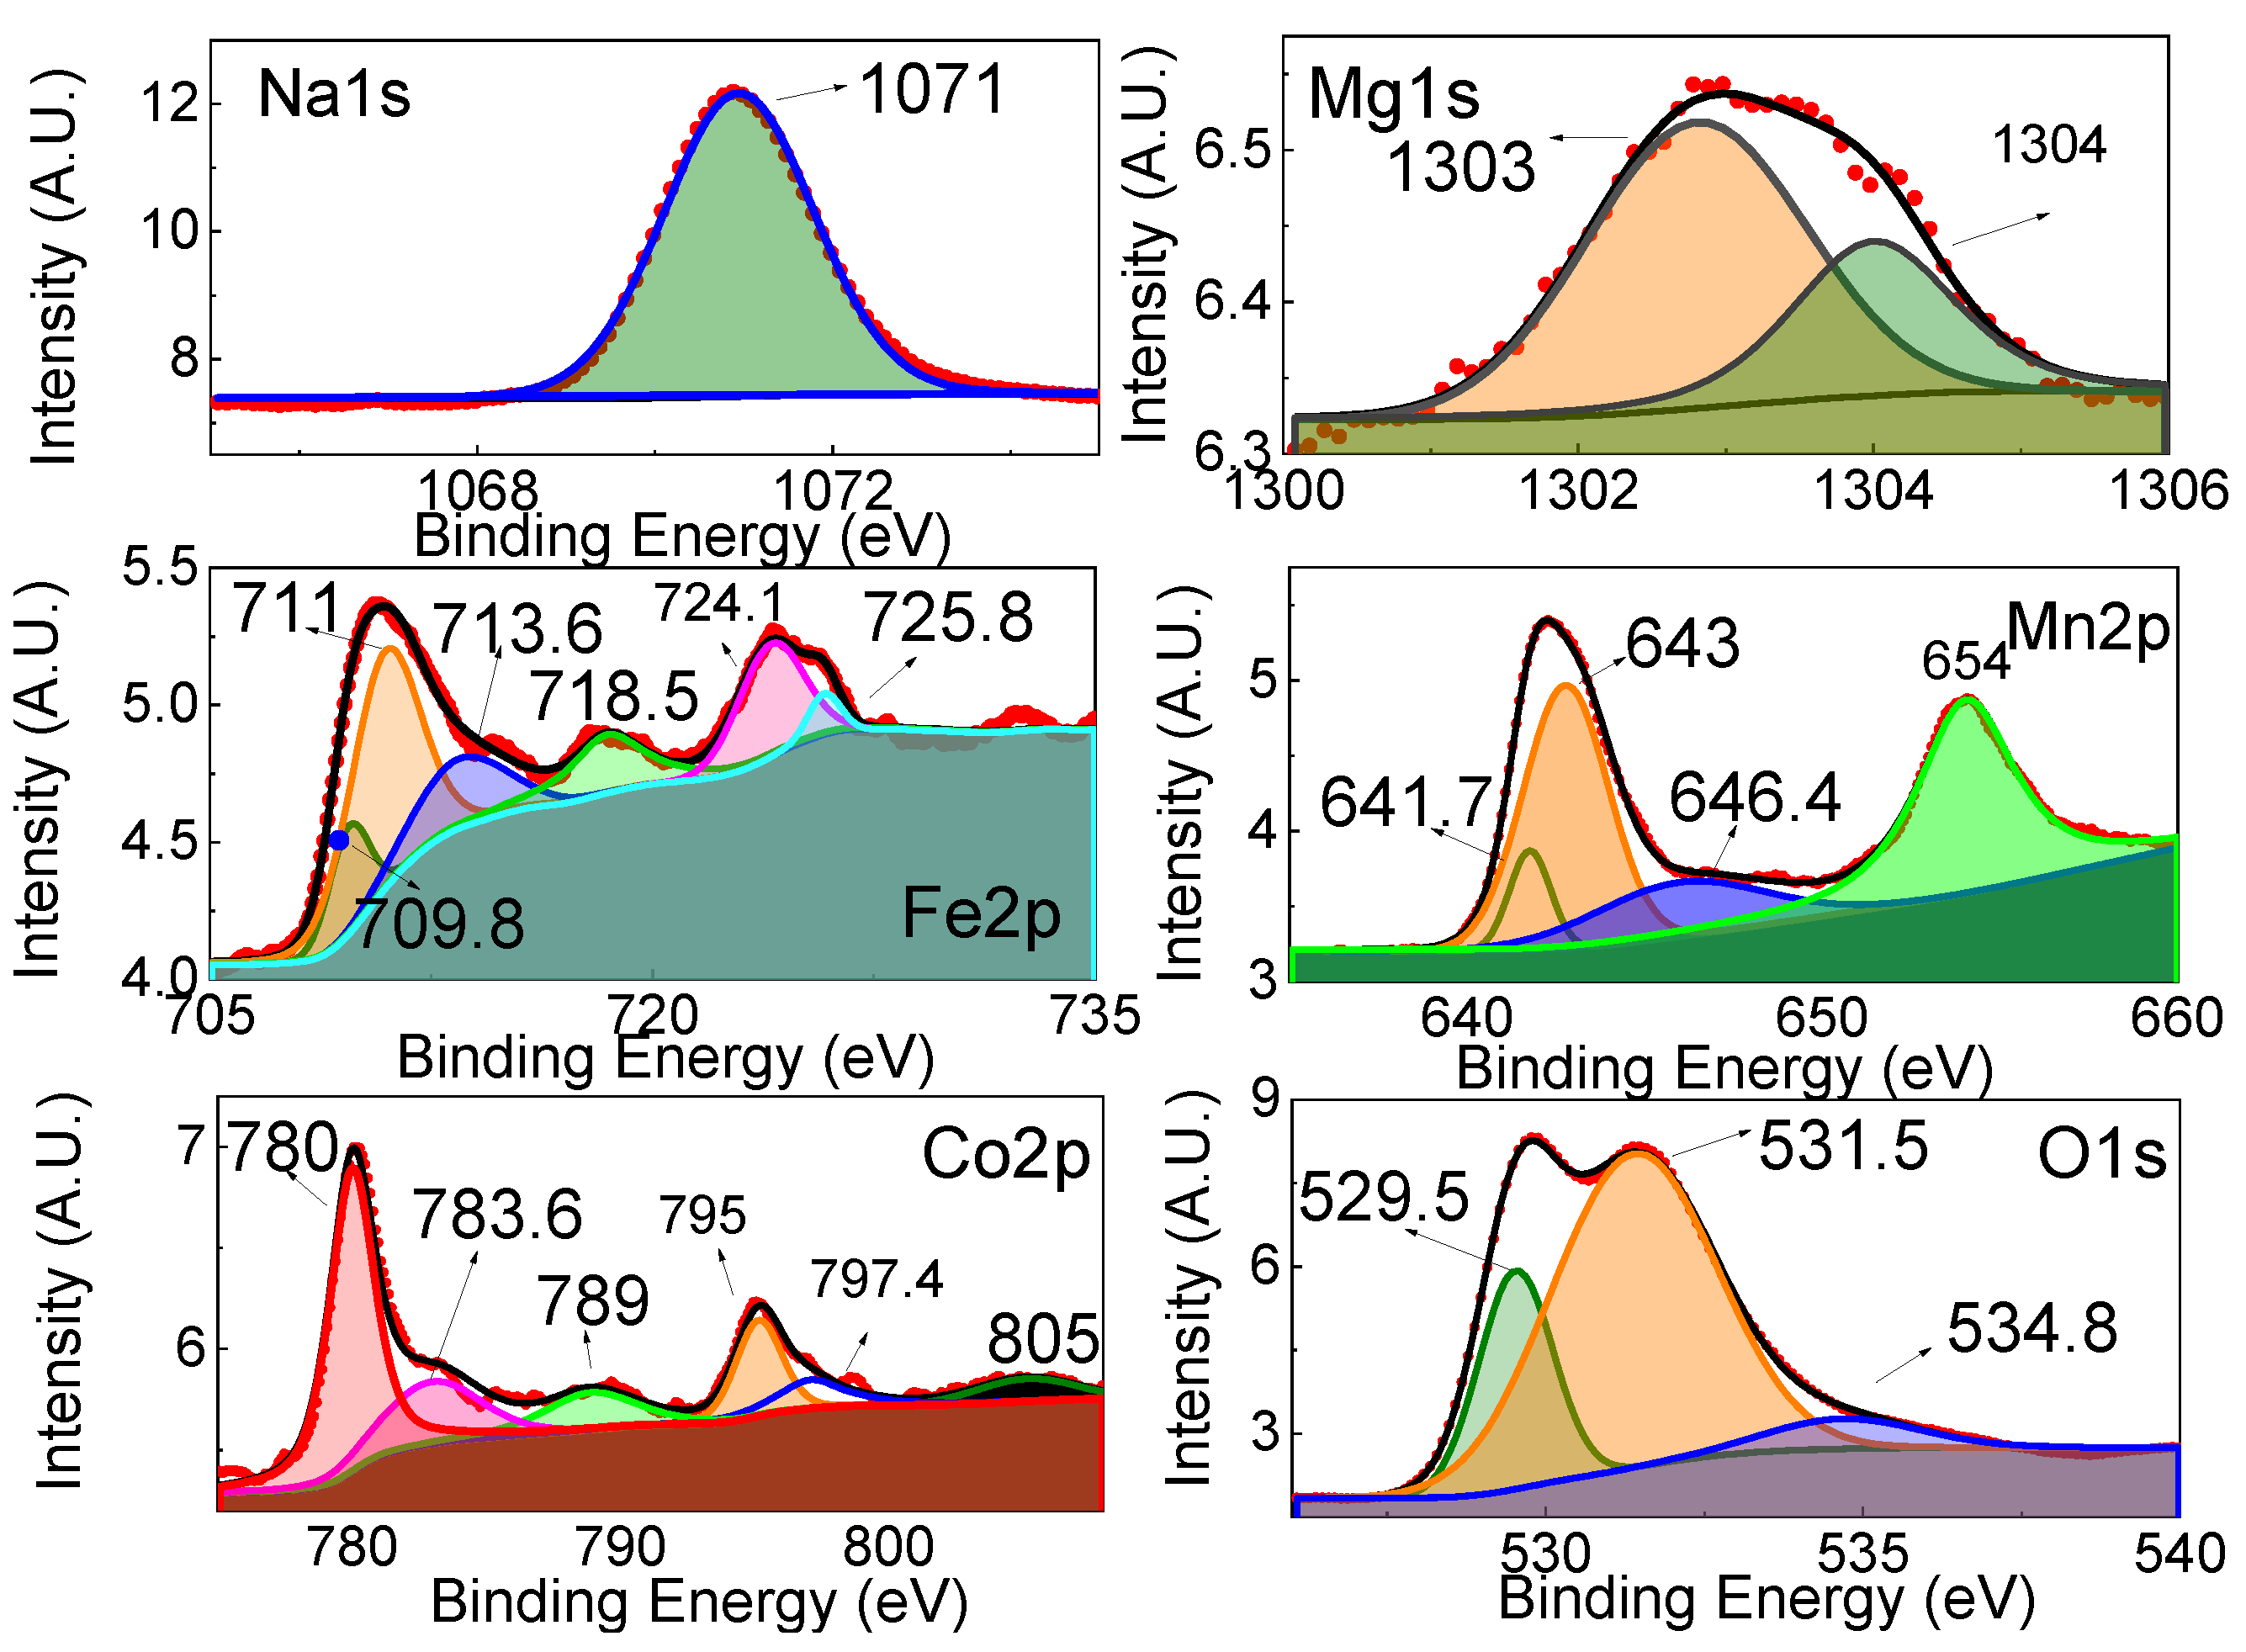
3.1. Structural Properties

The XRD patterns of Co-substituted and MgO-treated oxides are compared in Figure 1a–d and Figure S1a–f. The indexation of all XRD patterns demonstrates a formation of layered oxides with a P2-type structure (P63/mmc space group). In addition to the P2-phase, an impurity P3-phase was observed for Co-substituted oxides with x ≥ 0.1. For the MgO-treated layered oxides, there are the same P3- impurity phases on the samples.
Through the Rietveld refinement method of XRD patterns (as seen in Figure 1 and Figure S1), the structural parameters and phase ratio of the P2 and P3 phases are calculated, and their values are listed in Table S1. It is observed that Co substitution triggered the formation of P3-phase in the sample, which agrees with the previous studies [30]. As one can see, the lattice parameter a (expressing the intra-layer distance between metal ions) decreases smoothly after the incorporation of Co ions (Figure S1g), which is in agreement with previously reported data for Co-substituted sodium iron manganese oxides, and it is consistent with the smaller ionic radius of Co3+ ions versus Fe3+ and Mn4+ ions [30,31,32]. Contrary to the a-parameter, the c-parameter (expressing the inter-layer spacing) varies between 11.175 Å and 11.210 Å (Figure 1c). As a result, the lattice volume is contracted with the increase of Co content, following Vegard’s law (Figure 1c). This indicates a random incorporation of Co3+ ions inside the Mn and Fe layers without any preferential substitution. It is worth mentioning that previous studies have focused on the selective substitution of Fe or Mn by Co ions [11,12,13]. It appears that the synthetic method based on solid-state reactions with the participation of Na2O2 allows for the obtaining of Co-substituted oxides, where Co3+ ions substitute for Mn and Fe ions simultaneously, thus keeping the Mn-to-Fe ratio constant. In addition, small amounts of incorporated Co ions cause a strong extension of the interlayer space (i.e., from 3.57 Å to 4.35 Å for x = 0.05), which remains nearly constant after a further increase in the Co amount up to 0.3 (Figure 1c). This will make the Na+ diffusion between the layers easier, which will be discussed in the next part.
The treatment of Co-substituted oxides with MgO has a small effect on their structural parameters; in increasing the amount of MgO, there is a tendency for a slight decrease in both the lattice volume and the interlayer space (Table S1). This indicates that Mg incorporation into the structure of layered oxide is limited, and most of the Mg remains as a separate phase of MgO.
The vibrational properties of Co-substituted and Mg-treated oxides provide further insights into their structural peculiarities. Figure 2 shows the IR and Raman spectra of the oxides. The IR spectra are dominated by three strong absorption bands in the spectral range below 700 cm−1 (i.e., P3, P2, and P1 bands near 620, 545, and 480 cm−1, respectively), where the characteristic vibrational modes for layered oxides, NaxMO2, generally appear [33,34,35,36,37,38,39,40]. The P3 and P2 bands are mostly due to the asymmetric stretching vibrations of MO6 octahedra, while the P1 band corresponds to the bending M-O-M modes of MO6 octahedra [33,34,35,38,40]. The comparison of the IR spectra shows that the profiles and positions of the bands are affected mainly by Co substituents and slightly by Mg additives. The P3 and P1 bands exhibit a clear shift to higher wavenumbers with an increase in the Co content, i.e., from 615 to 624 cm−1, and from 480 to 490 cm−1 for NR2 and NR3, respectively (Figure 2a). Along with this, the intensity of the P3 band decreases considerably. The systematic shift in the band supports once again the incorporation of Co-ions in the Mn and Fe-layers. In comparison with Co-substituted oxides, the three bands for Mg-treated oxides appear at higher wavenumbers (between 5–8 cm−1 for NR2B than that for NR2), while the P2 band is blue shifted with around 10 cm−1 only for NR3B. These non-systematic shifts in the band positions are consistent with XRD data, where some part of Mg ions are included in the structure of layered oxides.
In addition, the IR spectra display the bands near 665–700 cm−1 (P4, P5), 840–865 (P6), 1052 (P7), 1370 (P8), and 1455 cm−1 (P9) that can be assigned to the carbonate contaminations [41,42,43,44]. The formation of carbonates on the surface of sodium-layered oxides, as well as the insertion of the CO32− ions within the transition metal layer, is well documented in the literature [45,46,47,48]. Close inspection of the IR spectra shows that the P8 band appears in NR3B at a higher wavenumber (1410 cm−1) than in the other samples (around 1370–1375) (Figure 2a). This could be attributed to the formation of separate phases of MgCO3, and it is in agreement with the partial insertion of Mg into the layered structure. The spinel impurities (detected by XRD) contribute, most probably, to the band at 660 cm−1. The band near 1730 cm−1 (P11) probably originated due to the reaction of CO2 with lattice oxygen atoms, as reported by Coluccia, or combination vibration [42]. The band at 1660 cm−1 (P10) is associated with the bending vibrations of the adsorbed H2O molecules.
The Raman spectra of oxides in the range below 700 cm−1 display the typical features of layered NaxMO2 oxides based on manganese and iron [8,36,37,39,49,50,51]. These are three distinct bands at around 565–580 (R3, the strongest one), near 465 (R2) and 362 cm−1 (R1), and a shoulder at around 615 cm−1 (Figure 2b and Figure S2). The strongest band in the Raman spectra with a maximum at 564 cm−1 in NR2 is assigned to symmetric stretching-mode A1g, which involves motions of the oxygen atoms only [33,35,36,37]. The motions of both Na and O atoms contribute to three bands: the less intensive R2 and R1 bands at 465 and 362 cm−1 and the shoulder at 615 cm−1, which could be attributed to the E2g modes. The positions of all these bands are similar to those reported for compositions containing simultaneously manganese and iron, for instance: Na1+x(Fey/2Niy/2Mn1−y)1−xO2 (x = 0.1 − 0.5) − 595, 488, 369 cm−1 [36]; NaNi1/3Fe1/3Mn1/3O2 −580, 490, and 340 cm−1 [51]. The presence of carbonate species is confirmed by the band at 1073 cm−1 (R4). The Raman bands of the Co-substituted oxides (NR2 and NR3) exhibit very close wavenumbers of the three bands (the difference is about 2–3 cm−1, which is within the experimental resolution), which can be explained by the small difference in the Co amount (Figure 2b and Figure S2). On the other hand, the increase in the Mg addition in the two sample series is found to give rise to a progressive blue shift of the R3 band: 564–578–580 cm−1 for NR2-NR2B-NR2C; accordingly, 562–570–580 cm−1 for NR3-NR3B-NR3C (Figure 2b and Figure S2). The observed shift to the higher wavenumbers of the R3 band gives evidence for a decreased MO2 slab thickness [39] due to the partial Mg incorporation in the oxide crystal structure, as was observed via XRD data. In addition, a new weak band at around 670 cm−1 is seen in the spectra of the samples with the highest Mg content (NR2C and NR3C) (Figure S2), but its origin is not clear.
From the spectroscopic data, it can be concluded that the P2-type layered structure is preserved after Co substitution, and the Mg ions are partially incorporated in the crystal structure.
The morphology of the layered oxides was examined via FESEM (Figure S3). Irrespective of the Co and Mg amount, layered oxides consist of plate-like particles with dimensions varying between 1 and 3 μm. The specific surface area of Co-substituted oxides reaches a value of 32 m2/g, and it decreases after the Mg treatment up to 2 m2/g (Table S2). A large specific surface area for Co-substituted oxides can consume more ions in the electrolyte and form a thicker SEI layer [52]. This SEI layer is responsible for a worsening of the Coulomb efficiency of the electrode material (discussed in the next part). However, both Co-substituted and Mg-treated oxides display Nitrogen adsorption/desorption curves of the type III (Figure S4), which corresponds to nonporous material [53]. The Barrett–Joyner–Halenda (BJH) pore size distribution curves of these three materials, presented as an inset in Figure S4, confirmed that NR2, NR2B, and NR3B materials have nanopores structures.
The oxidation state of transition metal ions is monitored via X-ray photoelectron spectroscopy (XPS). Figure 3a–f gives the XPS spectra of NR2B in the binding energy range of Na, Mg, Fe, Mn, Co, and O. The Na 1s spectra show a single peak centered at 1071 eV, which comes from Na atoms located in the layered structure. In the Mg 1s range, the peak can be deconvoluted at two components centered at 1303 and 1304 eV. These values are attributed to Mg atoms in the structure of layered oxides and in a separate MgO phase, respectively [54]. The observation of the complex peak of Mg1s supports, once again, the XRD and vibrational data on the partial incorporation of Mg2+ ions in layered oxides.
In the Fe2p binding energy range, the Fe2p3/2 peak can be deconvoluted into two components at 711.1 and 713.6 eV that are associated with Fe(III) bonded to O [55]. Similarly, two components at 724.1 eV and 725.8 eV can be distinguished for the Fe2p1/2 peak. However, a peak at 718.5 eV is considered a satellite peak. It should be noted that the large background creates difficulties in the chemical state analysis of Fe. The difference of about 7.8 eV between the binding energies of the satellite peak and the main peak of Fe2p3/2 is due to the presence of the Fe3+ ion [56]. The valence of Fe ions fluctuates due to the reduction from Fe3+ to Fe2+ ions. Thus, it is seen that the Fe atoms mainly adopt the oxidation state of +3 in the layered structure, which is consistent with previous data.
The Mn2p spectrum displays characteristic Mn2p3/2 and Mn2p1/2 components centered at 643 eV and 654 eV, respectively. These values imply that Mn atoms are stabilized as Mn4+ in layered oxides (Figure 3d) [57]. The binding energies of Co2p1/2 and Co2p3/2 and the difference between them (i.e., peaks at 797.4 and 783.6 eV and Co2p1/2 − Co 2p3/2 ≈ 13.8 eV) correspond to Co3+ ions (Figure 3). In addition, the Co2+ ions could also be resolved in the Co2p spectra: the binding energies of Co2p1/2 and Co2p3/2 for Co2+ ions at 795 and 780 eV and the difference between them, respectively (Figure 3e) [58]. The satellite peaks for Co2p1/2 and Co2p3/2 have appeared at 805 and 789.0 eV, respectively.
The O1s spectrum contains at least three components at 529.5 eV, 531.5 eV, and 534.8 eV. They come, most probably, from lattice O2−, contamination of surface hydroxides/carbonates, and adsorbed H–O–H species, respectively [59,60].
In conclusion, we identify Fe3+, Mn4+, and Co3+ ions as main constituents in Co-substituted oxides. The Mg additives are partially incorporated in the structure of layered oxides, and the rest of the Mg appeared as separate MgO/MgCO3 phases.

3.2. Electrochemical Analysis for Half Cells

The redox properties of Co-substituted and Mg-treated oxides during Na+ intercalation are monitored via CV experiments (Figure S5). The CV curves consist of two well-separated peaks in the voltage ranges of 2.0–2.5 V and 3.5–4.2 V. Based on previous studies, the redox peak around 2.5 V corresponds to Mn3+/Mn4+, while the second peak around 4.0 V is due to Fe3+/Fe4+ [61,62,63].
The peak at 4.2 V superimposed on the peak due to Fe3+/Fe4+ could be related to the oxygen redox activity operating in addition to Mn and Fe ions [64]. Wang et al. stated that the king around 3.5 V is related to John–Teller distortion (JTD) effects of Mn3+ ions [65]. In general, the redox reactions of Mn3+/Mn4+ and Fe3+/Fe4+ couples also operate for the Co-substituted and MgO-treated oxides. Close inspection of the CV curves indicates that in addition to the high-voltage peak due to Fe3+/Fe4+, a new peak at around 3.9 V grows in intensity with increasing the Co-content. This additional peak can be ascribed to the redox couple Co3+/Co4+. The incorporation of Co3+ ions in the layered structure seems to suppress the peak due to the oxygen redox reaction (i.e., the peak at 4.2 V). Contrary to the Co-ions, Mg2+ ions are electrochemically inactive, but they look likely to contribute to the oxygen redox reaction by intensifying the peak at 4.2 V. The same feature was observed for Mg-substituted NaxMnO2 oxides.
The next parameter affecting the electrochemical performance of layered oxides Is the temperature at which the redox reaction takes place. For this purpose, the CV curves at elevated temperatures are given in Figure 4. By increasing the temperature from 10 °C to 50 °C, the peak due to the Mn3+/Mn4+ redox reaction becomes dominant at the expense of the Fe3+/Fe4+ redox reaction. This means that the Mn3+/Mn4+ redox reaction proceeds more easily at high operating temperatures, while the Fe3+/Fe4+ redox reaction proceeds more easily at low operating temperatures. To quantify the effect of the operating temperature on the redox reaction, the dependence of the peak current on the scan rate is calculated (i.e., Ip0.5 (V/s)0.5 (Figure S4d)). The peak current obeys a v0.5-dependence, which indicates that both Mn3+/Mn4+ and Fe3+/Fe4+ redox reactions are diffusion controlled. Using the Randles–Sevcik equation, the diffusion rate of the Na-ions in the battery cells can be calculated as follows [66]:
I p = 0.4463 · n 3 2 F 3 2 · C · A · R 1 2 T 1 / 2 D 1 / 2 v 1 / 2 ,
where the Ip is the current value in the redox peak of the CV graphs, F is the Faraday constant, n parameter is the number of electrons, the C value is the Na-ion concentration in the cell, the A value is the surface area of the electrode, R is the gas constant, T is the temperature in Kelvin, D is the diffusion rate, and v is the scan rate of CV measurement. The calculated D values of the Mn3+/Mn4+ redox reaction for the NR2B at 10 °C, room temperature, and 50 °C are 0. 7 × 10⁻¹², 2.2 × 10⁻¹², and 5.5 × 10⁻¹² m2/s, respectively, while for the Fe3+/Fe4+ redox reaction, the diffusion coefficients at 10 °C and room temperature are 1.5 × 10⁻¹² and 3.0 × 10⁻¹². It is worth noting that at 50 °C, the high voltage peak due to Fe3+/Fe4+ is perturbed as a result of the intensifying of the oxygen redox reaction, which causes difficulties in the correct calculation of Ip-ν0.5 (V/s)0.5 dependence. Even in this case, the comparison reveals that the diffusion coefficient of the Mn3+/Mn4+ redox reaction increases with the operating temperature more quickly than that of the Fe3+/Fe4+ redox reaction. This could be explained in terms of the Jahn–Teller effect of Mn3+ ions, which is overcome at elevated temperatures. Contrary to Mn ions, the easy oxidation of Fe at low temperatures could be associated with possible electron hopping between neighboring Fe3+ and Fe4+ ions, as was observed by Delmas et al. using Mossbauer characterization of P2-NaxMn1−yFeyO2 [8].
Figure S6 shows the charge–discharge curves and cycling stability for Co-substituted oxides at 30 mA/g current load. The capacity after the 1st and 100th cycles, as well as the capacity loss, are listed in Table 2. The highest capacity is reached for the Co-substituted oxides with x = 0.01 (i.e., 169 mAh/g for NR2). This is associated with the activation of Co3+/Co4+ redox couples in addition to Fe3+/Fe4+ and Mn4+/Mn3+ couples. In addition, the enlargement of the interlayer space by Co substituents could also contribute to the enhancement of the capacity of oxides. Further increase in the Co-content causes a decrease in the capacity. This corresponds to a suppression of the Fe3+/Fe4 reaction at a high amount of Co substituents, as well as to a slight reduction in the interlayer space (Figure S5 and Figure 1). However, the capacity loss decreases with the increase in the Co content. This evidences a positive role for Co substituents in the cycling stability of layered oxides.
The treatment of Co-substituted oxides with MgO leads to a drastic enhancement in both the capacity and cycling stability, especially for the oxide with x = 0.1 and 2% of MgO (i.e., for NR2B, Figures S7 and S8). Figure 5 summarizes the charge–discharge curves for the best-performed oxides. The improvement in the capacity of Co-substituted oxides after treatment with electrochemically inactive MgO is related to the high-voltage peak ascribed to oxygen redox activity, as was observed via CV experiments (Figure 4 and Figure S5).
The cycling stability and rate capability for Co-substituted and MgO-treated oxides are compared in Figure 6 (see also Figure S9). The comparison demonstrates that NR2B delivers the highest capacity at low current rates, while the best capacity is observed for NR3A at high current rates. Thus, it is predicted that a certain amount of Mg in Co substituted Na0.67Mn0.5Fe0.5O2 caused the improvement of the Na insertion/deinsertion properties.
For practical application, it is important to understand the storage property of oxides at elevated temperatures. Figure 7 shows the charge/discharge curves at 10 °C, room temperature, and 50 °C for the best-performing oxide NR2B at a current load of 100mA/g. By increasing the operating temperature, the first capacity increases, reaching a value of 150 mAh/g at 50 °C, but the cycling stability becomes poor. These results are in good agreement with CV experiments (Figure 4), where it was found that Mn3+/Mn4+ redox reactions are amplified at high operating temperatures.
To rationalize the electrochemical performance of layered oxides, EIS experiments are undertaken (Figure 8 and Figure S10). The EIS data are analyzed with an equivalent circuit model, where Rct, Rc, and Rq correspond to the charge transference resistor, capacitive resistor, and constant phase element resistor, respectively. C, Q, and W represent capacitance values, constant phase element, and Warburg element in the cell, respectively. The semi-circle in EIS (Rct) corresponds to Na+ diffusion in the high-frequency region, and C is associated with the pseudo-capacitance at the electrode/electrolyte interface [67]. The model fitting parameters are given in Table S3.
The Rs values fall within the same range, which implies that the Na+ migration is slightly affected by the Mg and Co modification in the structure. The pseudocapacitive effect is the lowest level for the Mg-added NR2 samples, and we can say that Mg addition for NR2 caused a decrease in the capacitance of the system. The highest value of W was also obtained for the Mg-added NR2 samples. So, we can say that EIS analysis results also support the best performance of NR2B among the others in this study.

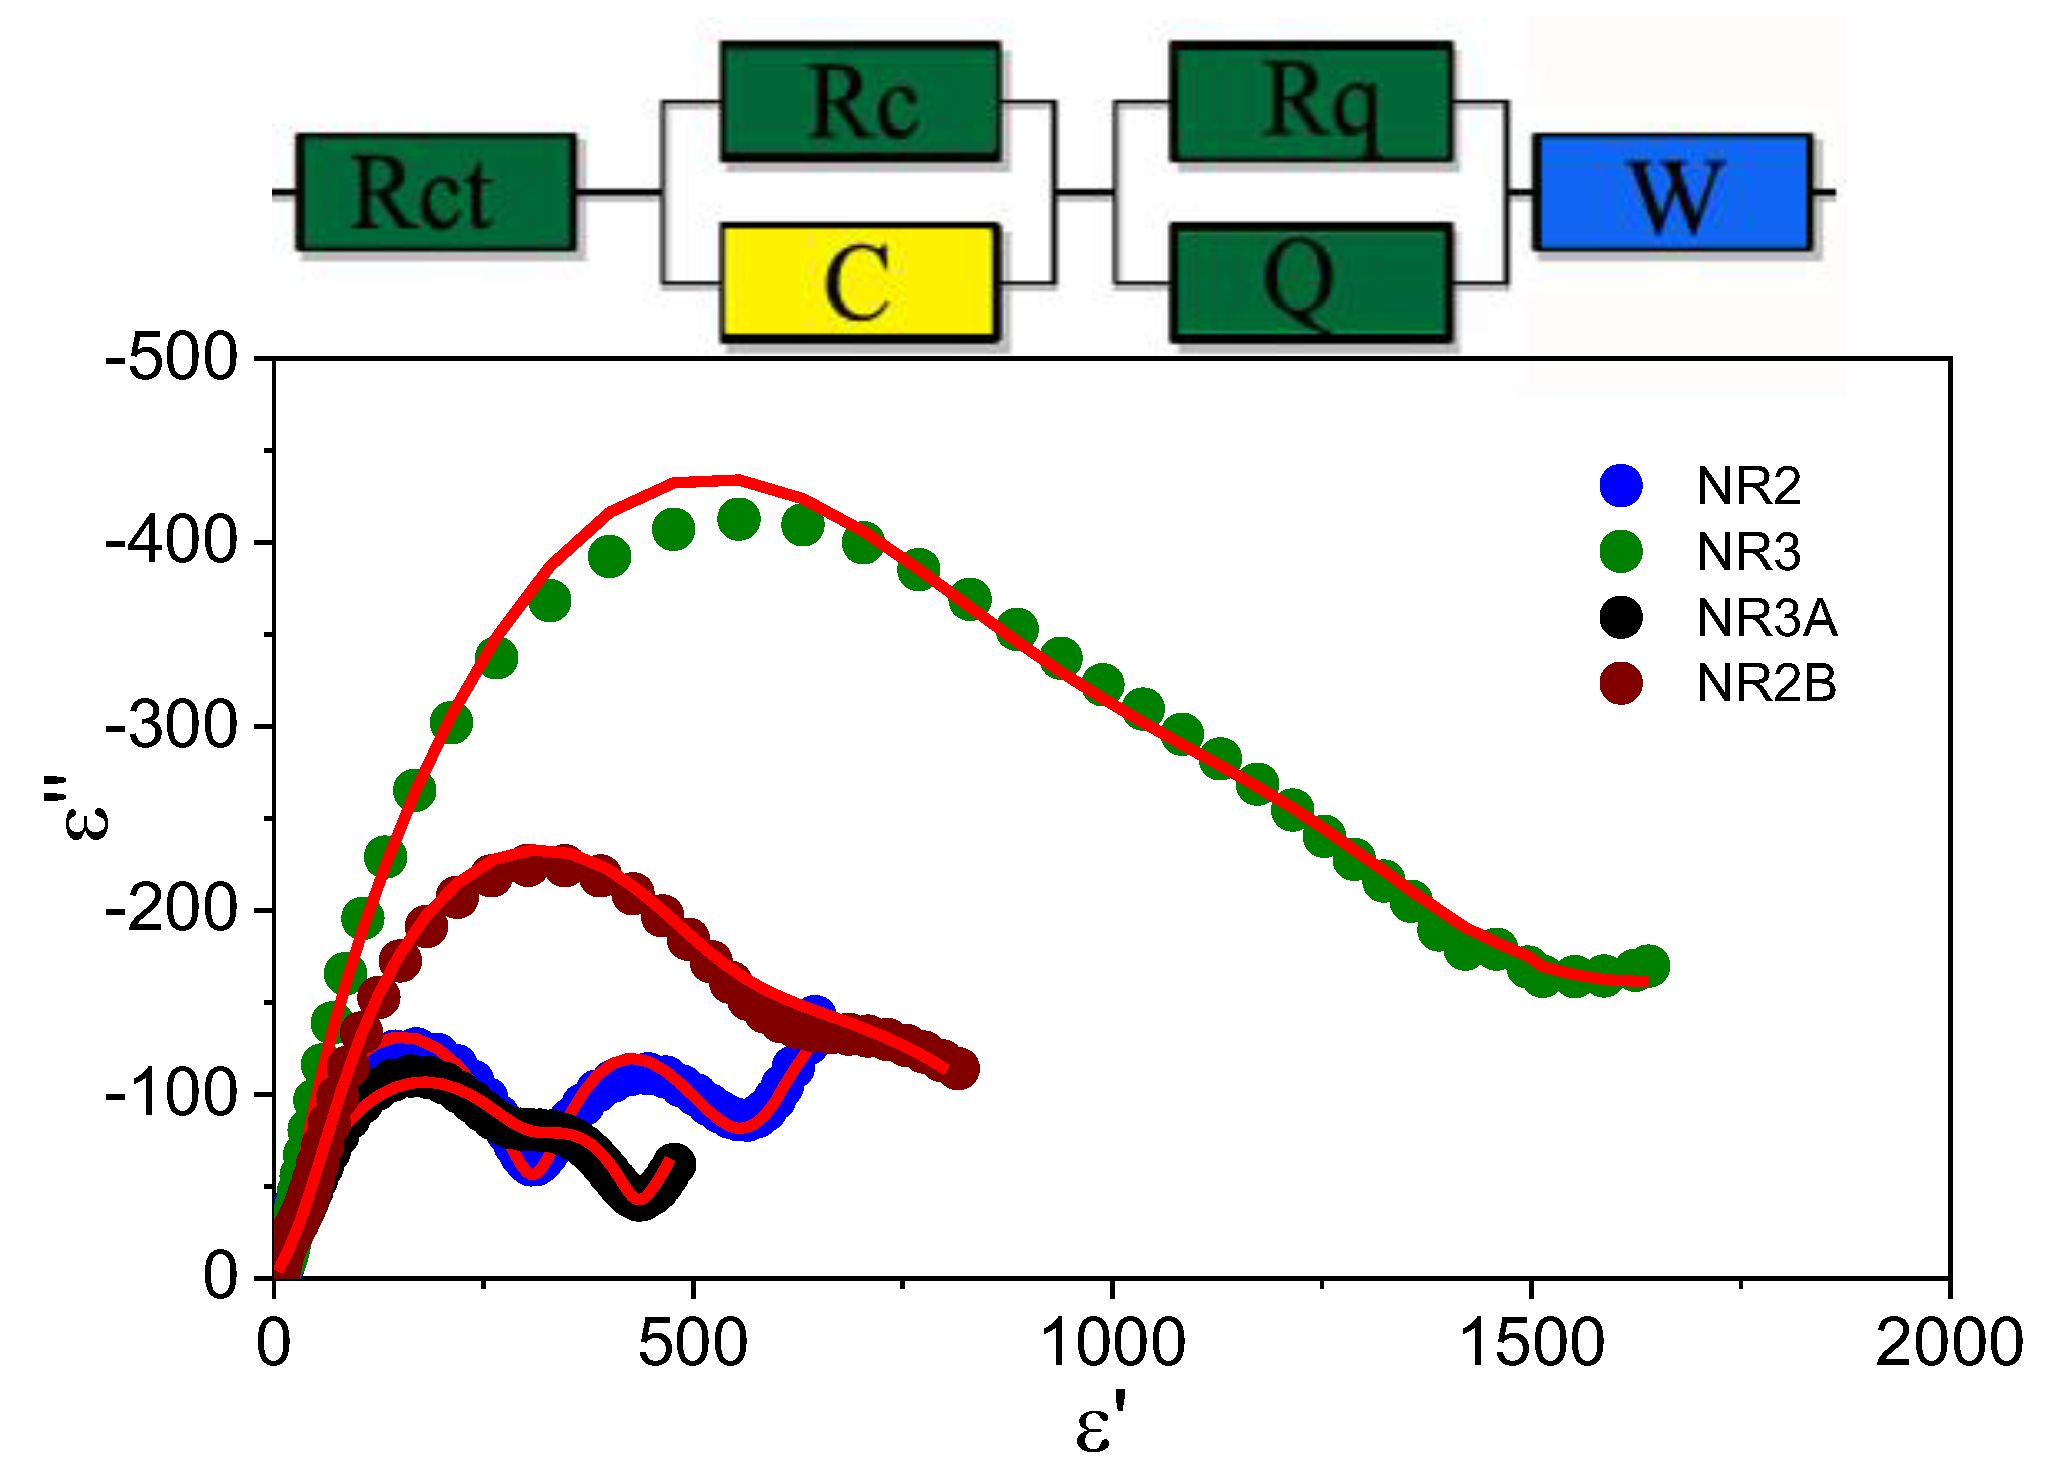
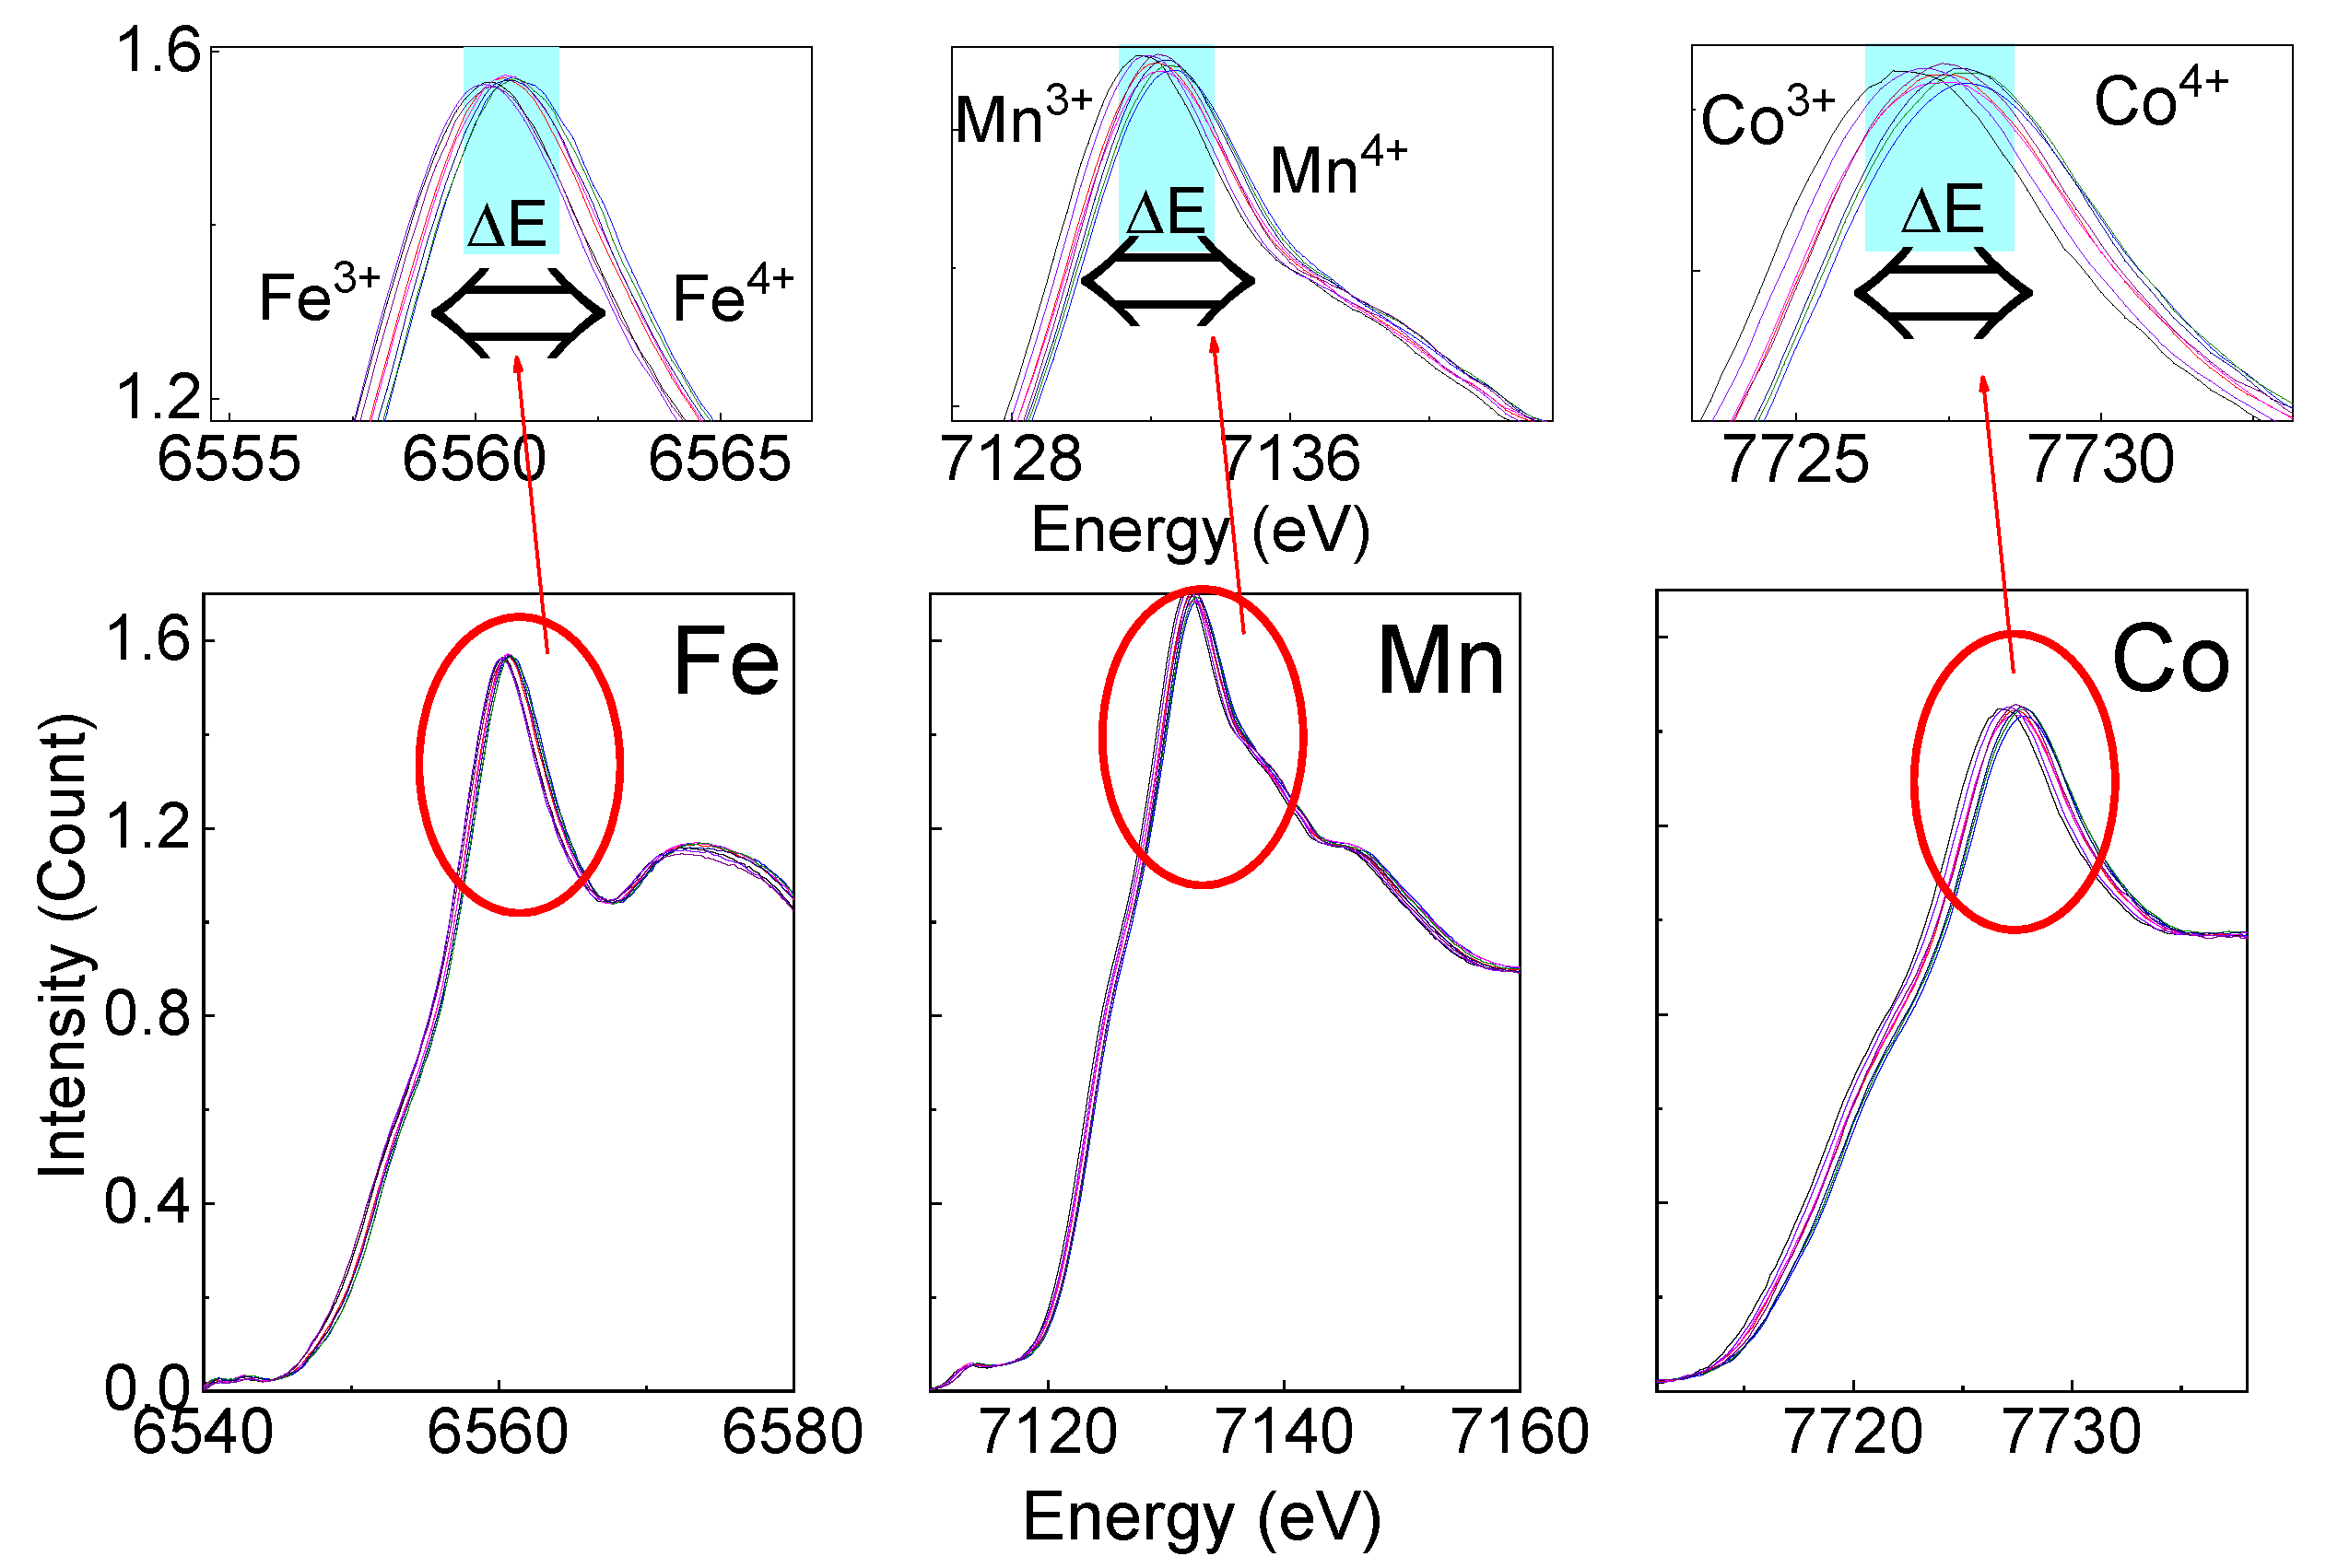
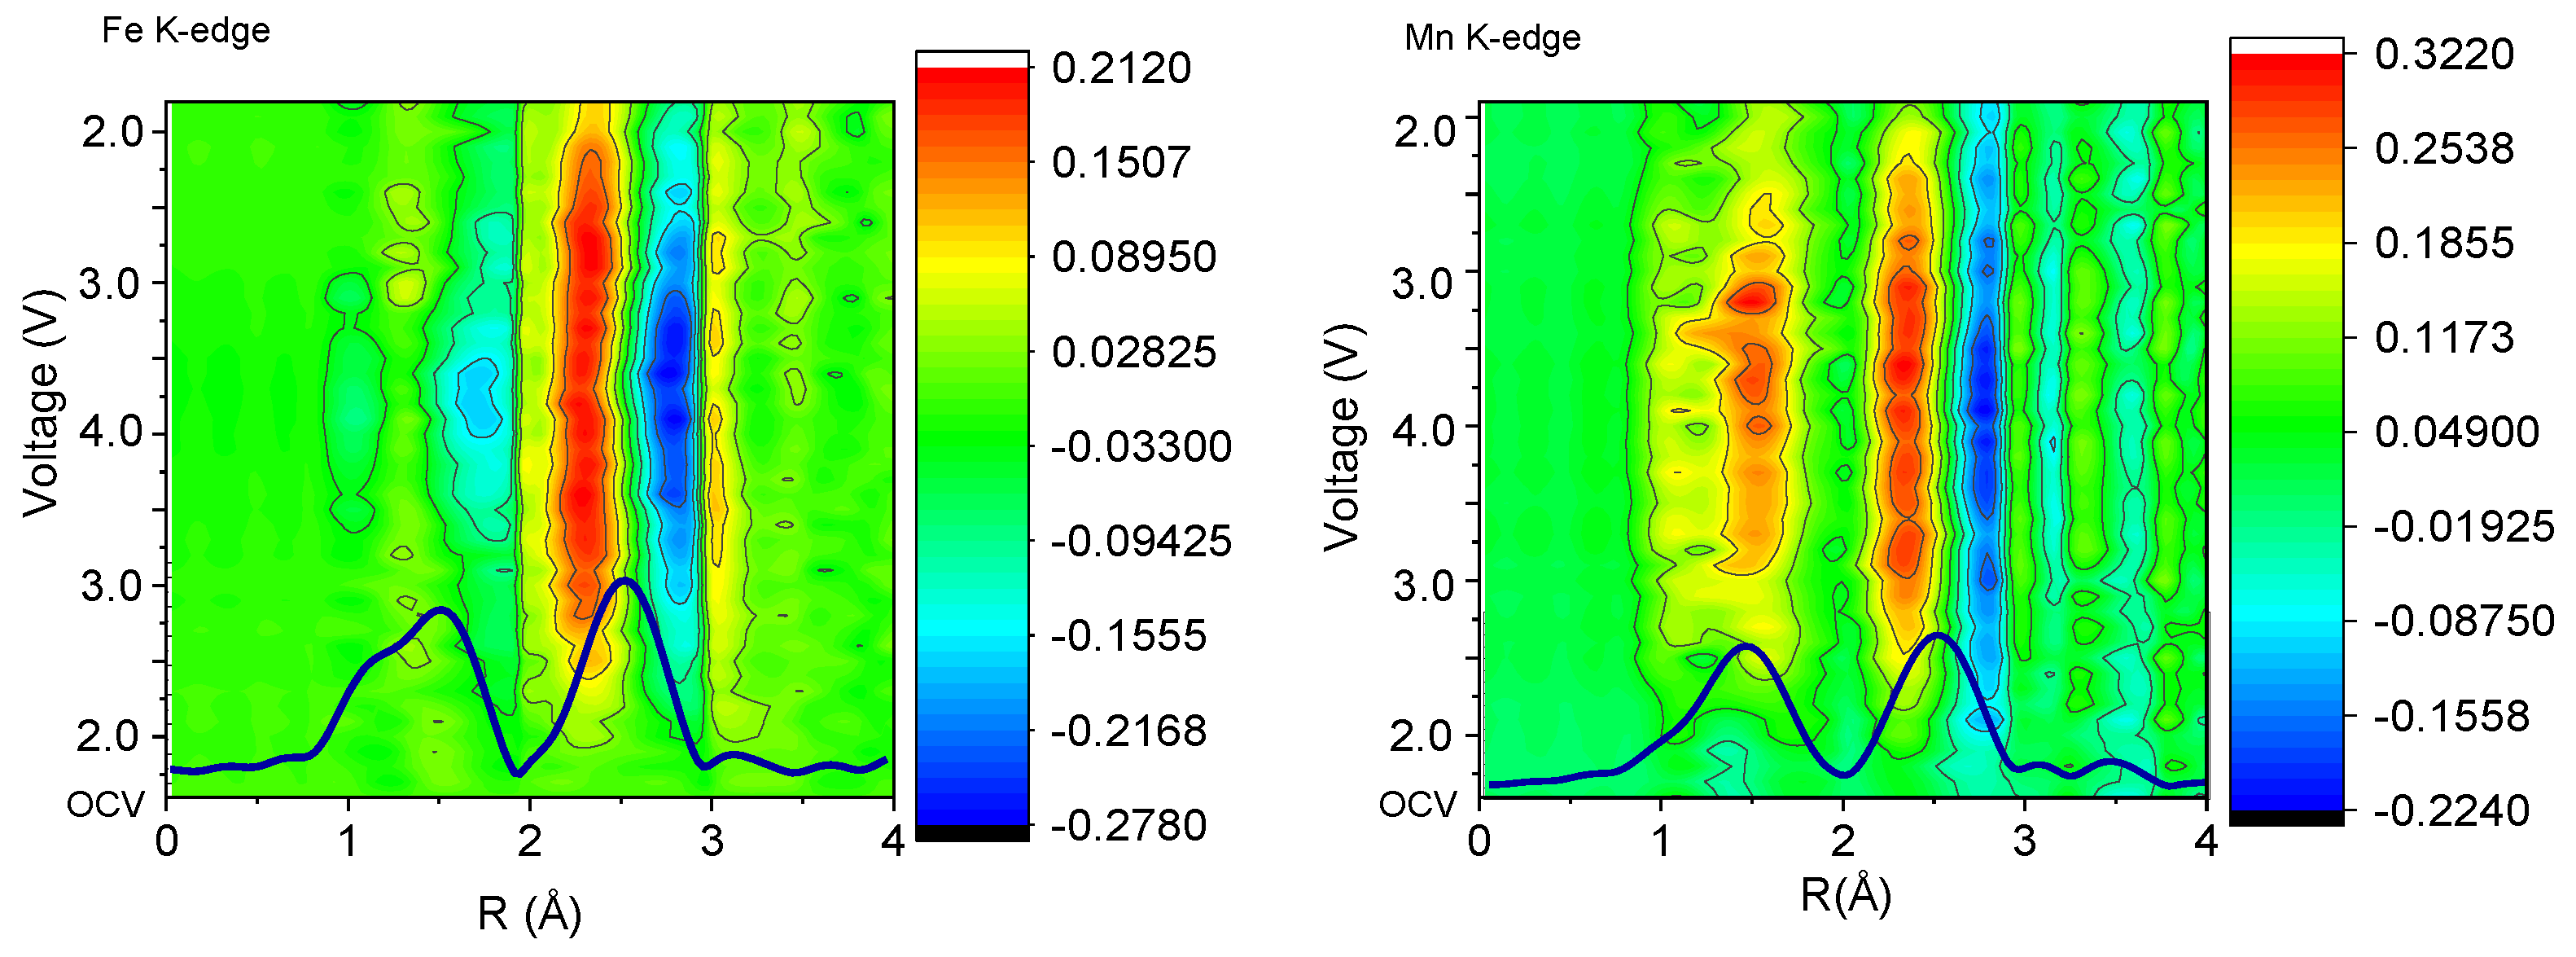
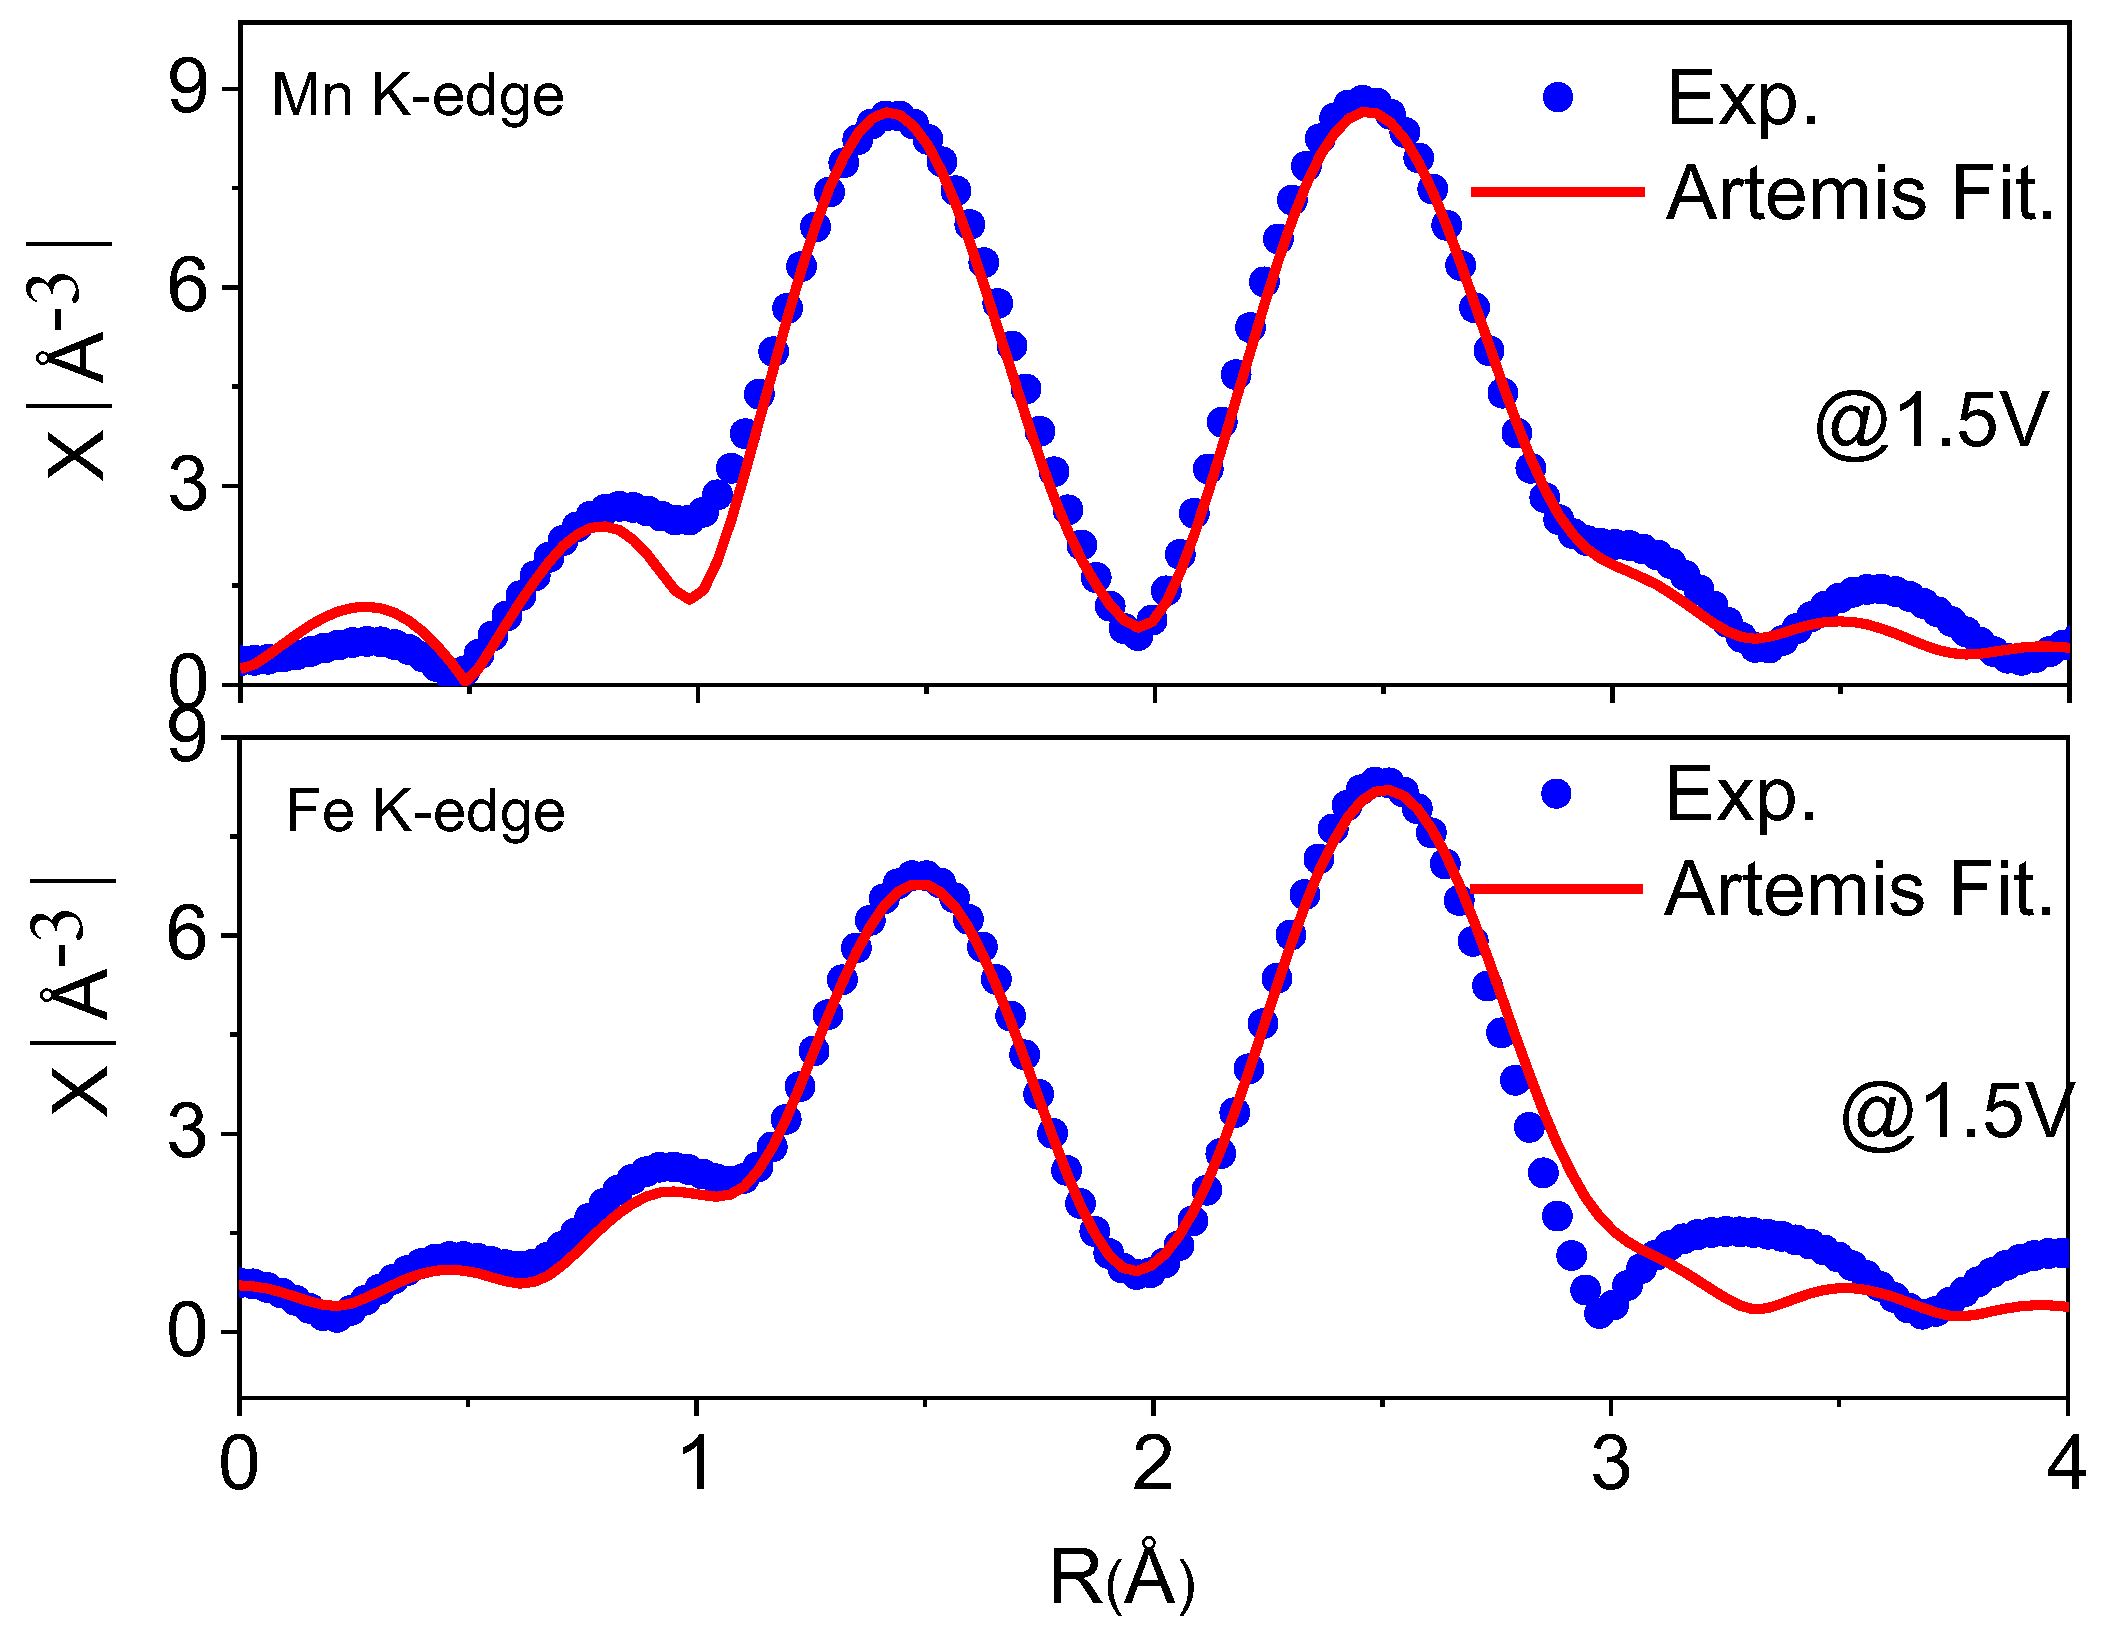
3.3. Operando Study of NR2B

The operando XAS is undertaken to understand the oxidation state and local structure changes of Fe, Mn, and Co atoms during Na+ intercalation. The subject of study is the best-performing oxide NR2B. The Fe, Mn, and Co K-edge XANES spectra of the sample of NR2B during charge and discharge processes are shown in Figure 9. The XANES spectra undergo clear changes, thus revealing the variation in the valence state of metal constituents during the charging and discharging processes; the shift in the XANES spectrum to higher energies is an indication of an increase in the valance state [64]. When Na+ ions are removed from their crystallographic sites, the valence state of the metal ions increases to higher values, causing the XANES spectrum to shift to higher energies. So, we observed from in situ XAS spectra that the TM ions contribute to Na+ migration during the charge and discharge processes.
To determine the local structure around Fe and Mn ions, a Fourier transform (FT) EXAFS analysis of Fe and Mn K-edge XAS spectra is performed (we did not produce enough EXAFS data for Co since the Mn and Co edges are very close to each other). Applying FT analysis, the contour map is calculated (Figure 10). After the resting period, the calculated FT for Fe and Mn elements, including baseline subtraction, is used as reference data. The first and second peaks in the counter map for Fe and Mn K-edges come from the Fe/Mn-O and Fe/Mn-Fe/Mn bonds, respectively [68]. The extraction of Na+ during charge up to 4.3 V causes changes in bond lengths for both Fe and Mn. The comparison shows that in the Mn-O bond region, there is a loss in the intensity of the FT, while in the Mn-Fe(Co) bond region, an increase in the FT occurs. The variation in the intensity of the metal-O distribution has previously been explained via a change in the local environment of the metals [69]. Thus, the EXAFS data imply the participation of Mn ions in the redox electrochemical reaction, as was discussed in CV-experiments.
The bond lengths and coordination numbers of transition metal ions for the P63/mmc symmetry were calculated in the framework of the Artemis program [70,71] (Figure 11 and Figure S11). The optimization of the fitting parameters for each case can be found in [71]. Each calculation was made in acceptance of only one TM in the structure since Artemis does not allow for partial substitution in the structure. The calculated structural parameters are provided in Table 3.
It is clear that both manganese and iron bond distances (i.e., RMn-O, RFe-O, RMn-TM, and RFe-TM) smoothly decrease and increase during cell charging and discharging processes. When Na-ions are removed from the lattice, the electrostatic field around the metal ions changes. The oxygen ions are attracted by the other anions and cations in the lattice. When the attractive force between oxygen and Na disappears, the oxygen ions will move to another position in the lattice to provide electrostatic equilibrium in the lattice [72]. We attribute the bond length changes to the electrostatic interactions in the lattice. The Debye–Waller factor (σ2), expressing the correlation of atomic motion over crystallographic positions, can be used to assess the vibrational properties of the crystal lattice [73]. Thus, the observed changes in σ2 during cell charging and discharging are in agreement with the redox reaction discussed above.

3.4. Electrochemical Analysis of Full Cells

For practical application, the full cell containing NR2B as a cathode was further examined. The commercial hard carbon, as an anode, and the same electrolyte as in the case of half cells were used for the tests. It should be noted that the SEI formation on hard carbon was one of the main problems in the full cell design, and we performed a pre-sodiation process for three cycles of the hard carbon–separator–Na metal configuration of the cells in the glove box [74]. After the pre-sodiation process was finished, the anode was used immediately for the NR2B/hard carbon full cells. The CV graphs of the NR2B full cells measured between 2V and 4V were presented in Figure 12a. Two redox reaction regions are clearly distinguished: one at around 2.4 V due to Mn, and the second at around 3.8 V due to Fe. The EIS measurement of the full cells displays three different regions, which are fitted by the model given in the insert of Figure 12b: the lower impedance region corresponds to the ohmic part (which is related to the current collector), the small half circle is due to the cathode, the second half circle is explained by the anode part, and the last linear part for low-frequency response is due to mass transfer of the cells. It should be noted that the EIS of the full cells is different from that of the half-cell configuration.
The best-fitting model was used by the ZMan program. The fitting parameters are presented in Table 4. Thus, it was predicted that the full cell of NR2B would show the expected properties. The first Rs value is due to ohmic resistance, which is low enough for the full cell, as expected; the Q1/R1 region corresponds to the small half circle due to the surface film resistance; the Q2/R2 and Q3/R3 are related to the cathode and anode; and the last linear part for low-frequency response is due to mass transfer of the cells. The C-rate measurements show that the highest capacity was found to be 61 mAh/g for 20 mA/g, and it decreases to 29 mAh/g for 150 mA/g (Figure 12c).
The cycling tests were performed using an activation cycle for low current density, and then we started galvanostatic measurements to obtain better performance. The cycling stability is carried out at a current load of 12 mA/g up to 100 cycles (Figure 13a,b) and 60 mA/g up to 500 cycles (Figure 13c,d). Under 12 mA/g, the capacity decreases from 78 mAh/g and 51 mAh/g, while under 60 mA/g, the cell delivers around 35 mAh/g after 500 cycles. These values indicate the suitability of NR2B as a cathode material for practical application.

4. Conclusions

Solid-state reactions via quenching at high temperatures yield Co-substituted Na0.67(Mn0.5Fe0.5)1−xCoxO2 oxides with a P2-type of structure (0 ≤ x ≤ 0.3), where Co3+ ions substitute for Fe3+ and Mn4+ simultaneously. Applying the same synthesis procedure, Mg is partially inserted in the layered structure, and the rest of Mg is separated as MgO and/or MgCO3 phases. The method of synthesis allows for obtaining nonporous plate-like oxides with a high specific surface area (around 30 m2/g).
Between 2.0 and 4.3 V, the intercalation of Na+ into oxides is accomplished due to the reversible redox reactions of Mn3+/Mn4+ and Fe3+/Fe4+ ions. By increasing the operating temperature from 10 to 50 °C, the redox reaction of Mn3+/Mn4+ becomes dominant at the expense of the redox Fe3+/Fe4+ reaction. The Co3+ substituents in layered oxides also participate in the electrochemical reaction due to the redox couple Co3+/Co4+. At higher Co content (i.e., x > 0.1), the Co3+ ions suppress the Fe3+/Fe4+ reaction without affecting that of Mn3+/Mn4+. In addition, Mg additives cause an amplification of the oxygen redox activity, which takes place in addition to the Co/Fe/Mn metal ions. As a result, Co substituents have a positive impact on the rate capability of layered oxides, while Mg additives lead to a strong increase in the capacity and an enhancement of the cycling stability. Thus, the highest-performing oxide is achieved for 2 at.%-MgO-treated Na2/3(Mn1/2Fe1/2)0.9Co0.1O2 (175 mAh/g with a capacity fade of 28% after 100 cycles).
Combining the effect of Co substituents and Mg additives, the best electrochemical performance is achieved for the layered oxide substituted with 1 at.% Co and treated with 2 at.% MgO. The oxide operates between 10 and 50 °C, with a satisfactory capacity varying between 30 and 50 mAh/g under 100 mA/g for 200 cycles. The full sodium cells are composed of layered oxide as a cathode and hard carbon as an anode, which function between 2.0 and 4.0 V and deliver after 500 cycles of more than 40 mAh/g at a current load of 60 mA/g. The examination of this oxide in full cells discloses its huge potential for possible commercialization.

Supplementary Materials

The following supporting information can be downloaded at https://www.mdpi.com/article/10.3390/batteries9100497/s1. Figure S1: Rietveld-refined x-ray diffraction patterns: (a) NR2A; (b) NR2B; (c) NR2; (d) NR3A; (e) NR3B; (f) NR3C; (g) the dependence of the lattice parameters (a, c, and volume) and the interlayer distance (denoted as d) of the P2-oxides on the Co content. Figure S2: Raman Spectrum of the sample produced. Figure S3: SEM images of (a) NR1, (b) NR2, (c) NR3, (d) NR4, (e) NR2B, and (f) NR3A; EDX data of (g) NR2B and NR3A. Figure S4: BET analysis results of NR2, NR2B, and NR3B. Figure S5: CV graphs of (a) NR0, NR1, NR2, NR3, and NR4; (b) NR2, NR2A, NR2B, and NR2C; and (c) NR3, NR3A, NR3B, and NR3C. Figure S6: Charge–discharge curves for (a) NR1, (b) NR2, (c) NR3, and (d) NR4, and (e) their cycling stability. Figure S7: Charge–discharge curves for (a) NR2A, (b) NR2B, and (c) NR2C, and (d) their cycling stability. Figure S8: Charge–discharge curves for (a) NR3A, (b) NR3B, and (c) NR3C, and (d) their cycling stability. Figure S9: C-rate graphs of (a) NR0, NR1, NR2, NR3, and NR4; (b) NR2, NR2A, NR2B, and NR2C; and (c) NR3, NR3A, NR3B, and NR3C for 10–40–80–120–150–10 mA/g current rate, respectively. Figure S10: EIS graphs of the cells. Figure S11: Artemis fitting of NR2B cells for Mn and Fe-k edge for different voltage values. Table S1: The calculated lattice parameters, Na-layer distance, and weighted R (wR%) factor for Co-doped and MgO-treated oxides. Table S2: BET data of NR2, NR2B, and NR3B. Table S3: EIS fitting parameters of the cells.

Author Contributions

Conceptualization, N.T., S.A. (Sebahat Altundag), M.A. and S.A. (Sevda Avci); methodology, S.A. (Sebahat Altundag) and V.K.; software, S.A. (Sevda Avci) and V.K.; validation, S.A. (Sevda Avci), M.N.A., R.S. and V.K.; investigation, S.A. (Serdar Altin), M.N.A., R.S. and V.K.; resources, E.A.; data curation, S.A. (Serdar Altin), R.S. and V.K.; writing—original draft preparation, S.A. (Serdar Altin), R.S. and V.K.; writing—review and editing, S.A. (Sevda Avci), R.S. and V.K.; visualization, S.A. (Serdar Altin), R.S. and V.K.; supervision, S.A. (Serdar Altin) and R.S.; project administration, S.A. (Serdar Altin) and R.S. All authors have read and agreed to the published version of the manuscript.

Funding

This study was founded by Inonu University Research Council for project number FYL-2021-2436, European Union M-ERA net project by MASTER (M-ERA, KP-06-DO02/3, 18 May 2023).

Data Availability Statement

Data available on request due to restrictions privacy or ethical.

Acknowledgments

The authors would like to thank Inonu University Research Council for the financial support (project number FYL-2021-2436), the Rock Beamline in soleil synchrotron, France, and TENMAK-Turkey for financial support during synchrotron tests in France. The authors acknowledged the financial support of the project MASTER Center (M-ERA, KP-06-DO02/3, 18.05.2023). Partial support from Project CoE “National Center of Mechatronics and Clean Technologies” BG05M2OP001-1.001-0008 within the European Regional Development Fund within the Operational Programme “Science and Education for Smart Growth 2014–2020”.

Conflicts of Interest

The authors declare no conflict of interest.

References

  1. Mariyappan, S.; Wang, Q.; Tarascon, J.M. Will Sodium Layered Oxides Ever Be Competitive for Sodium-Ion Battery Applications? J. Electrochem. Soc. 2018, 165, A3714–A3722. [Google Scholar] [CrossRef]
  2. Abraham, K.M. How Comparable Are Sodium-Ion Batteries to Lithium-Ion Counterparts? ACS Energy Lett. 2020, 5, 3544–3547. [Google Scholar] [CrossRef]
  3. Liu, Q.; Hu, Z.; Li, W.; Zou, C.; Jin, H.; Wang, S.; Chou, S.; Dou, S.-X. Sodium transition metal oxides: The preferred cathode choice for future sodium-ion batteries? Energy Environ. Sci. 2021, 14, 158–179. [Google Scholar] [CrossRef]
  4. Wei, F.; Zhang, Q.; Zhang, P.; Tian, W.; Dai, K.; Zhang, L.; Mao, J.; Shao, G. Review—Research Progress on Layered Transition Metal Oxide Cathode Materials for Sodium Ion Batteries. J. Electrochem. Soc. 2021, 168, 050524. [Google Scholar] [CrossRef]
  5. Chen, T.; Ouyang, B.; Fan, X.; Zhou, W.; Liu, W.; Liu, K. Oxide cathodes for sodium-ion batteries: Designs, challenges, and perspectives. Carbon Energy 2022, 4, 170–199. [Google Scholar] [CrossRef]
  6. Yabuuchi, N.; Kajiyama, M.; Iwatate, J.; Nishikawa, H.; Hitomi, S.; Okuyama, R.; Usui, R.; Yamada, Y.; Komaba, S. P2-type Nax[Fe1/2Mn1/2]O2 made from earth-abundant elements for rechargeable Na batteries. Nat. Mater. 2012, 11, 512–517. [Google Scholar] [CrossRef] [PubMed]
  7. Kalluri, S.; Seng, K.H.; Wei, K.P.; Guo, Z.; Dou, S. Electrospun P2-type Na2/3(Fe1/2Mn1/2)O2 hierarchical nanofibers as cathode material for sodium-ion batteries. ACS Appl. Mater. Interfaces 2014, 6, 8953–8958. [Google Scholar] [CrossRef] [PubMed]
  8. Mortemard De Boisse, B.; Carlier, D.; Guignard, M.; Bourgeois, L.; Delmas, C. P2-NaxMn1/2Fe1/2O2 phase used as positive electrode in Na batteries: Structural changes induced by the electrochemical (De)intercalation process. Inorg. Chem. 2014, 53, 11197–11205. [Google Scholar] [CrossRef]
  9. Zarrabeitia, M.; Nobili, F.; Lakuntza, O.; Carrasco, J.; Rojo, T.; Casas-Cabanas, M.; Muñoz-Márquez, M.A. Role of the voltage window on the capacity retention of P2-Na2/3[Fe1/2Mn1/2]O2 cathode material for rechargeable sodium-ion batteries. Commun. Chem. 2022, 5, 11. [Google Scholar] [CrossRef]
  10. Cao, Y.; Xiao, M.; Sun, X.; Dong, W.; Huang, F. Recent Advances on High-Capacity Sodium Manganese-Based Oxide Cathodes for Sodium-ion Batteries. Chem.—Eur. J. 2023, 29, e202202997. [Google Scholar] [CrossRef]
  11. Konarov, A.; Kim, H.J.; Voronina, N.; Bakenov, Z.; Myung, S.T. P2-Na2/3MnO2 by Co Incorporation: As a Cathode Material of High Capacity and Long Cycle Life for Sodium-Ion Batteries. ACS Appl. Mater. Interfaces 2019, 11, 28928–28933. [Google Scholar] [CrossRef] [PubMed]
  12. Bucher, N.; Hartung, S.; Franklin, J.B.; Wise, A.M.; Lim, L.Y.; Chen, H.Y.; Weker, J.N.; Toney, M.F.; Srinivasan, M. P2-NaxCoyMn1-yO2 (y = 0, 0.1) as Cathode Materials in Sodium-Ion Batteries—Effects of Doping and Morphology to Enhance Cycling Stability. Chem. Mater. 2016, 28, 2041–2051. [Google Scholar] [CrossRef]
  13. Liu, L.; Li, X.; Bo, S.-H.; Wang, Y.; Chen, H.; Twu, N.; Wu, D.; Ceder, G. High-performance P2-Type Na2/3(Mn1/2Fe1/4Co1/4)O2 cathode material with superior rate capability for Na-ion batteries. Adv. Energy Mater. 2015, 5, 1500944. [Google Scholar] [CrossRef]
  14. Yoda, Y.; Kubota, K.; Kuroki, K.; Suzuki, S.; Yamanaka, K.; Yaji, T.; Amagasa, S.; Yamada, Y.; Ohta, T.; Komaba, S. Elucidating Influence of Mg- and Cu-Doping on Electrochemical Properties of O3-Nax[Fe,Mn]O2 for Na-Ion Batteries. Small 2020, 16, 2006483. [Google Scholar] [CrossRef] [PubMed]
  15. Song, B.; Hu, E.; Liu, J.; Zhang, Y.; Yang, X.-Q.; Nanda, J.; Huq, A.; Page, K. A novel P3-type Na2/3Mg1/3Mn2/3O2 as high capacity sodium-ion cathode using reversible oxygen redox. J. Mater. Chem. A 2019, 7, 1491–1498. [Google Scholar] [CrossRef]
  16. Maitra, U.; House, R.A.; Somerville, J.W.; Tapia-Ruiz, N.; Lozano, J.G.; Guerrini, N.; Hao, R.; Luo, K.; Jin, L.; Pérez-Osorio, M.A.; et al. Oxygen redox chemistry without excess alkali-metal ions in Na2/3[Mg0.28Mn0.72] O2. Nat. Chem. 2018, 10, 288–295. [Google Scholar] [CrossRef] [PubMed]
  17. Zhang, Y.; Liua, L.; Jamil, S.; Xie, J.; Liu, W.; Xia, J.; Nie, S.; Wang, X. Al2O3 coated Na0.44MnO2 as high-voltage cathode for sodium ion batteries. Appl. Surf. Sci. 2019, 494, 1156–1165. [Google Scholar] [CrossRef]
  18. Yu, Y.; Kong, W.; Li, Q.; Ning, D.; Schuck, G.; Schumacher, G.; Su, C.; Liu, X. Understanding the Multiple Effects of TiO2 Coating on NaMn0.33Fe0.33Ni0.33O2 Cathode Material for Na-Ion Batteries. ACS Appl. Energy Mater. 2020, 3, 933–942. [Google Scholar] [CrossRef]
  19. Hwang, J.-Y.; Yua, T.-Y.; Suna, Y.-K. Simultaneous MgO coating and Mg doping of Na[Ni0.5Mn0.5]O2 cathode: Facile and customizable approach to high-voltage sodium-ion batteries. J. Mater. Chem. A 2018, 6, 16854–16862. [Google Scholar] [CrossRef]
  20. Kong, W.; Wang, H.; Sun, L.; Su, C.; Liu, X. Understanding the synergic roles of MgO coating on the cycling and rate performance of Na0.67Mn0.5Fe0.5O2 cathode. Appl. Surf. Sci. 2019, 497, 143814. [Google Scholar] [CrossRef]
  21. Xue, L.; Bao, S.; Yan, L.; Zhang, Y.; Lu, J.; Yin, Y. MgO-Coated Layered Cathode Oxide With Enhanced Stability for Sodium-Ion Batteries. Front. Energy Res. 2022, 10, 847818. [Google Scholar] [CrossRef]
  22. Wang, J.; Teng, Y.; Su, G.; Bao, S.; Lu, J. A dual-modification strategy for P2-type layered oxide via bulk Mg/Ti cosubstitution and MgO surface coating for sodium ion batteries. J. Colloid Interface Sci. 2022, 608, 3013–3021. [Google Scholar] [CrossRef] [PubMed]
  23. Kamiyama, A.; Kubota, K.; Igarashi, D.; Youn, A.; Tateyama, Y.; Ando, H.; Gotoh, K.; Komaba, S. MgO-Template Synthesis of Extremely High Capacity Hard Carbon for Na-Ion Battery. Angew. Chem. Int. Ed. 2021, 60, 5114–5120. [Google Scholar] [CrossRef] [PubMed]
  24. Zhang, Y.; Zhang, R.; Huang, Y. Air-Stable NaxTMO2 Cathodes for Sodium Storage. Front. Chem. 2019, 7, 335. [Google Scholar] [CrossRef] [PubMed]
  25. Ginell, K.; Horn, C.; Von Dreele, R.B.; Toby, B.H. Materials for Learning Use of GSAS-II. Powder Diffr. 2019, 34, 184–188. [Google Scholar] [CrossRef]
  26. Toby, B.H.; Von Dreele, R.B. GSAS-II: The genesis of a modern open-source all purpose crystallography software package. J. Appl. Cryst. 2013, 46, 544–549. [Google Scholar] [CrossRef]
  27. Wu, Z.; Pang, W.K.; Chen, L.; Johannessen, B.; Guo, Z. In Situ Synchrotron X-Ray Absorption Spectroscopy Studies of Anode Materials for Rechargeable Batteries. Batter. Supercaps 2021, 4, 1547–1566. [Google Scholar] [CrossRef]
  28. Ravel, B.; Newville, M. ATHENA, ARTEMIS, HEPHAESTUS: Data analysis for X-ray absorption spectroscopy using IFEFFIT. J. Synchrotron Rad. 2005, 12, 537–541. [Google Scholar] [CrossRef]
  29. Landrot, G. FASTOSH: A Software to Process XAFS Data for Geochemical & Environmental Applications. In Proceedings of the Goldschmidt Abstracts, Boston, MA, USA, 12–17 August 2018; p. 1402. [Google Scholar]
  30. Maddukuri, S.; Valerie, P.; Upadhyayula, V.V. Synthesis and Electrochemical Study of New P3 Type Layered Na0.6Ni0.25Mn0.5Co0.25O2 for Sodium-Ion Batteries. ChemistrySelect 2017, 2, 5660–5666. [Google Scholar] [CrossRef]
  31. Sendova-Vassileva, M.; Stoyanova, R.; Carlier, D.; Yoncheva, M.; Zhecheva, E.; Delmas, C. Raman Spectroscopy Study on Na2/3Mn1-xFexO2 Oxides. Adv. Sci. Technol. 2010, 74, 60–65. [Google Scholar]
  32. Lu, Z.-H.; Dahn, J.R. The effect of Co substitution for Ni on the structure and electrochemical behaviour of T2 and O2 structure Li2/3 (Cox Ni1/3-x Mn2/3) O2. J. Electrochem. Soc. 2001, 148, A237. [Google Scholar] [CrossRef]
  33. Li, Z.; Yang, J.; Hou, J.G.; Zhu, Q. First-principles lattice dynamics of NaCoO2. Phys. Rev. B 2004, 70, 144518. [Google Scholar] [CrossRef]
  34. Zhao, L.; Ni, J.; Wang, H.; Gao, L. Na0.44MnO2–CNT electrodes for non-aqueous sodium batteries. RSC Adv. 2013, 3, 6650–6655. [Google Scholar] [CrossRef]
  35. Singh, K.; Kirubasankar, B.; Angaiah, S. Synthesis and electrochemical performance of P2-Na0.67AlxCo1-xO2 (0.0 ≤ × ≤ 0.5) nanopowders for sodium-ion capacitors. Ionics 2017, 23, 731–739. [Google Scholar] [CrossRef]
  36. Xie, M.; Luo, R.; Lu, J.; Chen, R.; Wu, F.; Wang, X.; Zhan, C.; Wu, H.; Albishri, H.M.; Al-Bogami, A.S.; et al. Synthesis-Microstructure-Performance Relationship of Layered Transition Metal Oxides as Cathode for Rechargeable Sodium Batteries Prepared by High-Temperature Calcination. ACS Appl. Mater. Interfaces 2014, 6, 17176–17183. [Google Scholar] [CrossRef] [PubMed]
  37. Wang, P.F.; You, Y.; Yin, Y.X.; Wang, Y.S.; Wan, L.J.; Gu, L.; Guo, Y.G. Suppressing the P2-O2 Phase Transition of Na0.67Mn0.67Ni0.33O2 by Magnesium Substitution for Improved Sodium-Ion Batteries. Angew. Chem. Int. Ed. 2016, 55, 7445–7449. [Google Scholar] [CrossRef] [PubMed]
  38. Altin, S.; Oz, E.; Altin, E.; Demirel, S.; Bayria, A.; Avci, S. Investigations of the capacity fading mechanism of Na0.44MnO2 via ex situ XAS and magnetization measurements. Dalton Trans. 2018, 47, 17102. [Google Scholar] [CrossRef]
  39. Darbar, D.; Muralidharan, N.; Hermann, R.; Nanda, J.; Bhattacharya, I. Evaluation of electrochemical performance and redox activity of Fe in Ti doped layered P2-Na0.67Mn0.5Fe 0.5O2 cathode for sodium ion batteries. Electrochim. Acta 2021, 380, 138156. [Google Scholar] [CrossRef]
  40. Rahmawati, F.; Kusumaningtyas, A.A.; Saraswati, T.E.; Prasetyo, A.; Suendo, V. Mn-doped NaFeO2 from a low purity-Fe precursor and its performance as cathode for Sodium-Ion Battery. Inorg. Nano-Met. Chem. 2021, 51, 383–390. [Google Scholar] [CrossRef]
  41. Su, C.; Suarez, D.L. In situ infrared speciation of adsorbed carbonate on aluminum and iron oxides. Clays Clay Miner. 1997, 45, 814–825. [Google Scholar] [CrossRef]
  42. Coluccia, S.; Marchese, L.; Martra, G. Characterisation of microporous and mesoporous materials by the adsorption of molecular probes: FTIR and UV–Vis studies. Microporous Mesoporous Mater. 1999, 30, 43–56. [Google Scholar] [CrossRef]
  43. Stoilova, D.; Koleva, V.; Vassileva, V. Infrared study of some synthetic phases of malachite (Cu2(OH)2CO3)–hydrozincite (Zn5(OH)6(CO3)2) series. Spectrochim. Acta Part A 2002, 58, 2051–2059. [Google Scholar] [CrossRef] [PubMed]
  44. Frost, R.L.; Spratt, H.J.; Palmer, S.J. Infrared and near-infrared spectroscopic study of synthetic hydrotalcites with variable divalent/trivalent cationic ratios. Spectrochim. Acta A 2009, 72, 984–988. [Google Scholar] [CrossRef] [PubMed]
  45. Sathiya, M.; Hemalatha, K.; Ramesha, K.; Tarascon, J.M.; Prakash, A.S. Synthesis, Structure, and Electrochemical Properties of the Layered Sodium Insertion Cathode Material: NaNi1/3Mn1/3Co1/3O2. Chem. Mater. 2012, 24, 1846–1853. [Google Scholar] [CrossRef]
  46. Duffort, V.; Talaie, E.; Black, R.; Nazar, L.F. Uptake of CO2 in Layered P2-Na0.67Mn0.5Fe0.5O2: Insertion of Carbonate Anions. Chem. Mater. 2015, 27, 2515–2524. [Google Scholar] [CrossRef]
  47. Zuo, W.; Qiu, J.; Liu, X.; Ren, F.; Liu, H.; He, H.; Luo, C.; Li, J.; Ortiz, G.F.; Duan, H.; et al. The stability of P2-layered sodium transition metal oxides in ambient atmospheres. Nat. Commun. 2020, 11, 3544. [Google Scholar] [CrossRef] [PubMed]
  48. Xu, C.; Cai, H.; Chen, Q.; Kong, X.; Pan, H.; Hu, Y.-S. Origin of Air-Stability for Transition Metal Oxide Cathodes in Sodium-Ion Batteries. ACS Appl. Mater. Interfaces 2022, 14, 5338–5345. [Google Scholar] [CrossRef] [PubMed]
  49. Kalapsazova, M.; Kukeva, R.; Harizanova, S.; Markov, P.; Nihtyanova, D.; Zhecheva, E.; Stoyanova, R. High-Performance Layered Oxides for Sodium-Ion Batteries Achieved through Combined Aluminum Substitution and Surface Treatment. Batteries 2023, 9, 144. [Google Scholar] [CrossRef]
  50. Peng, B.; Sun, Z.; Zhao, L.; Li, J.; Zhang, G. Dual-Manipulation on P2-Na0.67Ni0.33Mn0.67O2 Layered Cathode toward Sodium-Ion Full Cell with Record Operating Voltage Beyond. Energy Storage Mater. 2021, 35, 620–629. [Google Scholar] [CrossRef]
  51. Song, T.; Chen, L.; Gastol, D.; Dong, B.; Marco, J.F.; Berry, F.; Slater, P.; Reed, D.; Kendrick, E. High-Voltage Stabilization of O3-Type Layered Oxide for Sodium-Ion Batteries by Simultaneous Tin Dual Modification. Chem. Mater. 2022, 34, 4153–4165. [Google Scholar] [CrossRef]
  52. An, S.J.; Li, J.; Daniel, C.; Mohanty, D.; Nagpure, S.; Wood, D.L., III. The state of understanding of the lithium-ion-battery graphite solid electrolyte interphase (SEI) and its relationship to formation cycling. Carbon 2016, 105, 52–76. [Google Scholar] [CrossRef]
  53. Monson, P.A. Understanding adsorption/desorption hysteresis for fluids in mesoporous materials using simple molecular models and classical density functional theory. Microporous Mesoporous Mater. 2012, 160, 47–66. [Google Scholar] [CrossRef]
  54. Lu, X.; Sun, S.; Fan, Q.; Pei, X.; Dun, Y.; Feng, X.; Zou, C.; Lu, W. Investigation of Protective Performance of a Mg-Rich Primer Containing Aluminum Tri-Polyphosphate on AZ91D Magnesium Alloy in Simulated Acid Rain. Coatings 2019, 9, 649. [Google Scholar] [CrossRef]
  55. Li, L.; Ma, P.; Hussain, S.; Jia, L.; Lin, D.; Yin, X.; Lin, Y.; Cheng, Z.L. Wang, FeS2/carbon hybrids on carbon cloth: A highly efficient and stable counter electrode for dye-sensitized solar cells. Sustain. Energy Fuels 2019, 3, 1749–1756. [Google Scholar] [CrossRef]
  56. Liu, L.; Zhang, G.; Wang, L.; Huang, T.; Qin, L. Highly Active S-Modified ZnFe2O4 Heterogeneous Catalyst and Its Photo-Fenton Behavior under UV-Visible Irradiation. Ind. Eng. Chem. Res. 2011, 50, 7219–7227. [Google Scholar] [CrossRef]
  57. Menezes, P.W.; Indra, A.; Gutkin, V.; Driess, M. Boosting electrochemical water oxidation throughreplacement of Oh Co sites in cobalt oxide spinelwith manganese. Chem. Commun. 2017, 53, 8018–8021. [Google Scholar] [CrossRef]
  58. Menezes, P.W.; Indra, A.; Gonzalez-Flores, D.; Sahraie, N.R.; Zaharieva, I.; Schwarze, M.; Strasser, P.; Dau, H.; Driess, M. HighPerformance Oxygen Redox Catalysis with Multifunctional Cobalt Oxide Nanochains: Morphology-Dependent Activity. ACS Catal. 2015, 5, 2017–2027. [Google Scholar] [CrossRef]
  59. Yamashita, T.; Hayes, P. Analysis of XPS spectra of Fe2+ and Fe3+ ions in oxide materials. Appl. Surf. Sci. 2008, 254, 2441–2449. [Google Scholar] [CrossRef]
  60. Chowdhury, F.A.; Hossain, M.A.; Uchida, K.; Tamura, T.; Sugawa, K.; Mochida, T.; Otsuki, J.; Mohiuddin, T.; Boby, M.A.; Alam, M.S. Graphene oxide/carbon nanoparticle thin film based IR detector: Surface properties and device characterization. AIP Adv. 2015, 5, 107228. [Google Scholar] [CrossRef]
  61. Altin, S.; Altundag, S.; Altin, E.; Oz, E.; Harfouche, M.; Bayri, A. Investigation of Ti-substitution effects on structural andelectrochemical properties of Na0.67Mn0.5Fe0.5O2 battery cells. Int. J. Energy Res. 2020, 44, 11794–11806. [Google Scholar] [CrossRef]
  62. Zhao, W.; Tsuchiya, Y.; Yabuuchi, N. Influence of Synthesis Conditions on Electrochemical Properties of P2-Type Na2/3Fe2/3Mn1/3O2 for Rechargeable Na Batteries. Small Methods 2018, 3, 1800032. [Google Scholar] [CrossRef]
  63. Massaro, A.; Langella, A.; Muñoz-García, A.-B.; Pavone, M. First-principles insights on anion redox activity in NaxFe1/8Ni1/8Mn3/4O2: Toward efficient high-energy cathodes for Na-ion batteries. J. Am. Chem. Soc. 2023, 106, 109–119. [Google Scholar] [CrossRef]
  64. Altin, S.; Altundağ, S.; Altin, E.; Harfouche, M.; Bayri, A. An investigation of the improvement in energy storage performance of Na2/3Mn1/2Fe1/2O2 by systematic Al-substitution. J. Mater. Sci. Mater. Electron. 2020, 31, 14784–14794. [Google Scholar] [CrossRef]
  65. Wang, H.; Gao, R.; Li, Z.; Sun, L.; Hu, Z.; Liu, X. Different Effects of Al Substitution for Mn or Fe on the Structure and Electrochemical Properties of Na0.67Mn0.5Fe0.5O2 as a Sodium Ion Battery Cathode Material. Inorg. Chem. 2018, 57, 5249–5257. [Google Scholar] [CrossRef] [PubMed]
  66. Walczak, K.; Kulka, A.; Molenda, J. Alluaudite-Na1.47Fe3(PO4)3: Structural and electrochemical properties of potential cathode material for Na-ion Batteries. Solid State Sci. 2019, 87, 21–26. [Google Scholar] [CrossRef]
  67. Li, J.-Y.; Wu, X.-L.; Zhang, X.-H.; Lü, H.-Y.; Wang, G.; Guo, J.-Z.; Wan, F.; Wang, R.-S. Romanechite-structured Na0.31MnO1.9 nanofibers as high-performance cathode material for a sodium-ion battery. Chem. Commun. 2015, 51, 14848–14851. [Google Scholar] [CrossRef] [PubMed]
  68. Griese, J.J.; Kositzki, R.; Schrapers, P.; Rui, X.; Branca, M.M.; Nordström, X.A.; Lehtiö, J.; Haumann, M.; Högbom, X.M. Structural Basis for Oxygen Activation at a Heterodinuclear Manganese/Iron Cofactor. J. Biol. Chem. 2015, 290, 25254–25272. [Google Scholar] [CrossRef]
  69. Gholam, T.; Zheng, L.R.; Wang, J.O.; Qian, H.J.; Wu, R.; Wang, H.Q. Synchrotron X-ray Absorption Spectroscopy Study of Local Structure in Al-Doped BiFeO3 Powders. Nanoscale Res. Lett. 2019, 14, 137. [Google Scholar] [CrossRef]
  70. Taylor, N.T.; Davies, F.H.; Rudkin, I.E.M.; Price, C.J.; Chan, T.H.; Hepplestone, S.P. ARTEMIS: Ab initio restructuring tool enabling the modelling of interface structures. Comput. Phys. Commun. 2020, 257, 107515. [Google Scholar] [CrossRef]
  71. Raut, A.V.; Agrawal, A.; Bagde, A.; Fulzele, P.; Syed, Z.Q. 3-D Bioprinting in cartilage tissue engineering for bioinks-short review. Mater. Today Proceeding 2021, 44, 3296. [Google Scholar] [CrossRef]
  72. Yang, L.; López del Amo, J.M.; Shadike, Z.; Bak, S.-M.; Bonilla, F.; Galceran, M.; Nayak, P.K.; Buchheim, J.R.; Yang, X.-Q.; Rojo, T.; et al. A Co- and Ni-Free P2/O3 Biphasic Lithium Stabilized LayeredOxide for Sodium-Ion Batteries and its Cycling Behavior. Adv. Funct. Mater. 2020, 30, 2003364. [Google Scholar] [CrossRef]
  73. Meyer-Klaucke, W.; Gnida, M.; Henkel, G. X-ray Absorption Spectroscopy in Biology. Mol. Sci. Chem. Eng. 2014. [Google Scholar] [CrossRef]
  74. Moeez, I.; Jung, H.G.; Lim, H.-D.; Chung, K.-Y. Pre-Sodiation Strategies and Their Effect on Electrode-Electrolyte Interphases for High-Performance Electrodes for Sodium-Ion Batteries. ACS Appl. Mater. Interfaces 2019, 11, 41394–41401. [Google Scholar] [CrossRef]
Figure 1. Rietveld-refined X-ray diffraction patterns of (a) NR1, (b) NR2, (c) NR3, and (d)NR4.
Batteries 09 00497 g001
Figure 2. (a) FTIR and (b) Raman spectrum of NR2, NR2B, NR3, and NR3A.
Batteries 09 00497 g002
Figure 3. XPS spectra in the binding energy of Na 1s, Mg 1s, Fe 2p, Mn 2p, Co 2p, and O 1s for NR2B sample.
Batteries 09 00497 g003
Figure 4. CV-curves at 10 °C, room temperature, and 50 °C for NR2B (scan rates of 0.1, 0.2, 0.3, 0.4, and 0.5 mV/s are used).
Batteries 09 00497 g004
Figure 5. Capacity–voltage curves for NR2, NR2B, NR3, and NR3A after first cycle.
Batteries 09 00497 g005
Figure 6. (a) Cycling stability and (b) rate capability for NR2, NR2B, NR3, and NR3A half cells.
Batteries 09 00497 g006
Figure 7. Charge–discharge curves of NR2B after first cycle at 10 °C, room temperature, and 50 °C (a). Cycling stability of NR2B for 100 mA/g at elevated temperatures (b).
Batteries 09 00497 g007
Figure 8. EIS analysis of NR2, NR3, NR2B, and NR3A. The inset shows the equivalent circuit model of the cells.
Batteries 09 00497 g008
Figure 9. Fe, Mn, and Co K-edge XANES analysis of the NR2B during the charging and discharging processes.
Batteries 09 00497 g009
Figure 10. Counter map of EXAFS of (left) Fe-K edge and (right) Mn K-edge for NR2B during the charging and discharging processes.
Batteries 09 00497 g010
Figure 11. Artemis analysis graphs for Mn and Fe EXAFS data at 1.5 V.
Batteries 09 00497 g011
Figure 12. (a) CV, (b) EIS (inset shows the EQC model), and (c) C-rate measurements of NR2B|hard-carbon full cells.
Batteries 09 00497 g012
Figure 13. (a,c) Charge/discharge curves and (b,d) cycling stability of NR2B/hard carbon full cells at 12 mA/g for 100 cycles and 60 mA/g for 500 cycles, respectively. The cycling of the cells were made as 4 mA/g for 2 cycles, 6 mA/g for 2 cycles and 12 mA/g for 98 cycles as indicated in the Figure 13b. The Coulombic efficiency (red lines) are also given.
Batteries 09 00497 g013
Table 1. Sample notation for the study oxides.
Co-Substituted OxidesNotationMgO-Treated OxidesNotation
Na0.67(Mn0.5Fe0.5)0.95Co0.05O2NR1
Na0.67(Mn0.5Fe0.5)0.9Co0.1O2NR21%MgO/Na0.67(Mn0.5Fe0.5)0.9Co0.1O2NR2A
2%MgO/Na0.67(Mn0.5Fe0.5)0.9Co0.1O2NR2B
3%MgO/Na0.67(Mn0.5Fe0.5)0.9Co0.1O2NR2C
Na0.67(Mn0.5Fe0.5)0.8Co0.2O2NR31%MgO/Na0.67(Mn0.5Fe0.5)0.8Co0.2O2NR3A
2%MgO/Na0.67(Mn0.5Fe0.5)0.8Co0.2O2NR3B
3%MgO/Na0.67(Mn0.5Fe0.5)0.8Co0.2O2NR3C
Na0.67(Mn0.5Fe0.5)0.7Co0.3O2NR4
Table 2. Oxide performance parameters of the half cells.
Sample
Code
1st Cycle
(mAh/g)
100th Cycle
(mAh/g)
Capacity
Loss (%)
NR-11306748.5
NR-21699643.2
NR-31218133.1
NR-45153~0
NR-2A13110023.6
NR-2B175125.528.3
NR-2C9641.543.8
NR-3A1388836.2
NR-3B1238630
NR-3C1188032.2
Table 3. The XAFS fitting parameters of the cells were obtained via the Artemis program. (S02 = amp*N (amp = 0.725 for Fe and Mn; and ΔE = −7.129 for Fe and −11.44 for Mn); N is the coordination number of ions; the R and k ranges were chosen as 1–3 Å and 3–14 Å−1 for all metals, respectively).
EXAFS
Region
Voltage→1.5 V2.53.54.33.51.5 V
Parameter↓
RMn-O (Å)1.9261.9401.9371.9021.9331.931
RMn-TM (Å)2.9132.9092.9042.8992.9152.921
Mn K-edgeσ2Mn-O × 10−33.222.712.352.712.682.19
σ2Mn-TM × 10−35.184.345.024.164.904.73
NMn5.5045.3705.2465.1555.1374.864
R-factor0.1550.2340.2470.0280.1620.137
RFe-O (Å)2.0052.0391.9601.9951.9882.001
RFe-TM (Å)2.9432.9612.9262.9352.9332.948
Fe K-edgeσ2Fe-O × 10−37.787.668.188.287.687.00
σ2Fe-TM × 10−38.849.389.288.788.608.55
NFe7.6977.6757.7577.6976.3776.219
R-factor0.0120.0890.0810.0090.0210.007
Table 4. EIS fitting parameters where Qn were 1 s Q a n (n = 1,2,3) and s = jw.
RsQy1Qa1R1Qy2Qa2R2Qy3Qa3R3
0.00020.01320.5387014.6 × 10−50.5666.989.6 × 10−40.78959
Disclaimer/Publisher’s Note: The statements, opinions and data contained in all publications are solely those of the individual author(s) and contributor(s) and not of MDPI and/or the editor(s). MDPI and/or the editor(s) disclaim responsibility for any injury to people or property resulting from any ideas, methods, instructions or products referred to in the content.

