1. Introduction
Renewable energy systems face uncertainty in resource availability, which can create challenges in participating in electricity markets that require prior commitments. Energy storage systems (ESS) can mitigate this uncertainty by storing energy for later use [
1].
The energy commitment for the day-ahead market is made by submitting offers to the market operator the day before delivery. Forecasting techniques are applied to predict electricity prices and resource availability [
2], using techniques such as the SARIMA model, which can capture seasonal correlations in historical data. The authors in [
3] demonstrate how a SARIMA model can outperform deep-learning techniques. In this work, SARIMA models are used to forecast both electricity prices and wind speeds, and have been shown to outperform deep-learning techniques in previous studies.
An offering strategy for energy commitment is typically formulated as a constrained optimization problem [
4]. The decision vector includes offers for each hour of the market, and the objective is to maximize revenue during the session. Constraints include physical parameters of the plant and market rules, which heavily influence the feasible solution space.
Multi-market participation, which includes day-ahead and intraday market sessions, cannot be formulated as a single optimization problem due to the different timeframes of each market. A progressive optimization approach, as proposed by the authors in [
5], is used in this work.
Intraday markets can be utilized to increase profits through revenue stacking, which typically involves combining energy and power services. Studies such as [
6] demonstrate that combining frequency response and arbitrage can increase revenue by up to 25%. Similar results are found in studies such as [
7], which consider multiple spot market participation. This is also proposed by the authors in [
7]. These approaches are compared in this work.
The aforementioned studies do not model the forecast generation and market offering processes. Generated forecasts at different times of the day can contradict each other and lead to issues when various markets overlap. This work addresses this issue.
Balancing mechanisms in electricity markets, such as penalties for deviations, can be used to address deviations caused by forecasting errors. Intraday markets can be used to correct errors [
8], but require prior commitments. An alternative solution is to use energy storage systems for real-time corrections through a service called capacity firming (CF) [
9].
Capacity firming has received increasing attention in recent literature as a service provided in real-time as opposed to arbitrage. Studies such as [
10] propose energy conservation methods for control schemes of BESSs integrated with a PV system. Other works, such as [
11], show how a simple control algorithm can achieve capacity firming in a BESS combined with a wind farm, although the storage system is only used for this service.
The Iberian electricity markets are used as an example in this work since, like many other systems, they have day-ahead and intraday spot markets. Market operator rules are incorporated into the optimization algorithm and the calculation of net benefits. Participation in intraday markets and the use of the CF service are compared, and the revenue stacking of different services is evaluated. This work also considers the effect of degradation on long-term profits, an approach that has not been considered in the previous literature.
A HF model consisting of a Gamesa G128 Wind Turbine Generator (WTG) and a BESS is presented. Unlike a virtual power plant (VPP), the system components are not distributed; thus, they share a point of common coupling (PCC). The SARIMA forecasting model uses wind historical data from the Sotavento experimental wind farm [
12] and electricity prices from the Iberian market as inputs for the EMS.
The results show that participating in all markets may be counter-productive due to market overlap. The best results in terms of profits per degradation are obtained by allowing the BESS to participate only in the day-ahead market and performing capacity firming in real time.
The work proposes a new service called SOC Emptying (SE), which involves dividing the BESS into two virtual energy storage systems (VESS). One VESS provides regular services, while the other is used to empty the BESS whenever the combined state of charge (SOC) exceeds a specific threshold. This service aims to reduce upward deviations and give the BESS more maneuverability. The inclusion of this service further improves the results, resulting in increased profits per percentage of capacity loss and higher net present values when extrapolating the results for the entire project.
The contributions of this work are outlined as follows:
A formulation for a progressive optimization algorithm for hybrid farm multi-market participation that takes into account degradation effects caused by operation.
The implementation of a real-time BESS degradation model that assesses capacity and power losses in a simulation framework to evaluate different market participation strategies.
Evidence shows that using the BESS in all markets does not necessarily result in a better income after comparing different simulation scenarios.
A proposed service that enhances the BESS utilization efficiency and increases the project’s net present value (NPV).
The paper is structured as follows:
Section 2 provides an overview of the Iberian electricity market rules.
Section 3 describes the HF model used in the study. The day-ahead and intraday market offering optimization models are analyzed in
Section 4.
Section 5 presents the simulation use cases and results. Conclusions and future research directions are discussed in
Section 6.
2. Iberian Market’s Rules
Before each market session opening time, the EMS must have forecasted data of prices and wind power generation. It is therefore necessary to know when each market session takes place and which hourly delivery periods are negotiated, both for forecasting and optimization problem definition. To obtain real benefits, this study follows the regulations of the Iberian markets, which take into account deviation costs.
This section introduces the rules of the Iberian markets, starting with the day-ahead market, followed by the intraday markets, and finally, the deviation rules are described, which consider four different deviation costs.
2.1. Day-Ahead Market
The majority of energy traded in the Iberian wholesale markets is conducted through the day-ahead market. In 2020, it accounted for 74% of the total energy traded [
13]. Therefore, it is the most important market for arbitrage operations. The Iberian day-ahead market session takes place every day of the year at 12:00 CET.
The price and volume of energy is determined for each hour of the following day by the intersection of demand and supply. Market agents submit their offers through the market operator OMIE [
14]. As a result, the EMS has to submit 24-hourly offers for the following day, using price and generation forecasts generated 12 to 36 hours prior to delivery time.
2.2. Intraday Markets
After the day-ahead market, intraday markets accounted for 14% of the energy traded in 2020 [
13]. Since intraday spot markets had six times more energy than continuous intraday markets, this work only considers the former. In
Table 1, the closing times and delivery hours of the market sessions are shown.
The closing times in
Table 1 are the deadlines for submitting offers to the market operator. Decisions must be made before this time. The delivery hours in the table are the hours during which the energy negotiated in each intraday market session will be delivered on day D.
Since Sessions 1 and 2 cover the same hours, Session 1 is neglected as Session 2 has a closer opening time to the delivery. Intraday markets allow agents to correct their schedules in the day-ahead market. This can be performed by purchasing energy during hours when a deviation from the day-ahead program is expected. Arbitrage can also be performed to gain additional liquidity. Both options are considered in the simulation cases.
2.3. Adjustment Mechanism
Four different deviation costs need to be considered in the Iberian market:
Positive deviation costs for upward deviations that have a negative impact on the system;
Positive deviation costs for upward deviations that have a positive impact on the system;
Negative deviation costs for downward deviations that have a negative impact on the system;
Negative deviation costs for downward deviations that have a positive impact on the system.
A deviation during an hourly period
h is calculated as follows:
where the following apply:
: Deviation during hour h (MWh).
: Delivery during hour h (MWh).
: Commitment during hour h (MWh).
If the deviation is upwards and in favor of the system, the additional energy is remunerated at the day-ahead price during hour h; therefore, the bonus is calculated as:
where the following apply:
If the deviation is upwards and against the system, the energy excess is remunerated at less than the day-ahead price during hour h. This bonus is calculated as:
where the following applies:
If the deviation is downwards and in favor of the system, the energy deficit is charged at the same price as the day-ahead price during hour h; therefore, the penalty is calculated as:
where the following applies:
If the deviation is downwards and against the system, the energy deficit is charged at a rate surpassing the day-ahead price during hour h; therefore, the penalty is calculated as:
The total deviation cost is formulated as follows. As can be seen, it can be negative when more energy is available than committed:
where the following applies:
The coefficient
represents the system’s vulnerability to deviations against it. A higher coefficient means that a higher penalty will be paid. As seen in (
3), if the coefficient is greater than 1, the bonus for upward deviations can be negative, which implies a penalty. During the same hourly period, if downward deviations are against the system, upward deviations are in favor of the system, and vice versa. The deviation coefficient is determined by the system operator and is the same for both types of deviations.
3. Hybrid Plant Model Overview
The model consists of the physical systems and their control architecture. In this section, the model inputs’ generation is described for both wind speed and market prices. Afterwards, the plant model and its control architecture are introduced. Lastly, the daily earning calculation is formulated.
3.1. Model Inputs
3.1.1. Wind Power
Wind power is obtained through a two-stage approach, as in [
15]. First, hourly wind speed is forecasted using a SARIMA; then, forecasted data are fed into a function that expresses a Gamesa G128 wind turbine power curve. The optimization and energy management system (EMS) models directly receive the forecasted and real wind power hourly values.
Wind speed historical data are obtained from Sotavento experimental park in Galicia, Spain [
12]. This source was chosen due to its publicly available data and its location within the Iberian market region. The data have a resolution of one hour, and the measured wind speed for the year 2018 is presented in
Figure 1.
Hourly wind speed forecasts are required during the opening hours of market sessions. The first forecast is at 12:00 h, when the day-ahead market commences, and subsequent forecasts are generated during the opening hours of intraday market sessions. For real-time operations, actual measured wind speed data are utilized. The SARIMA model utilized in this work has an order of
, obtained from [
16]. The configuration process for the model is not covered in this work.
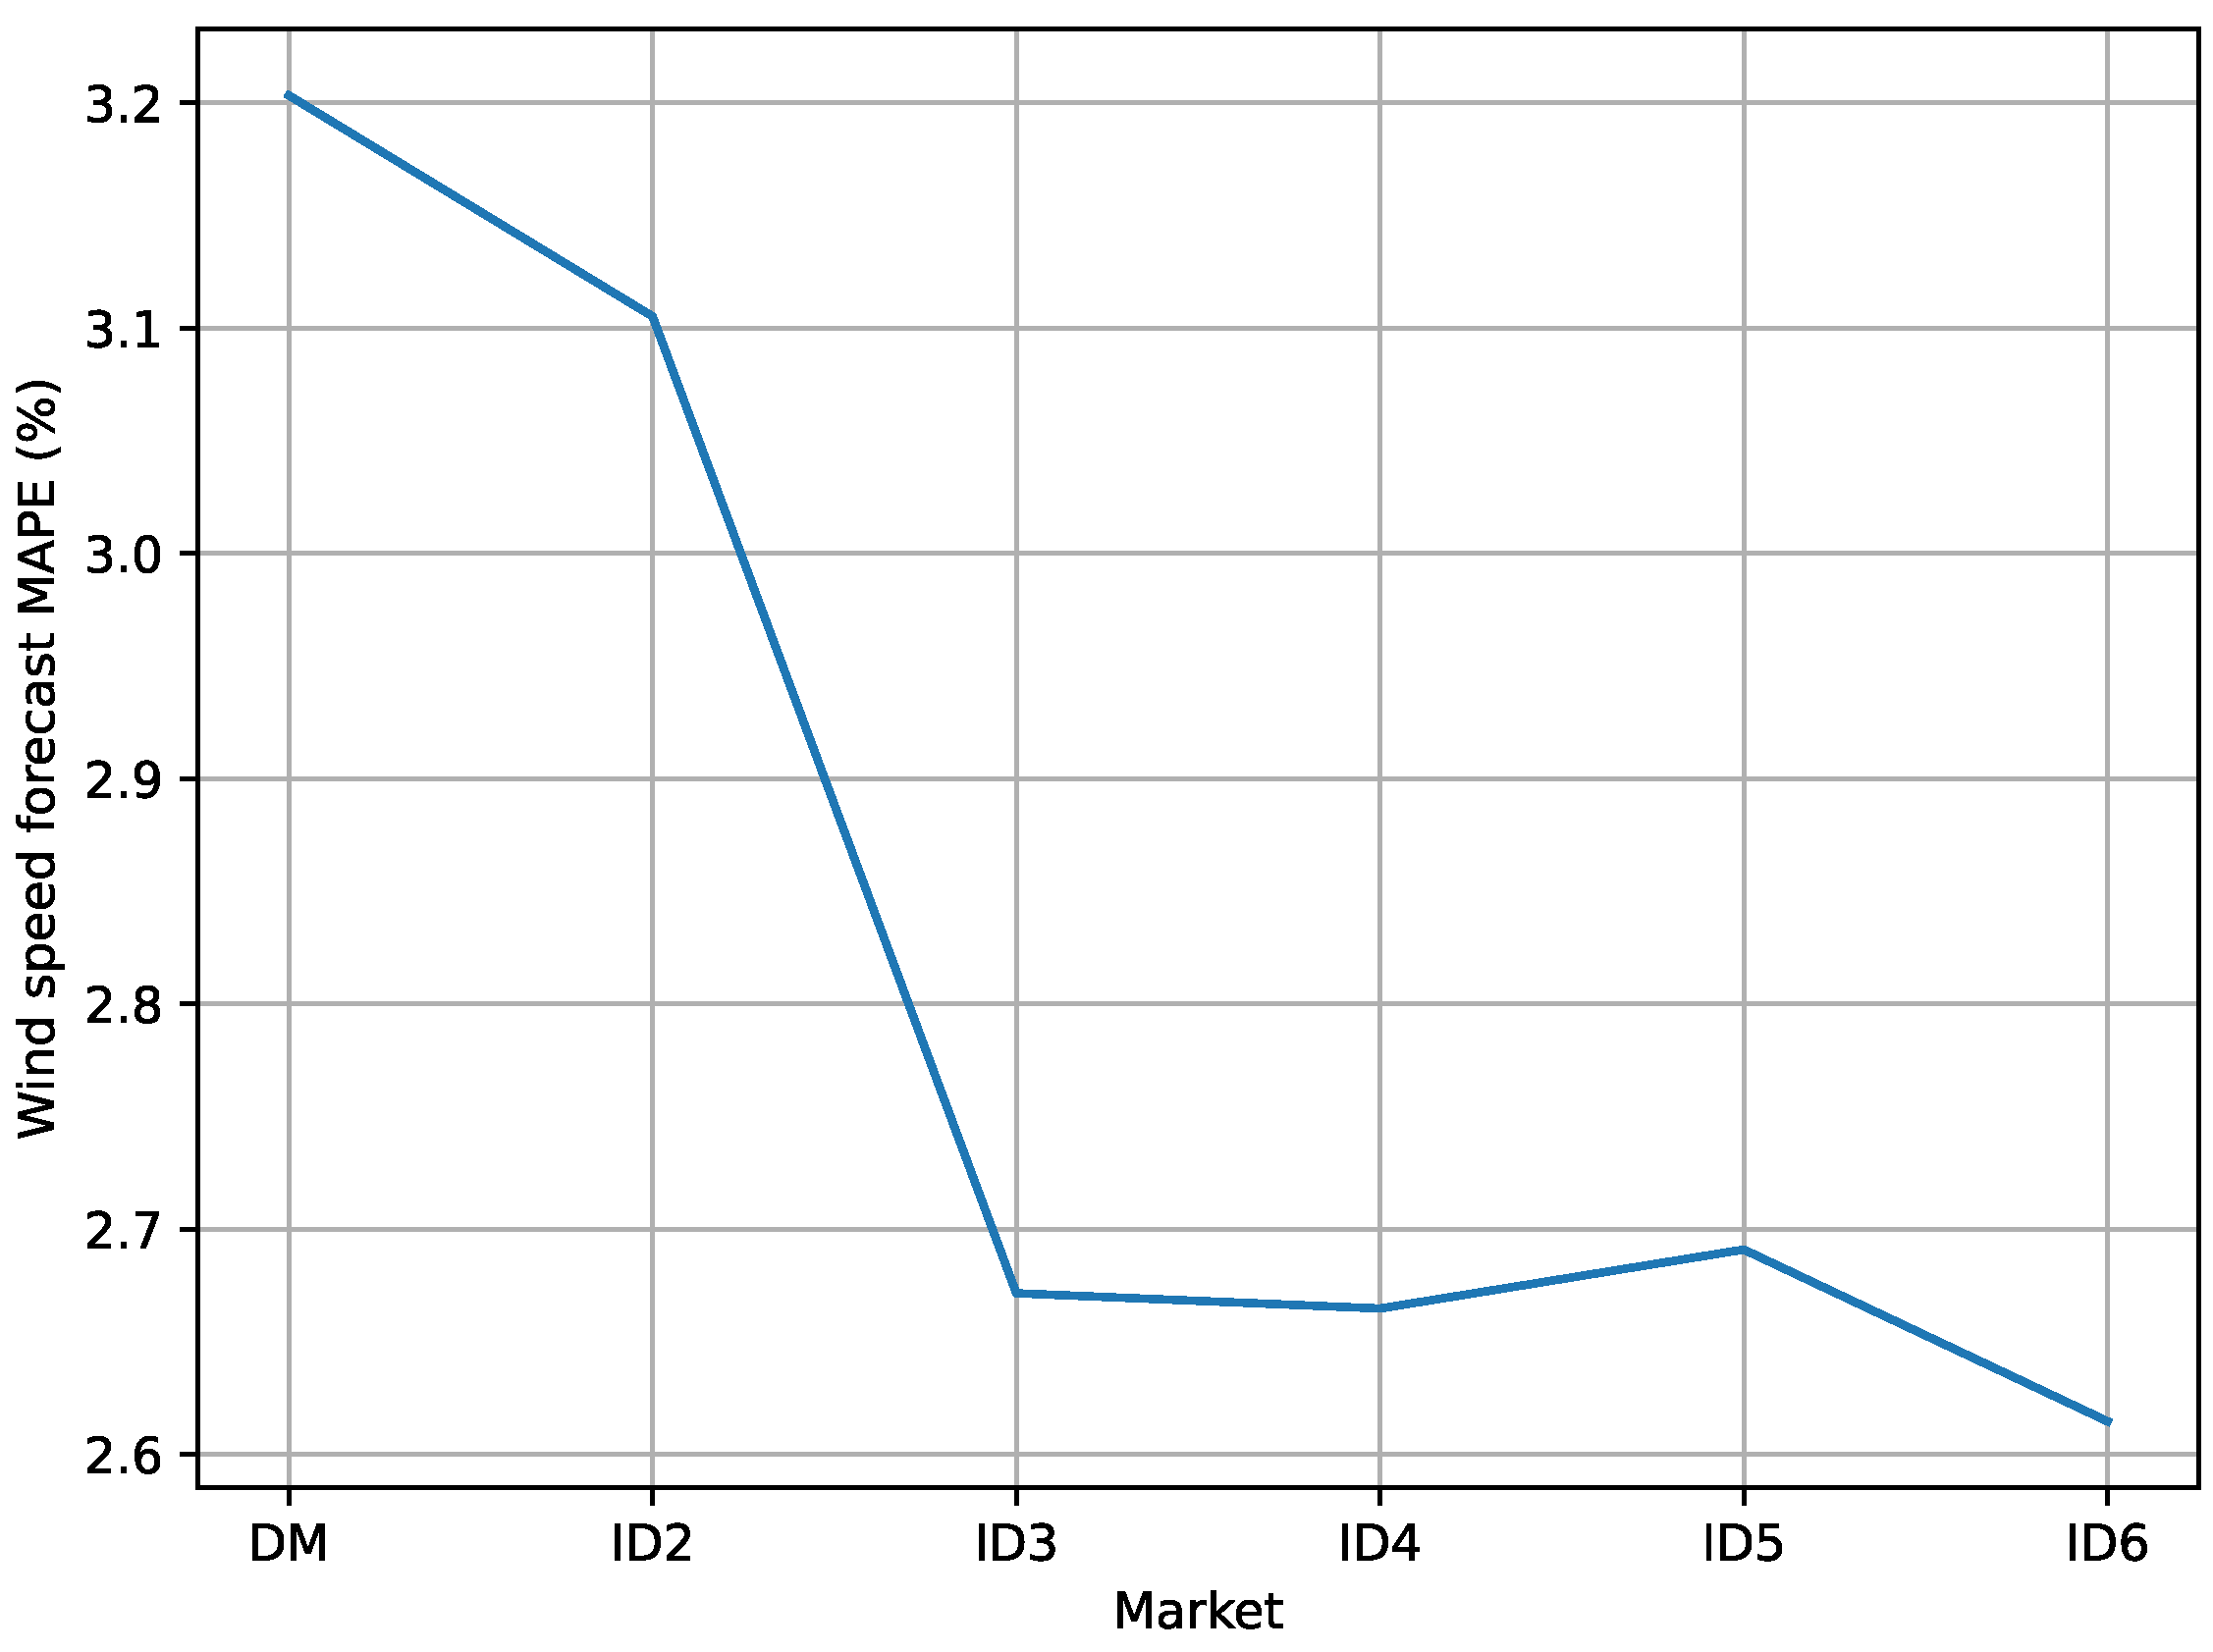
Figure 2 illustrates the 2018 average mean absolute percentage error (MAPE) of the wind speed forecasts generated during different market sessions. It is observed that the prediction error tends to decrease.
3.1.2. Electricity Price Forecasts
The 24-hourly prices for the next day are predicted at 12:00 h on the previous day. A SARIMA model of order
was obtained from [
16]. In
Figure 3, the predicted and real day-ahead prices for April the 16th are shown. Intraday prices are considered as known beforehand for simplicity.
3.1.3. Deviation Prices
The hourly deviation coefficients derived from 2018 historical data are used to calculate the final deviation costs. However, a deviation coefficient is required for the optimization model of intraday market offerings. Since deviation coefficients are only known after the delivery period has ended, a forecasting technique for predicting the direction (favorable or unfavorable) of deviation is required, but it is outside the scope of this paper. Therefore, a deviation coefficient of 21%, the average of 2017, is considered when participating in the intraday market.
3.2. Plant Model Components
The HF model consists of a wind turbine generator and a BESS.
3.2.1. Wind Turbine Generator
The generation system is a single Gamesa G128 WTG with a nominal power of 4.5 MW. The power curve is taken from [
17]. Only a WTG is considered for convenience. Generator converter efficiency is considered part of the power curve characteristic.
3.2.2. Battery Energy Storage System
The storage system is composed of a 10 MWh/2.5 MW lithium iron phosphate (LFP) battery, whose round-trip efficiency is assumed to be constant at 90%, as in [
18]. A cycling degradation model, based on depth of discharge (DOD) is implemented, sourced from a finalization of the degradation curve presented in [
19]. The model calculates degradation by using rainflow counting of the cycles performed during the day and determines the State of Health (SOH) lost based on the DOD of these cycles, in accordance with the curve shown in
Figure 4.
A calendar degradation model, sourced from [
20], is incorporated into the plant model. This model is based on tests conducted on different LFP batteries over 899 days, where they were maintained at various SOCs and temperatures. The test results for 25
C were selected and are presented in
Table 2.
As depicted in
Table 2, daily calendar degradation can be represented as a linear function of SOC. Since it is also considered linear with respect to time, the following expression has been obtained from the table:
where the following apply:
3.3. Control Architecture
The EMS operates on three levels. The tertiary level operates in advance, and is responsible for formulating strategies for offerings in various energy markets. It receives as inputs the predicted prices, generation, and the real-time SOC for the intraday market and SE optimization models, which are executed at this control level. It then sends market commitments to the secondary level.
The secondary control level operates in real-time and generates the setpoints for the BESS based on the difference between generation and commitments generated on the third level. The BESS setpoints are calculated as follows:
where the following apply:
: BESS setpoint during hour h (MW).
: Generation during hour h (MW).
: Commitment during hour h (MW).
As shown, when an upward deviation is anticipated, the BESS will receive a setpoint to charge the excess. Conversely, when a downward deviation is expected, a discharging setpoint is generated.
The primary control level manages the energy storage system; it receives charge–discharge setpoints from the secondary level and adjusts them based on the real-time SOC. If the BESS does not have enough energy to cover the missing energy, a downward deviation will occur during that hour. If the BESS is unable to store the excess energy, then an upward deviation will occur.
A sketch of the EMS control architecture is illustrated in
Figure 5.
3.4. Daily Profits Calculation
The daily profits are calculated as the sum of the hourly profits. In Equation (
9), the calculation of daily earnings is depicted. The daily losses are formulated as in Equation (
10).
where the following apply:
: Daily earnings (EUR).
: Energy commitment in day-ahead market during hour h (MWh).
: Day ahead market real price during hour h (EUR/MWh).
: Energy commitment in intraday markets during hour h (MWh).
: Intraday market real price during hour h (EUR/MWh).
: Daily losses (EUR).
: Power purchased in intraday market during hour h (MW).
Downward deviations can be corrected in intraday markets in two ways:
The optimization algorithm chooses how to correct expected deviations depending on the intraday market prices and deviation costs at each hour.
4. Optimization Problems for Market Participation
In this work, market scheduling strategies are formulated as mathematical optimization problems. The progressive optimization approach, similar to the one described in [
5], is employed. The day-ahead market scheduling problem is first solved to generate an hourly power schedule vector
. This vector is updated and sent to the secondary control level in real-time throughout the day. The process is illustrated in
Figure 6.
This section presents the formulation of the optimization problems. The day-ahead market offering is explained first, followed by the intraday market offering, and finally the proposed SE service optimization is described as a separate problem.
4.1. Day-Ahead Market Offering
The inputs for the day-ahead market offering include the price and power generation forecasts for the next day generated at 12:00 PM and the plant assets’ parameters. The optimization problem is subject to the following constraints:
The charge power cannot be higher than the nominal value:
where the following apply:
: Charging power during hour h (MW).
: Nominal power (MW).
: A binary variable that equals 1 when the battery is not discharging during hour h.
The discharge power cannot be higher than the nominal value:
where the following apply:
: Discharging power during hour h (MW).
: Nominal power (MW)
: A binary variable that equals 1 when the battery is not charging during hour h.
The charging power is always positive:
For optimization algorithm simplicity, the discharge power is also always positive:
The simultaneous charge and discharge is not possible:
The energy stored at the end of each period is calculated as follows:
where the following apply:
E(h): Energy stored in the battery at the end of hour h (MWh).
: Efficiency (%)
E(h − 1): Energy stored on the battery at the beginning of hour h, which is considered to be 0 at the first hour.
The stored energy cannot have a negative value:
The BESS cannot discharge if its participation in the day-ahead market is disabled; this constraint is activated depending on the case of study:
The power flow of the plant is defined as follows:
where the following apply:
: Total generation power during hour h (MW).
: Generation power sent directly to the grid during hour h (MW).
: Generation power sent to the storage system during hour h (MW).
The following objective function seeks to maximize the income:
The objective of this function is to maximize profits through the generation of the optimal schedule based on forecasted energy and prices. Deviations are not accounted for in this optimization problem and are addressed in the intraday market optimization. The output of this offering strategy is the hourly schedules for the following day, which serve as input for the next optimization problems.
As it can be seen, the BESS does not purchase energy from the market. As per the regulations of the Renewable Energy Economic Regime [
21], a BESS is not allowed to purchase energy from electricity markets when operating in hybrid plants.
4.2. Intraday Market Participation
The intraday market participation aims to adjust the hourly schedule in the case of expected deviations. It does so through two means: selling expected excess energy if enabled and purchasing energy in case of expected downward deviation. The optimization function takes the following inputs: committed hourly schedules, generated power prediction, deviation costs, intraday market prices, and the expected state of charge at the beginning of delivery.
Each intraday market session occurs three hours before delivery, as shown in
Table 1. The expected SOC at the start of delivery is communicated by the tertiary control level. The constraints for this optimization are the same as those for the day-ahead market scheduling problem, with the addition of the following constraints:
The upward deviations are
where the following apply:
Upward deviation during hour h (MW).
PCC power during hour h (MW).
Scheduled power during hour h (MW).
The downward deviations are
where the following applies:
The downward deviations are considered always positive, for simplicity purposes:
The same happens with upward deviations:
As can be seen, when one type of deviation takes place, the other is equal to zero.
The hourly deviation costs are
The deviation penalty and bonuses are calculated from expressions (
3) to (
5). The intraday optimization uses real day-ahead market prices, available at the time of the intraday market. The deviation coefficient is set at 21% and the average is from 2017, and it is used only as an assumption at this stage, while historical deviation coefficients are used later to calculate real benefits.
The internal power flow constraint depicted in (
19) is modified:
where the following apply:
The generated power is allocated to either cover expected deviations or to maximize profits in the intraday market.
The constraint regulating stored energy is a modification of (
16) as follows:
where the following applies:
This division of discharged power into two parts—one used to cover deviations and one used for arbitrage—is similar to the division of generated power.
If arbitrage in the intraday market is disabled, the following constraints are applied:
The PCC output power is computed as follows:
The intraday market purchased power is not physically received by the plant and serves to fulfill commitments in the day-ahead market in case of deviations. It is therefore not included in the PCC output power constraint, which measures expected deviations. The exchanged power is part of the scheduled power vector input for the subsequent intraday market optimization, as shown in the constraints represented by expressions (
21) and (
22).
The objective function is defined in (
31) with two goals: minimizing expected deviations and maximizing profits through energy trading.
where the following applies:
The hourly commitment vector is updated using the outputs of the intraday market optimization problem:
where the following apply:
: New hourly schedule (MW).
: Previous hourly schedule (MW).
4.3. State of Charge Emptying
As previously discussed, the secondary control level sends generated energy to the grid when the BESS is full and hourly commitments are fulfilled, leading to an upward deviation. The market operator only pays for excess energy at the day-ahead market price when the deviation is in favor of the system, as described in Equations (
2) and (
3). This can result in a missed opportunity to sell energy at higher prices when the deviation is against the system.
Moreover, the highest calendar degradation occurs when the BESS is full, as shown in
Table 2. A new operating mode is proposed that involves selling part of the stored energy on the nearest intraday market when the BESS SOC exceeds a set threshold. This service differs from intraday market arbitrage in the following ways:
It operates simultaneously with the intraday market optimization process.
It only manages energy above a certain threshold, not the entire BESS.
It is limited to offering energy only in the first hours of each intraday market, to prevent overlap with the next one.
In
Figure 7, the operating hours of the proposed service are shown, marked in blue, over the delivery hours of the intraday market, which are represented as white bars.
This service splits the BESS into two virtual energy storage systems (VESS), one for profit generation and the other for deviation reduction. The stored energy is divided with a threshold of 75% set for the SE service. This value was determined through testing various values in the study and was found to be the optimal balance between profits and deviation reduction.
where the following apply:
The SE service is managed as an optimization problem identical to the one for intraday market participation but limited to the first hours of the next intraday market. The variables used for deviation coverage are disabled as the objective of this service is solely profit generation. The objective function is as follows:
where the following apply:
The goal is to sell available energy at the most expensive hours. The scheduled power vector is updated as in (
32).
5. Simulations and Results
In this section, the simulation scenarios are presented, each showcasing a different approach to using the BESS on the HF. Each scenario involves simulating the HF with the respective approach operating during 2018 in the Iberian electricity markets. The aim is to compare and assess whether revenue-stacking is more efficient than focusing on individual services, and the performance of the proposed service.
At the end of each day, the accumulated degradation and SOC serve as initial values for the following day’s operation. The average daily profits and degradation under each scenario are used in a full project extrapolation for a comprehensive view of the different cases.
5.1. Simulation Cases
The simulation cases used are the following:
Ideal: Perfect foresight of prices and power generation, which operates only in the day-ahead market.
DM: Energy sales in the day-ahead and intraday markets to cover deviations.
DM + SE: Same as DM, but with additional SOC emptying service.
DM + ID: Energy sales in day-ahead market and intraday markets to sell excess and cover deviations.
ID: Only participates in intraday markets for energy sales and covering deviations.
SE: Only participates in intraday markets to cover deviations and performs SE service.
CF: No market participation; covers deviations through capacity firming services (already provided in previous cases).
5.2. Simulation Results
The simulation was conducted using the same input data in each case. Expected profits were calculated by summing the earnings from day-ahead and intraday market commitments and real prices. Real profits were calculated as the difference between daily earnings (Equation (
9)) and daily losses (Equation (
10)) using historical data of electricity prices and deviation coefficients.
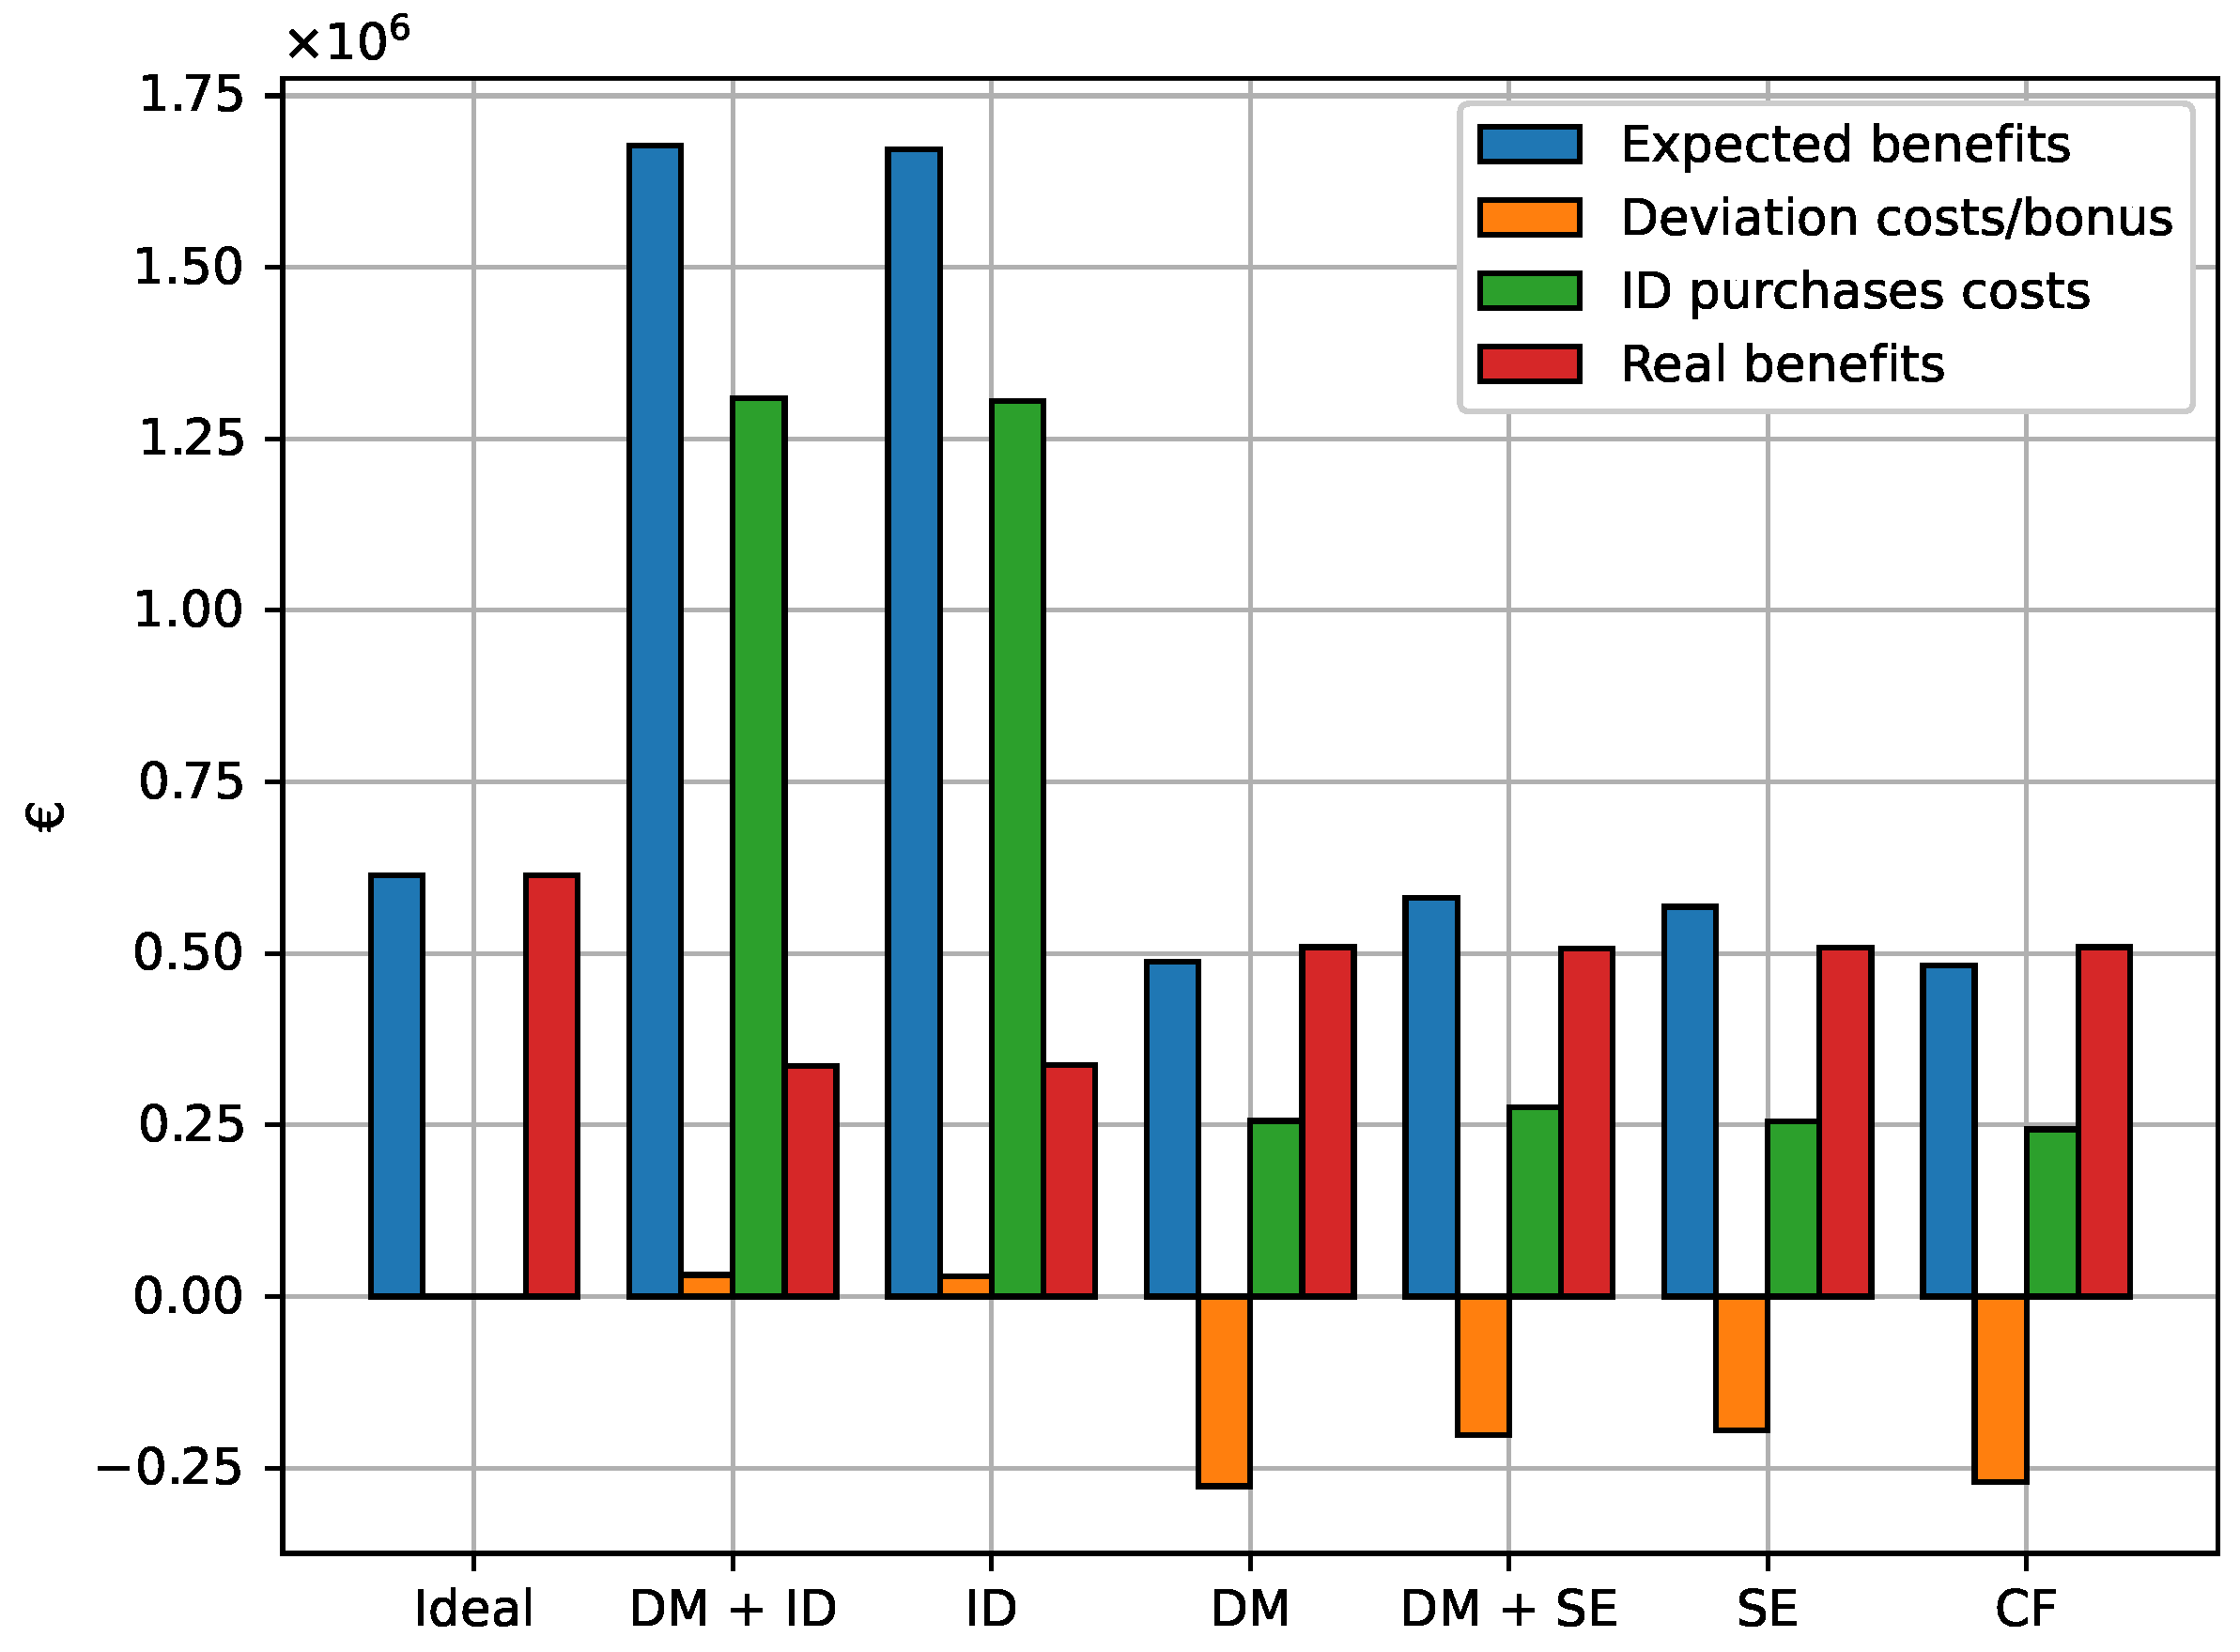
Figure 8 displays the accumulated profits and costs for each scenario, and
Table 3 shows the numerical results.
The results indicate that expected profits increase with intraday market arbitrage, as anticipated. These profits are calculated based on the delivery of all committed energy to the market, resulting in higher profits in scenarios with intraday market participation as all expected energy excess can be sold. The worst expected outcomes occur in scenarios without intraday market participation, and similar results are observed when the BESS performs capacity firming.
The deviation costs are negative in almost all scenarios, indicating when upward deviations are more frequent. Purchasing energy in the intraday market effectively avoids downward deviations. The fewer services the BESS provides, the greater the negative deviation costs, suggesting that the BESS tends to be fully charged most of the time, leading to upward deviations.
Purchases in the intraday market are the primary cause of profitability losses. These costs are significantly higher with intraday market participation. The fact that intraday market purchases occur when the BESS cannot cover expected deviations highlights that increased BESS involvement in markets can have negative effects.
Committing more energy to various markets increases the risk of having to make corrections by purchasing energy in the intraday market. The best results seem to be achieved by letting the BESS operate solely in the day-ahead market or providing capacity firming services. As shown in
Figure 9, intraday market participation has resulted in the need to cover up to 40% of committed energy through intraday market purchases.
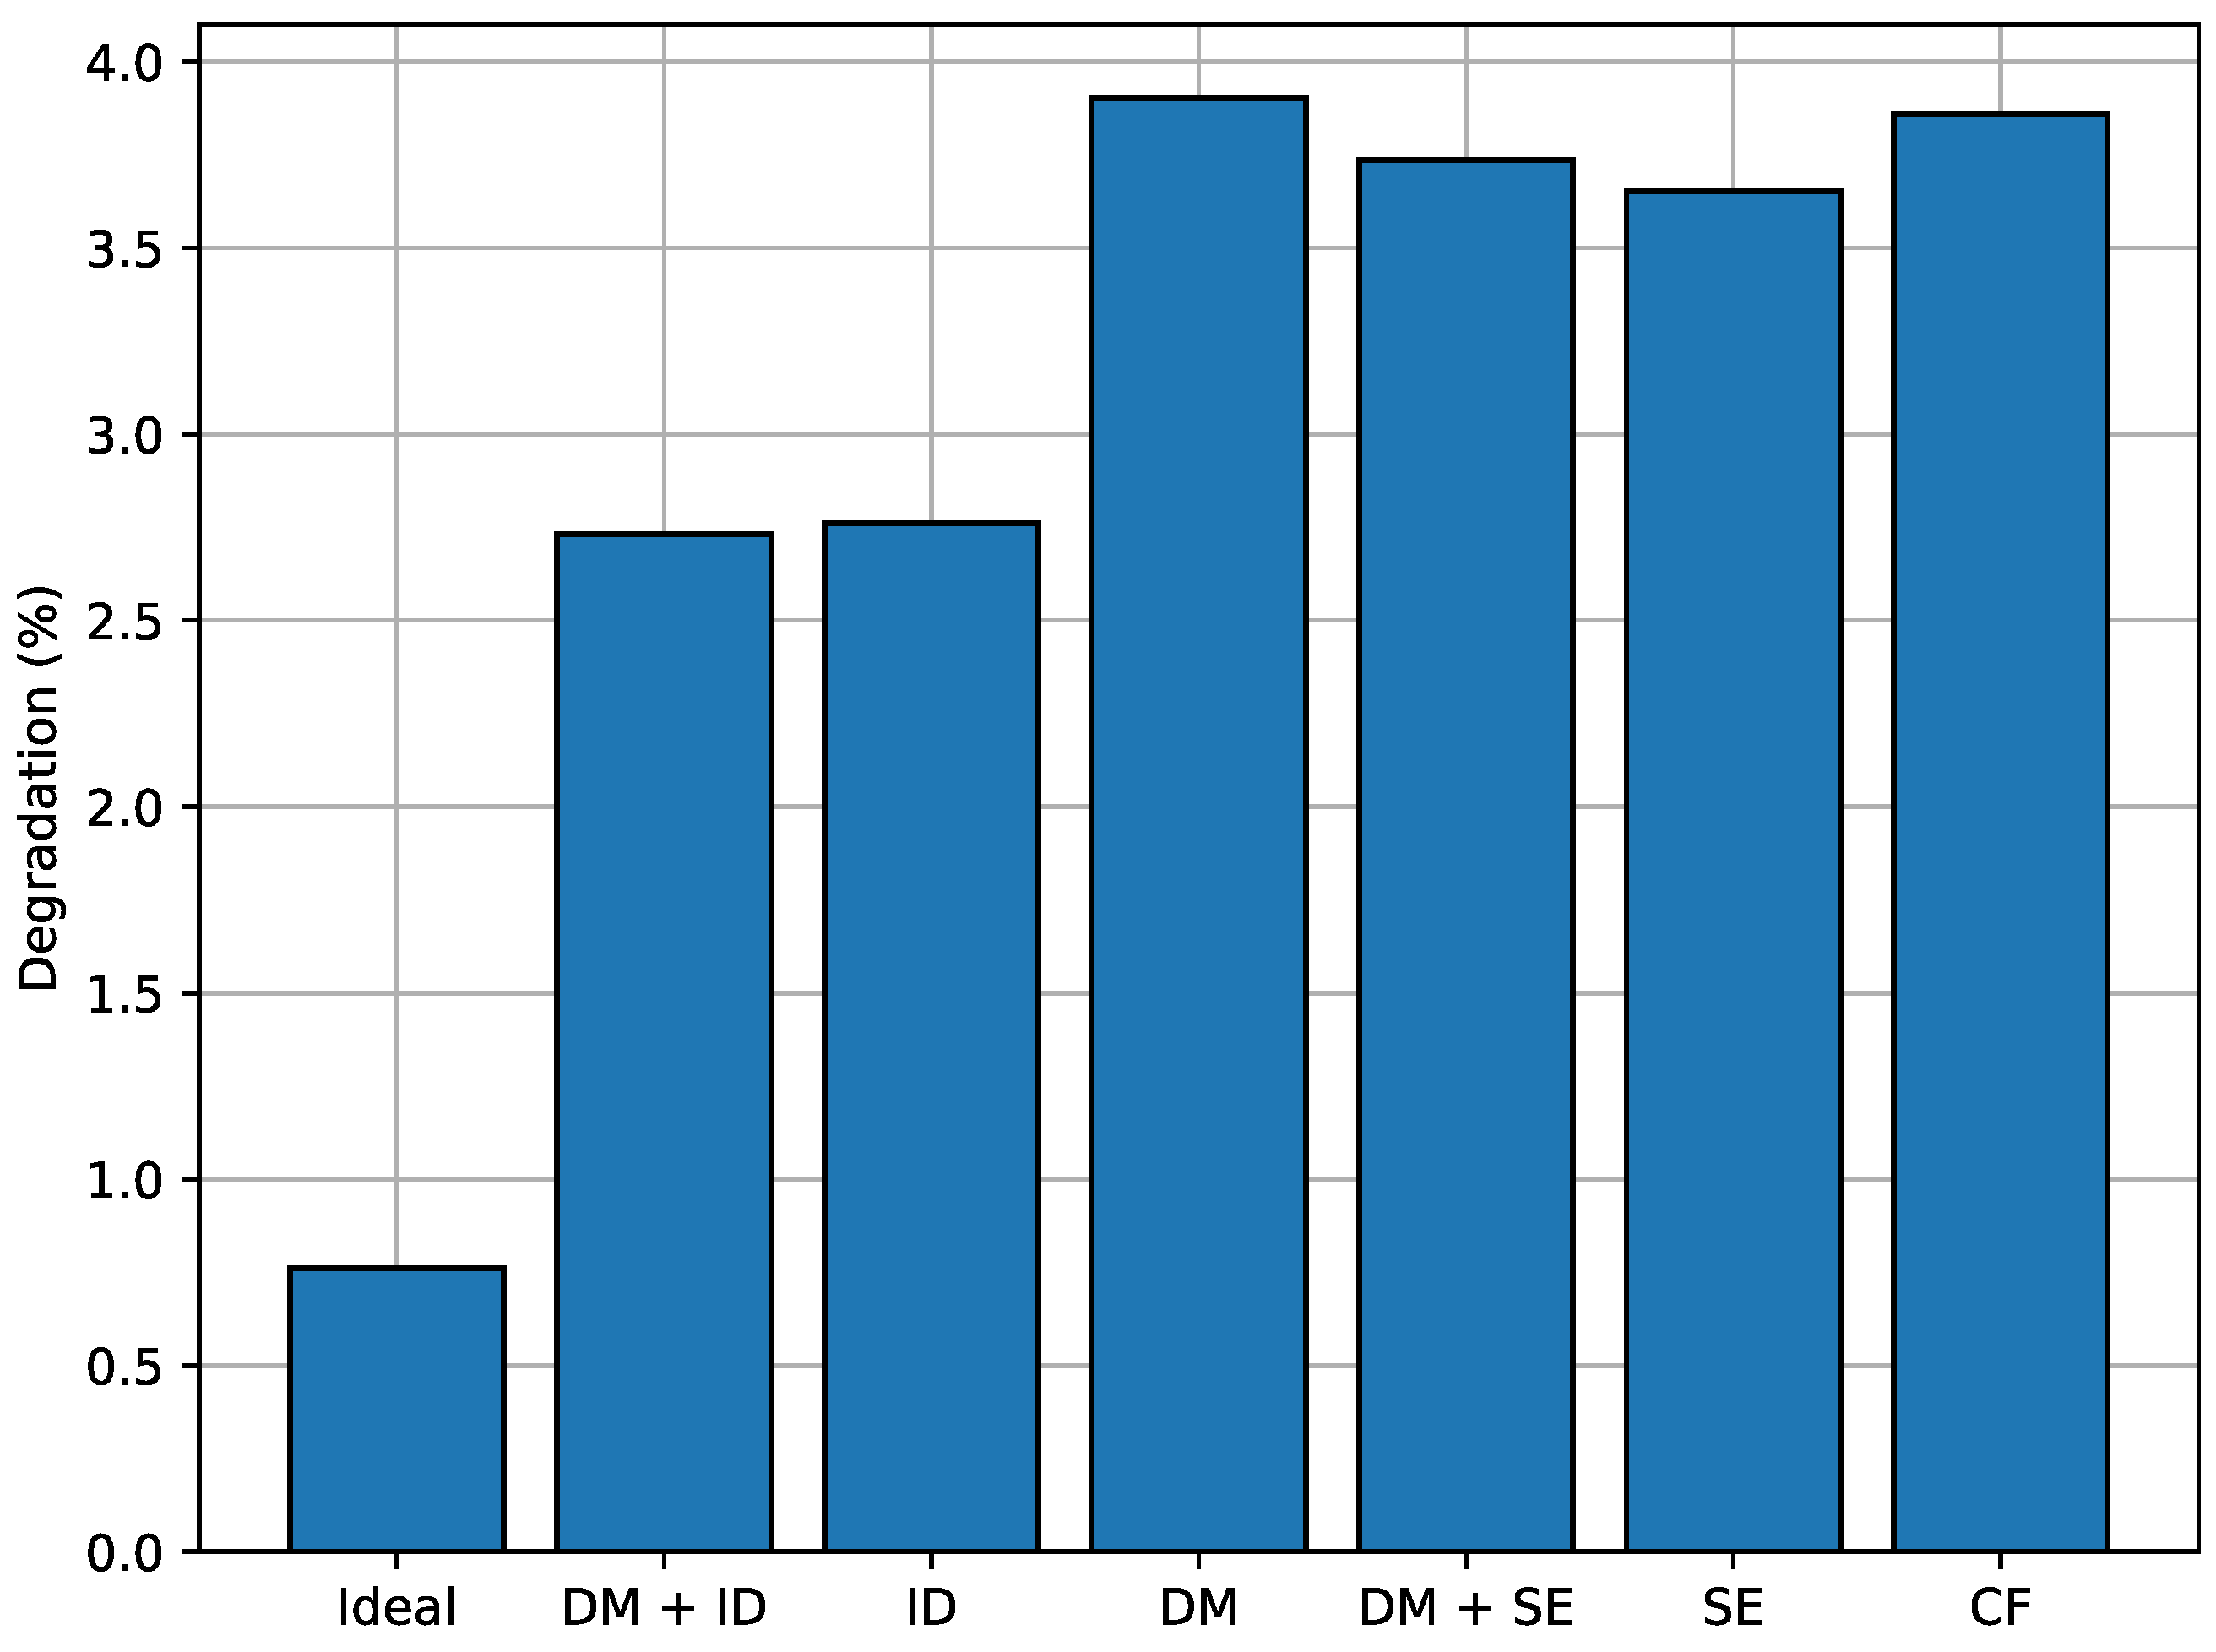
Figure 10 displays the accumulated degradation. In scenarios where the BESS provides the most services, it tends to be emptier, which reduces calendar degradation and results in lower overall aging of the BESS.
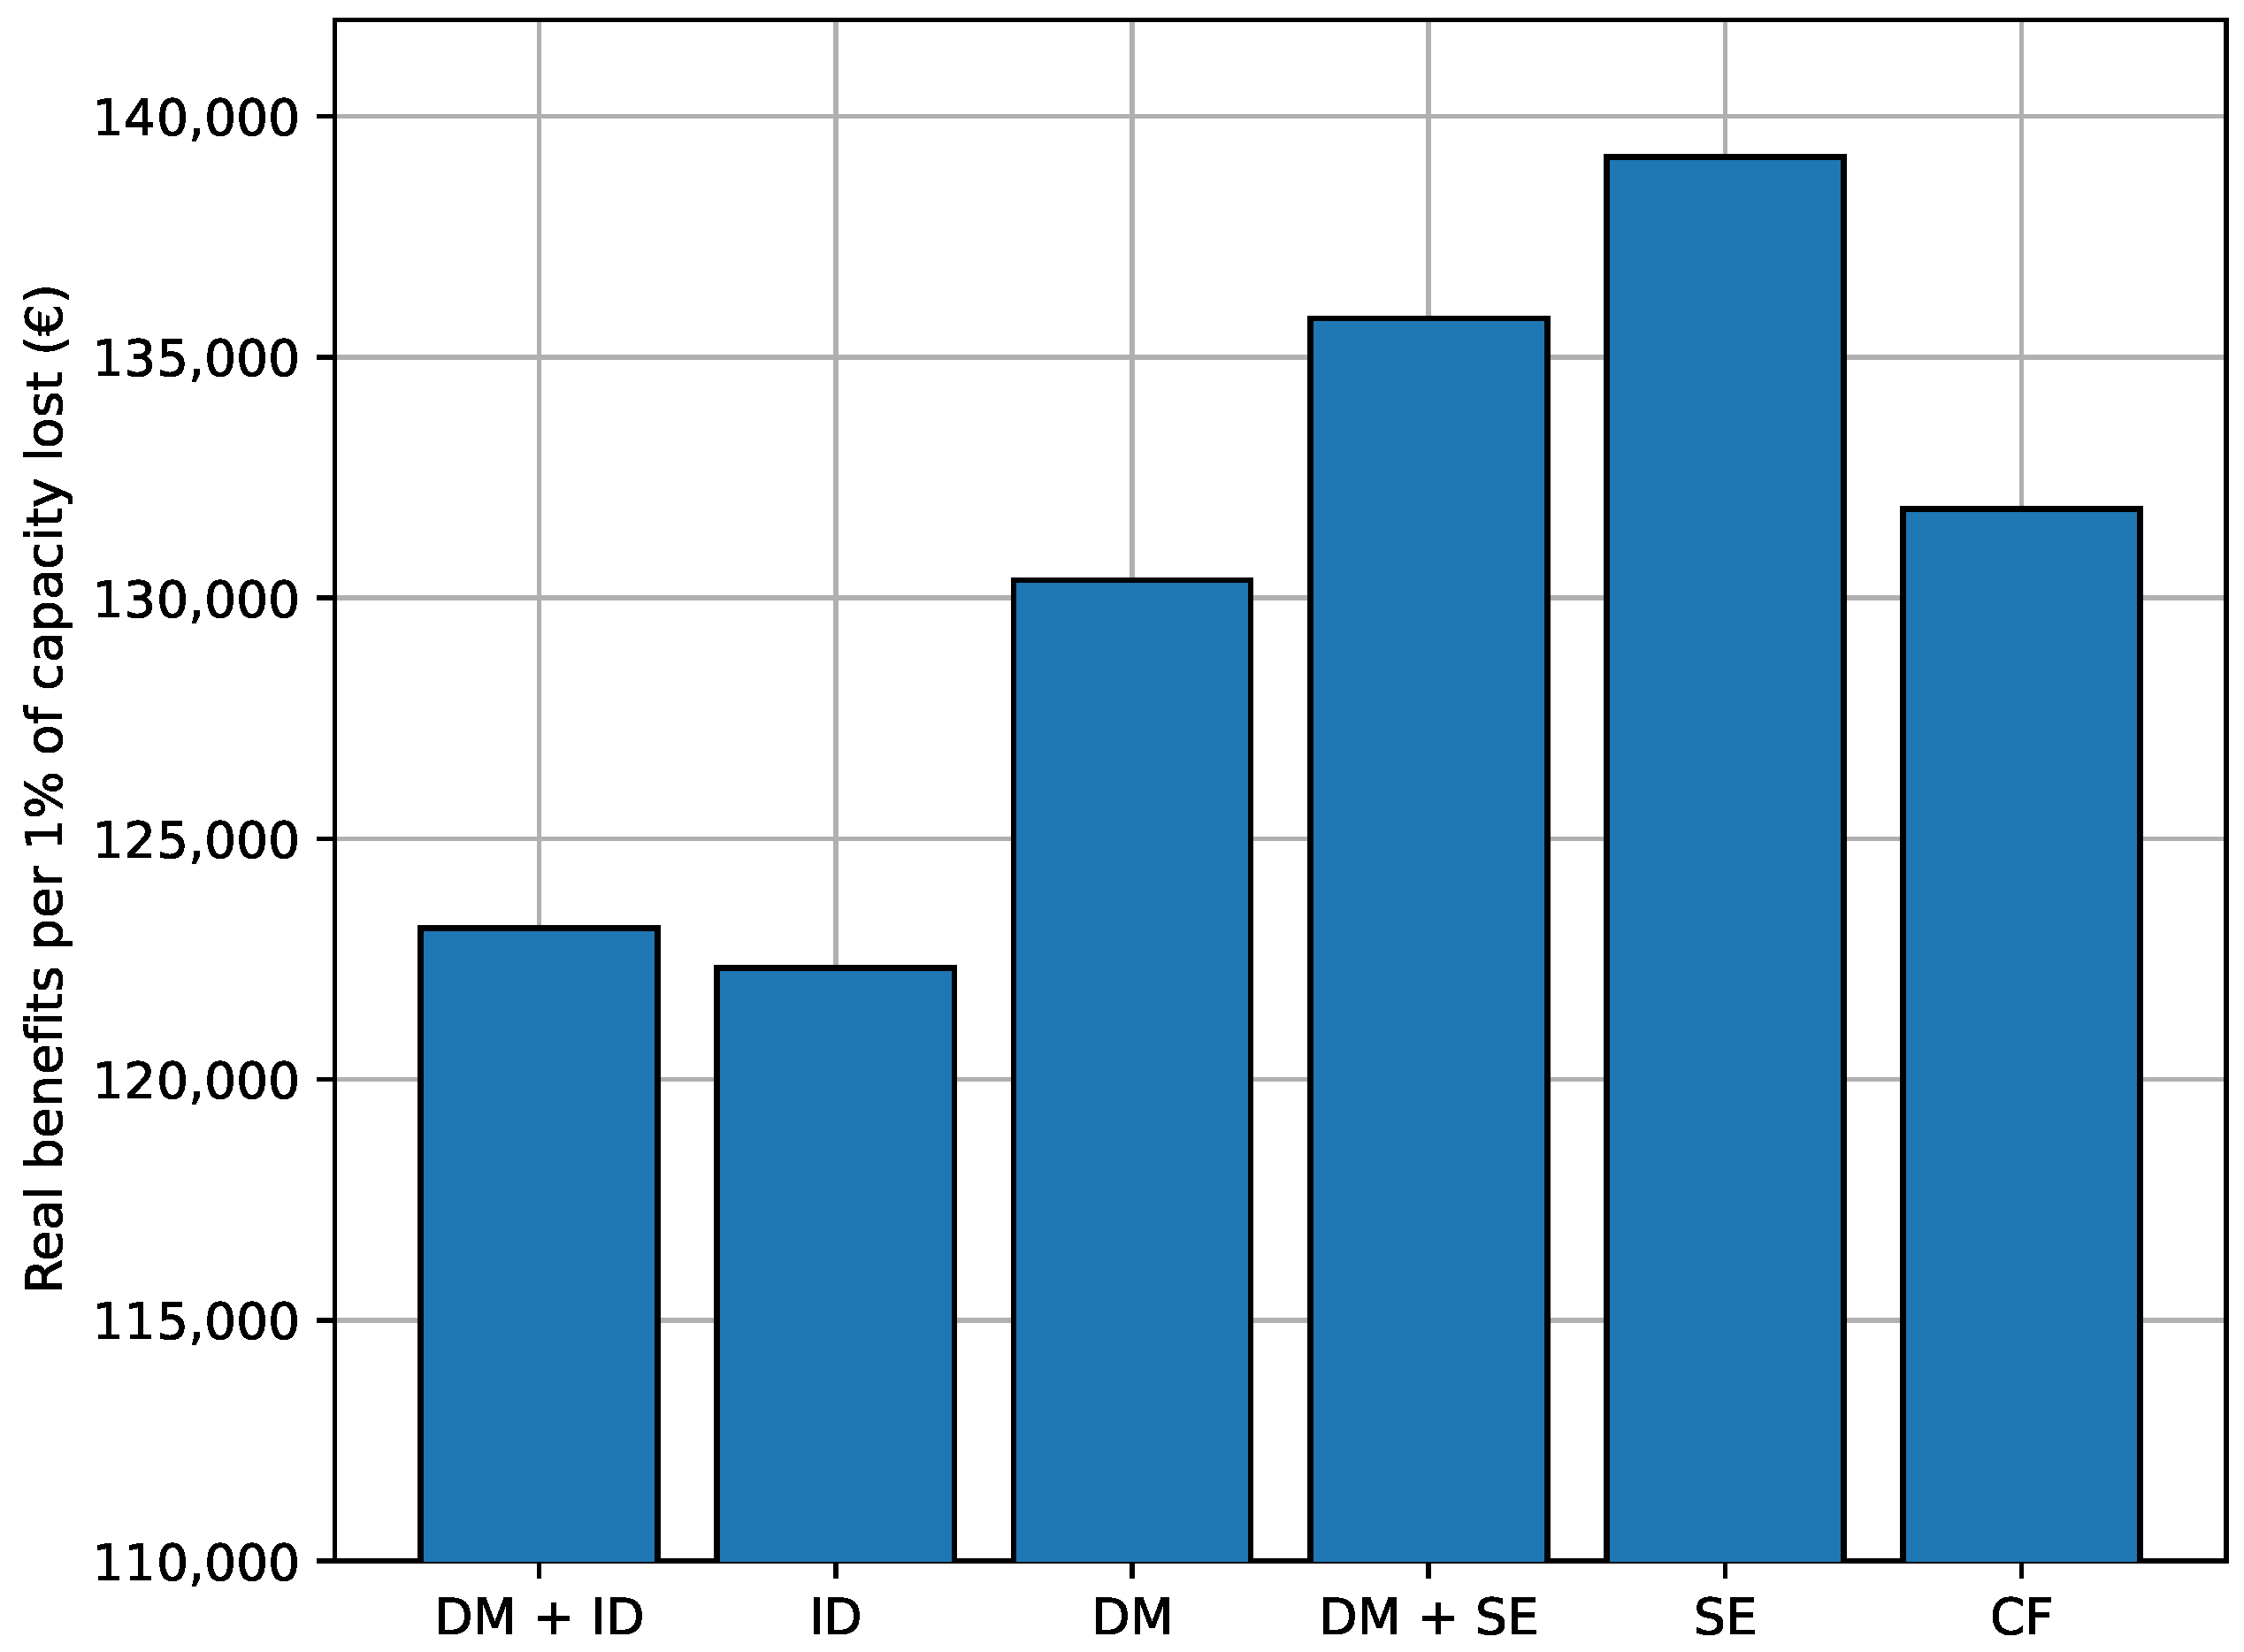
Figure 11 shows the comparison between real profits and degradation. It reveals that reserving the BESS for SOC emptying and capacity firming yields the best outcome when profits are compared to capacity loss, which indicates a more efficient usage of the BESS.
5.3. Full Project Extrapolation Results
The trade-off between maximizing short-term profits and stretching the life of the energy storage system is a crucial factor to consider. The NPV is a useful metric that takes into account future cash flows and discount rates to determine a project’s overall profitability.
In the table, the NPV of each case is calculated, discounting the daily cash flow and the purchase cost of the BESS. The results show that the best NPV is achieved when the BESS is reserved for SE and capacity firming. When only participating in the day-ahead market, the NPV is not very different, but participating in the intraday market significantly lowers the NPV, indicating lower project profitability.
The results of each simulation scenario are extrapolated for the entire project life. The average daily cash flow is determined from the average daily results of 2018, and daily degradation is similarly calculated to estimate project completion. The project ends when the accumulated degradation of the BESS reaches 20%, a commonly used value in the relevant literature (e.g., [
22,
23]). The average values and estimated project lifetimes for each case are presented in
Table 4.
It is worth noting that the BESS is not operated in the ideal scenario. In this case, the BESS is only utilized for allocating generated energy when prices are the highest. However, due to the degradation costs and the BESS efficiency, this operation is not profitable.
The SE has lower daily profits but a higher NPV compared to the case with CF. The NPV of each project is calculated using a 7.5% discount rate and is presented in
Table 5. The results show that using the BESS for the SE service and capacity firming provides the highest NPV.
6. Conclusions
A three-level EMS for a HF to participate in the Iberian electricity market has been presented. The day-ahead and intraday market offering strategies are formulated as linear programming problems, with generation and price forecasts at the start of each market session as inputs. The model has incorporated adjustments based on Iberian market regulations to account for committed power correction impacts. It also includes a real-time degradation model of the BESS to assess capacity and power losses.
A simulation framework has been proposed to assess various BESS market participation strategies. The results indicate that participating in both day-ahead and intraday wholesale markets generates the highest expected profits, but actual profits are lower compared to other strategies. The proposed optimization algorithm and results of the study can be applied to any electrical system that operates with concurrent day-ahead and intraday spot markets, which is a common practice in many countries. This can be used as a guide for agents trying to optimize their plants.
The results show that using the BESS in all markets does not necessarily result in a higher income, challenging the common belief that utilizing the BESS in all markets leads to the best outcome. The proposed SE service enables participation in intraday markets without the drawback of market overlap, enhancing the BESS utilization efficiency and increasing the NPV of the project. Moreover, it highlights the crucial role of adjustment mechanisms on actual income and the importance of modeling them thoroughly. Lastly, it is worth remarking that the plant proposed in this work is considered a price-taker; the effect of a plant or a number of plants large enough to impact electricity market prices is proposed as a future work.


 ,
, 


