Article

A Techno-Economic Model for Benchmarking the Production Cost of Lithium-Ion Battery Cells

by
Sina Orangi
1,2,* and
Anders Hammer Strømman
1,2,*
1
Industrial Ecology Programme, Norwegian University of Science and Technology, 7491 Trondheim, Norway
2
Department of Energy and Process Engineering, Faculty of Engineering, Norwegian University of Science and Technology, 7491 Trondheim, Norway
*
Authors to whom correspondence should be addressed.
Batteries 2022, 8(8), 83; https://doi.org/10.3390/batteries8080083
Submission received: 9 July 2022 / Revised: 1 August 2022 / Accepted: 3 August 2022 / Published: 5 August 2022

Abstract

:
In response to the increasing expansion of the electric vehicles (EVs) market and demand, billions of dollars are invested into the battery industry to increase the number and production volume of battery cell manufacturing plants across the world, evident in Giga-battery factories. On the other side, despite the increase in the battery cell raw material prices, the total production cost of battery cells requires reaching a specific value to grow cost-competitive with internal combustion vehicles. Further, obtaining a high-quality battery at the end of the production line requires integrating numerous complex processes. Thus, developing a cost model that simultaneously includes the physical and chemical characteristics of battery cells, commodities prices, process parameters, and economic aspects of a battery production plant is essential in identifying the cost-intensive areas of battery production. Moreover, such a model is helpful in finding the minimum efficient scale for the battery production plant which complies with the emergence of Giga-battery plants. In this regard, a process-based cost model (PBCM) is developed to investigate the final cost for producing ten state-of-the-art battery cell chemistries on large scales in nine locations. For a case study plant of 5.3 GWh.year−1 that produces prismatic NMC111-G battery cells, location can alter the total cost of battery cell production by approximately 47 US$/kWh, which is dominated by the labor cost. This difference could decrease by approximately 31% at the minimum efficient scale of the battery production plant, which is 7.8 GWh.year−1 for the case study in this work. Finally, a comprehensive sensitivity analysis is conducted to investigate the final prices of battery cell chemistries due to the changes in commodities prices, economic factors of the plant, battery cell production parameters, and production volume. The outcomes of this work can support policy designers and battery industry leaders in managing production technology and location.

1. Introduction

While the transition from fossil fuels to the electrification of the transportation sector is pursued swiftly over the globe, an enormous increase has been forecasted in this sector in the coming decades. According to the sustainable development scenario, the global EVs stock will reach somewhere near 250 million in 2030, eight times more than today’s [1]. In line with this change, which is also supported by incentive schemes by policymakers [2], battery capacity demand in the transportation section is surging from 170 to greater than 1200 GWh from 2020 to 2030 to meet EVs market needs [3,4,5].
On the other hand, the majority of present transportation systems are based on internal combustion vehicles (ICVs) [6] due to the lower price compared with EVs, where the battery is the most expensive segment in a car rather than chassis, assembly, interior, powertrain, and exterior [7]. Considering EVs, a battery consists of one-third of an electric vehicles’ cost [7], but this value sometimes exceeds 40%, e.g., 2018 Tesla Model 3 [6]. To make EVs competitive with internal combustion vehicles, the cost-effective battery is seen as an essential [8].
Different mechanisms could yield a decline in the cost of batteries. Bettering cell chemistry, improving and optimizing manufacturing technologies, and expanding production volume play essential roles in battery cost reductions [9,10,11,12]. Through the development and application of a cost model, these parameters and variables could be analyzed to identify the most cost-intensive areas of batteries for further research and development (R&D) focus and reduction in cost. Numerous battery cost models have been developed for this purpose as an exciting subject for both academic and industry fields [13,14].
Classification of available battery cost models could be conducted from different viewpoints. From one perspective, bottom-up, top-down, and hybrid approaches could be applied to develop a cost model for battery cells and packs. In comparison, bottom-up cost models are more transparent and informative as they comprise battery cell characteristics and specified manufacturing processes with associated costs as input [15]. Moreover, highly elaborate outputs are derived from the developed models based on a bottom-up strategy. From another perspective, available cost models can be categorized as bottom-up, intuitive, analogical, and parametric. The bottom-up model represents more detailed results than the other three [4]. A detailed study embracing a holistic classification of battery cost models can be found in the work by Duffner et al. [14].
Considering the available state-of-the-art bottom-up cost models, Wentker et al. [6] presented a modifiable cost model to estimate cathode active material (CAM) costs for ten sorts of lithium-ion battery cell chemistries based on real-time prices of raw materials. Their work proceeds by using scaling-up factors to calculate the price of battery packs for given chemistries. Sakti et al. [16] presented a techno-economic analysis for lithium-ion NMC-G battery chemistry using a process-based cost model (PBCM), a pioneer bottom-up technique in cost modeling, to find cost-minimized battery cell design. Ciez et al. [17] applied a PBCM approach for cylindrical lithium-ion cells in which NCA-G, NMC-G, and LMO-G chemistries have been investigated. Duffner et al. [4] developed an in-depth PBCM for large-scale automation of cell manufacturing, where both NMC622-G and NMC811-G cell chemistries are investigated. In addition to assessing the impact of process and material parameters on cell manufacturing cost, their model considers Germany and Poland in location-related analyses for battery cell plants.
Among available relevant cost models, the most well-known and comprehensive bottom-up one is Battery Performance and Cost (BatPaC), developed by Argonne National Lab [18]. The model elaborates on the performance and cost of nine standard lithium-ion battery chemistries. Concerning its cost section, the BatPaC model embraces materials, overhead, and direct labor as variable costs and R&D, General, Sales, and Administration (GSA), and depreciation of buildings and machinery as fixed expenses. Both fixed and variable costs are estimated for a baseline plant where 100,000 EV battery packs are produced annually. Then, these estimates are exponentially scaled to another volume of production [16,18]. Despite being a versatile and comprehensive model, the time value of money in building and machinery investment is not included in this model [16]. Moreover, energy is assumed as a fixed percentage (3%) of total material and labor cost [17], while, in reality, energy varies in the capacity of the plant, cell chemistry, and cell size; consequently, there is a limitation in investigating the model for other places than the defined one due to unit price differential of energy based on location [19]. In addition, while the BatPaC model is adjustable for different prices of cathode active materials (CAM), the model is not modifiable to changes in commodity prices, e.g., cobalt, nickel, manganese, and lithium. Moreover, the BatPaC model subsumes indirect labor under overhead costs. In contrast, indirect labor is defined separately in this work and considers technicians as in the labor layer of the cost model.
Therefore, we develop a battery cell cost model by deploying the PBCM technique. The current cost model is based on a modified battery cell production model already developed by Jinasena et al. [20] to estimate energy and material flow in a large-scale battery cell plant. Section 2 provides a brief explanation of the production model, proceeding with a detailed study of the design and calculation of the cost model. In Section 3, a case study for different countries is presented and analyzed, and the main cost-driver areas of batteries are discussed in detail. Section 3 proceeds to compare the results with recently available cost models. Moreover, a study into the cost-efficient size of a plant is discussed. In Section 4, first, the results of the model for ten battery chemistries are presented. Then, a comprehensive sensitivity analysis is conducted to investigate the effect of process parameters, commodity prices, and economic aspects of the plant on each battery cell chemistry.

2. Methodology

From a PBCM perspective, the chemical and physical characteristics of a battery cell can be transformed into an operational model by which required energy and material, number and size of machinery, land footprint, and labor for applied units in the plant are extracted to meet the desired production requirement. Adding the unit price of deployed resources and a set of economic factors leads to a cell’s manufacturing cost breakdown [4]. In other words, process-based cost modeling simultaneously embraces cell characteristics, operating conditions, and prices of resources. Such a model can deploy economics of scale to study the minimum effect scale for a battery manufacturing plant in the direction of a cost-effective battery cell. Moreover, the obtained results highlight a set of processes, economics, and technical and technological parameters having more impact on the total cost of the cell. In this study, a generalized and flexible bottom-up cost model is based on a cell production process model, which has already been developed by Jinasena et al. [20] on an industrial scale. A graphical model architecture is depicted in Figure 1 to clarify the structure of the current study as well as inputs and outputs.
First, applied units and relevant technologies in the battery process model are briefly introduced, and then the development and calculation of constituent layers for the cost model are discussed in detail.

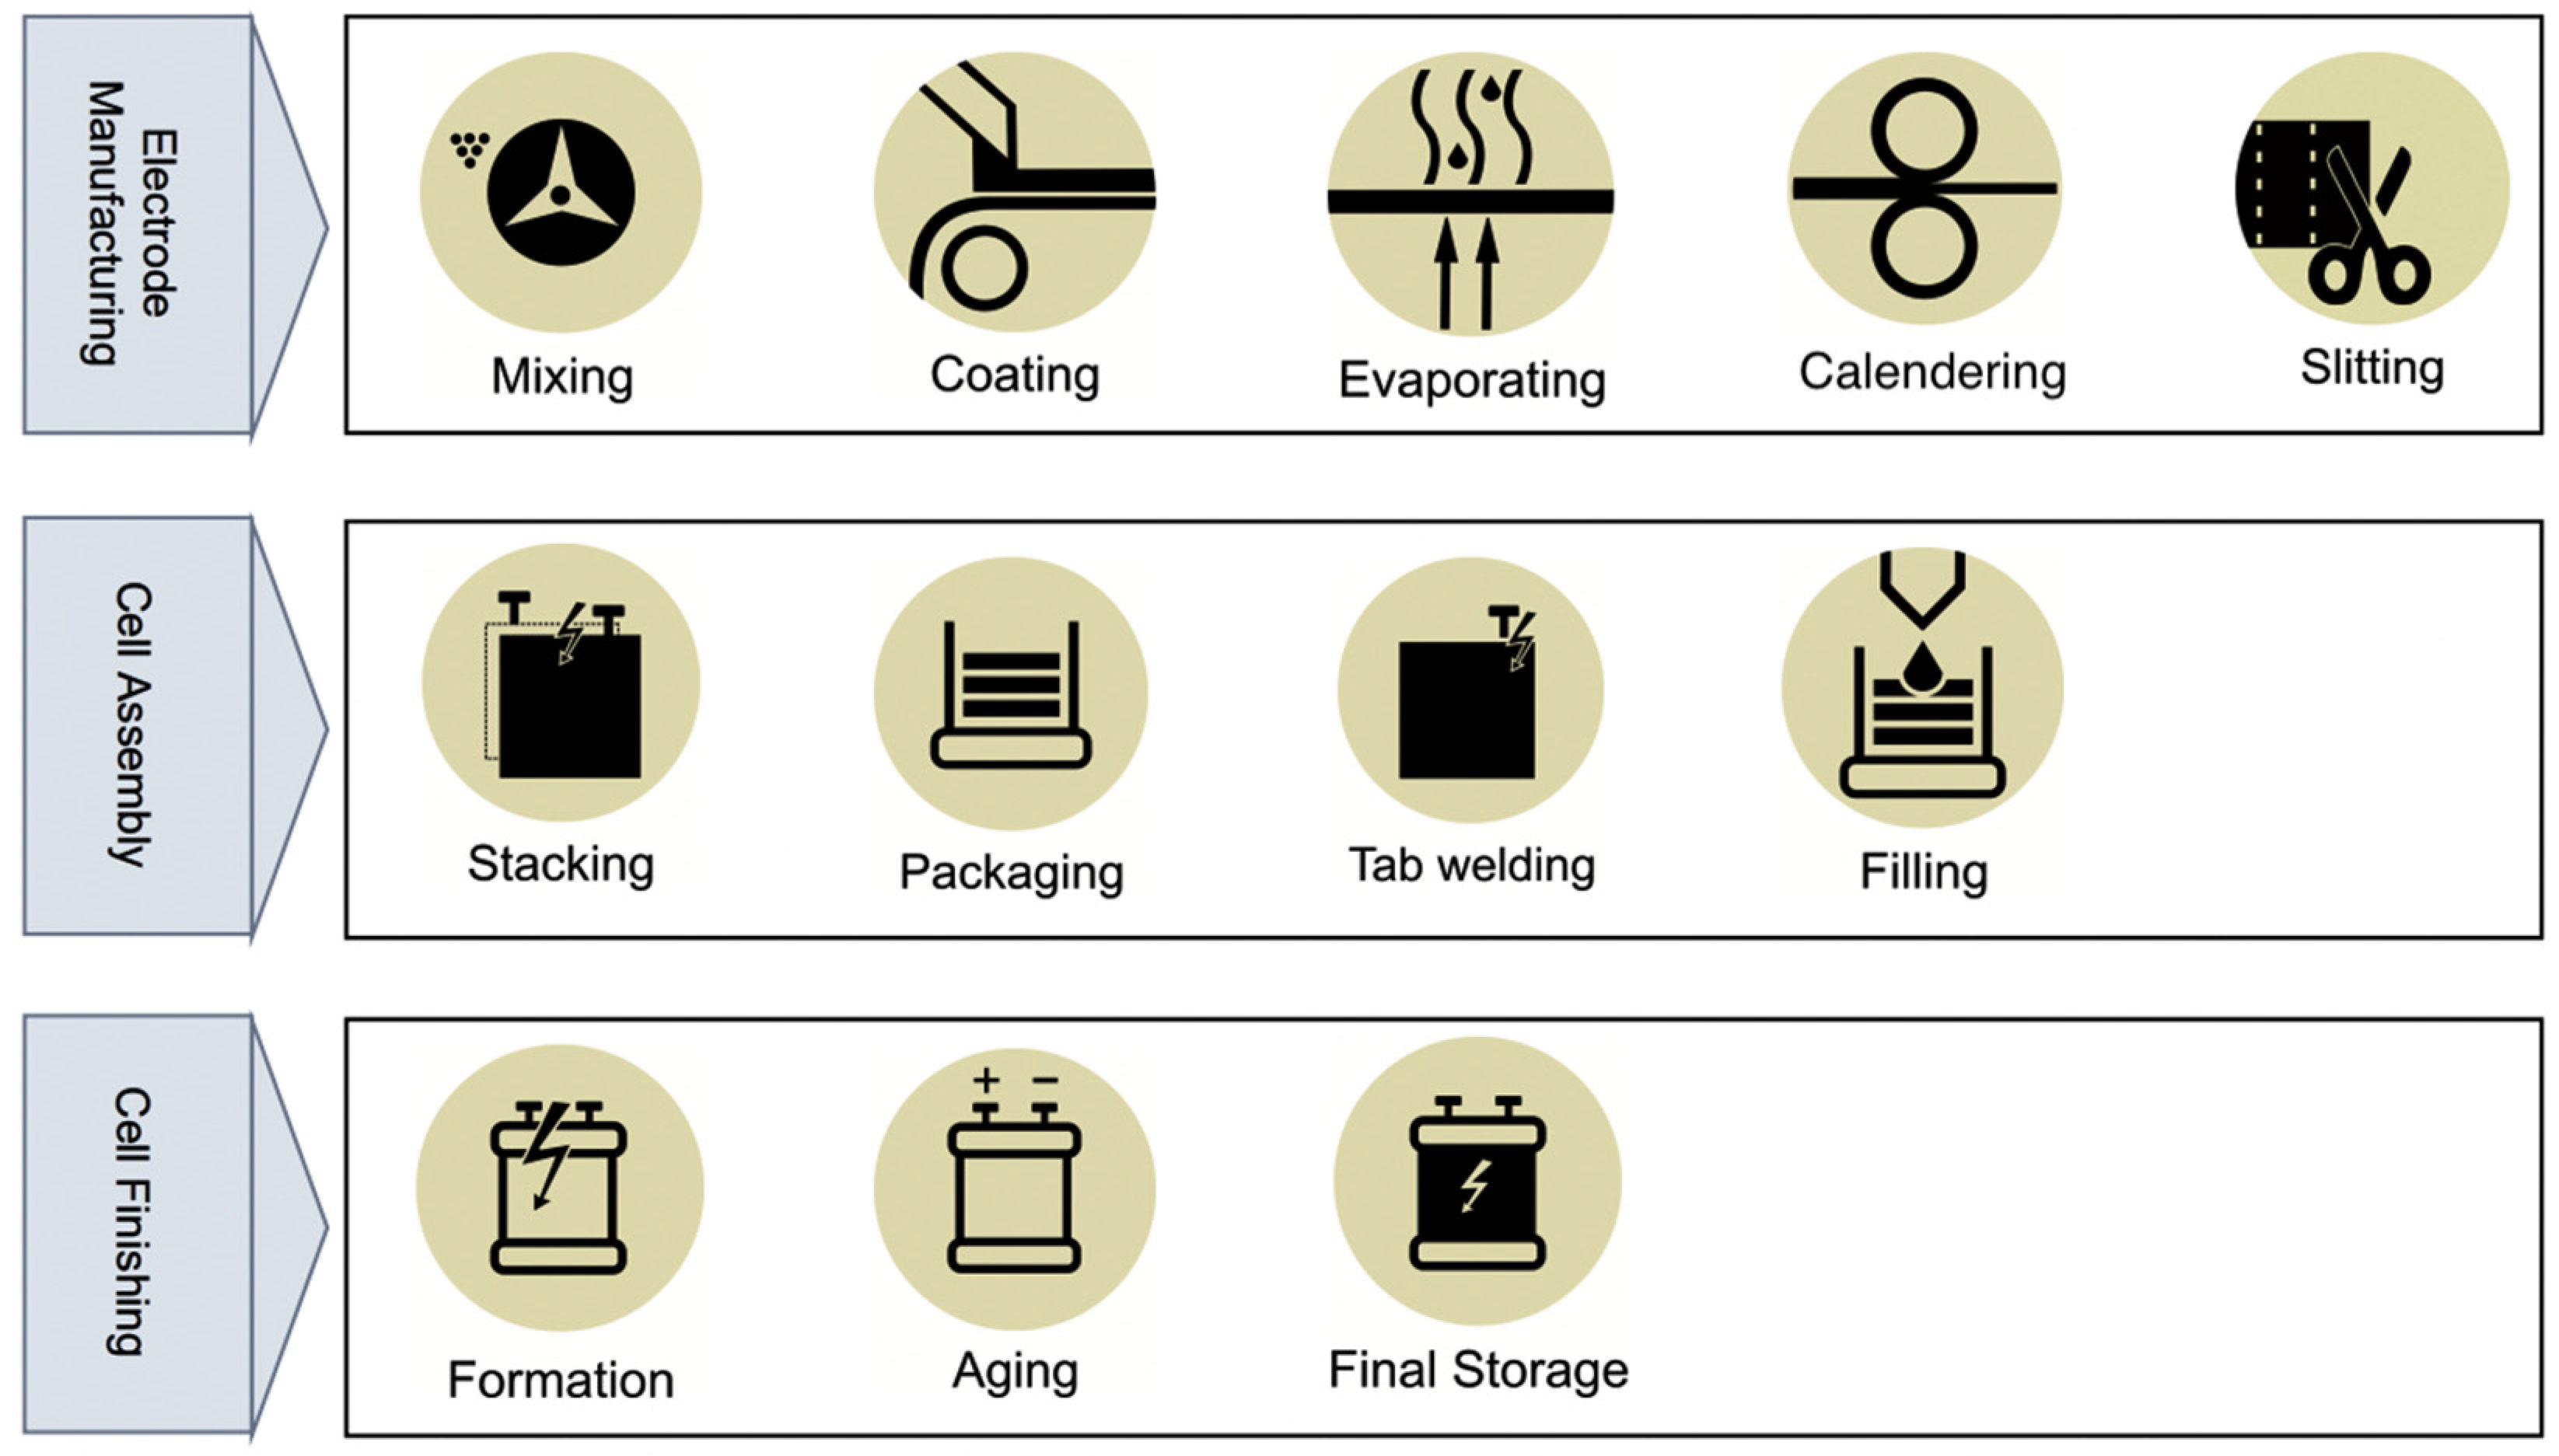
2.1. Battery Process Model

The manufacturing of lithium-ion battery cells is a highly complex process chain requiring the inclusion of different consecutive and interconnected units. A slight variation in one parameter might have an immense impact on the functionality of other units and, consequently, on the performance and cost of the process chain output [21]. In general, the production chain of a battery cell is repeatedly divided into three principal categories: electrode manufacturing, cell assembly, and cell finishing. Every single category consists of individual units. A schematic diagram of the battery cell process chain, which illustrates constituent units in each category, is represented in Figure 2.
Electrode manufacturing of battery cells begins with a mixing unit, where active materials, conductive nano microscopic carbon black [22], electrochemical inert binder [23], and conductive additives, e.g., carbon, are carefully mixed as powders (dry mixing) with a specific weight ratio between components to ensure the high electrochemical performance of the electrode, followed by adding solvent to form a homogenous slurry (wet mixing). Production scale [23] and quality requirements [20] lead battery cell producers to select different mixer systems. Planetary, intensive high-speed, universal, and static mixers are suitable for industrial production scale. A detailed study of various sorts of mixing technologies can be found in the work of Bryntesen et al. [23]. An intensive mixer for both cathode and anode production lines of battery cell plants has been assumed in the process model of this work.
A well-mixed slurry of mixing units is pumped to be coated, with a fixed thickness [23], on Al or Cu foil as a cathode or anode, respectively. To meet low-cost battery cell requirements, an automated, continuous, and integrated slot-die coater has been selected among different systems of coater machines at the industrial scale of the production [22,23]. The coating unit is conventionally integrated into the drying and solvent recovery units [24]. Within a dryer unit, solvent from a wet-coated slurry layer on current collectors evaporates by the application of heat energy from hot air in a conventional convective drying unit [23], which is currently a predominant method for electrode drying. Supplementing infrared drying to the dryer mentioned above enhances the efficiency of the dryer unit [22], causing a reduction in battery cell manufacturing costs. The dryer unit in the battery process model of this work consists of convective air drying and infrared radiation. Further to the drying unit, the vacuum drying unit has been presupposed to be integrated into the dryer unit and the total solvent is entirely evaporated. The process model proceeds with calendering, where constant pressure is exerted using a set of top and bottom rollers [22] to decrease thickness and porosity of the electrodes [23], then ends up with a slitting unit, where rolling knives cut the prepared electrodes into the desired dimensions.
Within the winding unit of the process model, the separator is fed as an endless band between dried cathode and anode electrodes being wound around a winding mandrel [22]. Current collectors are welded, most commonly via ultrasonic technology [24], and then are inserted into a casing and sealed [20]. By the application of high-precision dosing needles, the filling is conducted where the cell is filled with electrolytes and then closed.
After connecting the cells to the contact pins in formation racks, the formation and aging begin with the charge and discharge of battery cells based on precisely predefined current and voltage profiles under a low rate [22,24]. The rate gradually increases to ensure the formation of a protective interface layer, called a solid electrolyte interphase (SEI), between electrolytes and the anode electrode. In search of measurements for quality assurance of cell characteristics and performance, the cells are stored on aging shelves and monitored for an extended time. This process might take up to several weeks based on the aging temperature [22]. The defective cells are regarded as rejected ones.

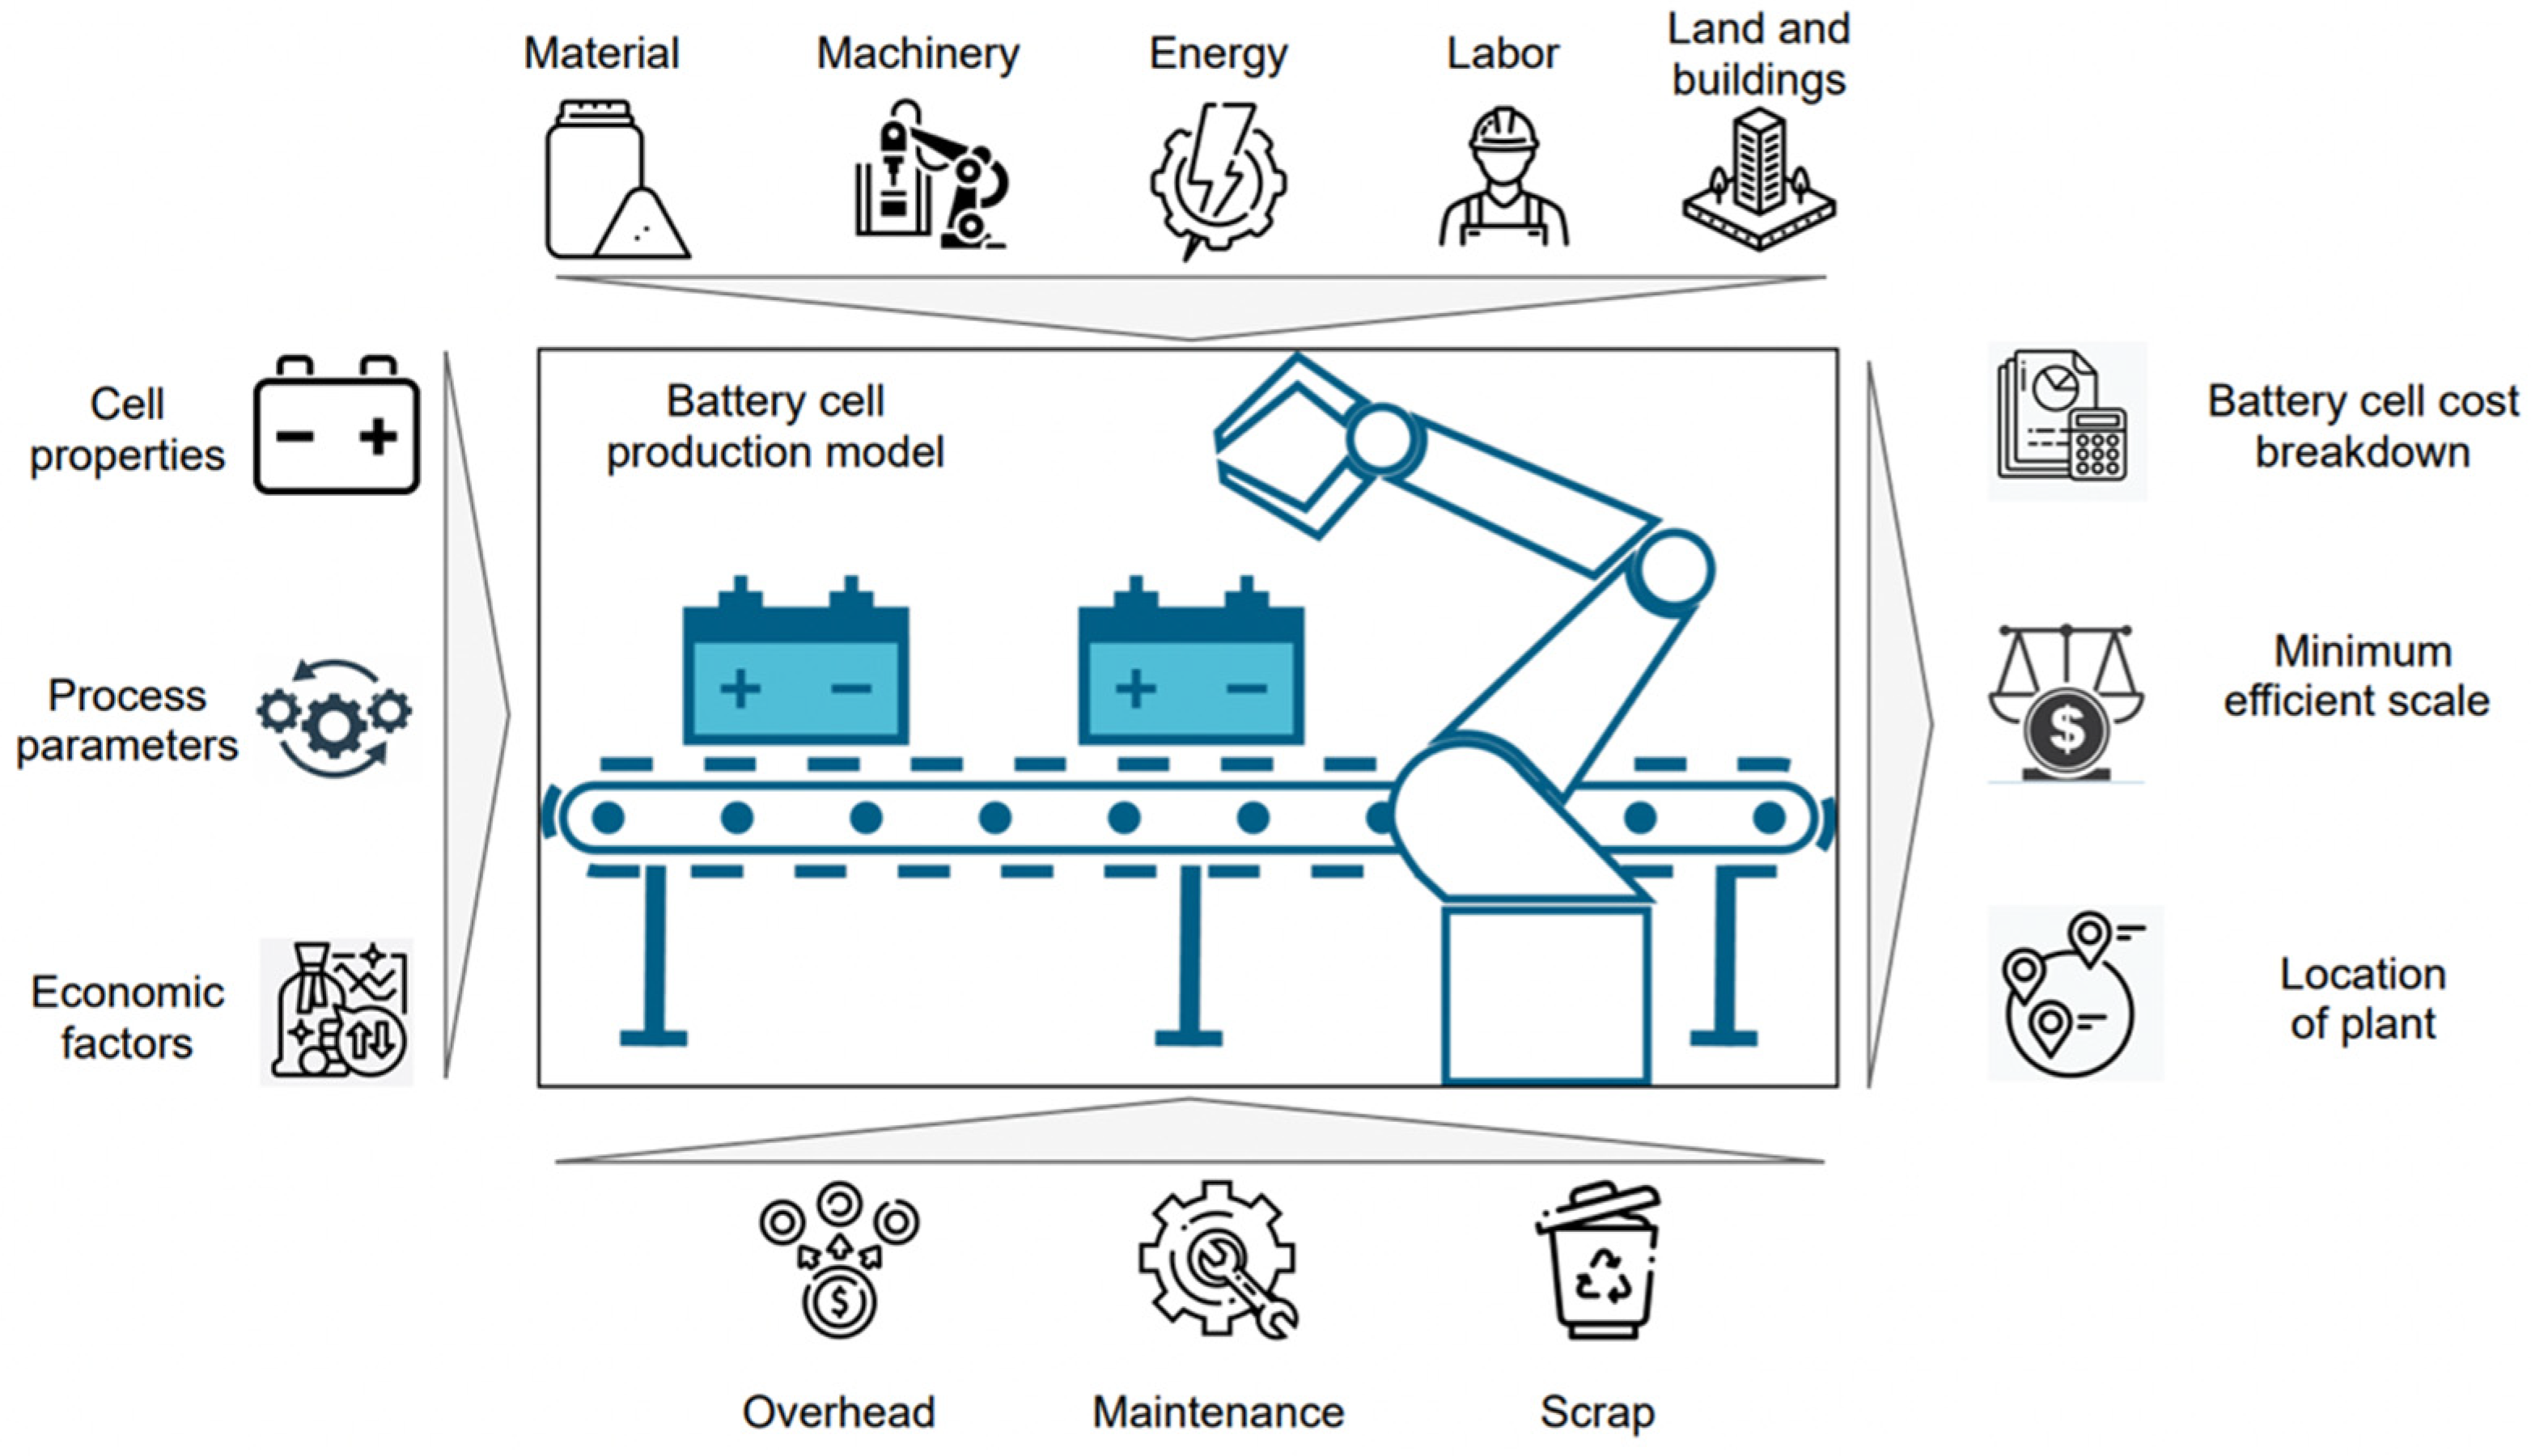
2.2. Structure of Developed Cost Model

A scalable and flexible bottom-up battery cell cost model is developed to combine seven interconnected layers: material and scrap, energy, machinery and installation, labor, building and land, maintenance, and overhead. The main objective of each layer is to calculate the share of that individual layer among the total cost of a battery cell. As mentioned earlier, such implemented strategy of cost modeling aids in identifying the most significant cost driver(s) behind the battery cell cost. Moreover, the scalability of the present cost model to a wide range of manufacturing capacities gives insight into cost-effective production scale with the deployment of the economics of scale. Moreover, the model’s flexibility could cover numerous cell sizes, battery chemistries, the manufacturing plant’s location, etc.

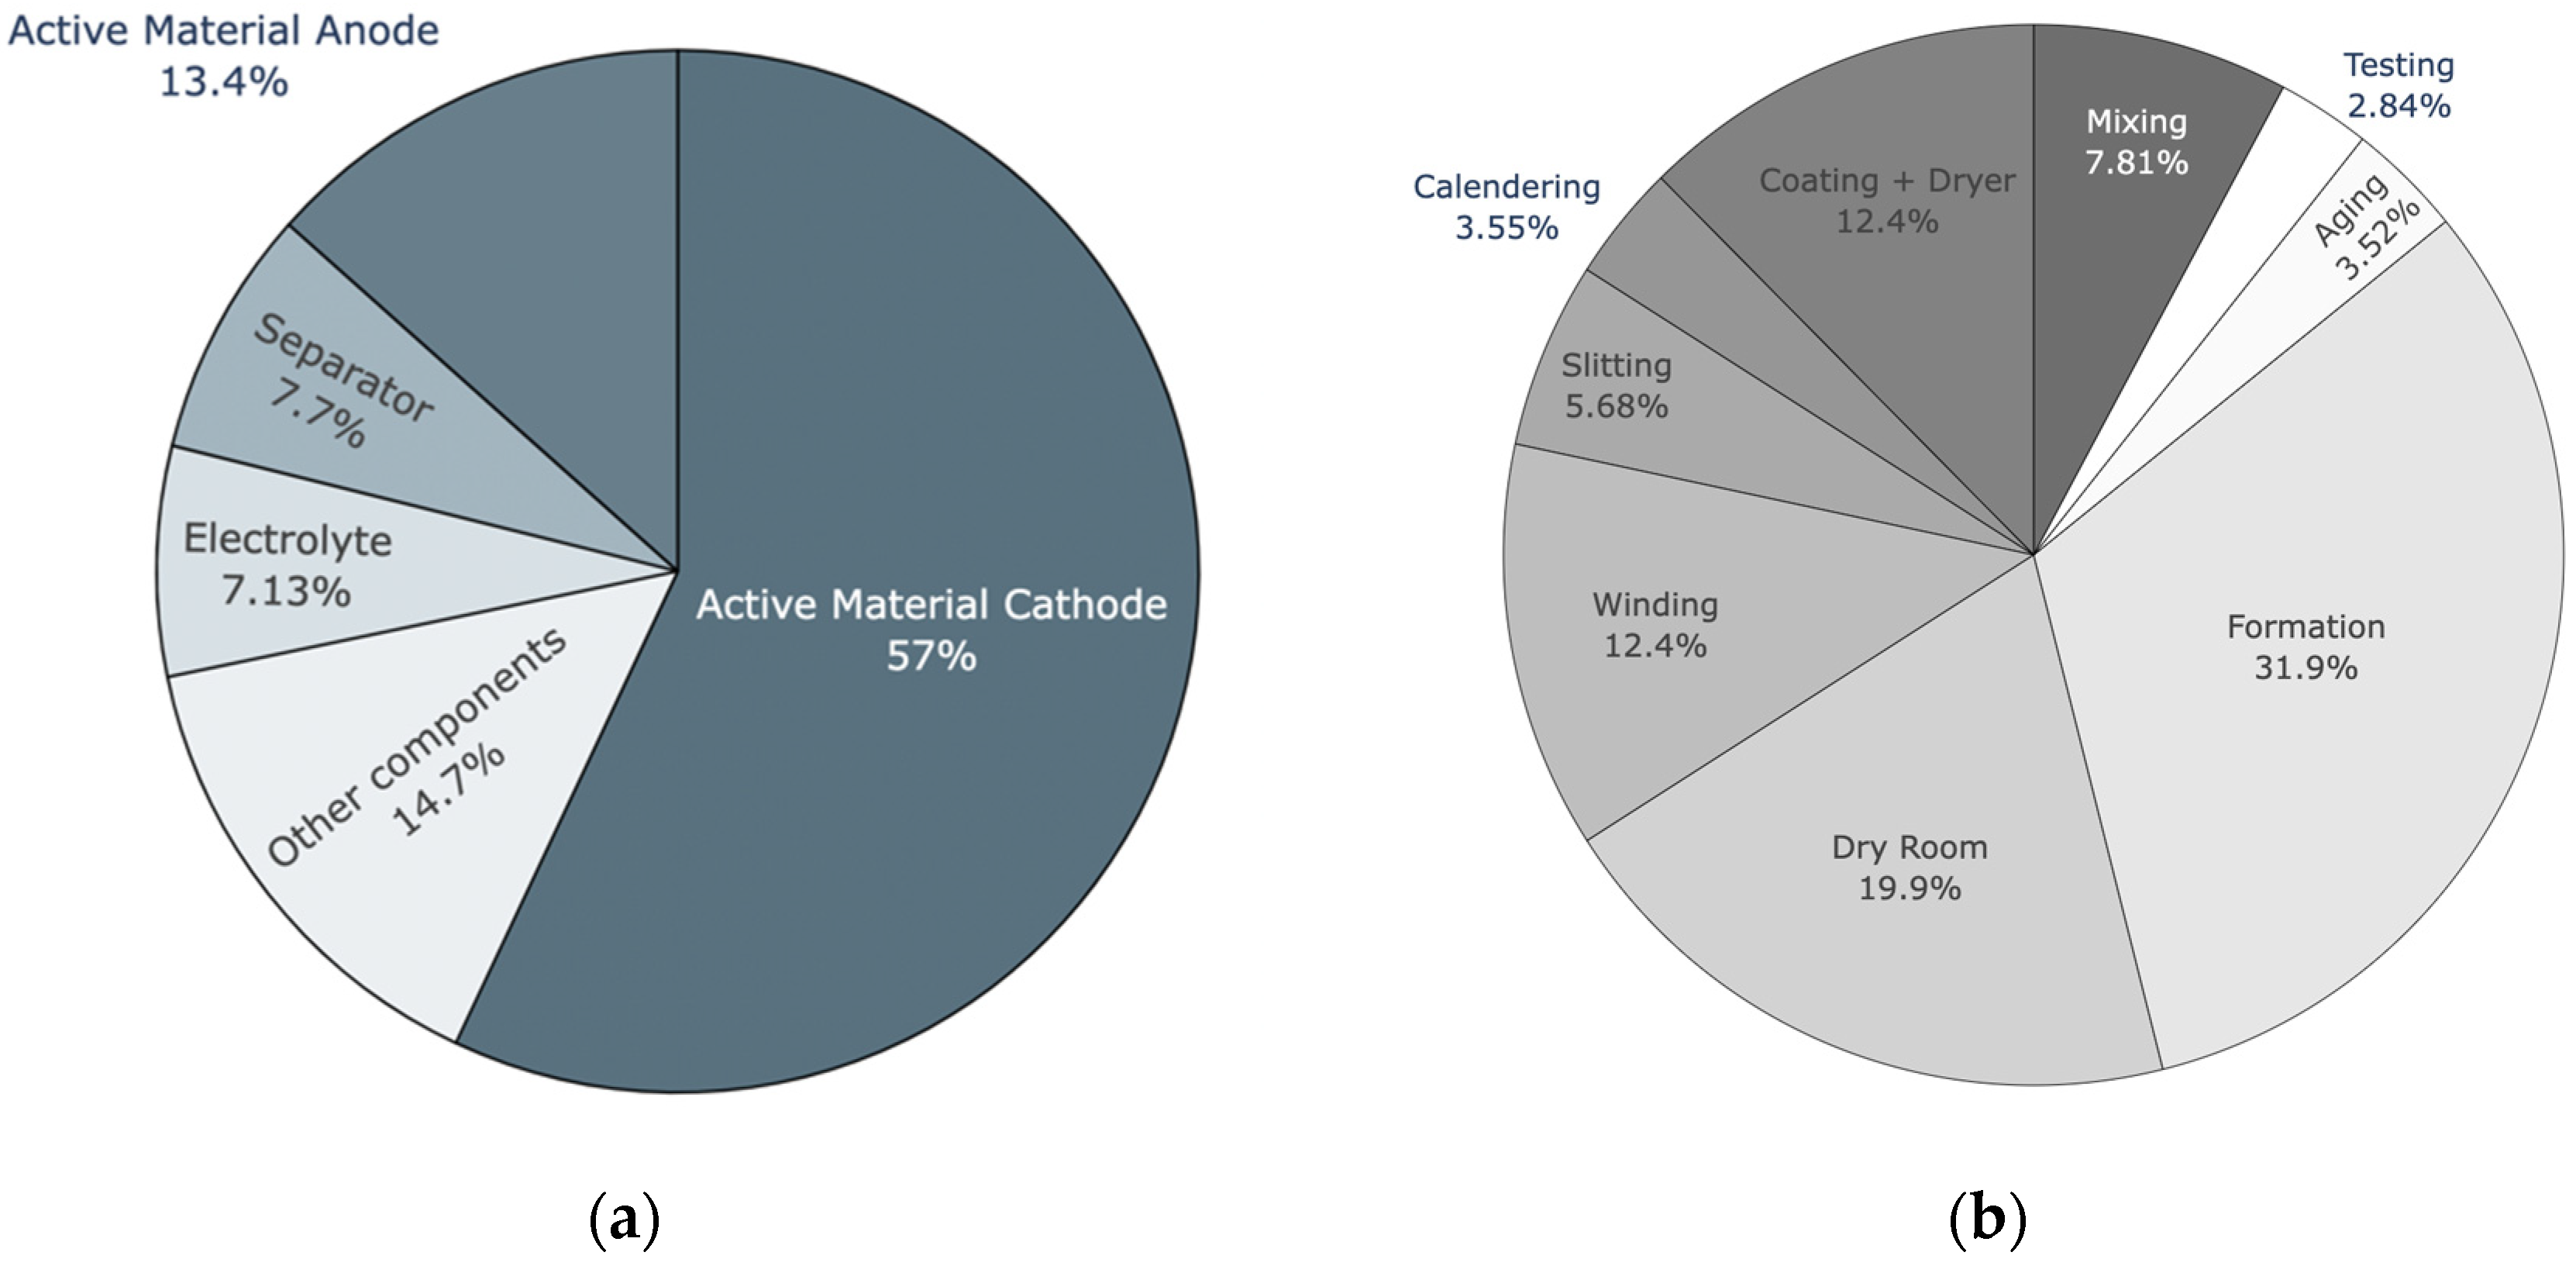
2.2.1. Material and Scrap

The unit price for materials in a cell, particularly cathode active materials (CAM), is non-constant and unique because numerous parameters affect their prices, especially changeable raw material prices and relevant manufacturing costs [6]. Therefore, an accurate battery cell cost model requires an updated price of the material. In this work, two assumptions are made for the unit price of the material. First, the existence of a high-volume market for all materials except cathode active material is assumed [18], resulting in the insensitivity of unit prices of these components to the volume of the battery production plant. Driven by this, the manufacturers prefer to purchase these products as ready-to-use [6,18]. These prices are formulated as I , J , K set indexes and the unit price for each of them is listed in Table S1. Secondly, it is assumed that the unit price of cathode active material has a sensitivity to the production volume [18], the relevant commodities prices, and the location of the plant. In search of this, the calculation for the unit price of CAMs is based on the extraction of metal content by the stoichiometric of CAM ( 𝓍 CAM g ), the average unit price of constituent raw material metals in the desired CAM ( P ¯ CAM g ), and the inclusion of relevant process factors for the conversion of required precursors to the desired CAMs ( 𝓅 CAM h ). In addition, parameter β is defined as a price factor to relate the calculated unit price of CAMs to the plant’s annual production volume ( θ ). Using such a strategy considerably benefits from the consideration of the sensitivity of CAM price to production volume instead of considering a fixed price for CAMs. Moreover, there is the possibility to improve the processes required to convert the precursors to CAMs in a battery cell. More importantly, investigation of changes in raw material prices into the unit price of CAMs can be investigated since the unit price of CAMs and, consequently, of battery cells, are highly linked to the volatility of raw material prices. In addition to the above, as the presented model aims to present the results of PBCM for different locations, a location-based process function ( Ω loc , prs ) is added to distinguish between the cost of needed resources, e.g., labor, energy, and land for the production of CAMs in different countries.
To acquire a precise estimation of material cost, averages of five years of metal prices, from 2017 to 2021, have been considered in this work [25], defined as the G set index in Table S1. Equation (1), presented below, is applied to estimate the unit price for CAMs in this work based on the method explained above. The relevant process factors, defined as the H set index, are extracted from supplementary materials of the work of Wentker et al. [6].
P CAM = [ ( Ω loc , prs × h = 1 H 𝓅 CAM h ) + ( g = 1 G   P ¯ CAM g × 𝓍 CAM g molar   mass   fraction   of   metals   in   CAM ) ] β × ln θ
Considering Ω loc , prs , this function is divided into two parts. The first part includes the cost factors which are highly dependent on the unit price of the needed resources in a specific location, including labor, utilities, and land. The second part includes those cost factors associated with the production process of CAMs, which is not highly dependent on the location, e.g., the equipment required in the production of CAMs. This part is assumed to be constant for all locations in this study. Thus, the Ω loc , prs is formulated as:
Ω loc , prs = ε × λ lab ¯ P lab , loc ¯ P lab , bsc + λ nrg P nrg , loc P nrg , bsc + λ bld P bld , loc P bld , bsc + 1 ε
where ε is an estimation for the changeable portion of the location-based process function in the production of CAMs and λ is the share of each cost factor. In addition, 1 ε covers the portion of constant cost factors to the location in this study. It should be noted that P ¯ lab indicates an average hourly wage for different classes of workers, P nrg is the unit price of utilities, and P bld is the unit price for land and building. In addition, both l o c and b s c indices show a specific location and the base country.
In general, a full battery cell consists of positive and negative electrode active materials, binder, solvent, conductive carbon, separator, electrolyte, current collector foils, positive and negative terminals, and cell container. Since the required parameters for the calculation of each component varies in the unit, elements of a battery cell are divided into three groups where the summation of defined groups forms the material cost of one produced battery cell. Moreover, material scrap is included by defining a constant percentage for each component in the cell to cover the material scrap costs, since the process chain of battery manufacturing is not perfect.

Mass-Related Components ( I Set)

Based on the chemistry and size of a battery cell, different mass and mass fractions of active materials, binder, conductive carbon, and solvent are mixed to form the total mass required for the cathode and anode slurry. In addition, an organic liquid electrolyte is injected into the produced cell in the filling process step. These components are defined as the I set index, where i indicates each element in the defined set in this work. Furthermore, generated scrap, within the manufacturing units in the plant for the components in a cell, is specified to each element of the I set as a scarp percentage rate ( S i ). Thus, the material and scrap cost of mass-related components ( C msp I ) in a battery cell is estimated as:
C msp I = i = 1 I P mat i × m mat i × 1 + S i
where m mat i is the mass of i components in a cell and P mat i indicates the unit price for i elements. It should be noted that the price of CAMs is calculated based on Equations (1) and (2).

Area-Related Components ( J Set)

In this work, separator and positive and negative current collector components ( j elements) are assumed as area-related components of the J set. Thus, estimation of cost for the area-related components is performed based on unit price ( P mat j ) and the required area of element j in a battery cell. The area of these elements is calculated based on the width ( w j ), length ( l j ), and the number of bi-cell layers ( N bcl j ) of area-based components of a battery cell. In addition, the generated scrap for the elements in the defined set is presumed as S j . Thus, the area-related components cost ( C msp J ) is estimated as
C msp J = j = 1 J P mat j × N bcl j × w j × l j × 1 + S j

Item-Related Components ( K Set)

For the simplicity of modeling in the project at hand, negative and positive terminals and cell container are assumed as item-related components since the mass and size differentials of these elements do not considerably impose changes on the final price of a battery cell. Thus, by assuming a fixed price for the mentioned elements ( P mat k ) with the simultaneous consideration of scrap percentage rate ( S k ), the cost of item-related components ( C msp K ) is estimated as
C msp K = k = 1 K P mat k × N k × 1 + S k
While the summation of Equations (3)–(5) results in total material and scrap cost of used components in a battery cell, a cell rejection percentage rate ( R ) needs to be defined for the inclusion of those battery cells that are rejected at the end of production line, since the yield in the testing process step is not 100% [26]. It is worthy to note that the scrap includes materials which are wasted within the battery production process steps, from mixing to formation, and the rejection includes those battery cells that could not meet the specified test requirements in the testing process step. Driven by this, the total material and scrap cost for the produced battery cell is estimated as
C msp = C msp I + C msp J + C msp K 1 R

2.2.2. Energy

In general, energy cost in available cost models is assumed as a constant percentage of other layers. For instance, a constant 3% of the material and labor costs are estimated as the energy cost in some publications [17,18]. In the present study, the energy cost for each unit is separately calculated since the current work is based on a modified version of the work of Jinasena et al. [20], where energy and material flow for large-scale battery production plants have already been modeled. Hence, the total electrical energy cost in the plant ( C nrg ) is calculated based on the needed energy of each unit of the plant to produce one cell ( E u ) and the unit price for energy ( P nrg ). U is presupposed as a set index that includes all process steps of battery manufacturing presented in Figure 2 and u indicates each process step.
C nrg = u = 1 U E u × P nrg   U = u u = mixing   :   sorting

2.2.3. Machinery and Installation

High levels of accuracy and consistency in the battery production plant are achieved with well-integrated machinery [27]. The number of required machines or production lines for an individual unit in battery cell production directly results from the processing rate, cycle time, and the annual throughput of the plant.
By the application of a flow scale factor ( ζ flw ), Equation (8), the base case model in the work by Jinasena et al. [20] can be scaled up and/or down. The logic behind this is the required mass of slurry to product cells in a certain time slot varies in capacity, battery chemistry, and size; consequently, the size of mixers required for both cathode and anode units varies. Aforesaid logic is interpreted as Equation (8) where M θ estimates the required size of the mixer to convey adequate slurry to the production line(s) to meet the annual production volume requirement of the plant and M ˜ θ meets the same requirement for the base case study.
ζ flw = M θ M ˜ θ
In this work, it is assumed that the production lines are dedicated, meaning producing only the considered battery cell [28]. Thus, rounding up the flow scale factor calculates the number of production lines required ( N mch u ) for each unit in the plant (except mixing and dry room units) compared to the base case study. The scaling up/down will be conducted differently for the mixing and dry room, explained in the following equation ( sign indicates the ceiling function used to round up.):
N mch u = ζ flw   ,   U mix , drr
The machinery and installation cost for the mixing and the dry room is calculated in a different way to other process steps. Considering the dry room, the required size of drying room ( V drr ) for each capacity of the plant is scaled up or down using the scaling factor and the volume of entry air into the dry room in the base case study ( V ˜ drr ) follows as
V drr = V ˜ drr × ζ flw
Thus, the capital cost and installation of dry room ( P u = drr ) for each capacity are calculated with Equation (11) in which P ˜ u = drr is the cost of the dry room for the base case and μ drr is used as a scaling power factor based on the sixth-tenth rule.
P u = drr = P ˜ u = drr × ζ flw μ drr
As mentioned above, since the size of the mixer varies in the production volume of the plant and the needed slurry for individual battery chemistry, a flow scale factor is applied to distribute the unit price of mixers in the base case study ( P ˜ u = mix , cat , P ˜ u = mix , and ) to smaller and larger ones. Thus, the price of mixers for each capacity of the plant ( P u = mix ) follows as
P u = mix = P ˜ u = mix , cat +   P   ˜ u = mix , and × ζ flw μ mix
where μ mix is the scaling factor of mixers. This factor is assumed to be 0.7 in this project [18].
The applied machines for battery cell production are depreciated over a period of time. Driven by this, τ mch requires to be defined as the depreciation period of machinery and equipment or productive life of the equipment. To implement this parameter in the cost model, the percent discount rate ( r loc ) is also considered for the location and year of study to factor in the time value of money. These requirements are satisfied by means of machinery annualized factor ( F anl U ) for equipment [29,30], and follows as
F anl U = 1 τ mch 1 ( 1 + r loc ) τ mch
Since this work intends to investigate the battery production cost for different locations, the installation cost of machinery and equipment requires specification to the location of study. The logic behind this matter is that, for a specific location, local labor is employed to install the production lines and equipment [31]. In search of this, an installation coefficient ( α mch , ins ) is defined to subtract the share of installation cost from the total cost of equipment and installation. To investigate the effect of using local labor in the current model, a comparative installation factor ( ϕ ins , loc ) is specified for each location, defined as the average wage of labor in the location of study ( P ¯ lab , loc ) to the average wage of labor for the location from where the equipment is sourced ( P ¯ lab , sup ). Equation (14) presents the defined comparative installation factor.
ϕ ins , loc = P ¯ lab , loc P ¯ lab , sup
Considering Equations (8)–(14), the capital equipment and installation cost ( C eqp ) layer for the production of one cell in a specific location of the plant is formulated as
C eqp = (   U mix ,   drr N mch u × P ˜ mch u ) + P u = mix + P u = drr × 1 α mch , ins capital   machinery   cos t   without   installation × ( 1 + α mch , ins × ϕ ins , loc location wise   installation   factor ) F anl U × N cell
where P ˜ mch u is the unit price for the machinery applied in the model (except mixing and dry room) and N cell shows the total number of cells produced per year.
Concerning the variable N cell , it is a function of the annual capacity of the plant factory ( θ ) and the mass ( m cell ) and specific energy ( E spf ) of the produced cell. In other words, the number of cells produced per year is calculated as
N cell = θ m cell × E spf
It is worthy to mention that the unit price for the machinery and installation of battery manufacturing is listed in Table S1.

2.2.4. Labor

A battery production plant requires two groups of labor in general. The first group, named direct labor, includes operators and technicians, and the second one, named indirect labor, embraces overhead and maintenance staff, management personnel, and engineers [32].
For the modeling of labor cost, first, the total number of required operators in a working shift ( N opr ) is distributed between the units in the plant based on the number of machines ( N mch u ) working for that particular unit and fractional use of operators ( α opr u ) for each unit. Implementing the number of shifts per day ( N shf ), hours of each shift ( τ shf ), the wage of an operator per hour ( P opr ), and the number of working days per year ( N wpy ) yields an annual labor cost model for operators.
In addition, for the mixer unit in the model, three laborers per working shift for each cathode and anode mixer, regardless of the size of mixers, are allocated. Concerning the dry room control, two laborer per working shift are allocated. The fractional distribution of operators between different process steps of the battery cell factory is listed in Table S2.
Dividing the annual cost layer into the number of cells produced per year results in the operators cost ( C opr ) for one cell, and follows as
C opr = u = 1 U   ( N mch u × N opr × α opr u ) U mix ,   drr + N opr u = mix + N opr u = drr ) × N shf × τ shf τ ubt τ nos × P opr × N wpy N cell
In Equation (17), two additional terms are defined, τ ubt and τ nos , to consider both unpaid break hours for each shift and no shift hours per day, respectively [16].
Then, technicians and indirect labor are added to C opr to form the total labor cost layer ( C lab ) as follows:
C lab = C opr 1 + α tch P tch P opr + α ind , lab P ind , lab P opr
where P tch is the hourly wage for technicians, P ind , lab is the unit price for indirect labor, and α tch and α ind , lab indicate the fractional use of technicians and indirect labor compared to the total number of operators, respectively, in the plant. Both defined coefficients are tuned to the [32] report.
The unit price of workers in this study comprises bonuses and gratuities, the cost of food and drink, work clothes and recruitment, vocational training, welfare services, and social security expenditures [33].

2.2.5. Building and Land

To provide a cost model for the required area of land and building, a predefined area that fulfills the requirement of the base case study is scaled up and/or down to other capacities and chemistries using the land and building scaling factor ( ζ bld ),
ζ bld = 1 3 × N mch u + 2 3 × ζ flw
which is relevant to the number of production lines ( N mch u ) and flow scale factor (Equation (8)). The land and building scaling factor is fitted with the land and building cost in [4,16], and works by the application of both coefficients in Equation (19). Considering the land and building footprint of the base case study and Equation (19) results in the land and building footprint for other capacities ( L ).
L = ζ bld × L   ˜
where L   ˜ indicates the area of land and buildings in the base case study, around 50,000 m 2 , based on an optimized building concept [34].
To calculate the annualized factor for land and building, both parameters of depreciation period of the building ( τ bld ) and interest rate ( r loc ) for the location of the plant must be taken into consideration. The annualized factor for buildings ( F anl bld ) is defined as
F anl bld = 1 τ bld 1 ( 1 + r loc ) τ bld
Hence, the required land and building cost layer in this study is formulated as below to calculate the share of this layer to produce a cell.
C bld = P bld × L F anl bld × N cell
where C bld is the land and building cost and P bld is the unit price of land and construction of the building.

2.2.6. Maintenance

Keeping the assets of the battery cell manufacturing plant in good working condition incurs expenses due to requiring time-to-time maintenance of machinery. These costs are covered by maintenance cost ( C mnt ) presupposed as a percentage ( γ mnt ) of machinery and installation. Thus,
C mnt = γ mnt × C eqp

2.2.7. Overhead

Overhead cost is calculated as a percentage of capital equipment, buildings, and maintenance cost layers [4,17].
C ovh = γ ovh × C eqp + C bld + C mnt
where, γ OH is surcharge rate of overhead.
The per-unit battery cell cost ( C Cell ) is the summation of defined cost layers. Thus,
C Cell =   C msp + C nrg +   C eqp + C lab + C bld + C mnt + C ovh
It is worth mentioning that since the units in this work are based on US$/kWh, the total battery cell cost ( C Cell ) is divided by the product of specific energy of battery cell ( E spf ) and mass of cell ( m cell ) to the output (US$/kWh) unit.

3. Results and Discussion

A breakdown of battery cell production cost for the selected case study, where a manufacturing plant of 5.3 GWh annually produces approximately 24,215,000 NMC111-G prismatic cells, is presented here. The case study is assumed for eight different countries, in order to investigate also the effect of location.
The total mass of the cell is estimated to be 0.8285 (kg), extracted from the material flow from the work of Jinasena et al. [20]. Considering the physical and chemical characteristics of the battery cell, the total mass for cathode and anode components is 0.407 (kg/cell), with a cathode mass fraction of 96:2:2 including cathode active material, carbon, and binder, and 0.196 (kg/cell) with anode mass fraction of 98:0:2, in the same order, with the cathode. In addition, the volume of the required electrolyte for the cell is 0.0751 (liter/cell). The mass fraction of solvent for each cathode and anode is assumed to be 48% of its mass [18,20]. The other relevant values to both process and cost models can be found in Tables S3 and S4.

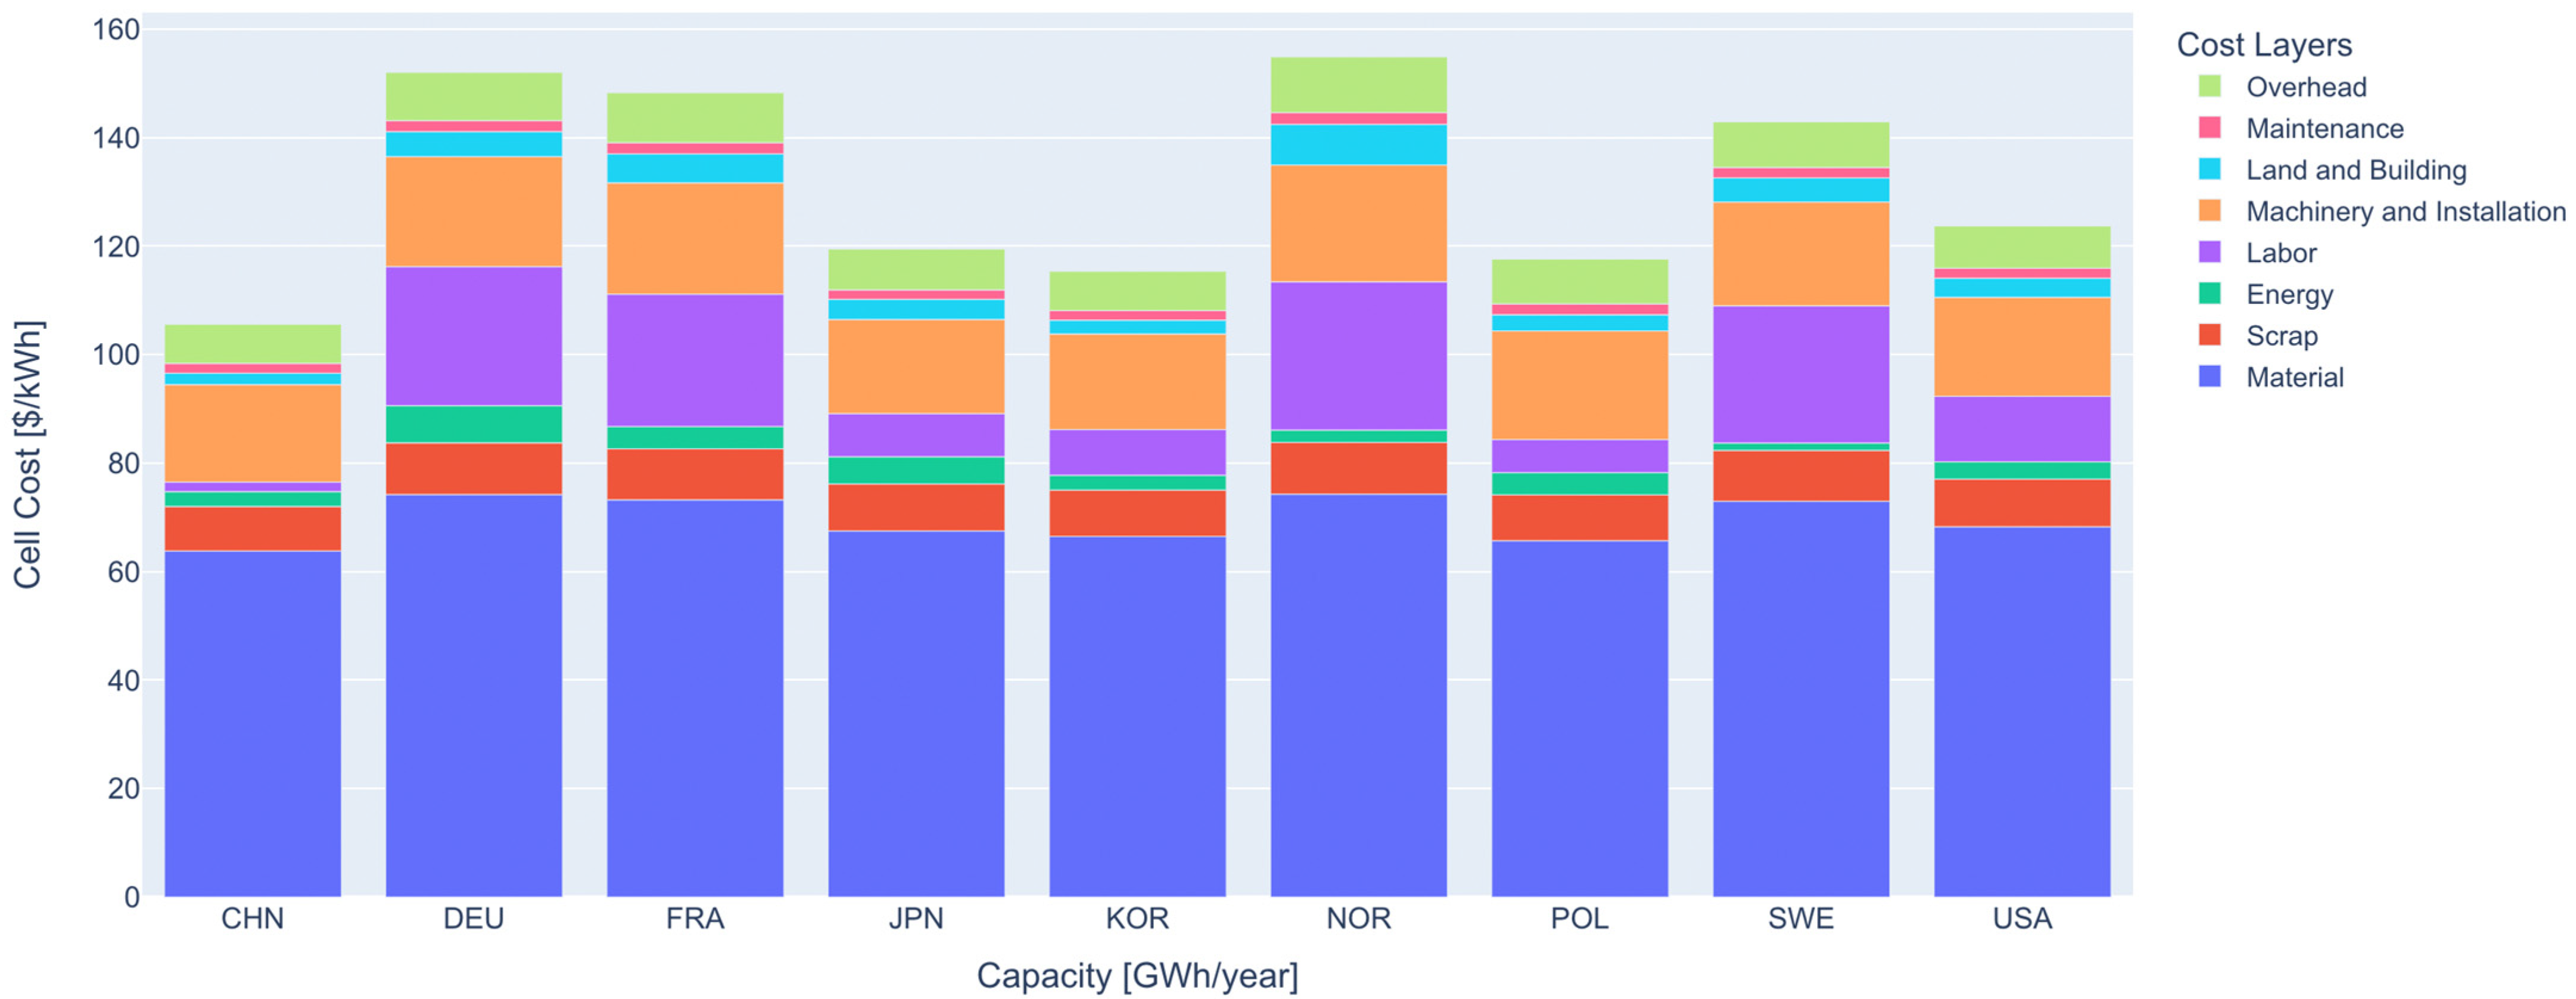
3.1. A Location-Wise Breakdown of the Cost Model with Further Focus on Key Drivers

The breakdown of battery cell cost, based on the layers defined in the model for the case study in Section 3, is presented in Figure 3. This assessment is based on differential unit prices for land and construction, energy, installation of production lines, labor, and interest rate which all vary in location and years.
Regarding the unit price of electricity, the values used in the project at hand are calculated based on the electricity bill for 1,000,000 (kWh) annual industrial consumption, including the cost of power, distribution, and taxes.
Considering the wage for labor, three different costs for each country are assumed. The relevant data for the labor are listed in Table S4.
Furthermore, it has been assumed that the initial cost for purchasing equipment and machinery is the same for all analyzed places.
Considering Figure 3, it can be seen that location can vary the production cost, ranging from 106.4 (US$/kWh) in China to 153.6 (US$/kWh) in Norway. It can be seen that labor is the key driver in altering the total cell cost. Based on the current cost model, production of the presented cell in the case study in Poland only requires allocation of around 6 (US$/kWh) to workers, while this value for Germany is 25.6 (US$/kWh). This cost differential results from the unit price of labor. A similar study between two countries has been conducted in the work by Duffner et al. [4]. Their results reveal that such change in plant location has the potential of a 6 (US$/kWh) lower price of cell production in Poland. This difference for the two countries mentioned above in our model is approximately 19 (US$/kWh), deriving from three reasons. First, the average unit price for German workers in our model is approximately 20% higher than what is stated in the work by Duffner et al. [4]. Second, the number of workers for the two models is different because we also included technicians and indirect labor in the plant. Third, the annual production volume is different for the two projects. By setting our model to the same unit price of labor in Germany and Poland and the annual size of the factory (35 GWh), the cost differential of labor for Germany and Poland reduces by 7 (US$/kWh), which is only 1 (US$/kWh) higher than what is stated in the work by Duffner et al. [4].
Energy cost is directly tied to the unit price of industrial electricity. In other words, a lower price of electricity reduces the share of the energy layer from the total cost of the cell and vice versa. For the case study in Figure 3, the cell production in Sweden costs only 1.4 (US$/kWh) for energy, the lowest value compared to other countries, while this value for Germany is 6.9 (US$/kWh), the highest one. Such difference is linearly proportional to the unit price of electricity in the two countries, as mentioned earlier.
Concerning maintenance in our model, location is not capable of leading to substantial changes in this layer because maintenance is dependent on capital equipment, where the only changing parameters in the location-related analysis are the interest rate and share of labor in the installation of machinery with minor effects on capital equipment and installation, approximately 3 (US$/kWh), with a consequently negligible effect on maintenance: less than 0.5 (US$/kWh).
Table S5 presents all the values in Figure 3 as well as the percentage of contribution of each layer to the total cost.
Considering the material layer from the cost model, Figure 4a shows that the active material of cathode, the active material of anode, electrolytes, and separator dominate the material cost layer. These results are consistent with available cost models and publications. In search of this, validation is conducted as well as mentioning the reasons in case of differences. Barnett et al. [35] investigated the cost for different sorts of battery chemistry, revealing that 19–27% of the final cost is made of the cost of cathode active material, which is approximately 30% in the current project. In their cost model, anode active material, electrolytes, and separator are the other key drivers of the material cost layer. ElementEnergy [15] reported that the cathode active material composes of 43% of total NMC cell material cost, while this is 57% in the present work. This difference mainly results from the high price of cobalt in the years 2018 and 2021, leading to a high average price of cobalt in this study. Furthermore, compared with the mentioned report, there are some differences in the unit price of components in a cell. For instance, the unit price of separator and electrolytes in their cost model is 2 (US$/m2) and 21.6 (US$/litre), respectively, whereas these values are much lower in our work (Table S1). Paul A et al. [18] presented a cost breakdown for NMC111-G in pack level where cathode positive active material consists of 44% of the total cost of a battery pack as well as 14% for negative active material, 4% for separator, and 5% for the electrolytes. The unit price of NMC111 in their work is assumed as 21 (US$/kg) for all the capacity of the plant, which is lower than the average cost of CAM in the present work. The main reason for such a difference results from the cost of raw materials, especially nickel and cobalt, which are highly volatile. PILLOT et al. [36] carried out a detailed assessment of the NMC cell for EVs. The results indicate that cathode active material makes up more than 48% of total cell cost. Their assessment also shows that the share of anode active material is approximately 12%, 12% for electrolytes, and 15% for separator. PILLOT et al. [5] presented a cost model for NMC battery cells where the share of active material is more than 58% of the total material cost. Wentker et al. [6] presented a bottom-up cost model for different cell chemistries in which the cost of cathode active material forms more than 50% of the total cell cost. In their work, the share of the separator is higher than anode active material and electrolytes because of the high unit price of the separator in their work compared to the present project. Sakti et al. [16] provided a process-based cost model for the NMC-G battery pack. According to the cost breakdown in their work, positive active material includes 38% of the total cost of a battery pack. The share of negative active material, separator, and electrolytes from total pack cost is 13%, 8%, and 6%, respectively. By subtracting the cost of relevant instruments of the battery pack from their cost breakdown, the share of cathode active material increases by 49%. Patry et al. [37] presented a cell cost breakdown for four different chemistries of NMC, NCA, LFP, and LMO. Considering NMC in their work, positive active material comprises approximately 31% of the material cost. Data for other components in the cell are not available in their project. The unit price of NMC in their work is 27 (US$/kg) and the unit price for other components is higher than this work. For instance, graphite and electrolytes of aforesaid work cost 18.5 and 19.5 (US$/kg), respectively, which are 41% and 23% higher than the unit prices of given components in this project. This is the reason for the difference in the share of positive active material in both works.
Considering the capital equipment and installation layer from the cost model, Figure 4b indicates the most cost-driving units in the plant. The largest portion, 31.9%, of investment into machinery and equipment is required to be allocated to the formation unit for the case study. Coating and drying units for both cathode and anode lines comprise 12.4% of the total machinery cost. As mentioned earlier, both coating and drying in this work are assumed to be integrated and continuous units. In addition, winding and mixing of anode and cathode units include 12.4% and 7.8% of the total cost, respectively. Duffner et al. [4] designed a process-based cost model based on two different scenarios where the base scenario identifies formation (25%), stacking (22%), and coating and drying (12%) as the cost-driving units. Liu et al. [24] estimated the cost for different units in the battery manufacturing plant. According to the cost breakdown presented in their work, the formation unit is dominant in equipment cost, comprising 32.61% of the total cost. Coating and drying units cost 14.96% of the total cost. Paul A et al. [18] represented a cost breakdown for the installed machinery cost layer. According to their results, the formation cycling unit forms 29% of total machinery cost, the highest share among other units. In the mentioned work, the coating and drying unit and dry room unit consist of the following cost-driving units with 18% and 17% of the total cost for installed machines. Regarding the portion of the dry room out of the total installed equipment cost, all welding, enclosing, and filling units are included in the dry room in the mentioned work [18].

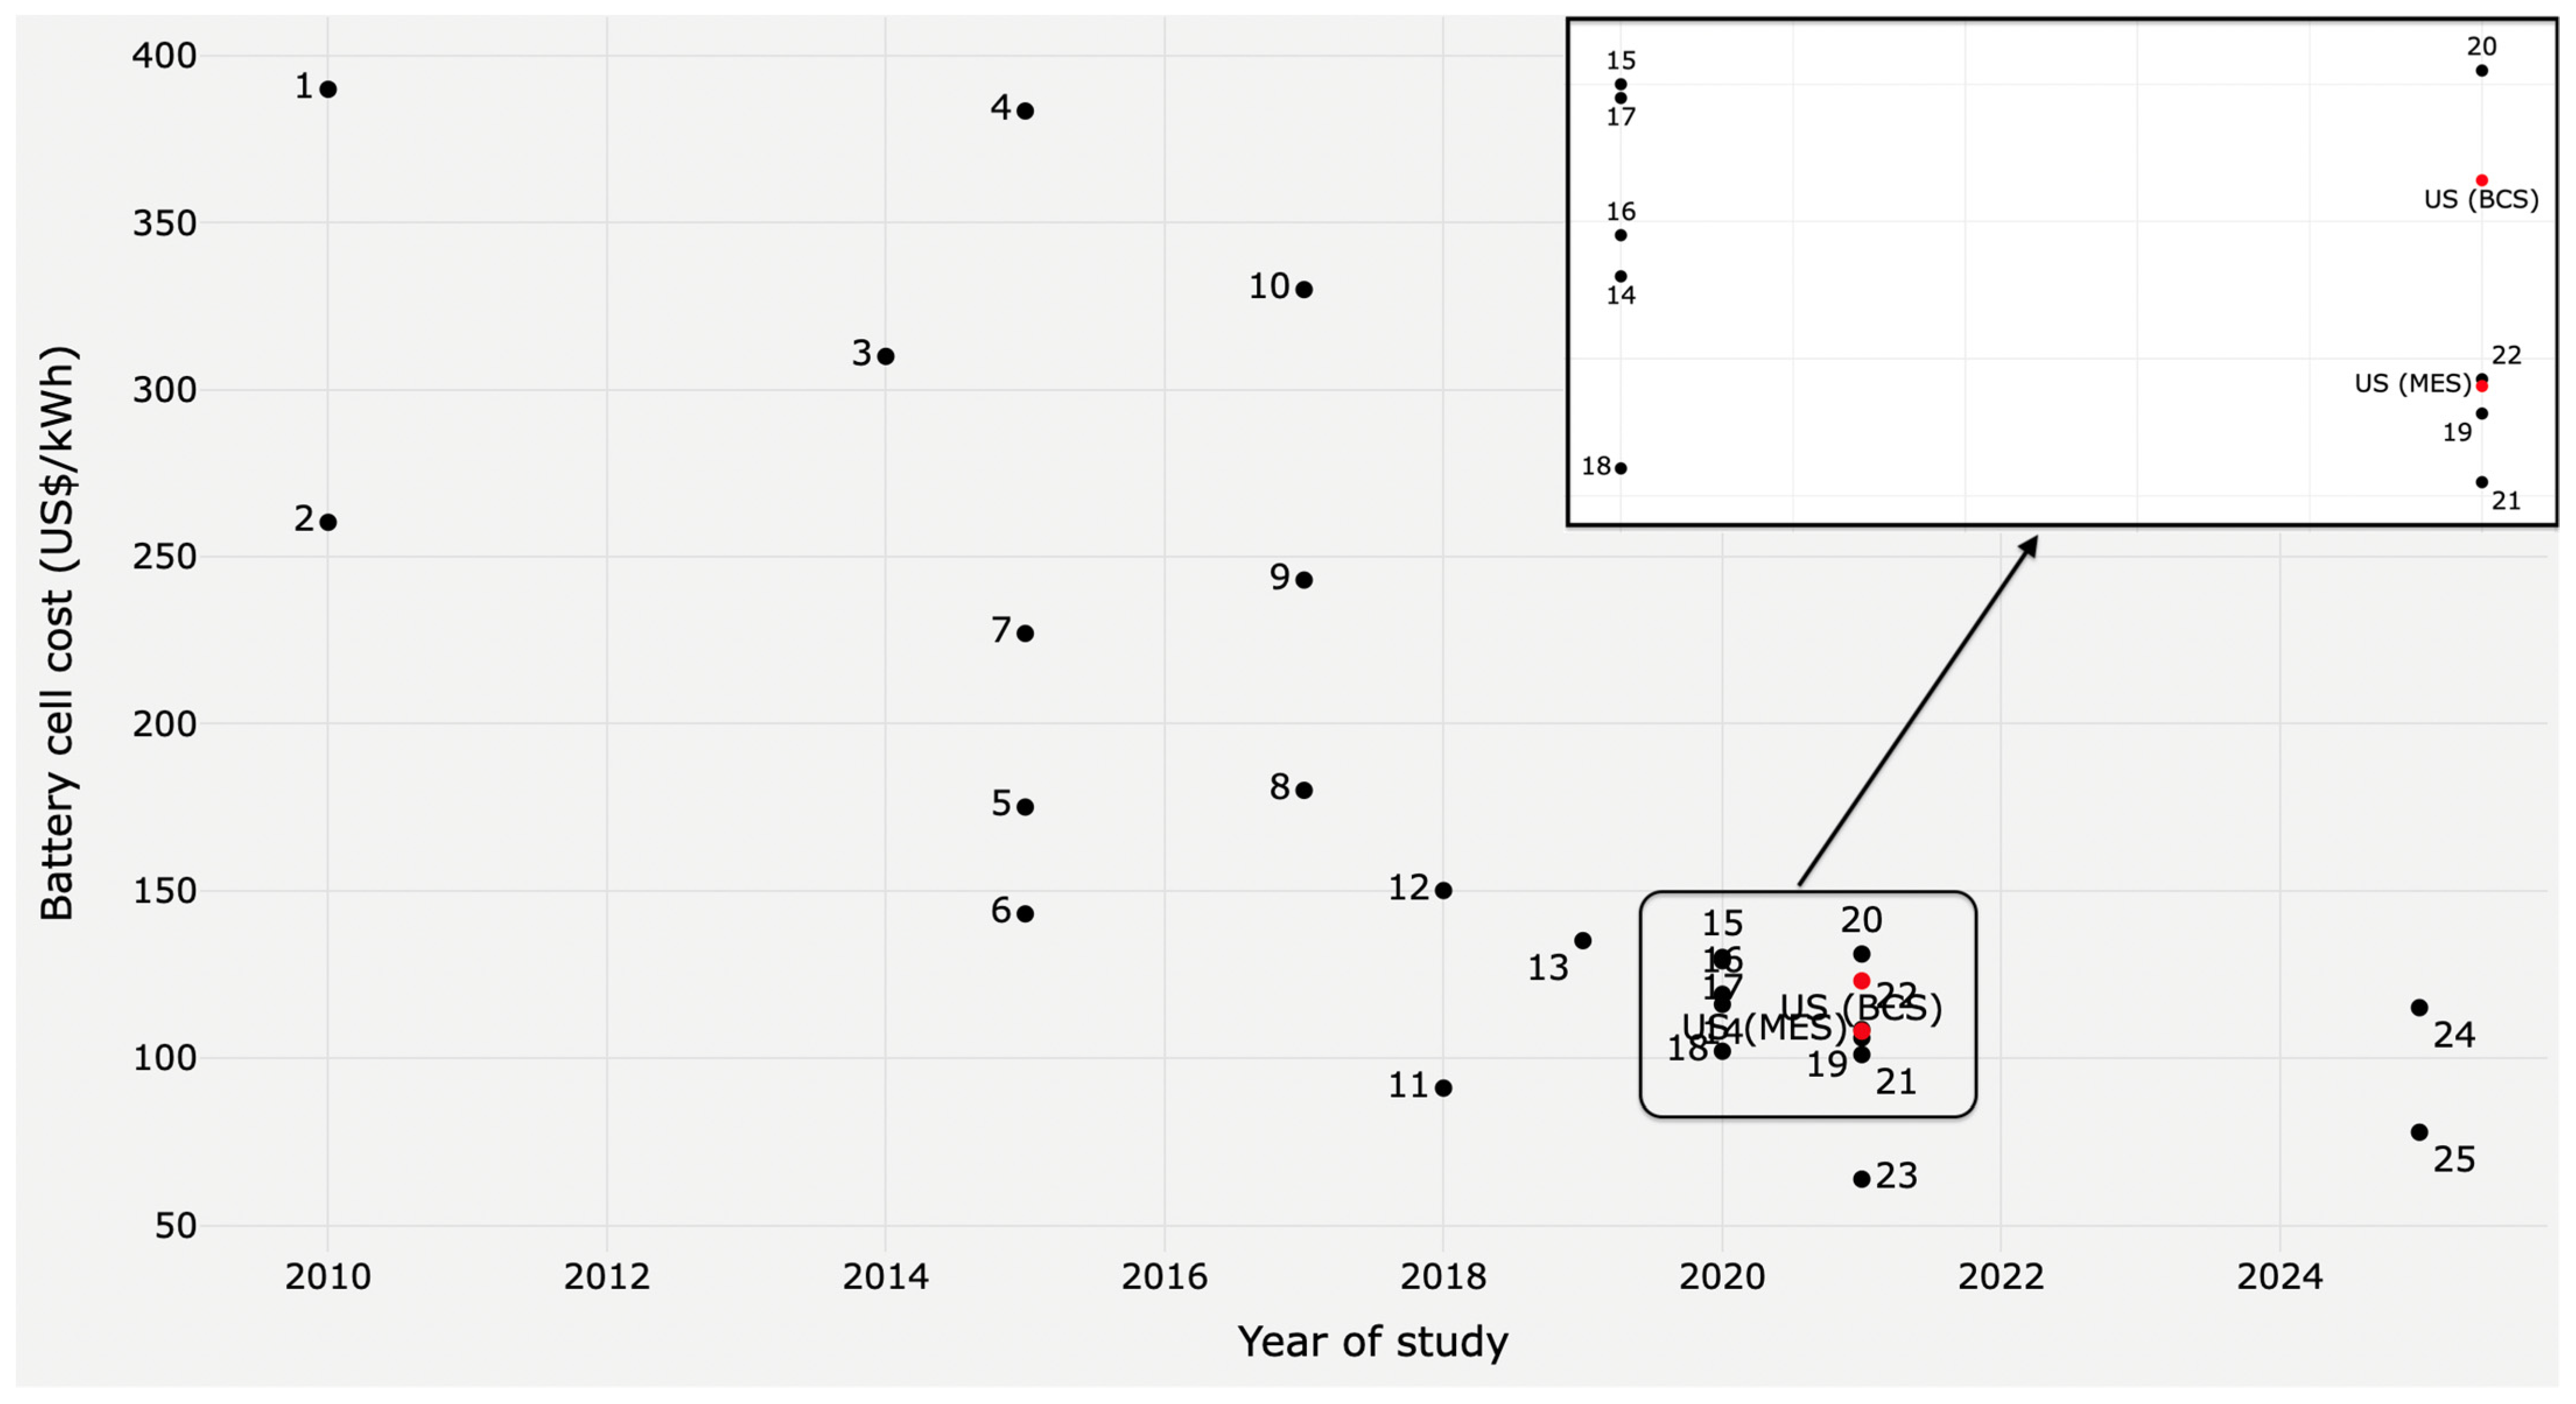
3.2. Comparing Total Cell Cost of the Case Study with Literature

The previous section presents the total cost for the NMC111-G prismatic cell as a case study of the current cost model for different locations. The total cost of a cell varies from one cost model to another due to the dependency of cost models on numerous parameters and assumptions. A comprehensive comparison between our results with some available works is conducted here. The collected data from the available cost models are presented in Table S6.
In addition to including previous and current cost models, two predictions for 2025 have been added to Figure 5 [5,38]. A decreasing trend in battery cell cost is transparently obvious. Although the results of this work are comparable with the latest cost models, the main reasons for cell cost differentials are mentioned. The unit price for labor and land in the current work is higher than in some recent works [4,18]. Considering the labor, including technicians and indirect labor separately, labor cost leads to this difference. Regarding the building and land, this layer is based on a high-tech factory that requires the highest unit cost for the construction compared to other industrial purposes. Furthermore, the unit price for cathode active material in this project is higher on average compared to some cost models such as the one proposed by Ciez et al. [18] because of the higher average price for raw material, in particular, cobalt, in the studied period. Concerning the equipment and machinery, this layer of the cost model has been based on sophisticated machines to offer superior quality and accuracy within the process chain in the plant, consequently requiring higher investment into the machinery layer. The difference between the production volume of some available models and the current one causes a difference in total cell cost. For instance, Duffner et al. [4] recently published an in-depth cost model in which they presented a cost model for a battery factory of 35 GWh per year while the presented case study is 5.3 (GWh/year).

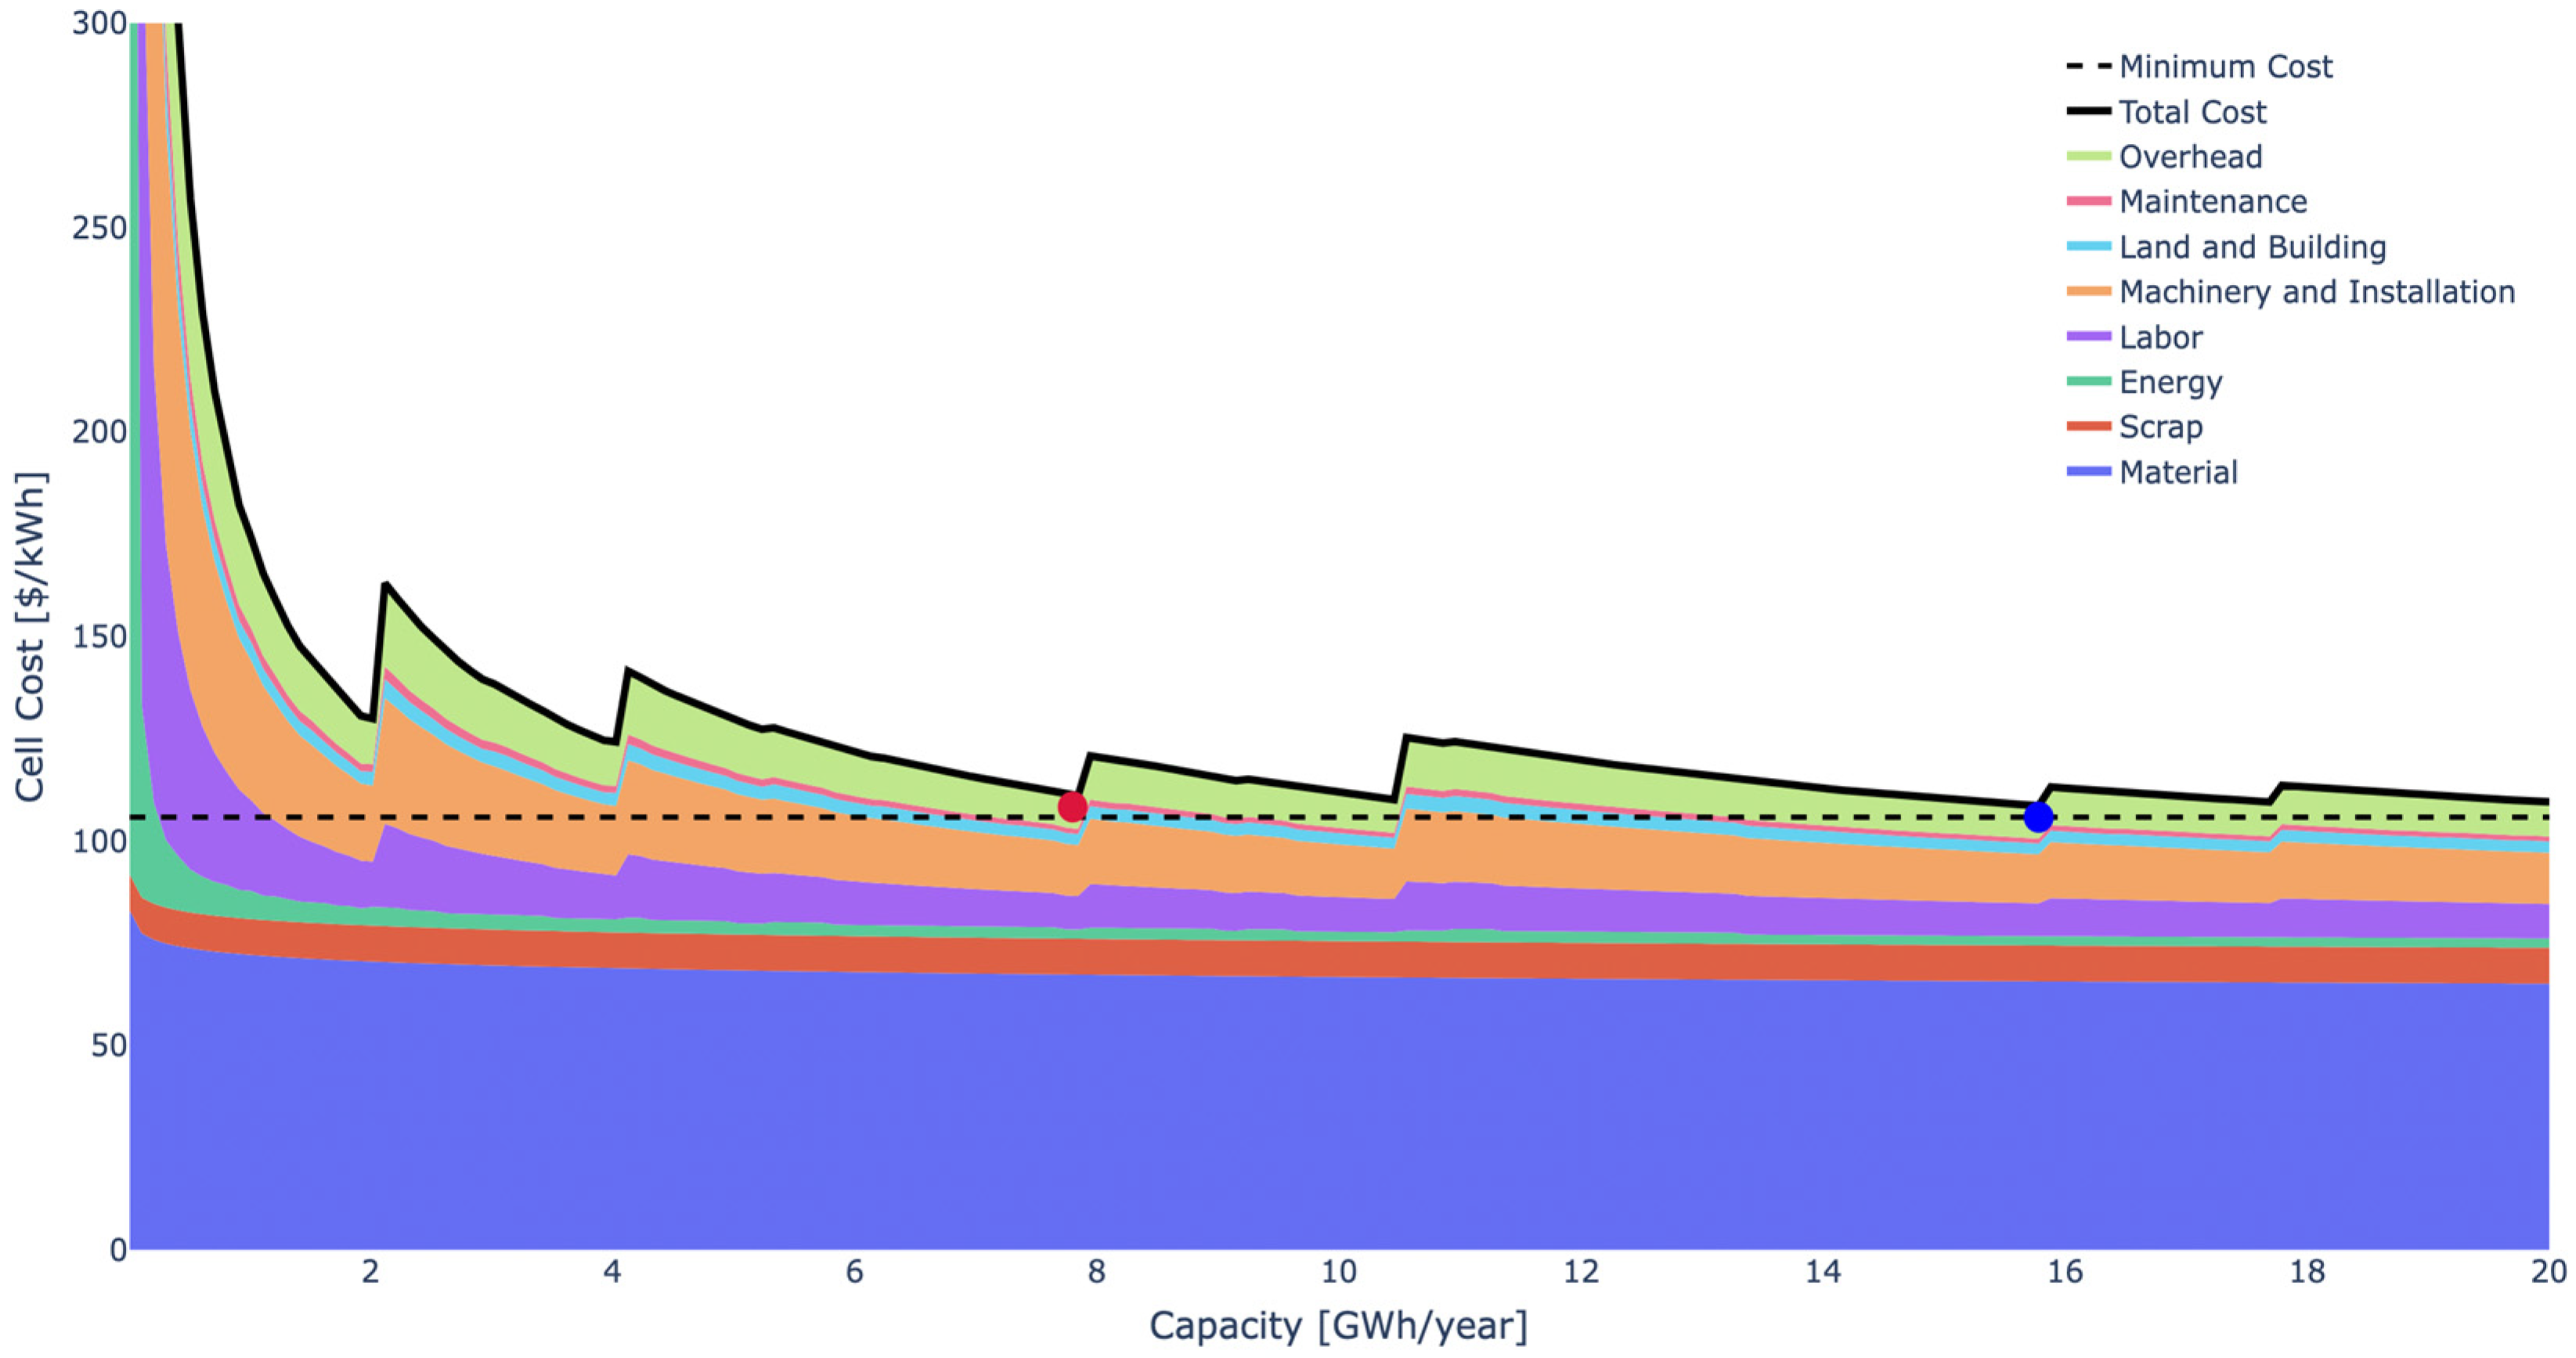
3.3. Study into the Cost-Effective Size of Battery Manufacturing Plant for the Case Study

As mentioned earlier, expanding production volume is one of the strategies which is employed to reduce the manufacturing cost of the cell. Driven by this, the economics of scale must be maximally materialized to reach a minimum efficient scale corresponding to the lowest point on the cost curve. In search of this, a cost curve showing the total cell cost against the annual capacities of the plant is depicted in Figure 6 for the case study.
From Figure 6, it is seen that the produced cell at the capacity of 15.6 GWh (blue circle in Figure 6) has the lowest cost, 106.8 (US$/kWh), among other capacities. The cost value for the capacity of 7.8 GWh (red circle in Figure 6) is 108.3 (US$/kWh). Considering both mentioned cases indicates that a twofold increase in the capacity of the manufacturing plant only decreases the manufacturing cost by approximately 2 (US$/kWh), around 2%. Such a strategy for expanding the capacity from 7.8 to 15.6 could not be reasonable due to a considerable increase in initial investments and associated risks [2], higher cost for fire protection, emergency stairs, and escape tunnels, increasing problems in management and ineffective communication of employees for larger companies [39]. Hence, the capacity of 7.8 GWh per year is regarded as the minimum efficient scale for this project’s case study. There is no agreement on the efficient scale of battery production plants among different works yet. For instance, Mauler et al. [2] investigated some relevant recent cost models wherein Nelson et al. [40] obtained 7.1 GWh/year as the minimum efficient scale, Sakti et al. [16] calculated 0.2–0.3 (GWh/year), and Ciez et al. [17] acquired 1.0 (GWh/year). Moreover, Wentker et al. [6] expected that the plant reaches its minimum efficient scale at the capacity of 3 (GWh/year). Eberhardt et al. [41] reported that 6–8 (GWh/year) is an economic size for the battery cell factory.
As mentioned above, expanding the plant capacity from the case study (5.3 GWh/year) to the minimum efficient scale (7.8 GWh/year) decreases the total cost of the cell by around 15.8 (US$/kWh). From Figure 6, it is seen that machinery and labor layers have the highest share of this reduction.

3.4. Sensitivity Analysis of the Cost Model

Since the developed cost model is tied to a large volume of parameters and variables, conducting a sensitivity analysis gives insights into the influence of parameters on the total battery cell production cost. First, the sensitivity of the current cost model to different battery chemistries is examined. Then, the model’s sensitivity to the commodity prices, economic factors of the plant, and process parameters are investigated.

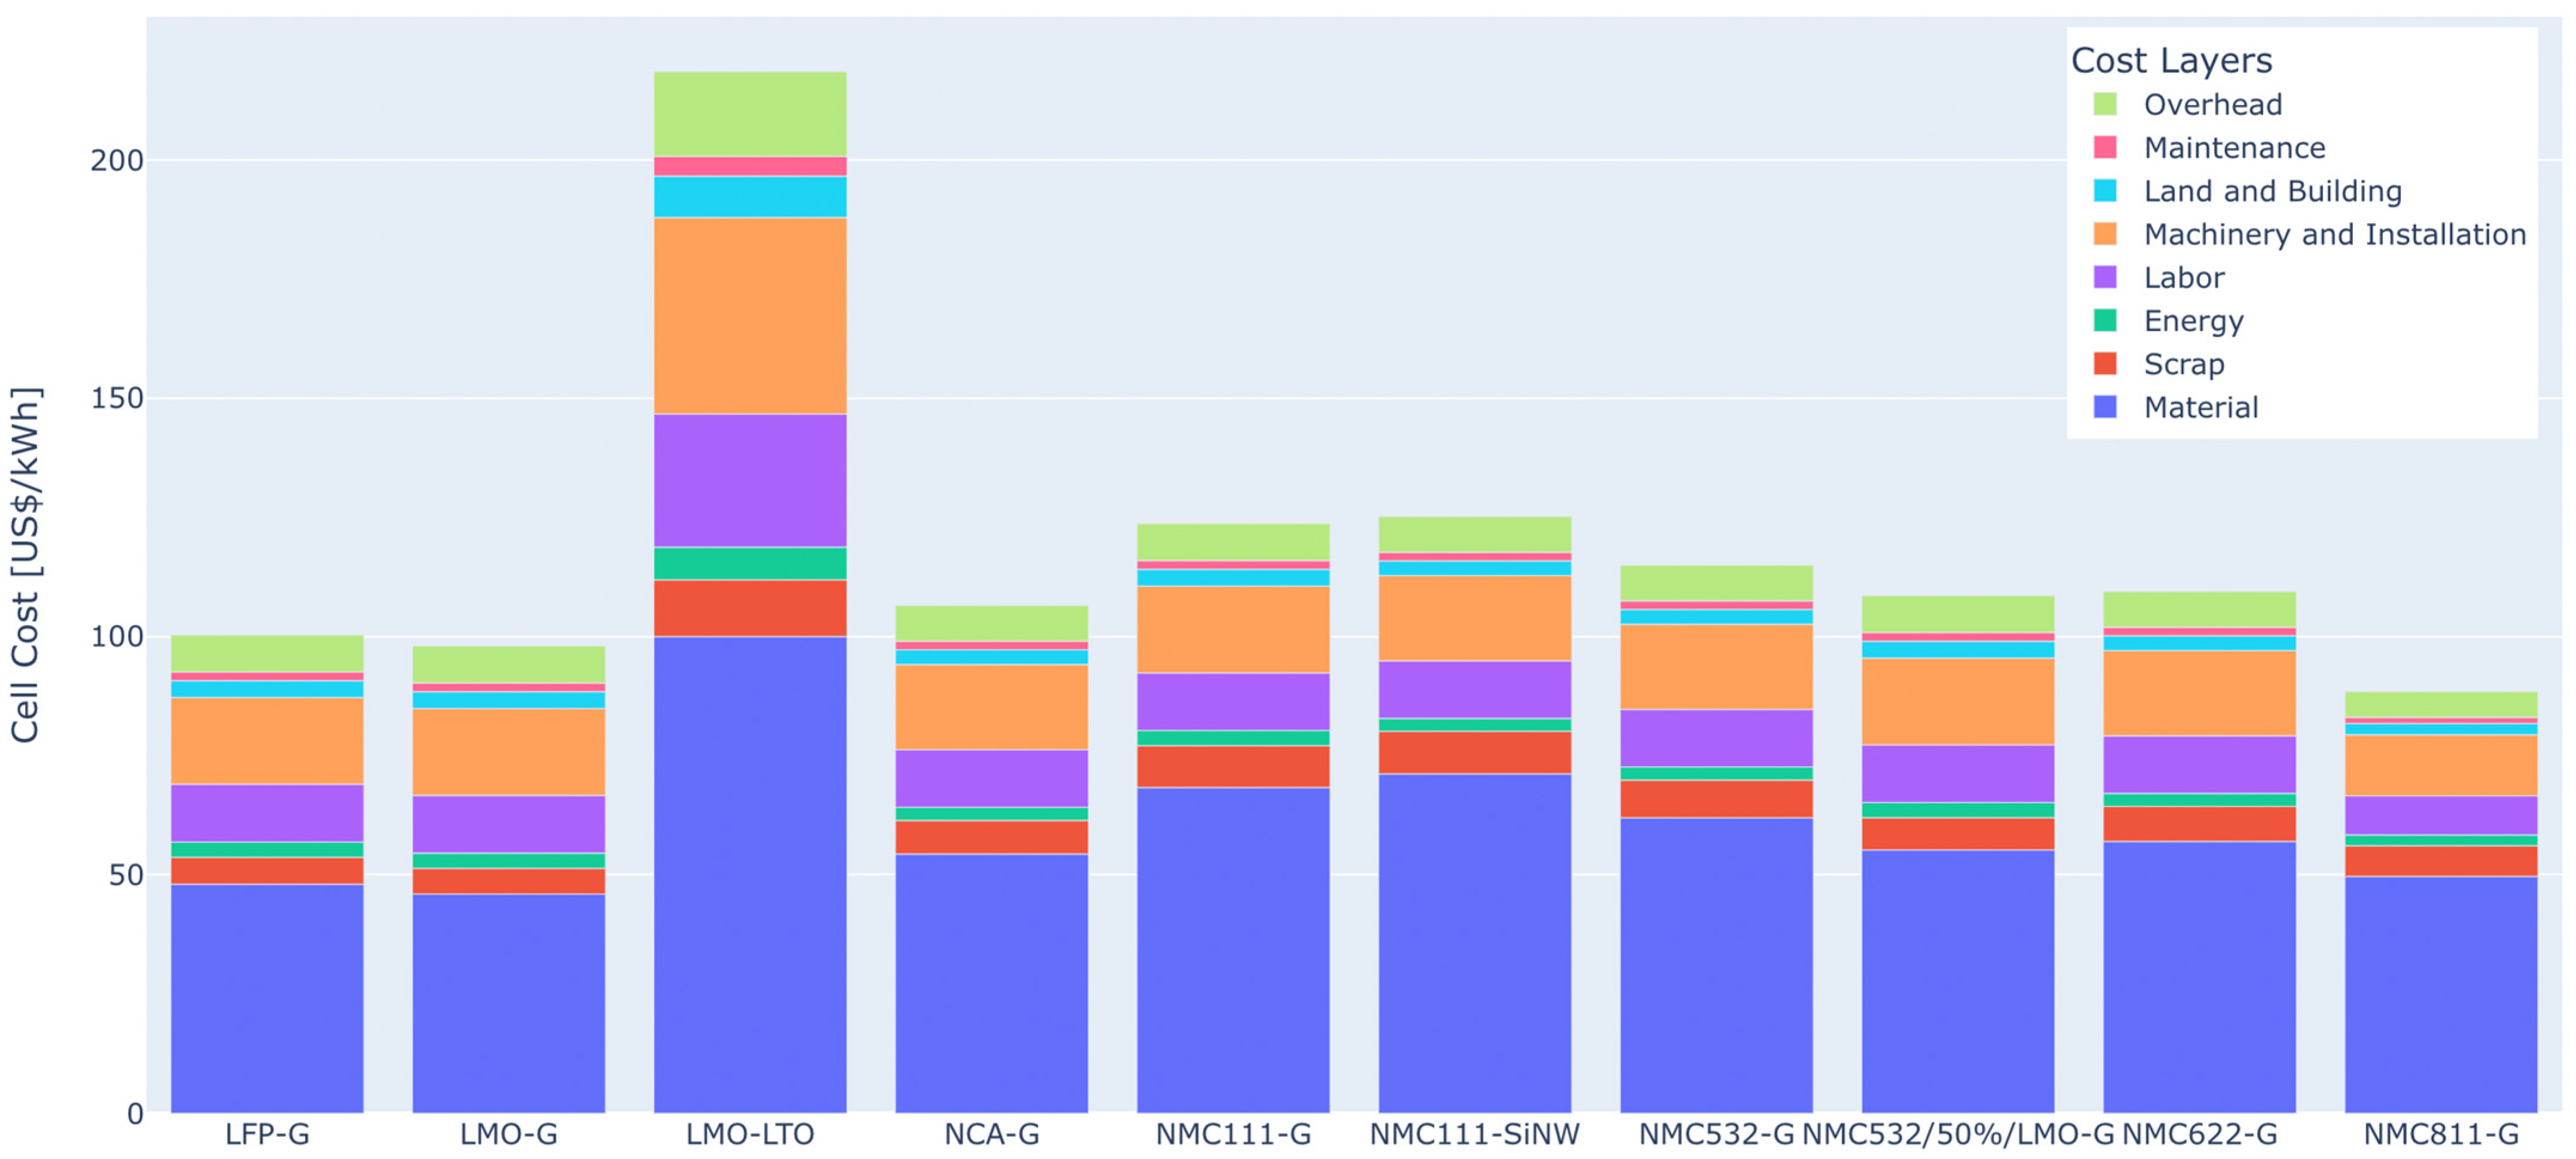
3.4.1. Sensitivity of the Current Cost Model to Battery Cell Chemistry

Figure 7 represents the sensitivity of the cost model to 10 different chemistries. All the assumptions for the case study in Table S1 have been presupposed for this part. It is seen that, despite differences in the unit price of material for individual chemistries, the material layer remains the key driver of the total cell cost for all chemistries in the case study. Moreover, from Figure 7, it is thoroughly understandable that switching from one chemistry to another significantly alters the total cell cost, from 89.7 (US$/kWh) for NMC811-G to 218 (US$/kWh) for LMO-LTO. One of the principal grounds for this significant variance in the total cost of the two cells above is the total mass differential of cells in our model, where LMO-LTO is approximately threefold of NMC811-G, while the number of produced cells is approximately threefold for a certain level of annual production kept almost the same. Hence, in the comparison, LMO-LTO requires a different amount of material than NMC811-G; consequently, further numbers of production lines in the plant are required to fulfill the desired manufacturing requirement. Such an increase in the plant’s production lines requires more extensive land and buildings in size and/or number and hiring more labor. Driven by this extension, maintenance and overhead impose higher costs on the manufacturing cost. Moreover, the use of NMP instead of water as a solvent in the anode of LMO-LTO battery chemistry leads to higher costs.
Considering NMC battery cells from Figure 7, NMC811-G requires lower costs in different model layers, particularly material and equipment, compared to other NMC cells. This result is in good agreement with other cost models [6,18,36]. That is why NMC811-G is expected to gain a higher share of the lithium-ion battery market in the following years [36]. Another reason for the increased attention of the market to NMC811-G rather than other NMC cells in the future results from the lower dependency of this chemistry on cobalt price [6].

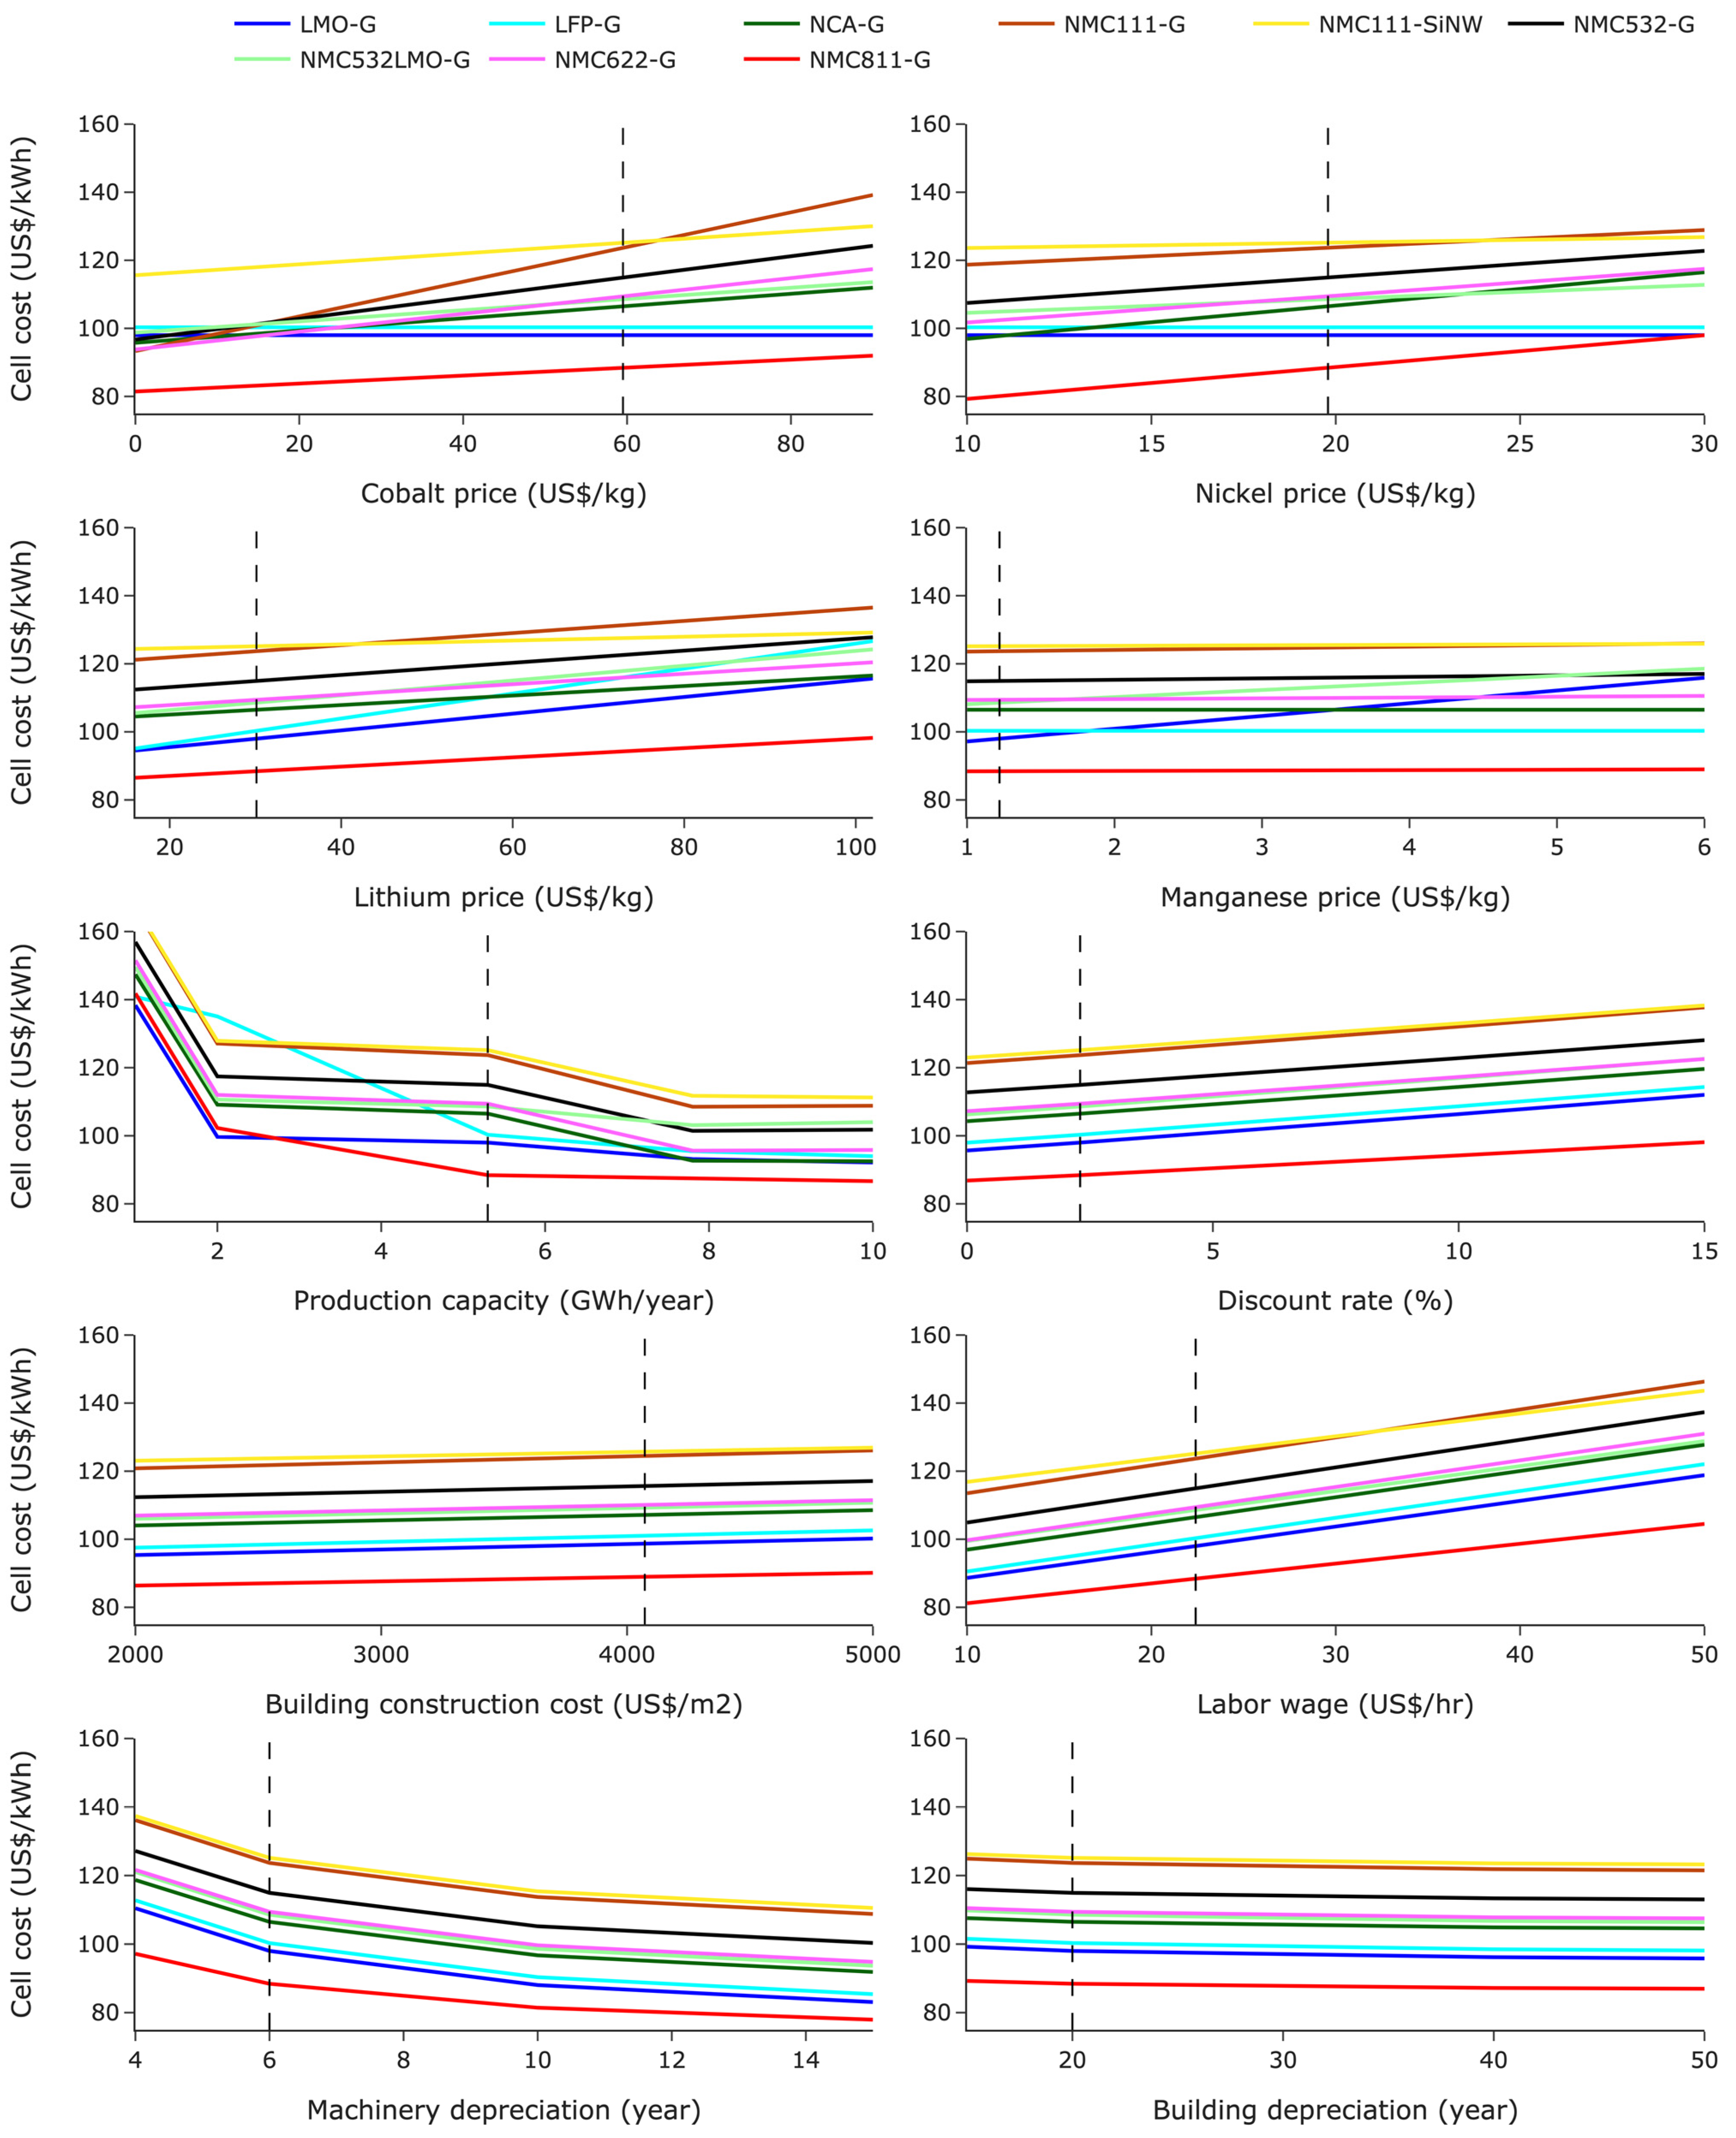
3.4.2. Sensitivity of the Cost Model to Commodities Prices, Economic Factors, and Production Volume

A sensitivity analysis for the different available chemistries of this work is conducted to investigate how the change in one parameter in the cost model affects the total cost of the battery cell chemistries. The results are depicted in Figure 8.
Considering the commodities prices, for the NMCs group and NCA battery cell chemistry, cobalt and nickel prices are the greatest cost drivers. In contrast, LMO and LFP cathode active materials are highly sensitive to manganese and lithium prices.
As can be seen from the cobalt price sensitivity, a 30 US$/kg increase in the cobalt price, rather than what is observed in the case study, can increase the cost of the NMC111-SiNW battery cell by approximately 3% as the least among the cobalt dependence group, while this increase for the NMC111-G battery cell is around 12.6%, the highest increase. Such an assumption can also increase the battery cell cost for NMC532-G, NMC622-G, and NCA-G chemistries by 8.8%, 7.1%, and 4.6%, respectively, which agrees with the work by Leader et al. [42]. Furthermore, the battery cell price for NCA-G and NMC811-G rises by around 9.5% and 8.9%, respectively, with a 50% increase in the unit price of nickel from the case study. Such increases are the highest in this work compared to the rest of the battery cell chemistries.
Considering the lithium price, both LFP-G and LMO-G are the most sensitive battery cell chemistries with 10.48% and 7.1% increases, respectively, in case of a 100% increase in the lithium price. These outcomes are closely aligned with the study by Leader et al. [42]. In addition, a twofold increase in lithium price changes the total cost of the NMC811-G battery cell by less than 4%, which is in good agreement with BloombergNEF’s report [43].
Regarding the manganese price, all the chemistries in this study have a sensitivity of less than 1% for a 100% increase in the commodity, except the LMO-G battery cell chemistry, with 2.5%.
As mentioned before, a change in the plant’s production capacity has the potential to increase or decrease the final price of the battery cell. According to this study, with a 50% decrease in the production capacity of the plant compared to the case study (5.3 GWh/year), the final price of the battery chemistries increases by 19.5% at most for the LFP-G and 1% as the slightest change for the LMO-G. Moreover, minor changes in the total cell cost are seen after the capacity of 8 GWh/year. In other words, almost all battery cells reach the minimum efficient scale before or around this capacity.
As can be seen from the discount rate diagram, all the cell chemistries almost follow the same trend in the case of changes in the discount rate, a 4.3% and 5.3% increase in the final cost of NMC811-G and LFP-G battery cells, respectively, in case of a twofold increase in the discount rate.
Assuming a 25% increase or decrease in the construction cost of the buildings in the battery manufacturing plant can change the final battery cell cost by, at most, 2.3%, while the same assumption for the labor wage can alter the battery cell cost, on average, by 8.2%. This is why automation has become an interesting topic in this industry in recent years, resulting in decreasing labor dependency in production, particularly for locations with high salary rates, e.g., Norway. Developing such a strategy also brings higher accuracy and speed to the production line(s), resulting in a lower scrap rate and less machinery in the production lines, respectively.
A range of 4–15 years for the recovery period of the machinery has been reported in the relevant literature [4,18,44], which results in a range of 23–31% changes in the cost of battery cell chemistries in this work.

3.5. Limitations

While the concluded results of this work are in good agreement with relevant cost models, it lacks a high resolution due to the factors listed below.
Transportation expense is one of the common elements in the PBCM approach [28], while this work has not included this element. The reason for this exclusion is that the plant’s exact location, as well as machinery and material suppliers for a specific plant need to be available, while these data are not included in the relevant literature.
In Equations (1) and (2), it is assumed that the price of equipment needed in the production of CAMs is not dependent on the location, since the relevant data for each location were not available in the literature. Considering machinery and equipment for the battery production plant, the same supplier has been assumed for all the locations. This assumption requires implementing distinct shipment and transit expenses for each location, causing greater differentials in the equipment layer of location-wise cost analysis, but these expenses have not been included in this study. In addition, to have a holistic location-related analysis, purchasing equipment locally must also be investigated and compared with current results. This is because, in the case of local supply of equipment, having access to spare parts is more accessible and less expensive than importing, consequently imposing lower costs on the manufacturing chain.
Labor cost has been attempted to be updated and accurate based on credible and notable resources, but Brodd et al. [45] reports that Chinese manufacturers recruit semi-skilled workers with a wage of 2.42 (US$/hour), which is lower than the reported wage in this work, resulting in a lower cost for the produced cell. This report was conducted based on face-to-face interviews with selected individuals who worked as researchers and managers in battery companies in both the US and China. In addition, the unit price for indirect labor has been assumed to be an average of some relevant labor classes due to the lack of data for an exact number of each class of labor being hired in the battery cell plant.
To have a precise analysis of the location, the exact region of the plant should be specified, which is not mentioned in this work, due to the lack of relevant data and modeling complexity. This matter could have a significant impact on all layers of the cost model. For instance, the industrial land cost in China dramatically varies from 155.97 (US$/m2) in Nanjing to 226.04 (US$/m2) in Shenzhen [45]. Moreover, the unit price for labor, electricity, and construction varies from one region to another in a particular country.
The generated scrap of material within the process chain and the defective cells at the end of the process chain could be sold to recycling companies, generating revenue and a decline in cell manufacturing cost. The current cost model excludes this part due to the lack of relevant information on the unit price of scrap material.
The latest technologies for different applied units in the process model are required to be studied and the results should be compared with the present ones. For instance, a single line of fully continuous mixing technology can be replaced with multiple batch mixers, reducing relevant machinery investment and labor by 50% [46]. In addition, the relevant literature reported three times less required energy and a considerable reduction in the area compared to conventional batch mixing systems.
Incentives to land and taxes for the battery manufacturers should be considered to reach a more precise cost model [47], but the relevant data for this part are not available. Implementing these incentives leads to lower costs for the produced cells.
Depreciation for all the equipment in the process chain has been assumed to be equal, but, in reality, this parameter varies from one piece of equipment to another.
In this work, a conventional process chain of the battery production has been assumed, while the next-generation technologies, e.g., 24 M, can decrease the total cost of the cell by 53% [38]. The relevant data for these technologies are not available in the literature yet.

4. Conclusions

In summary, a process-based cost model was developed to determine a cost breakdown of battery cell manufacturing. The commodities prices, chemical and physical characteristics of the cell, operational conditions, and economic factors are simultaneously taken into account in the model. The cost model comprises seven interconnected layers of material and scrap, energy, machinery and installation, labor, land and buildings, overhead, and maintenance. The model allows for a detailed investigation of the critical cost drivers of battery cell production for R&D and optimization. Moreover, the model has flexibility in the propagation of different production volumes, locations, battery cell chemistry, and technologies. Apart from the benefits mentioned above, the current cost model is beneficial in identifying the projection of battery cell production cost, since the ongoing changes in the commodity prices, technologies, and the economic factors of the plant can be applied in the model.
As a case study, a 5.3 GWh conventional production plant which produces NMC111-G battery cells was investigated for nine different locations. Among the studied locations, China has the lowest battery cell production cost, 106.4 (US$/kWh), while this value for Norway is the highest, 153.6 (US$/kWh). Such a difference for the case study could be considerably reduced, by approximately 31%, through the application of economics of scale where all the resources in the plant are effectively utilized. A cost curve indicated that the plant size of 7.8 GWh provides the most cost-efficient production for the case study. Moreover, the model was utilized to investigate the production cost for nine other state-of-the-art battery cell chemistries.
Among the presumed layers in the model, it could be concluded that the labor cost is the most important factor of difference in the total battery cell production cost in the studied locations. Driven by this, automation has obtained more interest in the recent years in order to dramatically reduce the dependency of the production on the labor force.
In addition, a systematic and complete analysis was conducted to investigate the sensitivity of production cost to the different regional and process parameters for different battery cell chemistries. The outcomes of such an analysis could be helpful for both leaders in the battery industry field and policymakers.
Despite the consistency between the results of this work and the recent cost models, we recognize that there are still areas of improvement. Therefore, we included a list of limitations to our best ability. We believe that overcoming the mentioned limitations is a reasonable step in search of a higher-resolution model.

Supplementary Materials

The following supporting information can be downloaded at: https://www.mdpi.com/article/10.3390/batteries8080083/s1, Table S1: Unit price of material components and the relevant machinery, Table S2: Fractional distribution of the operators between different process steps in the battery cell manufacturing plant, Table S3: Relevant parameters of the battery cell in the case study as inputs to the process and cost model, Table S4: Assumed economic factors to study the effect of location on the total cost of cell, Table S5: A location-wise distribution of the total cell cost of the case study between defined layers of the cost model, Table S6: Battery cell cost reported in works of literature and available cost models, Table S7: Relevant ratios to convert different levels of cost to cell level. References [48,49,50,51,52,53,54,55,56,57,58,59,60,61,62,63,64,65,66,67,68,69,70,71,72,73,74,75,76,77,78,79,80,81,82] are cited in the supplementary materials.

Author Contributions

Conceptualization, S.O. and A.H.S.; methodology, S.O.; modeling, programming, and validation, S.O.; formal analysis, S.O. and A.H.S.; investigation and visualization, S.O. and A.H.S.; writing—original draft preparation, S.O.; writing—review and editing, S.O. and A.H.S.; supervision, A.H.S.; project administration, A.H.S. All authors have read and agreed to the published version of the manuscript.

Funding

This research was funded by the Norwegina Research Council, grant number 306400, “Norwegina Giga Battery Factories”.

Institutional Review Board Statement

Not applicable.

Informed Consent Statement

Not applicable.

Data Availability Statement

The data presented in this study are available on request from the corresponding authors.

Acknowledgments

S.O. acknowledges support from Asanthi Jinasena (previous Postdoctoral Researcher at NTNU) for the valuable technical insights during the battery cell production model development.

Conflicts of Interest

The authors declare no conflict of interest. The funders had no role in the design of the study; in the collection, analyses, or interpretation of data; in the writing of the manuscript; or in the decision to publish the results.

Abbreviations

The following abbreviations are used in this manuscript:
AlAluminum
BCSBase Case Study
CAMCathode Active Material
CellEstCell Estimation
CHNChina
CNYChinese Yuan Renminbi
CuCopper
DEUGermany
EVElectric vehicle
FRAFrance
GGraphite
GSAGeneral, Sales, and Administration
GWhGigawatt hour
ICVInternal Combustion Vehicle
JPNJapan
JPYJapanese Yen
kgKilogram
KORSouth Korea
KRWKorean Won
kWhKilowatt hour
MESMinimum efficient Scale
NORNorway
OPSOptimistic Scenario
PBCMProcess-Based Cost Modelling
PolPoland
R&DResearch and Development
SiNWSilicon Nanowire
SWESweden
USAUnited States of America
US$United States Dollar

References

  1. International Energy Agency. Global EV Outlook 2020-Entering the Decade of Electric Drive? International Energy Agency: Paris, France, 2020; pp. 19–20. [Google Scholar]
  2. Mauler, L.; Duffner, F.; Leker, J. Economies of scale in battery cell manufacturing: The impact of material and process innovations. Appl. Energy 2021, 286, 116499. [Google Scholar] [CrossRef]
  3. Projected Global Battery Demand by Application. Available online: https://www.statista.com/statistics/1103218/global-battery-demand-forecast/ (accessed on 20 February 2022).
  4. Duffner, F.; Mauler, L.; Wentker, M.; Leker, J.; Winter, M. Large-scale automotive battery cell manufacturing: Analyzing strategic and operational effects on manufacturing costs. Int. J. Prod. Econ. 2021, 232, 107982. [Google Scholar] [CrossRef]
  5. Pillot, C. The rechargeable battery market and main trends 2018–2030. In Proceedings of the 36th Annual International Battery Seminar & Exhibit, Fort Lauderdale, FL, USA, 25–28 March 2019; Avicenne Energy: Lyon, France, 2019. [Google Scholar]
  6. Wentker, M.; Greenwood, M.; Leker, J. A bottom-up approach to lithium-ion battery cost modeling with a focus on cathode active materials. Energies 2019, 12, 504. [Google Scholar] [CrossRef]
  7. König, A.; Nicoletti, L.; Schröder, D.; Wolff, S.; Waclaw, A.; Lienkamp, M. An Overview of parameter and cost for battery electric vehicles. World Electr. Veh. J. 2021, 12, 21. [Google Scholar] [CrossRef]
  8. Mahmoudzadeh Andwari, A.; Pesiridis, A.; Rajoo, S.; Martinez-Botas, R.; Esfahanian, V. A review of battery electric vehicle technology and readiness levels. Renew. Sustain. Energy Rev. 2017, 78, 414–430. [Google Scholar] [CrossRef]
  9. Mauler, L.; Duffner, F.; Zeier, W.G.; Leker, J. Battery cost forecasting: A Review of methods and results with an outlook to 2050. Energy Environ. Sci. 2021, 14, 4712–4739. [Google Scholar] [CrossRef]
  10. Schmuch, R.; Wagner, R.; Hörpel, G.; Placke, T.; Winter, M. Performance and cost of materials for lithium-based rechargeable automotive batteries. Nat. Energy 2018, 3, 267–278. [Google Scholar] [CrossRef]
  11. Mundada, A.S.; Shah, K.K.; Pearce, J.M. Levelized cost of electricity for solar photovoltaic, battery and cogen hybrid systems. Renew. Sustain. Energy Rev. 2016, 57, 692–703. [Google Scholar] [CrossRef]
  12. Michaelis, D.; Rahimzei, E.; Kampker, P.; Heimes, H.; Offermanns, C.; Locke, M.; Löbberding, H.; Wennemar, S.; Thielmann, A.; Hettesheimer, D.; et al. Roadmap Batterie-Produktionsmittel 2030-Update 2020; VDMA Verlag GmbH: Frankfurt am Main, Germany, 2021. [Google Scholar]
  13. Nykvist, B.; Nilsson, M. Rapidly falling costs of battery packs for electric vehicles. Nat. Clim Change 2015, 5, 329–332. [Google Scholar] [CrossRef]
  14. Duffner, F.; Wentker, M.; Greenwood, M.; Leker, J. Battery cost modeling: A review and directions for future research. Renew. Sustain. Energy Rev. 2020, 127, 109872. [Google Scholar] [CrossRef]
  15. Element Energy. Cost and Performance of EV batteries: Final Report for the Committee on Climate Change, Element Energy Limited, Cambridge. Available online: www.element-energy.co.uk/wordpress/wp-content/uploads/2012/06/CCC-battery-cost_-Element-Energy-report_March2012_Finalbispdf (accessed on 7 May 2016).
  16. Sakti, A.; Michalek, J.J.; Fuchs, E.R.H.; Whitacre, J.F. A techno-economic analysis and optimization of li-ion batteries for light-duty passenger vehicle electrification. J. Power Sources 2015, 273, 966–980. [Google Scholar] [CrossRef]
  17. Ciez, R.E.; Whitacre, J.F. Comparison between Cylindrical and prismatic lithium-ion cell costs using a process based cost model. J. Power Sources 2017, 340, 273–281. [Google Scholar] [CrossRef]
  18. Paul, A.N.; Shabbir, A.; Kevin, G.G.; Dennis, W.D. Modeling the Performance and Cost of Lithium-Ion Batteries for Electric-Drive Vehicles, 3rd ed.; Argonne National Lab. (ANL): Argonne, IL, USA, 2019. [Google Scholar]
  19. Peters, J.F.; Peña Cruz, A.; Weil, M. Exploring the economic potential of sodium-ion batteries. Batteries 2019, 5, 10. [Google Scholar] [CrossRef]
  20. Jinasena, A.; Burheim, O.S.; Strømman, A.H. A Flexible model for benchmarking the energy usage of automotive lithium-ion battery cell manufacturing. Batteries 2021, 7, 14. [Google Scholar] [CrossRef]
  21. Thomitzek, M.; Schmidt, O.; Röder, F.; Krewer, U.; Herrmann, C.; Thiede, S. Simulating process-product interdependencies in battery production systems. Procedia CIRP 2018, 72, 346–351. [Google Scholar] [CrossRef]
  22. Heimes, H.H. Lithium-Ion Battery Cell Production Process; VDMA Battery Production: Frankfurt am Main, Germany, 2018; ISBN 978-3-947920-03-7. [Google Scholar]
  23. Bryntesen, S.N.; Strømman, A.H.; Tolstorebrov, I.; Shearing, P.R.; Lamb, J.J.; Stokke Burheim, O. opportunities for the state-of-the-art production of LIB electrodes—A review. Energies 2021, 14, 1406. [Google Scholar] [CrossRef]
  24. Liu, Y.; Zhang, R.; Wang, J.; Wang, Y. Current and future lithium-ion battery manufacturing. iScience 2021, 24, 102332. [Google Scholar] [CrossRef]
  25. Lithium-2022 Data-2017–2021 Historical-2023 Forecast-Price-Quote-Chart. Available online: https://tradingeconomics.com/commodity/lithium (accessed on 1 October 2021).
  26. Hakimian, A.; Kamarthi, S.; Erbis, S.; Abraham, K.M.; Cullinane, T.P.; Isaacs, J.A. Economic analysis of CNT lithium-ion battery manufacturing. Environ. Sci. Nano 2015, 2, 463–476. [Google Scholar] [CrossRef]
  27. Admin. Cost of Setting up a Battery Manufacturing Plant. Available online: https://www.electronicsb2b.com/important-sectors/cost-of-setting-up-a-battery-manufacturing-plant/ (accessed on 1 October 2021).
  28. Kirchain, R.; Field, F. Process-based cost modeling: Understanding the economics of technical decisions. Encycl. Mater. Sci. Eng. 2000, 2, 1718–1727. [Google Scholar] [CrossRef]
  29. Aromada, S.A.; Eldrup, N.H.; Normann, F.; Øi, L.E. Techno-economic assessment of different heat exchangers for CO2 capture. Energies 2020, 13, 6315. [Google Scholar] [CrossRef]
  30. Orangi, S.; Aromada, S.A.; Razi, N.; Øi, L.E. Simulation and Economic Analysis of MEA+PZ and MDEA+MEA Blends in Post-Combustion CO2 Capture Plant. Master’s Thesis, University of South-Eastern Norway, Notodden, Norway, 2021. [Google Scholar]
  31. Chung, D.; Elgqvist, E.; Santhanagopalan, S. Automotive Lithium-Ion Cell Manufacturing: Regional Cost Structures and Supply Chain Considerations. Available online: https://www.nrel.gov/docs/fy16osti/66086.pdf (accessed on 11 October 2021).
  32. Simon, R. Qualitåts-und Kostenoptimierung in Lithium-Ionen-Batteriefabriken. Available online: https://www.mwgroup.net/ (accessed on 11 October 2021).
  33. Statistics on Labour Costs. Available online: https://ilostat.ilo.org/topics/labour-costs/ (accessed on 23 December 2021).
  34. Eberhardt, K. Lean-Clean-Green-Fast/Requirements for Cost Effective Battery Factories; M+W Group: Stuttgart, Germany, 2018. [Google Scholar]
  35. Barnett, B.; Rempel, J.; Ofer, D.; Oh, B.; Sriramulu, S.; Sinha, J.; Hastbacka, M.; McCoy, C. PHEV Battery Cost Assessment. Available online: https://www.energy.gov/sites/prod/files/2014/03/f11/es001_barnett_2010_o.pdf (accessed on 11 October 2021).
  36. Pillot, C. The rechargeable battery market and main trends 2016–2025. In Proceedings of the 33rd Annual International Battery Seminar & Exhibit, Fort Lauderdale, FL, USA, 20 March 2017. [Google Scholar]
  37. Patry, G.; Romagny, A.; Martinet, S.; Froelich, D. Cost Modeling of lithium-ion battery cells for automotive applications. Energy Sci. Eng. 2015, 3, 71–82. [Google Scholar] [CrossRef]
  38. Freyr. Clean Battery Solutions for a Better Planet. Available online: https://s27.q4cdn.com/476984837/files/doc_presentation/ALUS-FREYR-Capital-Markets-Day-Presentation_Final.pdf (accessed on 28 December 2021).
  39. RUSITH Advantages and Disadvantages of Economies of Scale. Available online: https://learnbusinessconcepts.com/economies-of-scale-advantages-and-disadvantages/ (accessed on 28 December 2021).
  40. Nelson, P.A.; Ahmed, S.; Gallagher, K.G.; Dees, D.W. Cost savings for manufacturing lithium batteries in a flexible plant. J. Power Sources 2015, 283, 506–516. [Google Scholar] [CrossRef]
  41. Eberhardt, K. Smart Size Battery Cell Factory—Battery Production Technology; M+W Group: Stuttgart, Germany, 2017. [Google Scholar]
  42. Leader, A.; Gaustad, G.; Babbitt, C. The effect of critical material prices on the competitiveness of clean energy technologies. Mater. Renew. Sustain. Energy 2019, 8, 8. [Google Scholar] [CrossRef]
  43. Goldie-Scot, L. A Behind the Scenes Take on Lithium-Ion Battery Prices. Available online: https://about.newenergyfinance.com/blog/behind-scenes-take-lithium-ion-battery-prices/ (accessed on 6 June 2022).
  44. Schnell, J.; Knörzer, H.; Imbsweiler, A.J.; Reinhart, G. Solid versus liquid—A bottom-up calculation model to analyze the manufacturing cost of future high-energy batteries. Energy Technol. 2020, 8, 1901237. [Google Scholar] [CrossRef]
  45. Brodd, R.J.; Helou, C. Cost comparison of producing high-performance li-ion batteries in the U.S. and in China. J. Power Sources 2013, 231, 293–300. [Google Scholar] [CrossRef]
  46. Bühler, A.G. Efficient Continuous Electrode Slurry Production; Bühler AG: Uzwil, Switzerland, 2021. [Google Scholar]
  47. Eggert, D. Michigan Considers New Incentives to Land Battery Plants, Major Business Expansions. Available online: https://www.clickondetroit.com/business/2021/12/08/michigan-considers-new-incentives-to-land-battery-plants-major-business-expansions/ (accessed on 23 December 2021).
  48. Activate Conductive Low Price Carbon Black Powder Rubber Ingredient For Pigment—Buy Activate Conductive Low Price Carbon Black Powder, Rubber Ingredient, Pigment Product on Alibaba.Com. Available online: https://www.alibaba.com/product-detail/Conductive-Price-Carbon-Black-Carbon-Powder_1600276095965.html?spm=a2700.7724857.normal_offer.d_title.3d10605cOH7ugH&s=p (accessed on 20 November 2021).
  49. Kennedy, T.; Brandon, M.; Ryan, K.M. Advances in the Application of Silicon and Germanium Nanowires for High-Performance Lithium-Ion Batteries. Advanced Mater. 2016, 28, 5696–5704. [Google Scholar] [CrossRef]
  50. High Quality Separator For Lithium Ion Battery–Buy Battery Separator, Battery Separator For Li-Ion Battery, Lithium Ion Battery Separator Product on Alibaba.Com. Available online: https://www.alibaba.com/product-detail/Separator-Lithium-Ion-Battery-High-Quality_62326953713.html?spm=a2700.7724857.normal_offer.d_title.3c757f29koxhON&s=p (accessed on 20 February 2022).
  51. 012mm 0.035mm 1235 1060 1070 H18 Aluminum Battery Foil For Lithium Ion Battery Current Collector Materials—Buy 0.012mm 0.035mm Which Product For Lithium Ion Battery Current Collector Materials 1235 1060 1070 H18 Aluminum Battery Foil, Aluminum Foil, 0.012mm 0.035mm Which Product For Lithium Ion Battery Current Collector Materials 1235 1060 1070 H18 Aluminum Battery Foil Product on Alibaba.Com. Available online: https://www.alibaba.com/product-detail/0-012mm-0-035mm-1235-1060_60793531762.html?spm=a2700.7724857.normal_offer.d_title.1fdc194c8nwBti (accessed on 1 October 2021).
  52. [Hot Item] High Purity Soft Temper Pure Copper Foil. Available online: https://intcnc.en.made-in-china.com/product/tSuQRDGyaCrW/China-High-Purity-Soft-Temper-Pure-Copper-Foil.html (accessed on 20 February 2022).
  53. Xe Currency Converter—Live Exchange Rates Today. Available online: https://www.xe.com/currencyconverter/ (accessed on 23 December 2021).
  54. Tribe, M.; Alpine, R.L.W. Scale Economies and the “0.6 Rule”. Eng. Costs Prod. Econ. 1986, 10, 271–278. [Google Scholar] [CrossRef]
  55. Zang, G.; Zhang, J.; Xu, S.; Xing, Y. Techno-Economic Analysis of Cathode Material Production Using Flame-Assisted Spray Pyrolysis. Energy 2021, 218, 119504. [Google Scholar] [CrossRef]
  56. Ahmed, S.; Nelson, P.A.; Gallagher, K.G.; Susarla, N.; Dees, D.W. Cost and Energy Demand of Producing Nickel Manganese Cobalt Cathode Material for Lithium Ion Batteries. J. Power Sources 2017, 342, 733–740. [Google Scholar] [CrossRef]
  57. Granata, G.; Ferreira, R.; Petrides, D. Production of Lithium Ion Battery Cathode Material (NMC 811) from Primary and Secondary Raw Materials—Techno-Economic Assessment with SuperPro Designer. Available online: https://www.researchgate.net/publication/340593316_Production_of_Lithium_Ion_Battery_Cathode_Material_NMC_811_from_Primary_and_Secondary_Raw_Materials_-_Techno-Economic_Assessment_with_SuperPro_Designer (accessed on 23 December 2021).
  58. Manufacturing Labor Costs per Hour: China, Vietnam, Mexico 2016–2020. Available online: https://www.statista.com/statistics/744071/manufacturing-labor-costs-per-hour-china-vietnam-mexico/ (accessed on 23 December 2021).
  59. National Bureau of Statistics of China Average Annual Wage of Employed Persons in Different Positions in Enterprises above Designated Size in 2019. Available online: http://www.stats.gov.cn/english/PressRelease/202005/t20200518_1746069.html (accessed on 23 December 2021).
  60. Workers in China Set to See a Real Salary Increase of 3.6% in 2020. Available online: https://www.eca-international.com/News/November-2019/Workers-in-China-set-to-see-a-real-salary-increase (accessed on 23 December 2021).
  61. South Korea Total Monthly Wages in Manufacturing—2021 Data—2022 Forecast. Available online: https://tradingeconomics.com/south-korea/wages-in-manufacturing (accessed on 1 December 2021).
  62. Australian Trade and Investment Commission THE LITHIUM-ION BATTERY VALUE CHAIN—New Economy Opportunities for Australia; Australian Trade and Investment Commission: Sydney, Australia, 2018.
  63. ホーム|厚生労働省. Available online: https://www.mhlw.go.jp/index.html (accessed on 26 July 2022).
  64. Electricity Prices around the World. Available online: https://www.globalpetrolprices.com/electricity_prices/ (accessed on 1 October 2021).
  65. International Construction Market Survey 2021. Available online: https://ontarioconstructionnews.com/wp-content/uploads/2021/07/798439_international-construction-market-survey-2021-web.pdf (accessed on 1 October 2021).
  66. Philippot, M.; Alvarez, G.; Ayerbe, E.; Van Mierlo, J.; Messagie, M. Eco-Efficiency of a Lithium-Ion Battery for Electric Vehicles: Influence of Manufacturing Country and Commodity Prices on GHG Emissions and Costs. Batteries 2019, 5, 23. [Google Scholar] [CrossRef]
  67. United States Average Hourly Wages in Manufacturing—January 2022 Data. Available online: https://tradingeconomics.com/united-states/wages-in-manufacturing (accessed on 23 December 2021).
  68. Real Interest Rate By Country. Available online: https://tradingeconomics.com/country-list/real-interest-rate-percent-wb-data.html (accessed on 1 December 2021).
  69. Republic of Korea Real Interest Rate, 1960–2021—Knoema.Com. Available online: https://knoema.com//atlas/Republic-of-Korea/topics/Economy/Financial-Sector-Interest-rates/Real-interest-rate (accessed on 1 December 2021).
  70. Berger, R. The Lithium-Ion Battery Value Chain. In Proceedings of the Name of the F-Cell Conference, Stuttgart, Germany, 9 October 2012. [Google Scholar]
  71. Wood, D.L.; Li, J.; Daniel, C. Prospects for Reducing the Processing Cost of Lithium Ion Batteries. J. Power Sources 2015, 275, 234–242. [Google Scholar] [CrossRef]
  72. Berckmans, G.; Messagie, M.; Smekens, J.; Omar, N.; Vanhaverbeke, L.; Van Mierlo, J. Cost Projection of State of the Art Lithium-Ion Batteries for Electric Vehicles Up to 2030. Energies 2017, 10, 1314. [Google Scholar] [CrossRef]
  73. Wang, F.; Deng, Y.; Yuan, C. Design and Cost Modeling of High Capacity Lithium Ion Batteries for Electric Vehicles through A Techno-Economic Analysis Approach. Procedia Manuf. 2020, 49, 24–31. [Google Scholar] [CrossRef]
  74. Henze, V. Battery Pack Prices Cited Below $100/KWh for the First Time in 2020, While Market Average Sits at $137/KWh. Available online: https://about.bnef.com/blog/battery-pack-prices-cited-below-100-kwh-for-the-first-time-in-2020-while-market-average-sits-at-137-kwh/ (accessed on 27 December 2021).
  75. Ziegler, M.S.; Trancik, J.E. Re-Examining Rates of Lithium-Ion Battery Technology Improvement and Cost Decline. Energy Environ. Sci. 2021, 14, 1635–1651. [Google Scholar] [CrossRef]
  76. Edelstein, S. Report: EV Battery Costs Hit Another Low in 2021, but They Might Rise in 2022. Available online: https://www.greencarreports.com/news/1134307_report-ev-battery-costs-might-rise-in-2022 (accessed on 1 December 2021).
  77. DOE Estimates That EV Battery Pack Costs in 2021 Are 87% Lower than in 2008. Available online: https://www.greencarcongress.com/2021/10/20211005-fotw.html (accessed on 23 December 2021).
  78. Kochhan, R.; Fuchs, S.; Reuter, B.; Burda, P.; Matz, S.; Lienkamp, M. An Overview of Costs for Vehicle Components, Fuels and Greenhouse Gas Emissions. Available online: https://www.researchgate.net/publication/260339436_An_Overview_of_Costs_for_Vehicle_Components_Fuels_and_Greenhouse_Gas_Emissions (accessed on 23 December 2021).
  79. Cano, Z.P.; Banham, D.; Ye, S.; Hintennach, A.; Lu, J.; Fowler, M.; Chen, Z. Batteries and Fuel Cells for Emerging Electric Vehicle Markets. Nat. Energy 2018, 3, 279–289. [Google Scholar] [CrossRef]
  80. Voelcker, J. Electric-Car Battery Costs: Tesla $190 per Kwh for Pack, GM $145 for Cells. Available online: https://www.greencarreports.com/news/1103667_electric-car-battery-costs-tesla-190-per-kwh-for-pack-gm-145-for-cells (accessed on 28 December 2021).
  81. Kittner, N.; Lill, F.; Kammen, D.M. Energy Storage Deployment and Innovation for the Clean Energy Transition. Nat Energy 2017, 2, 1–6. [Google Scholar] [CrossRef]
  82. Kwade, A.; Haselrieder, W.; Leithoff, R.; Modlinger, A.; Dietrich, F.; Droeder, K. Current Status and Challenges for Automotive Battery Production Technologies. Nat. Energy 2018, 3, 290–300. [Google Scholar] [CrossRef]
Figure 1. Applied process-based structure for developing cost model in the present study.
Batteries 08 00083 g001
Figure 2. The process steps applied in the battery cell production plant.
Batteries 08 00083 g002
Figure 3. Cost breakdown for the NMC111-G battery cell assumed as a case study for 9 different locations around the world.
Batteries 08 00083 g003
Figure 4. Cost breakdown for material and machinery in Figure 3 for the location of US: (a) The breakdown of material cost layer; (b) The breakdown of machinery and installation cost layer (The dry room includes the dry room control, contacting, inserting, sealing, filling, and final sealing).
Batteries 08 00083 g004
Figure 5. The total cost of cells in different sources, based on the year of the project (The red dots in Figure 5 are the results of the case study and the minimum efficient scale for the US location in this work, and the black dots show the results extracted from other cost models), (Numbers on Figure 5 are based on Table S6).
Batteries 08 00083 g005
Figure 6. Stacked diagram of applied cost layers for the production of NMC111-G prismatic cell in the US (black dashed line tracks the lowest price of the total battery cell cost).
Batteries 08 00083 g006
Figure 7. Sensitivity of the developed cost model to chemistries for the production capacity of 5.3 GWh per year. The location of this analysis has been presumed to be the US.
Batteries 08 00083 g007
Figure 8. The sensitivity of the developed case study to the different parameters. The location for this analysis is assumed to be the US. (Dashed lines indicate the assumptions for the base case study of this work, listed in Tables S1 and S4).
Batteries 08 00083 g008
Publisher’s Note: MDPI stays neutral with regard to jurisdictional claims in published maps and institutional affiliations.

