1. Introduction
Lithium-ion batteries (LIBs) are an established and growing technology with useful applications in diverse fields. According to the International Renewable Energy Agency, annual manufacturing capacity of LIBs’ energy storage is set to quadruple from 2021 to 2025 from 625 GWh to 2500 GWh [
1]. Battery electric vehicles (EV) are already the largest user of LIBs and are expected to demand far more in the future: they are slated to dominate the passenger vehicle market with the majority of sales by 2035 [
2]. There is significant incentive to improve state of charge (SOC) and state of health (SOH) monitoring as these are pertinent aspects for EV usage and their battery management system (BMS) throughout the lifetime of operation.
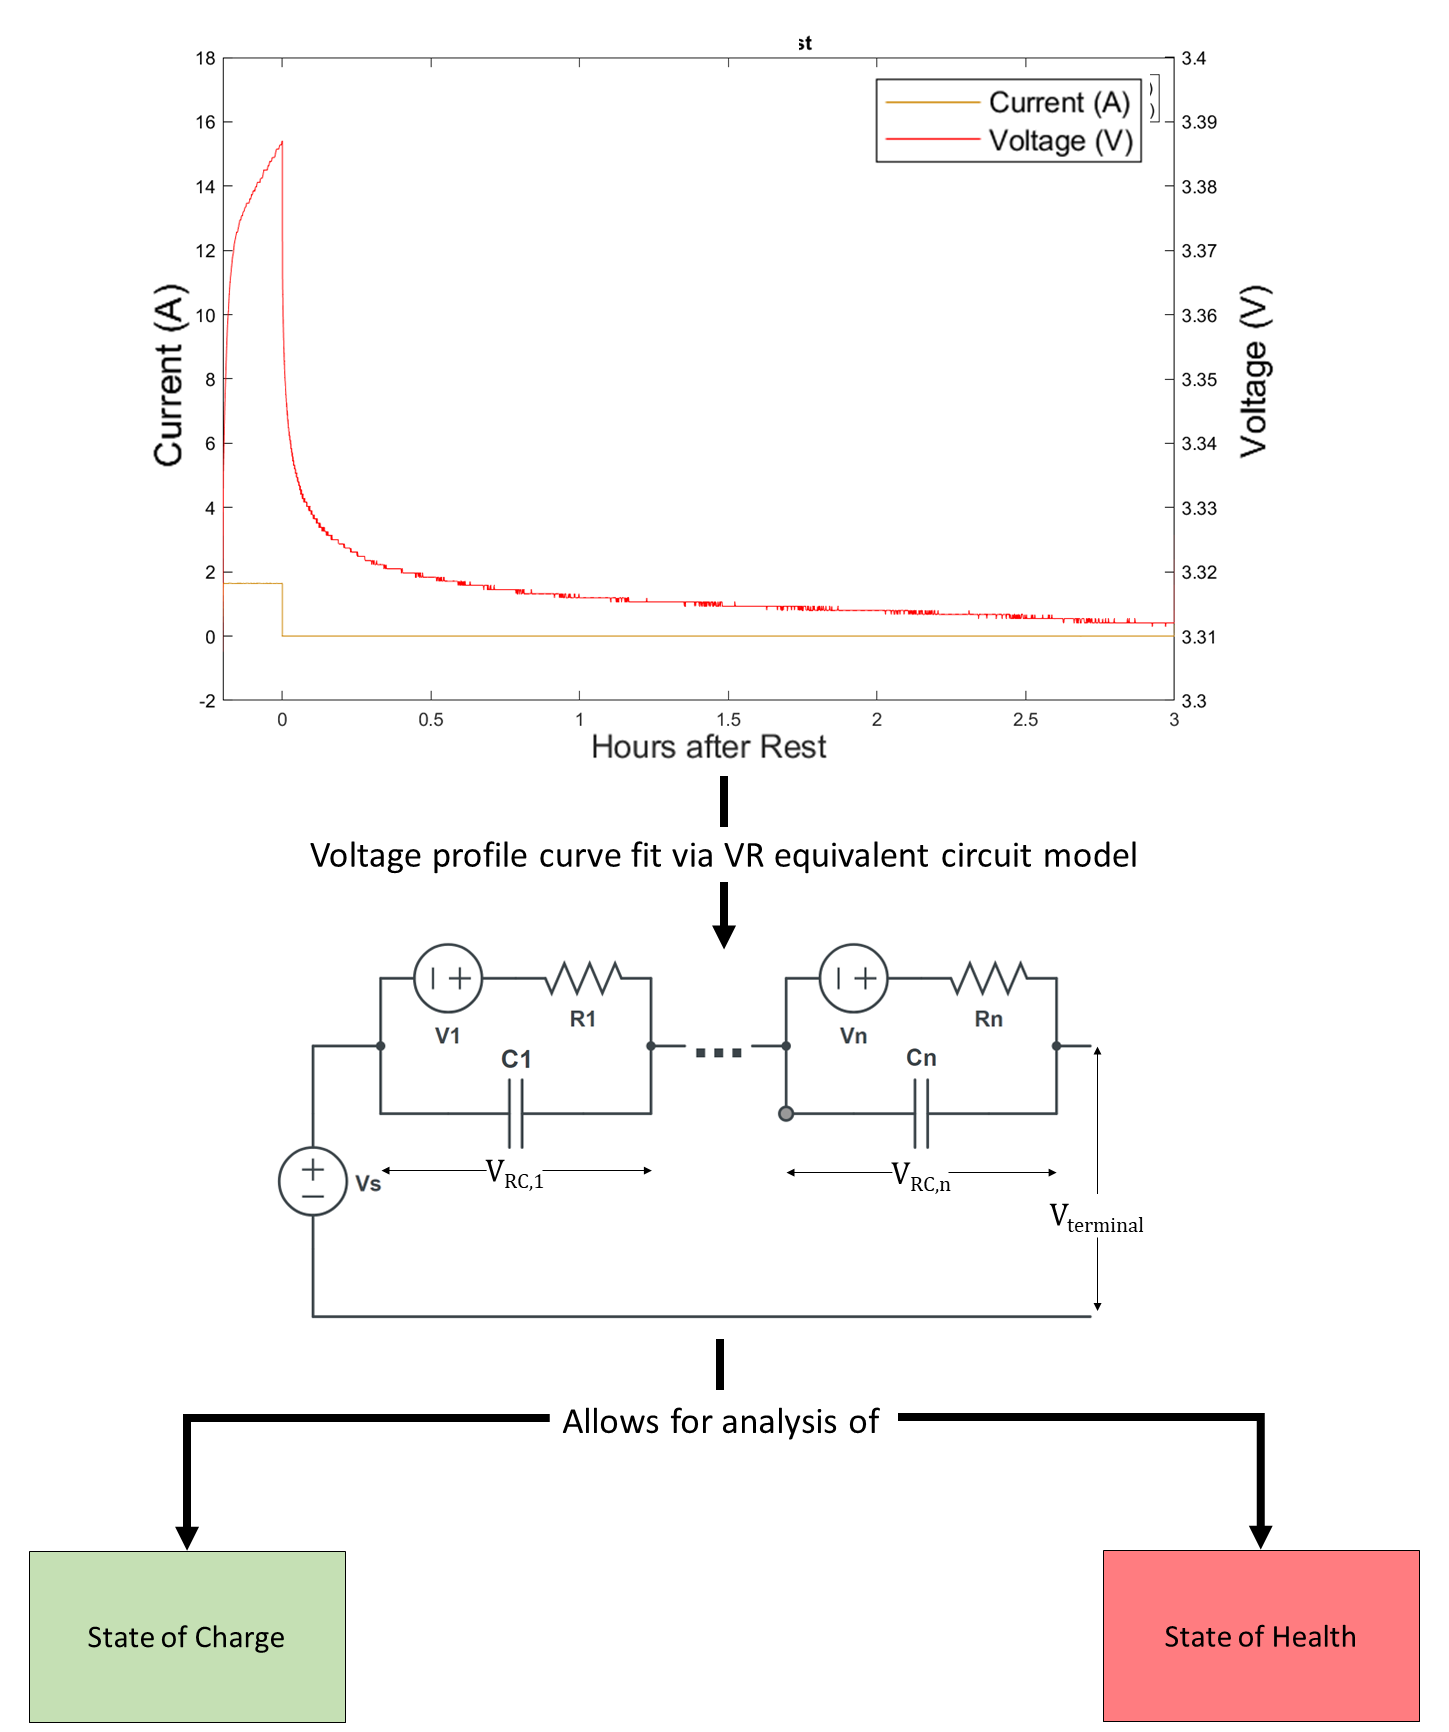
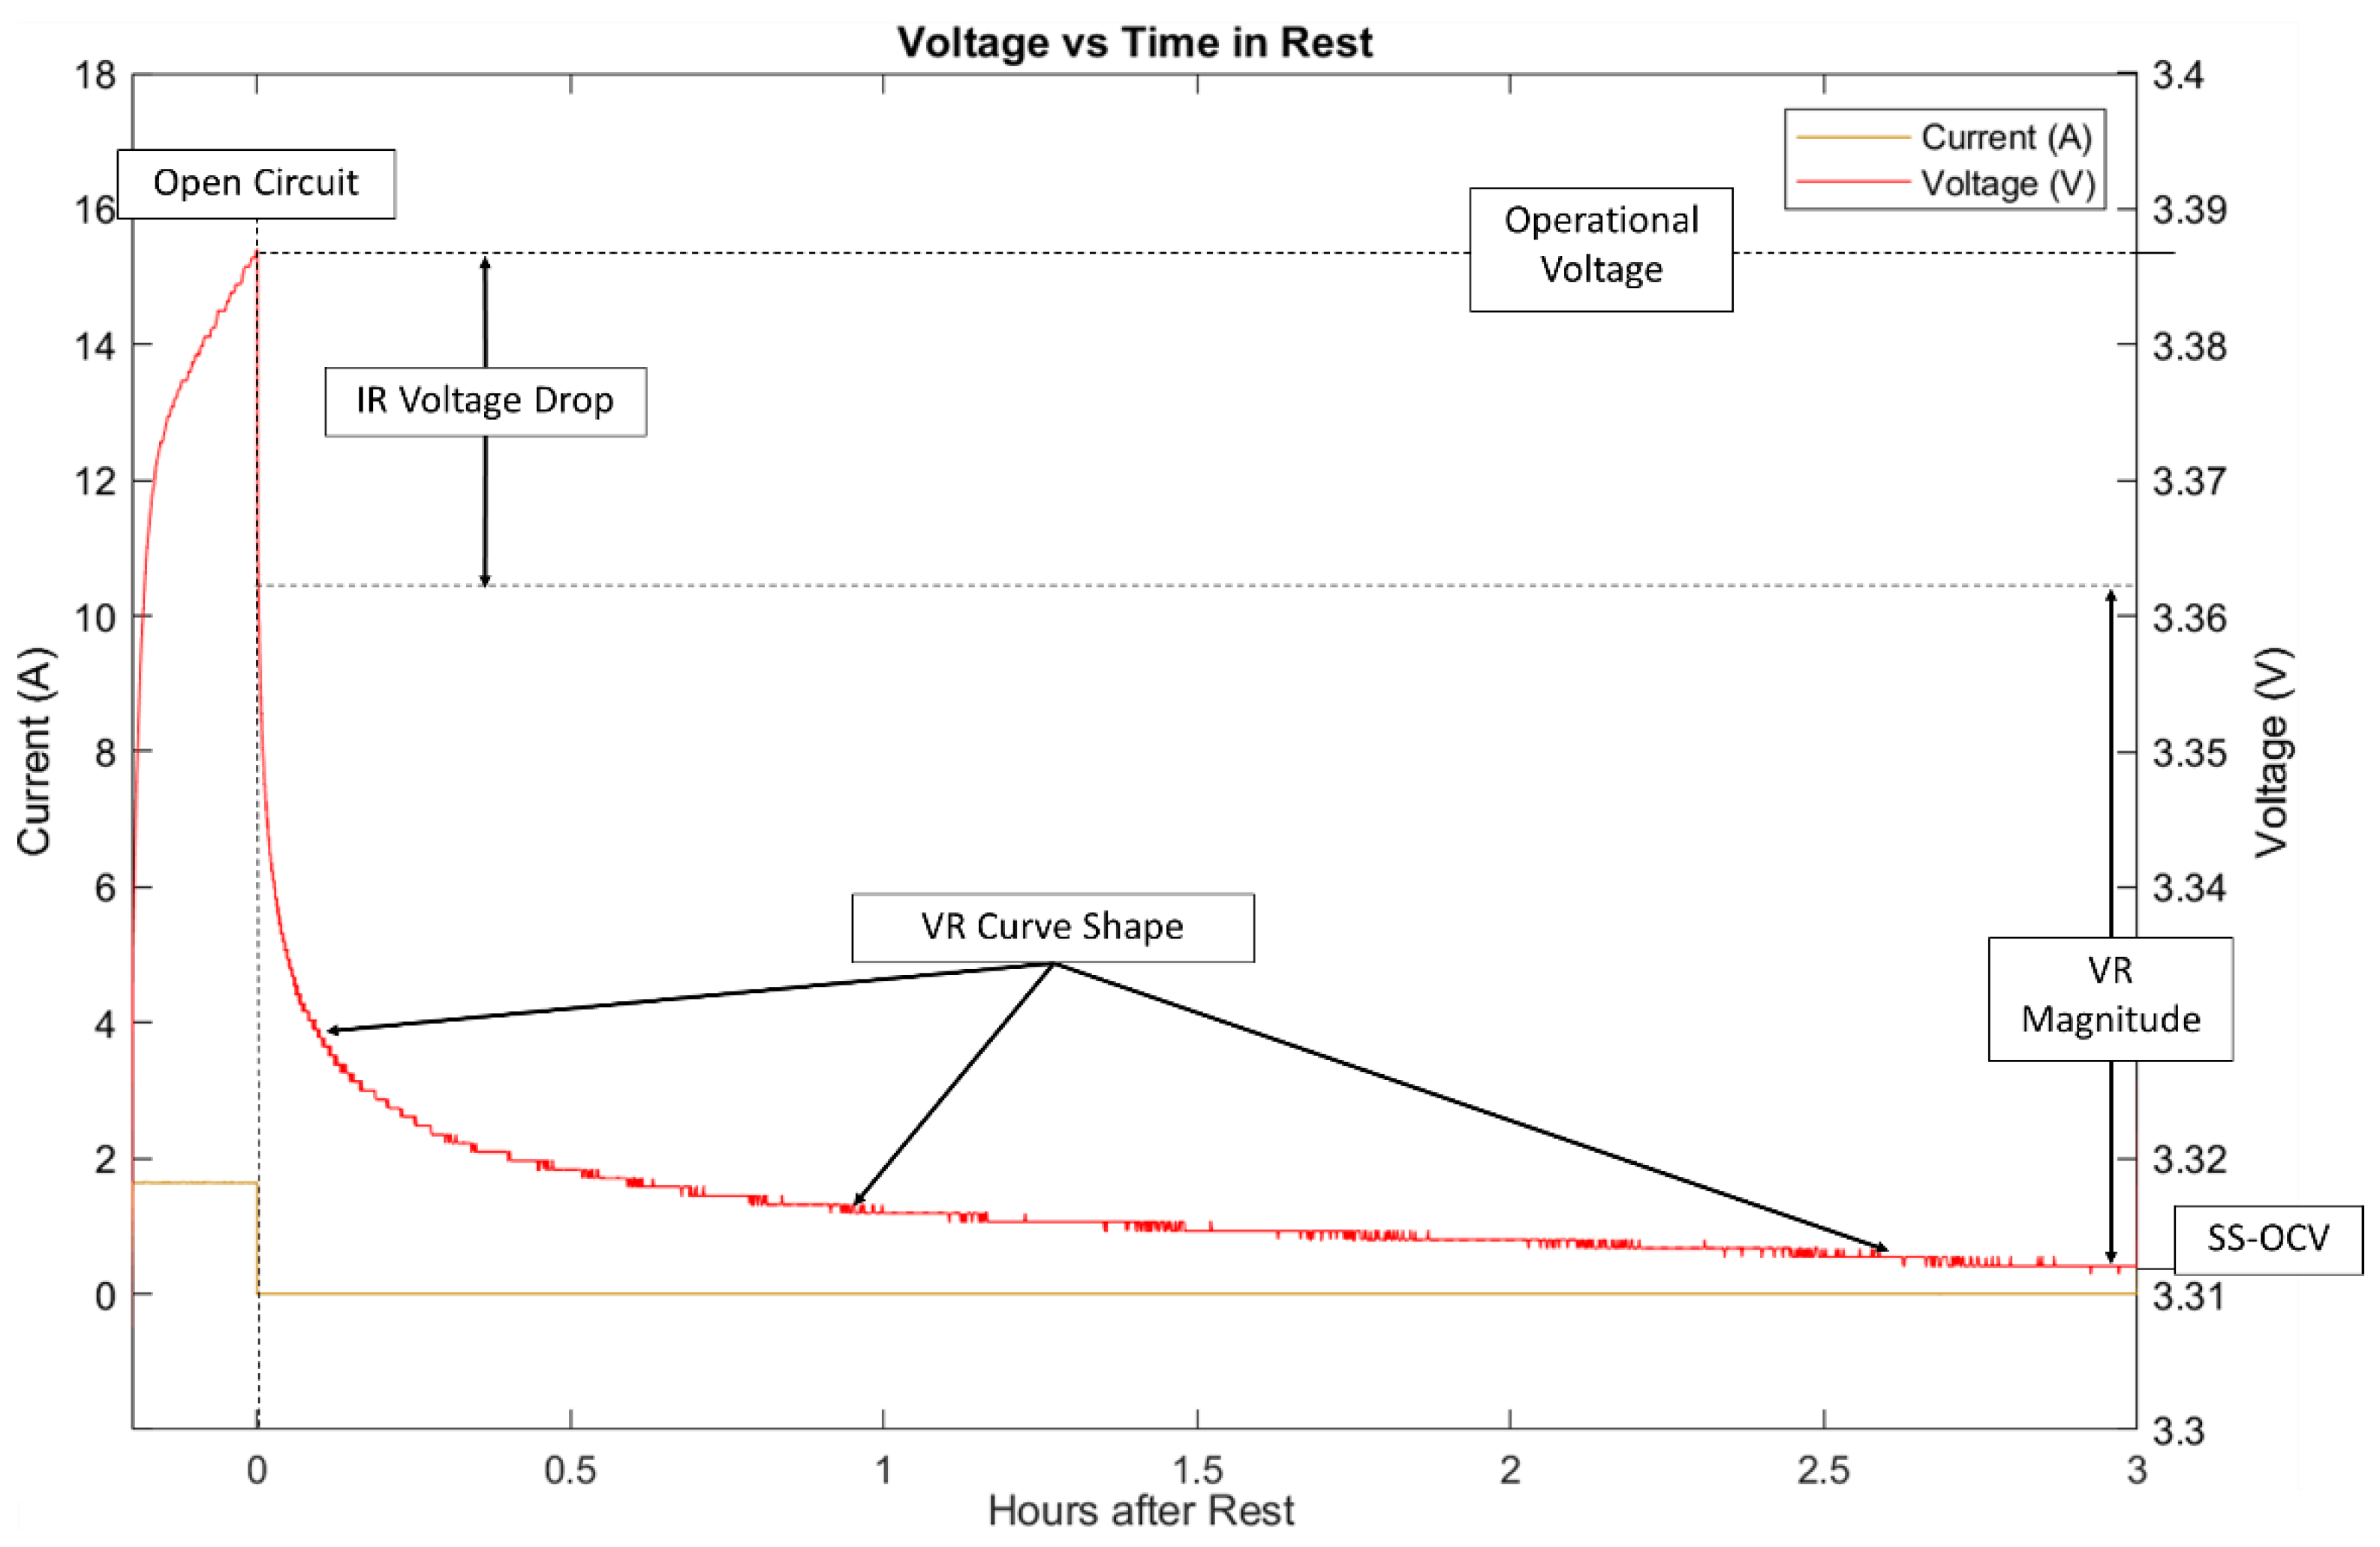
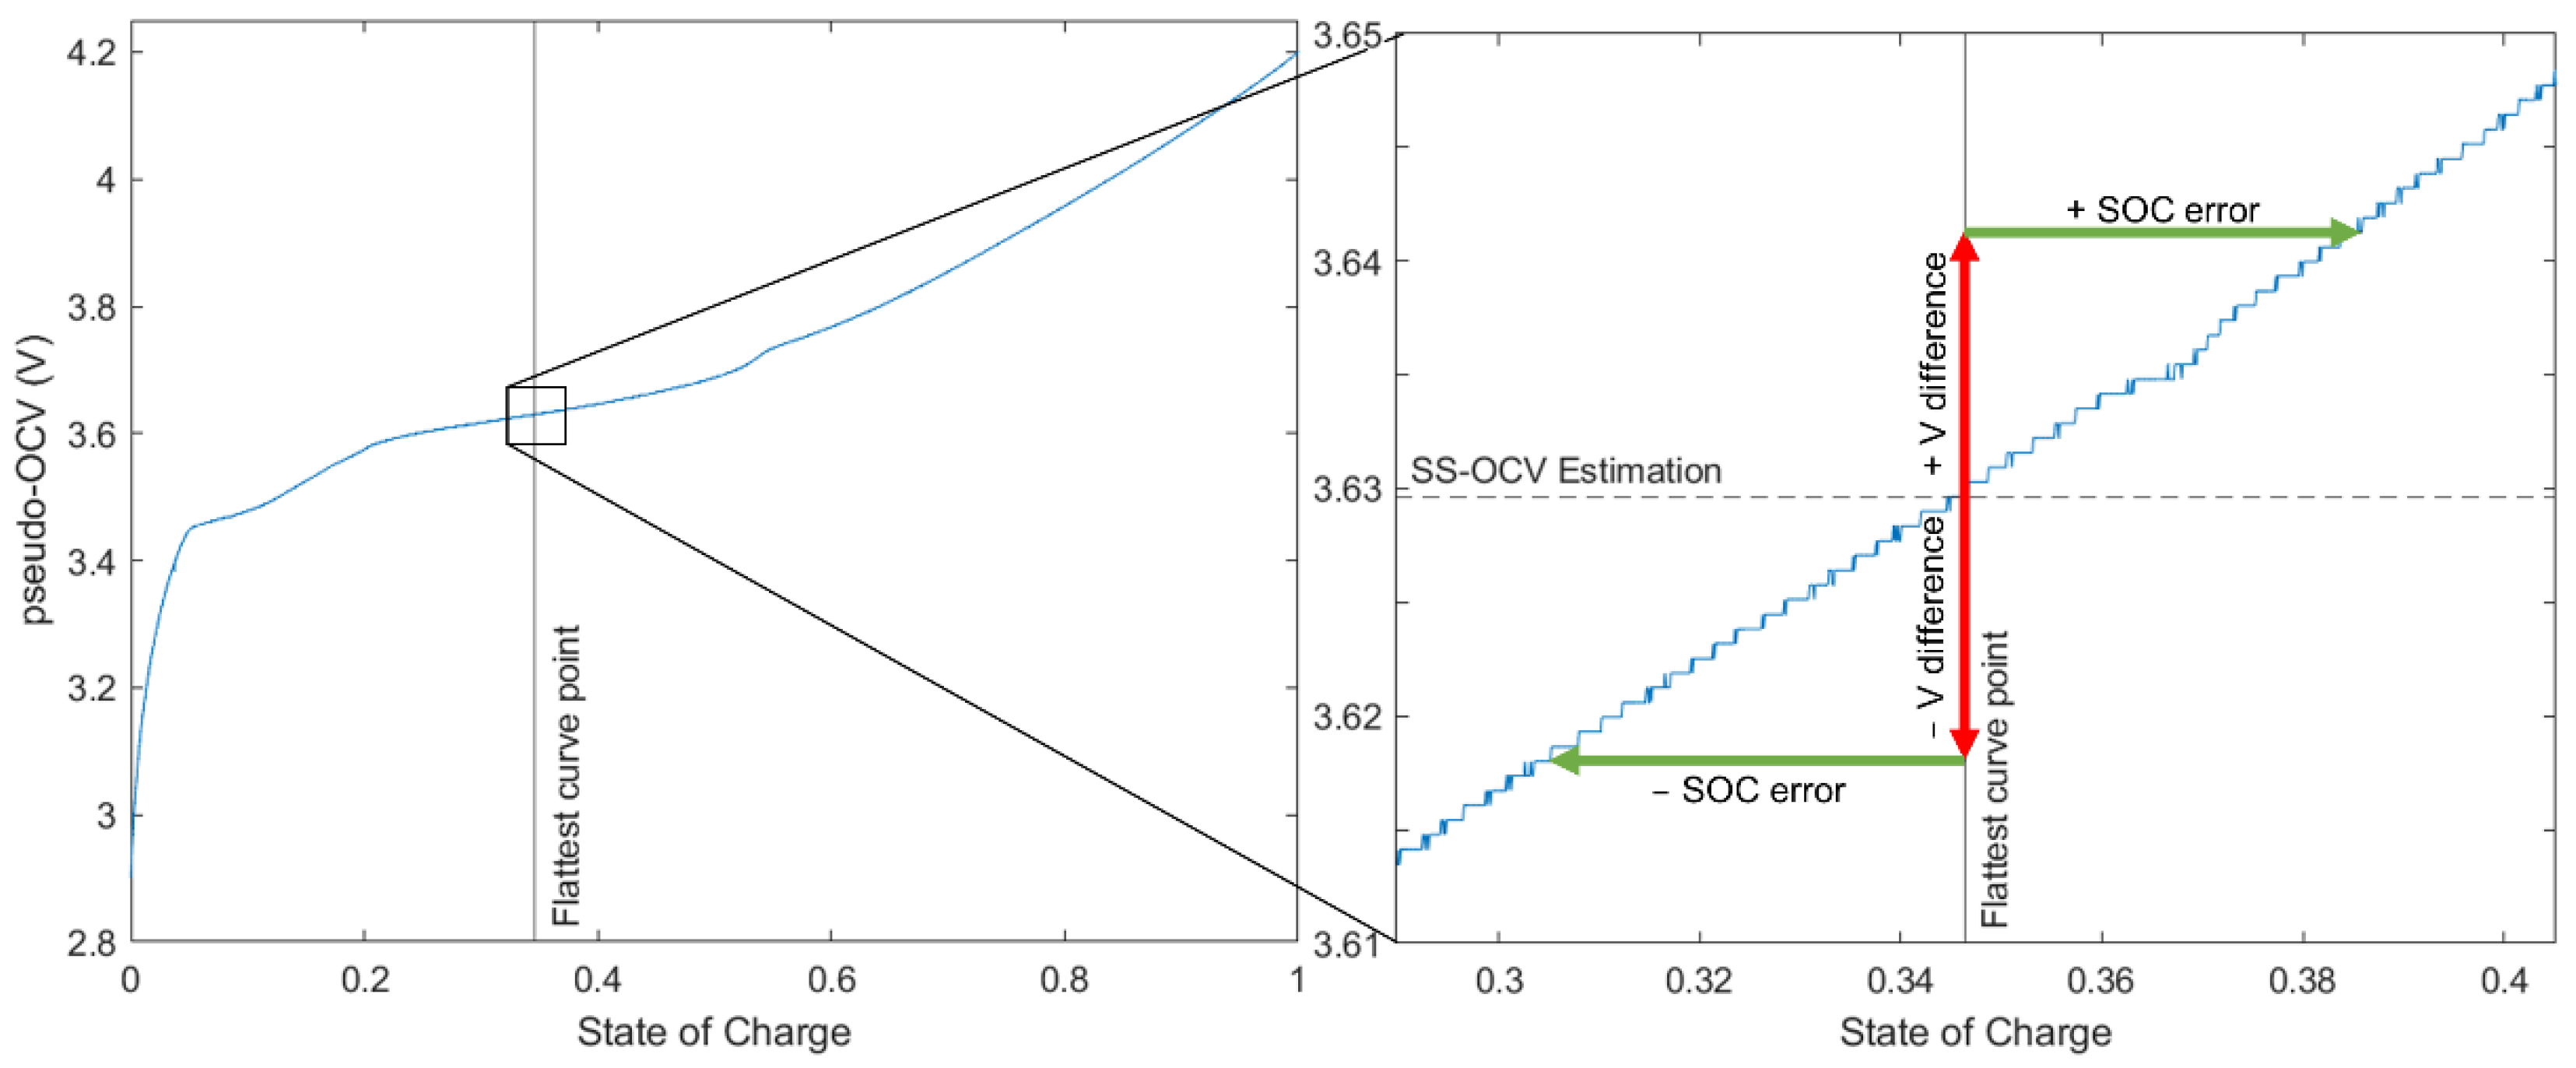
Open circuit voltage relaxation (VR) is an electrochemical process that occurs after current passing through a battery is interrupted and the internal resistance (IR) drop in voltage has occurred. The voltage relaxes back to a steady state open circuit voltage (SS-OCV). It is important to note that in this context, SS-OCV refers to the final resting voltage of the cells as shown in
Figure 1. This relaxation process occurs since there is a gradient of lithium ions through the positive electrode that reduces to a minimum energy state after a partial charge or discharge. Because voltage is determined by the surface concentration of lithium ions in an electrode, this gradient across the electrode disperses with time and affects the voltage at the battery terminals.
The shape and magnitude of the VR have been used for electrochemical evaluation of the battery. Skrob et al. [
3] observed there are two primary response domains in VR corresponding to fast (0–2 min), and slow (0.3–3.0+ h). The fast domain is dependent on the preceding current magnitude, positive electrode thickness, and electrochemical active area. The slow domain is dependent on preceding current magnitude, a minimum coulombic transfer (Ah) and the positive electrode SOH. Consequently, short current pulses of less than 30 s are not typically useful for VR investigation. As the battery becomes worn and aged the coulombic capacity will decrease and the electrode particle radius will increase. This will cause the lithium-ion diffusion rate to decrease and change both the VR magnitude and curve shape [
4]. From this research it can be reasoned that battery health determinants will be first observed in the fast domain, and then later in the slow domain as the SOH decreases further. These domains have been modeled by studies using different methods and approaches.
Ungurean et al. [
5] summarized that there are three types of battery models for individual cycle performance. First is an equivalent circuit model where batteries are simplified to an ideal voltage source in series with resistors and resistor/capacitor pairs. Petzl et al. [
6] curve fit an equivalent circuit model to VR data. They then evaluated the model performance over a range of SOC in 5% increments (charging) and decrements (discharging). They used a lithium iron phosphate (LFP) cell with relaxation periods ranging from 6 min to 5 h. They state that the cell is fully relaxed at the 5 h mark and that they could estimate SS-OCV within 4 mV with a model that contains 2 RC pairs. This is different from Li et al. [
7] who claim 1 h is required with a 5 RC model that has been trained on previous data of 5 h rests. For cells with large staging effects such as nickel manganese cobalt (NMC) 4 mV of error may be acceptable for estimating SOC, however for a battery with a flatter voltage profile, such as LFP, this could lead to significant error in SOC estimation (>5%). They also showed that the VR model was useful to examine the effects of staging in the negative electrode, which give insights to the SOH.
Second is an electrochemical model based on the processes that are occurring in the battery. Hu et al. [
8] use partial differential equations based on electrochemical principles. They modeled VR periods from 10 to 138 min at temperatures of 10 °C and 40 °C over a wide of range of SOC. They propose a schedule of short charge and discharge pulses to achieve SS-OCV faster than regular VR. They suggest it works by balancing the concentration of lithium in the positive electrode, electrolyte, and negative electrode via precise charge and discharge pulses. Because they are pulsing quickly the behavior can only be modeled by the more computationally complex models. They claim the model can estimate SS-OCV within 2 mV while saving 33% to 78% of the testing time depending on the cell temperature. A 2 mV error would give an error of estimation of 4% SOC for a LFP cell.
Finally, there is a purely mathematical model which predicts the function of the battery by finding an equation that represents the voltage and current dynamics. A linear ordinary differential equation was used by Pei et al. [
9] on LFP and lithium manganese oxide (LMO) cells. This equation was curve fit to four tests which approached various SOC values from charge and discharge. The VR period lasted for 24 h, though only the first 60 min are shown. They show that for LMO batteries this model is valid for all SOC values, and that for LFP it is only valid for certain regions since there is more sensitivity required to make SOC estimations. They make an important distinction of current polarity, charge or discharge, is made. As shown by Skrob et al. [
3] there is a weak relationship between current polarity and the shape of the voltage vs time curve during relaxation. This relationship, while not as dominant as other factors, is shown to be significant for curve fitting, and so must consider the polarity of current before the relaxation period.
Combinations of modeling techniques also exist, such as Baghdadi et al. [
10] which used a combined electrochemical and mathematical model on NMC and LFP cells to use VR to predict SS-OCV and the SOH. The cells were charged to 100% SOC and left to relax for 30 min, which was stated to be the final SS-OCV value. Groups of cells were then degraded via cycling or calendar ageing. VR tests were repeated throughout the life of the batteries. They correlate increasing VR magnitude with decreasing SOH with cycling. The VR magnitude increased between 3 and 36 mV, depending on chemistry and temperature.
A combination of modeling techniques was also used by Baccouche [
11] who used VR to predict SS-OCV as a proxy for SOC of NMC batteries. Here a novel mixed polynomial, logarithmic, and exponential function in conjunction with Kalman filtering was presented. Their test caused a 5% decrease/increase in SOC followed by a 30-min rest. It started in the fully charged condition, then fully discharged, and then fully re-charged. The model was shown to predict SOC within 5% for temperatures in the range of 5 to 45 °C.
VR investigations typically fall into one of two categories: SOC estimation and SOH evaluation. Most commonly, the VR is used to estimate SS-OCV and correlate to SOC, via a lookup table. Some studies evaluate at singular SOC points which are not consistent, and do not account for the changing shape of VR curves at different SOC values. Other studies use a range of SOC values approaching from charge and discharge. The length of relaxation can be from 6 min to 24 h, with claims of being fully rested at any of these values. The modeling techniques are different, and even similar models used different curve fitting methods. This makes it difficult to compare or contrast the findings of these studies or translate them into useful or practical applications for assessing SOC or SOH of a battery.
This leads to four research questions to improve the consistency of VR studies:
How does the VR magnitude and curve shape change as a function of SOC value?
What period of time is necessary for the battery to be considered fully rested at SS-OCV?
For estimating SOC, how complex must a model be, and how short can the VR period be, to accurately determine SS-OCV?
For estimating SOH, how complex must a model be, and how short can the VR period be, at a sensitive SOC position, to accurately capture VR magnitude and curve shape?
To be practical for use in applications some guidelines can be established:
- 5.
The model should capture the dynamic behavior of the voltage curve while being computationally simple to curve fit.
- 6.
VR for SOH evaluation will likely be implemented during charge as most applications have specific demands during discharge that prohibit long open circuit conditions. For example, EV and mobile devices are often left unattended while charging thus presenting a VR opportunity.
- 7.
The model must function over the complete SOC operating range.
- 8.
A consistent SOC for SOH estimation must be chosen to maximize VR magnitude sensitivity and curve shape changes for estimating SOH.
Using these guidelines to restrict the scope, the objective of this present study is to develop and trial a VR methodology to address the research questions for a range of LIB chemistries.
2. Materials and Methods
Three commercially available LIB chemistries were selected and used for experimentation and characterization of VR. The testing environment was held constant at 20 °C with a 1 °C tolerance. Two separate tests were conducted. The first conducts a cycle interrupted with 3 h relaxation periods over the complete SOC range in 10% decrements (discharging) and increments (charging). The first test is to address research question 1 evaluating VR magnitude as a function of SOC and determine what value of SOC maximizes VR magnitude.
The second test conducts a 24 h relaxation at the SOC with highest VR magnitude to determine the necessary time required for full relaxation to SS-OCV to occur. This second test is to address research question 2 by evaluating the time to become “fully rested”.
Timeseries measurements of the voltage and current were acquired during testing at 0.1 s rate for the first 30 min then at 5 s rate for the remaining 23 h and 30 min. The voltage timeseries of VR was curve fit to a model in MATLAB software. This was evaluated for goodness of fit to answer research questions 3 and 4 focused on model complexity and necessary relaxation period.
Tests were then repeated on a second group of cells for validation and statistical significance
2.1. Cells
The lithium-ion cells used in this experiment are high-quality commercially available cylindrical cells of the size format 18–65 (18 mm diameter, 65 mm length). All cells have graphitic negative electrodes. The three cells chosen have different positive electrode materials which is how they are distinguished:
Panasonic NCR18650B (Nickel Cobalt Aluminum [NCA] positive electrode);
LG Chem INR18650B4 (Nickel Manganese Cobalt [NMC532] positive electrode, henceforth NMC refers to 532 composition unless otherwise stated.);
Lithium Werks APR18650m1B (Lithium Iron Phosphate [LFP] positive electrode; “nanophosphate”).
All cells have been designed for and deployed in a variety of applications including power tools, medical devices, EVs, E-bikes, and uninterruptable power supplies. Cells were purchased from reputable vendors and tested to verify that they met capacity specifications. Their specifications of coulombic capacity, power capability, and cycle life are shown in
Table 1.
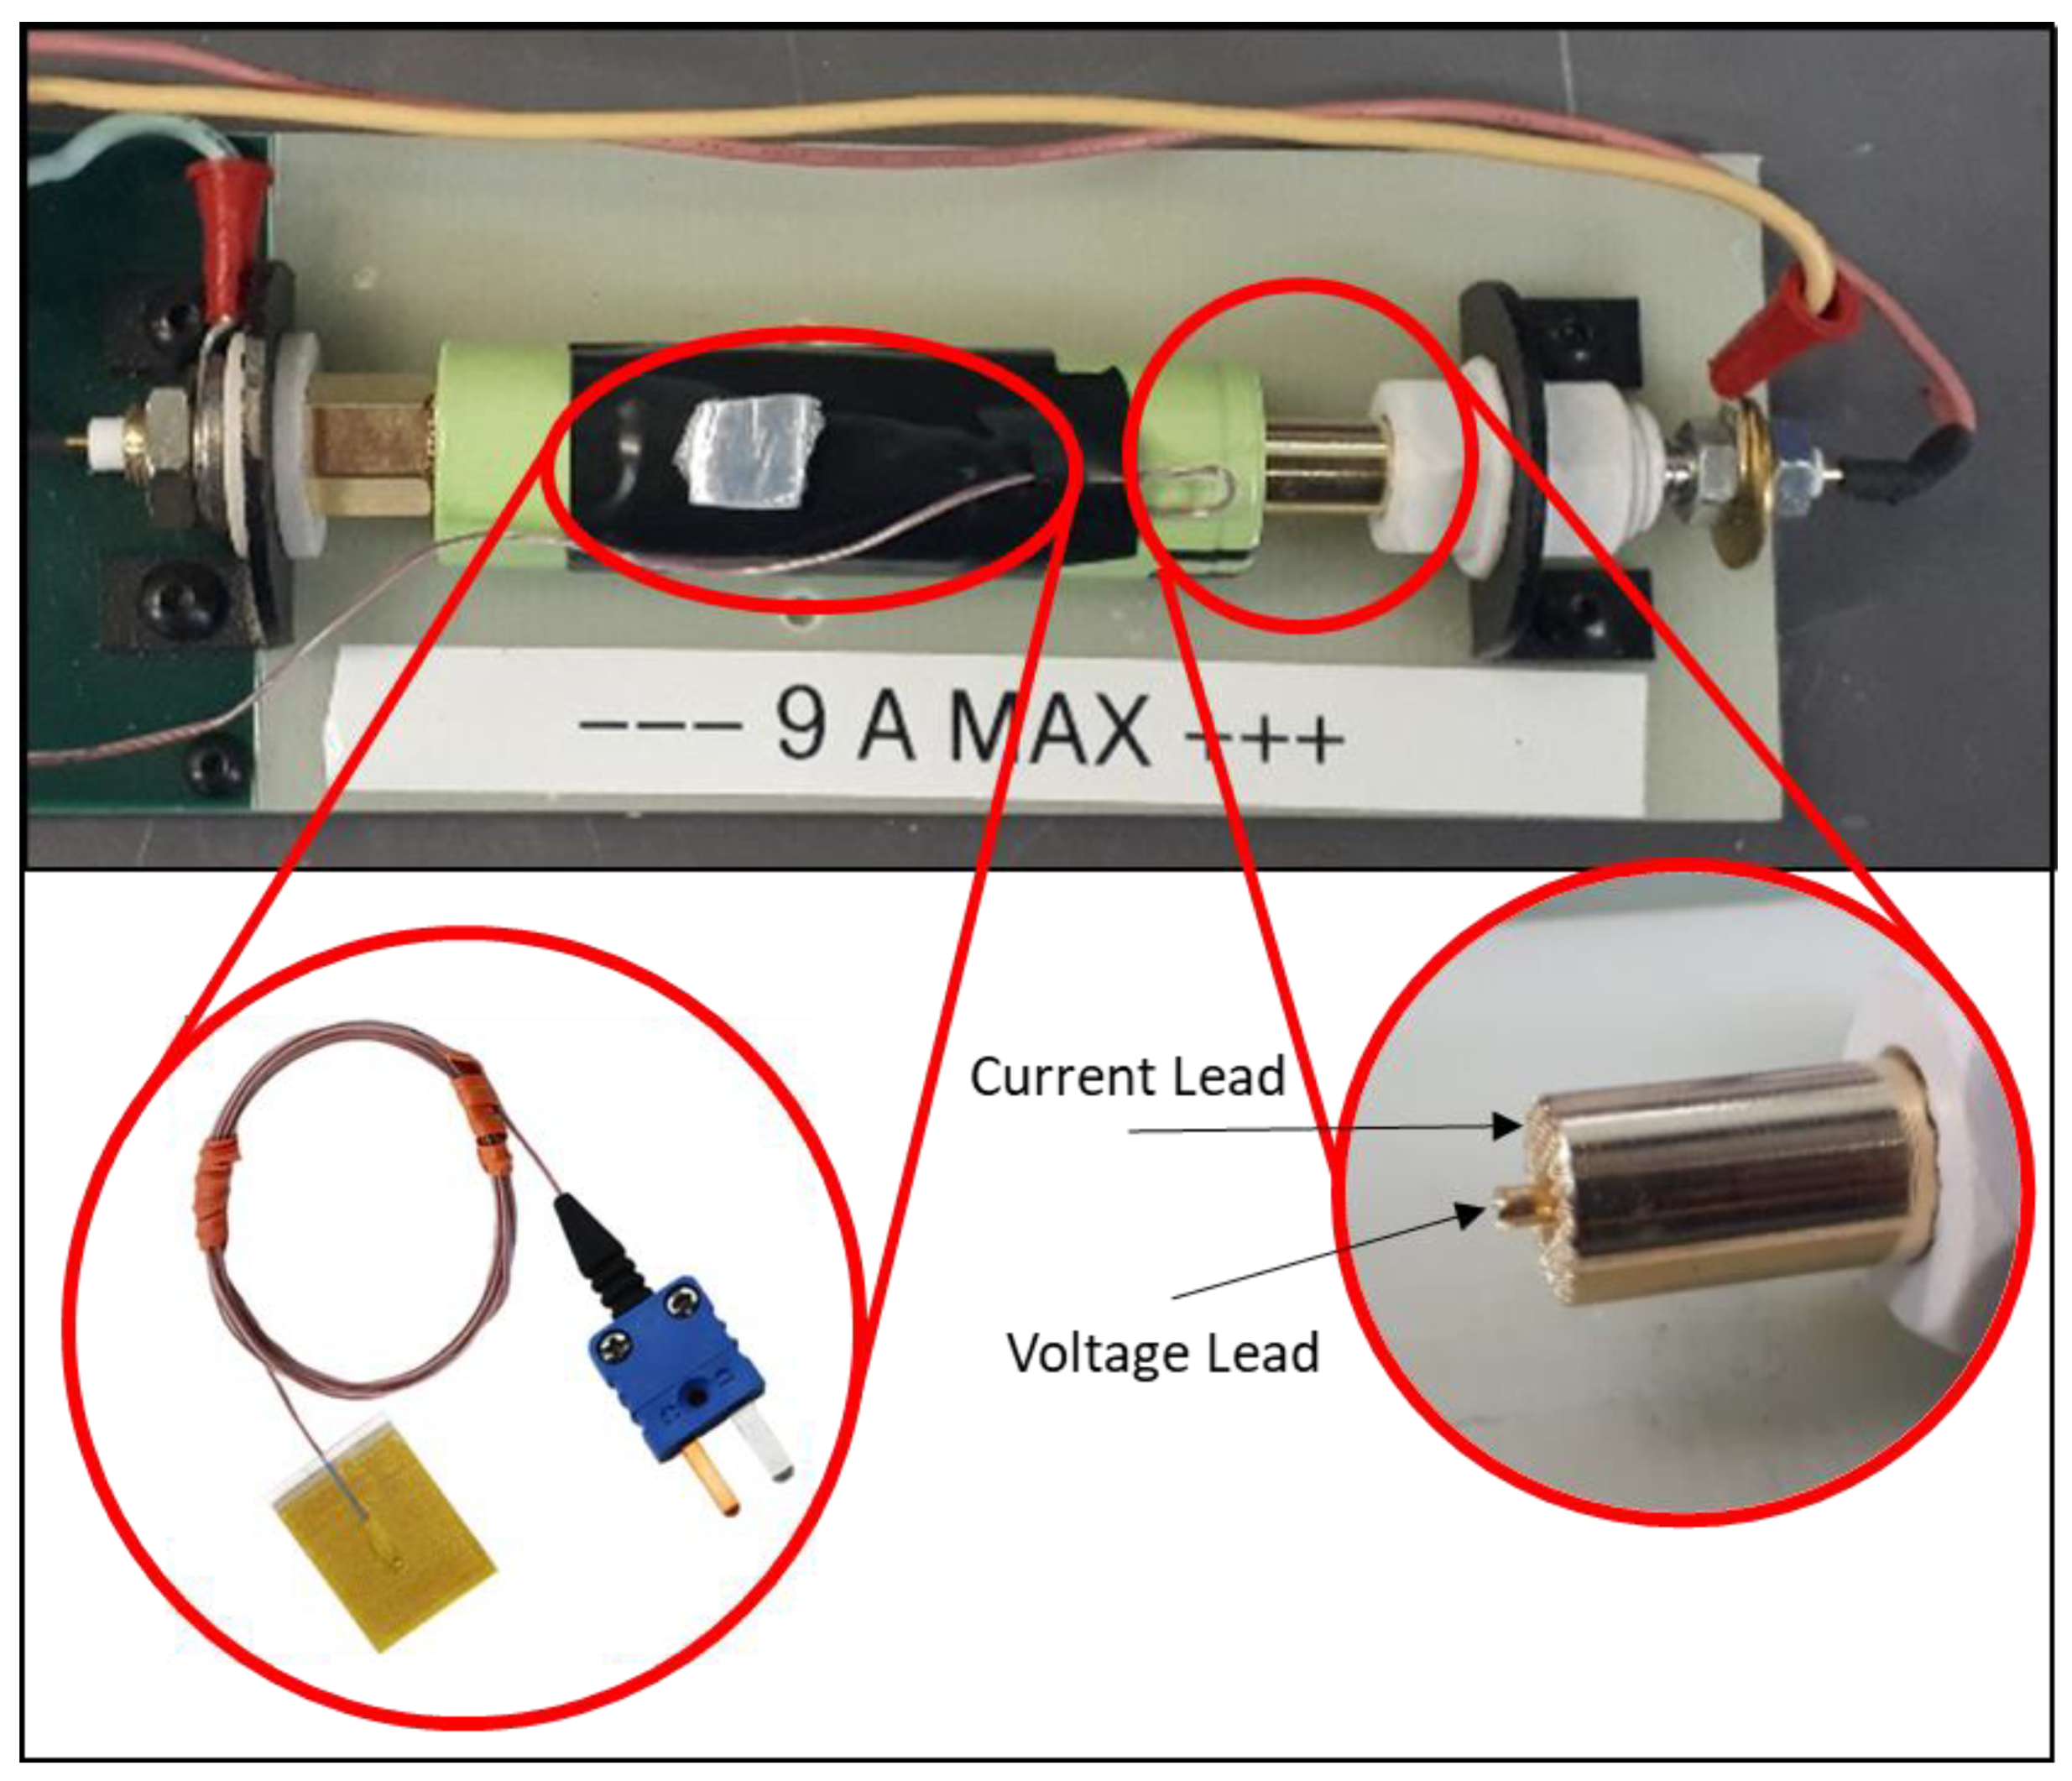
2.2. Test Equipment
All tests were performed using an Arbin Instruments BT2000 battery cycler with 3 channels (0–20 V; current range: ±100 A, ±2 A, ±0.1 A), and temperature sensing. The cells were placed in 4-wire cell holders to capture voltage and current data. Cell temperature was measured using self adhesive T-type thermocouples directly applied to the side of the cylindrical cell with a suitably sized insulated tape backing. The test setup can be seen in
Figure 2.
2.3. Test Procedure
The first test was used to evaluate VR and SS-OCV at various SOC values. As seen in
Table 2, the test begins by fully charging and then discharging in 10% SOC increments, each followed by a 3 h relaxation. Once the low voltage limit is reached, the battery charges in 10% SOC increments, each followed by a 3 h relaxation, until the high voltage limit is reached. This test takes more than 60 h to complete and is not feasible for a vast majority of applications. The end of constant current charge is dictated by a voltage limit. Should the rate or IR increase it will reach this voltage limit earlier in the SOC range and this should be considered and avoided when selecting the SOC value to conduct VR for SOH evaluations.
One outcome was to show the relationship between VR magnitude and SOC. Another outcome was to confirm that 60% SOC had the highest VR magnitude, as suggested in literature [
6]. This also determines what SOC value will be used in the second test should it be different from the literature, as the SOC with the highest VR magnitude is ideal for that test.
The second test was created to evaluate a 24 h rest period at the SOC value with highest VR magnitude. The test schedule is shown in
Table 3 and captures VR data after a charge, as per the guidelines discuss in
Section 1. Note it uses optimal SOC instead of 60% based on findings of the previous test which are presented in
Section 3.1. This test took place over 27 h.
The outcome of this test is to determine the period required to reach SS-OCV. It will also distinguish how long is required for high VR model accuracy, and the required complexity of the model for SOC and SOH investigations.
2.4. Battery Model Architecture and Coefficient Determination
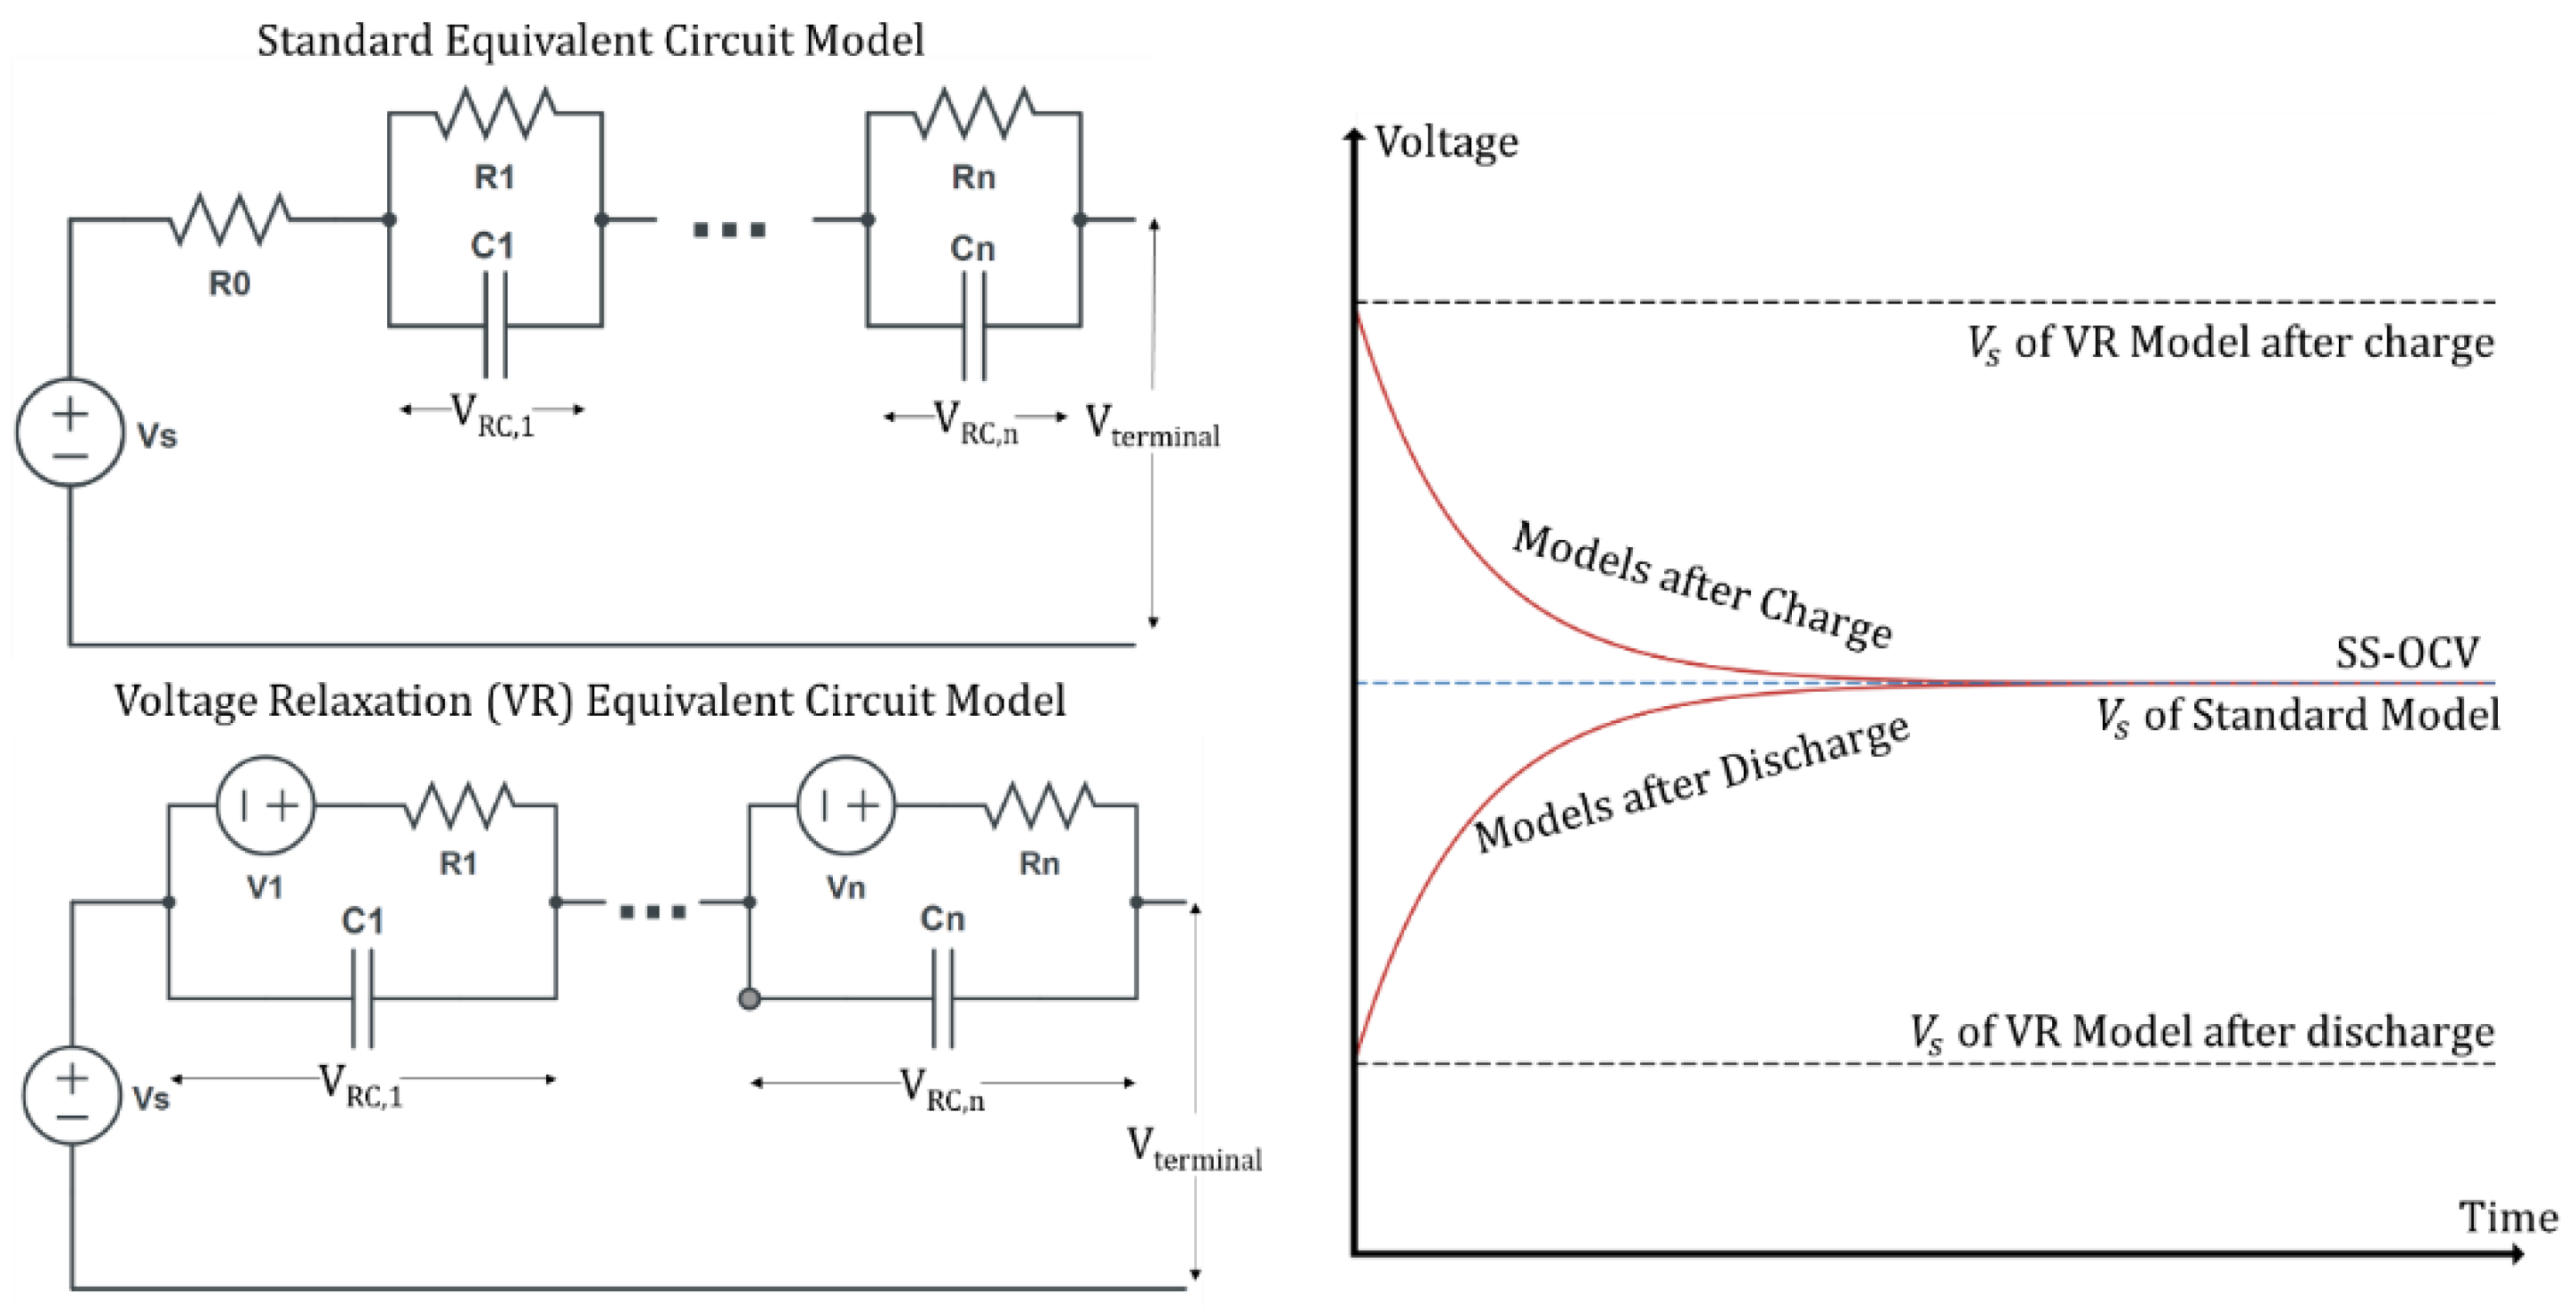
Experimental data was imported to MATLAB analysis software for model curve fitting. The VR period is separated from the normal cycle to remove the initial instantaneous IR voltage drop. This is done by taking the first data point immediately following the open circuit condition as the start of the timeseries since the IR voltage drop is immediate at open circuit. If this IR voltage drop was included, it would artificially increase the VR magnitude and alter results for the model curve fit as it does not represent the electrochemical insight that VR curve shape can give. The model chosen was the equivalent circuit model. The standard model for a battery was altered for ease of fitting the VR curve shape and estimating SS-OCV. These alterations can be seen in
Figure 3.
The alteration was an additional ideal voltage source with each RC pair and a removal of the series resistance
R0, which is responsible for the IR voltage drop. The ideal voltage sources are fit with the RC values for each VR period. In open circuit conditions the RC pairs in the VR model will always be charging, whereas the standard model will always have them discharging. These changes are primarily for SS-OCV determination which has impacts on curve fitting accuracy. For each model, the definition of
is different. In the standard model it represents the SS-OCV, whereas in the VR model it represents the terminal voltage at open circuit. Both models have the same initial equation for
, the voltage that appears at the battery terminals, Equation (1). Note that t = 0 is when the open circuit condition is applied and thus
does not factor into the voltage equation for relaxation, which starts at
t = 0
+. Therefore, it was removed in the VR model:
In Equation (1)
is the voltage of each RC pair as a function of time. These terms are summed with
for the total voltage of the battery. As shown in
Figure 3, the initial value of voltage for each RC can be inversed to represent these curve shape approaching from discharge or charge. For the standard model, the RC circuits are charged with a voltage that is negative relative to
at
t = 0
+. For the VR model the ideal voltage source polarity is reversed. With the original model the RC pairs will operate via Equation (2) compared to the VR model where they operate via Equation (3):
For both Equations (2) and (3),
is the time constant of the RC pair. Between Equations (2) and (3)
has a different definition. For Equation (2),
represents the initial value of the RC pair as
will decay to 0 as time approaches infinity. Equation (3) has
represent the final value of the RC pair since as time approaches infinity the value of the equation will be
. This difference is what changes the meaning of the series voltage source
as well, which has significant consequence. First, if Equation (2) is substituted into Equation (1)
is the SS-OCV. This means that any curve fitting using this equation will take close to the final value of the data set as the SS-OCV. Using Equation (2), the standard model, is limited to long relaxations where the final value of the dataset is as close to SS-OCV as possible. An incorrect SS-OCV would misrepresent the long-term effects on the battery. Next, Equation (3) is substituted into Equation (1) to produce Equation (4):
is now the initial value of the battery at
t = 0
+ instead of the SS-OCV. This makes the SS-OCV value the sum of all RC pairs voltage,
, and the series voltage source,
. This was shown graphically in
Figure 3. This way, when curve fitting SS-OCV can be larger or smaller than the final value of a dataset since it is not assumed to be
and dependent on multiple coefficients. This is the primary reason that the standard model was changed to the VR model for better curve fitting on VR datasets.
To curve fit Equation (4) the values of the coefficients {Vs, V1, , V2, , …, Vn, } are iterated. The Levenberg–Marquardt algorithm was chosen as it can perform fitting over the large time constant ranges while being quick to solution. This fitting technique for non-linear functions minimizes error based on the sum of the residuals squared. It is an interpolation between the Gauss–Newton algorithm and gradient descent method. The Levenberg–Marquardt algorithm is dependent on initial values and can be susceptible to ending in local minima should the initial value be poorly estimated. To alleviate this concern 5 initial values were used ranging from 0 to half VR magnitude for the voltage terms and spanning 3 orders of magnitude for the time constants. These values were estimated by scaling previous estimations that produced a low error.
2.5. Assessing Model Inaccuracy Impacts on SOC and SOH
To assess the model accuracy for SOC estimation and SOH evaluation 2 metrics are required. First, is the estimated settling time (EST) of a model. EST is the amount of time that it will take for the RC circuit with the largest time constant to reach 98% of steady state. A value of 98% was chosen as this is a factor of 5 greater than the time constant and after this point there is little evolution of the profile remaining. Second, Root mean squared deviation (RMSD) was evaluated and put in percentage of the VR magnitude, as shown in Equation (5) to evaluate goodness of fit:
In Equation (5) is the estimation of at a given datapoint d, and D is equal to the total number of datapoints. This allows for an understanding of not only how good the fit is relative to the VR magnitude, but how it can change with different numbers of RC circuits.
For SOC estimation, SS-OCV will be found from the model and used to find SOC from the OCV vs. SOC relationship. Relating SS-OCV to SOC requires performing a pseudo-OCV test as outlined by Barai et al. [
12]. The pseudo-OCV test is a very low-rate cycle that produces a voltage profile representative of OCV vs SOC. To determine the possible error the profile is examined for the smallest magnitude slope. This is important as it will produce a worst-case scenario of highest error in SOC estimation for an SS-OCV prediction. The RMSD is multiplied by the VR magnitude to find the possible voltage difference between modeled and measured SS-OCV. RMSD is used to calculate the SS-OCV error as it represents average deviation over the full data fit. This means that theoretically the SS-OCV prediction could be in accurate by the RMSD percentage. In all cases of this study the RMSD calculated error is higher than or equal to the difference observed for all trials, so it is a conservative estimate. This voltage difference is then added and subtracted from the OCV value where the smallest slope occurs to produce an estimate of the SOC range each SS-OCV value could represent.
Figure 4 shows this SOC error band visually along with the process. For practical applications, we propose that the error of SOC should be 0.5% or less.
For SOH evaluation it is important to have good VR curve representation in an appropriate projection period, so both EST and RMSD are used. EST is a pass-fail metric to show when the model predicts the profile will stop evolving and compare this to measured data obtained from the 24 h test. If the modeled EST value is too high, the long-term effects of VR are being misrepresented. RMSD shows how good the curve fit is for the captured data and minimizing this indicates the model is adequately capturing the VR trend.
3. Results and Discussion
3.1. VR Magnitude vs. SOC
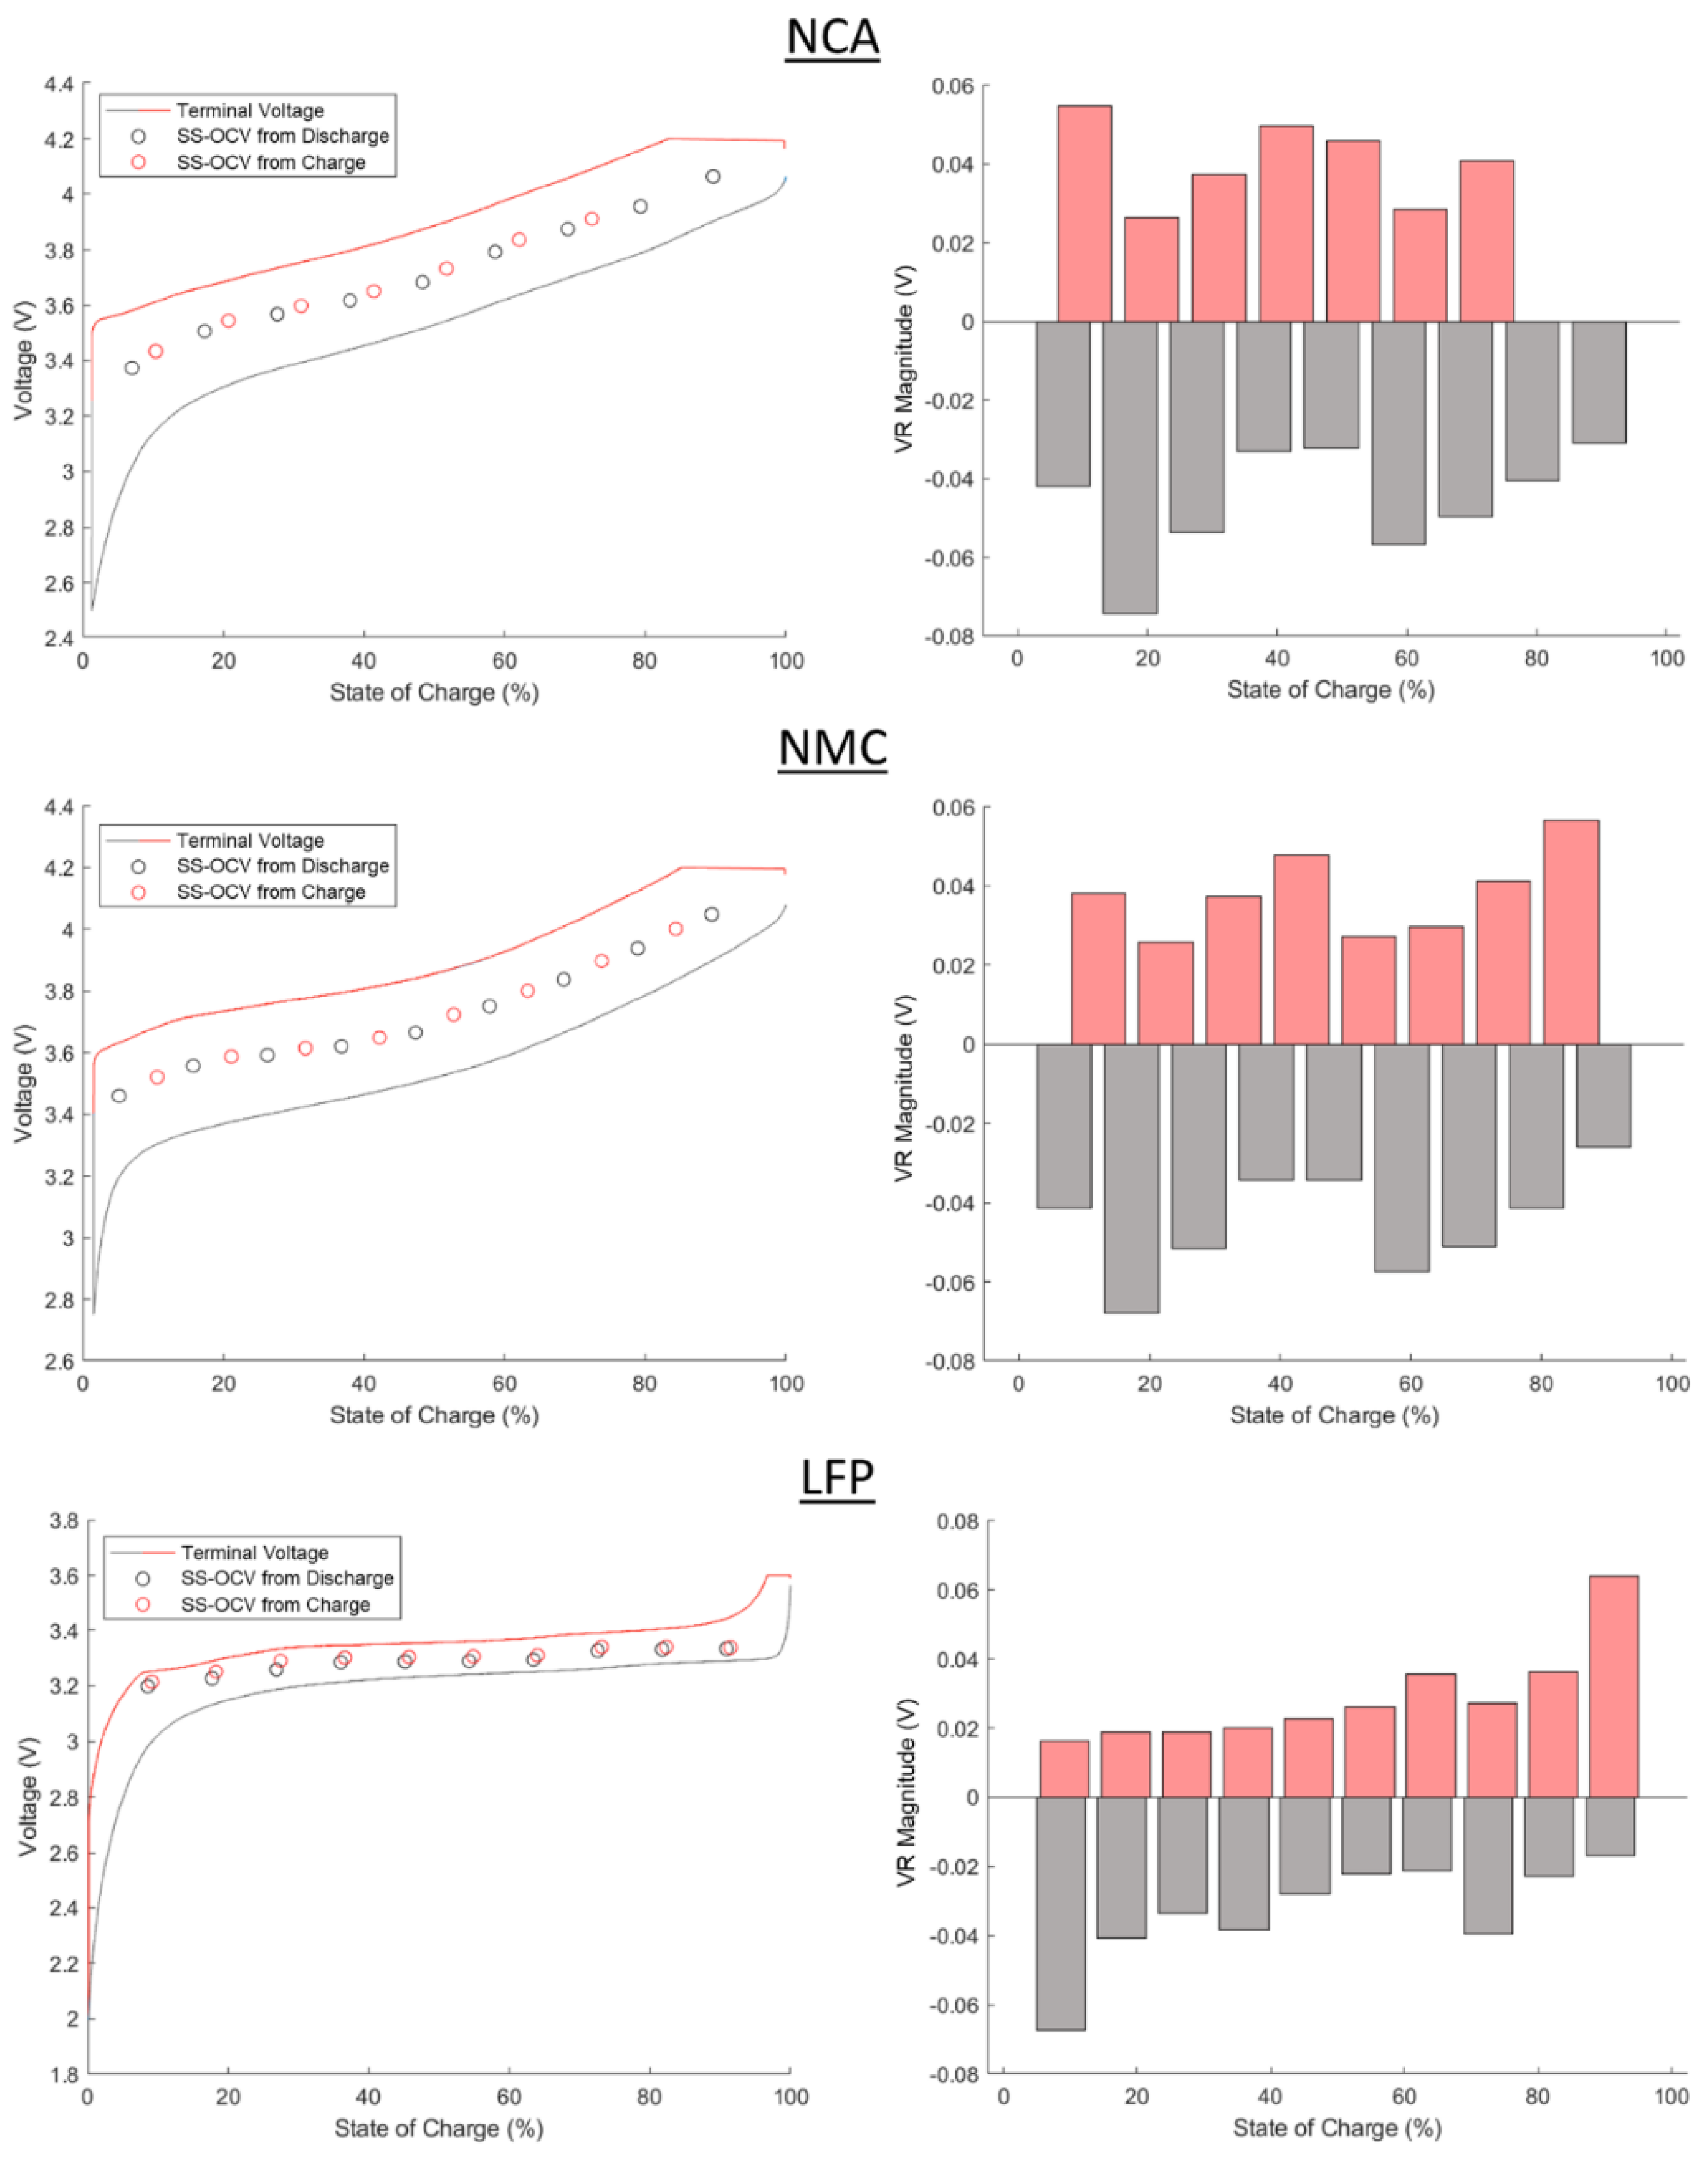
Results of the 3 h VR test for each battery chemistry were put into the left column of plots in
Figure 5. Discharge values are shown in gray and charge values are shown in red. The left column of
Figure 5 shows the terminal voltage profile vs. SOC, throughout the discharge and charge cycle. The SS-OCV after a 3 h VR period is also included as a circle point for each VR. All discharge SS-OCV are lower than charge SS-OCV, illustrating voltage hysteresis in the battery. Substantial voltage profile changes occur at the beginning and end of discharge and beginning of charge, which is common in all LIBs. The SOC at which the charge control changes from constant current to constant voltage can be seen as the horizontal line portion of the terminal voltage plot. No SS-OCV points are given during the constant voltage charge phase since it would have a different current before relaxation making results non-comparable.
The right column of
Figure 5 shows the calculated VR magnitude vs. SOC for both discharge and charge. From the research questions and guidelines established, it is known that the VR magnitude should be maximized.
Figure 5 clearly shows varying VR magnitude depending on both battery chemistry and SOC, suggesting an optimal SOC value for VR magnitude can be identified.
NCA and NMC chemistries show similarities for terminal voltage profile, SS-OCV trends, and VR magnitude. A final charge VR magnitude datapoint is not obtained for the NCA chemistry at high SOC due to earlier exit of the constant current phase from reaching the high voltage limit. This shows why high SOC values on charge are not be selected due to IR growth inhibiting a comparable VR as the battery wears. There is a local peak of VR magnitude while charging at low SOC for NCA. This should also not be selected as capacity loss from battery wear could inhibit it being captured appropriately. Both chemistries have local VR magnitude peaks at approximately 45% SOC on the charge, and at 15% and 55% on discharge. The VR magnitude at 45% SOC on charge is therefore suggested for use in assessing SOH and for the 24 h VR of both NCA and NMC.
LFP shows different characteristics to NCA and NMC. First, it has a much smaller constant voltage phase than either the NMC or NCA. It is noteworthy that high SOC on charge and low SOC on discharge are the peaks of VR magnitude. This is correlated to the IR of the battery, however the test method ensured that these values were not biased by the IR voltage drop. High SOC values on charge may have high VR magnitude, but they should not be selected as IR growth may inhibit obtaining a comparable VR at this SOC as the battery wears since it will be in constant voltage instead of constant current. Instead, a local maximum of VR magnitude on charge can be identified at 65% SOC, and this value is suggested for use in assessing SOH and for 24 h VR test of LFP.
3.2. VR Shape and SS-OCV
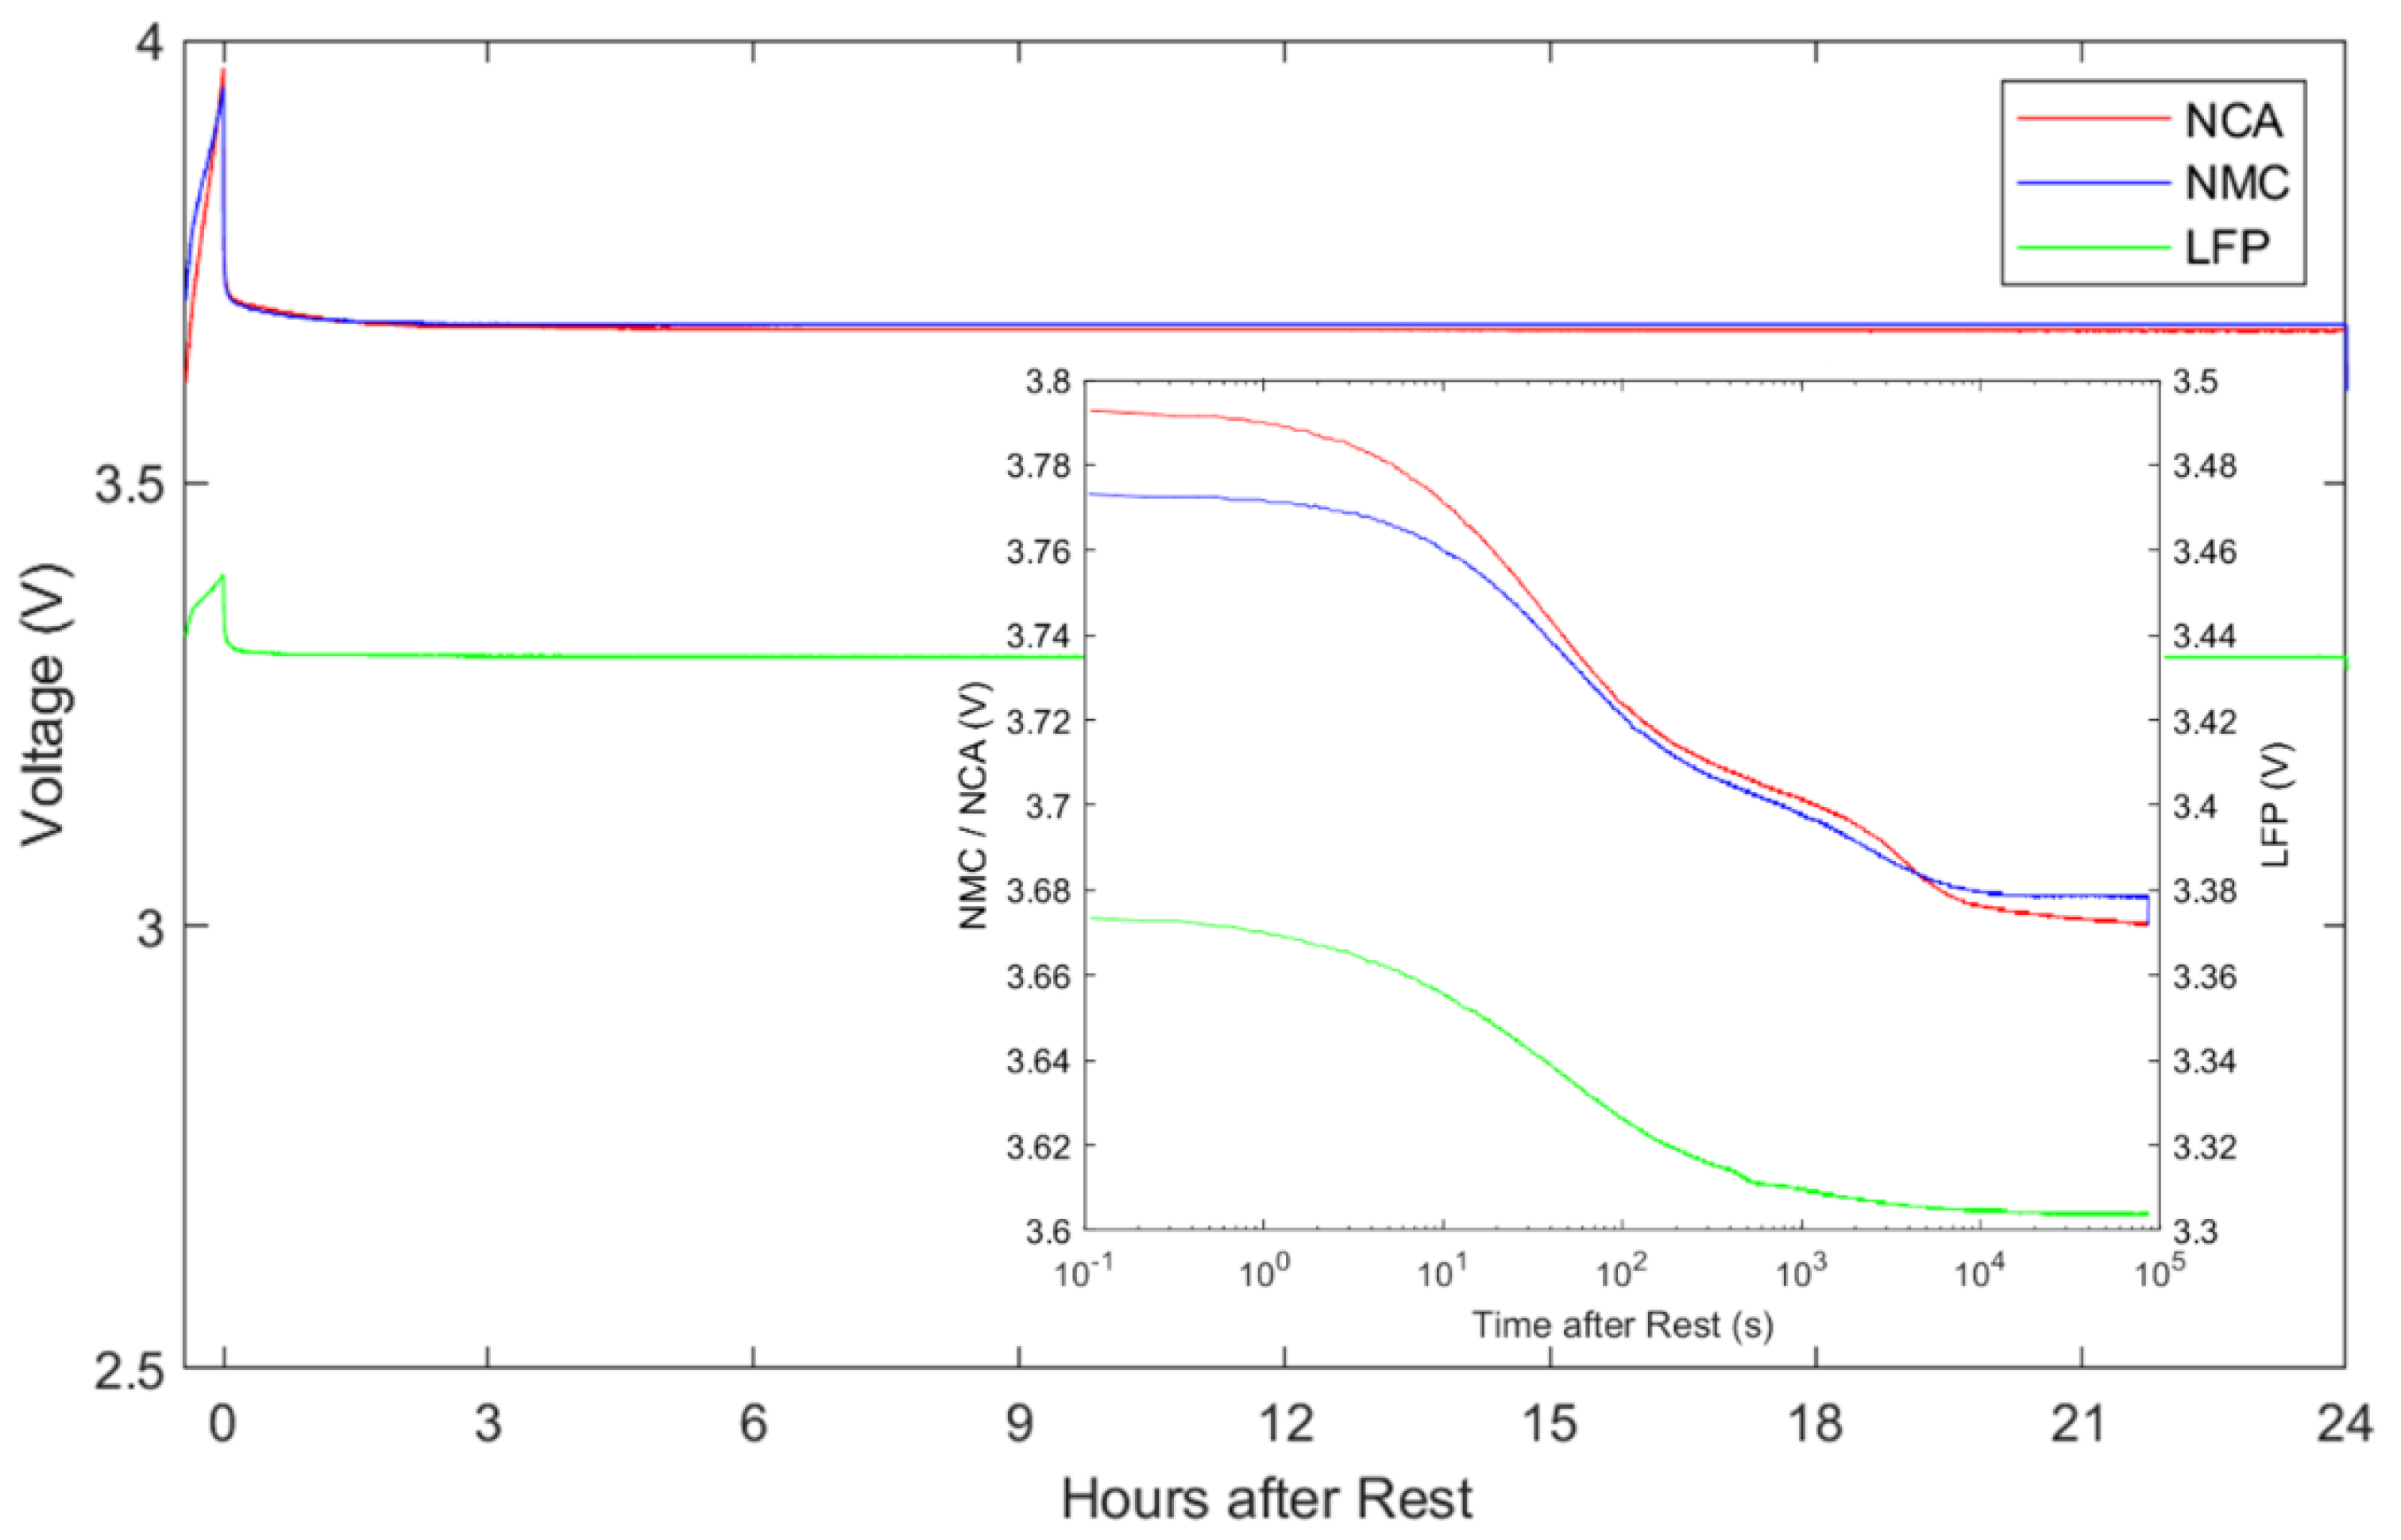
Results of the 24 h VR test are shown in
Figure 6. Note that each battery approaches open circuit while charging to the SOC value with highest VR magnitude: 45% for NMC and NCA, and 65% for LFP. The batteries then enter open circuit and relax. The vast majority of VR magnitude occurs within minutes, so an inset plot of log time in seconds is given to provide better resolution. The profile of VR is more complicated than the linear time graph would suggest. For the time periods of 1 s to 5 min (
–
s on the figure) and up to ~3 h (
–
s), these voltage profiles have the shape of exponential functions. They exhibit a clear lead in, linear region and fade to constant value that exponentials have when plotted in a semi-log plot. There is a cross over period in between them of ~2 min to 16 min (
–
s). During this period, there is only a linear portion observed in log time with no lead in or fade to constant. Finally for the time period greater than ~3 h (
s), there is little change in the voltage profiles.
NCA and NMC have similar voltage values due to their nickel-based positive electrode material. There are three notable comparisons between the batteries. First, the NCA battery starts at a substantially higher voltage, but by s approaches the voltage value of NMC. Second, the NCA and NMC exhibit similar VR during time period s to s. Third, the NCA voltage substantially declines at 4 s and crosses below the value of NMC.
The NMC battery achieves 98% of its SS-OCV value within ~2 h (7 s) and reach steady state at ~5 h (2 s). This is different from NCA which does not reach a SS-OCV value. There was concern that a parasitic current applied to the batteries by the voltage measurement (16 bit; 10 MΩ) could be slowly discharging the battery and influencing this. To investigate this the NCA cell was tested again but was normally physically disconnected from the voltage measurement circuit. Voltage leads were re-attached only temporarily to take a measurement at 1 s, 10 s, 100 s, 30 min, 3 h, and 24 h. This verification test produced identical results, indicating that this VR is an effect of the battery and not a function of the applied voltage measurement circuit.
The LFP battery achieves 98% of its SS-OCV value within 2 h which is comparable to the NMC battery. It takes slightly longer at 4.6 h to reach SS-OCV. LFP initially appears similar to the other chemistries in terms of its VR curve shape. There is a similar profile until 200 s (2 s) with a clear lead in and linear region. However, after this time it lacks the visible inflections, points demonstrated by both NCA and NMC. This would suggest that simpler VR equivalent circuit model may be all that is required when modeling this chemistry.
From the guidelines the shortest VR period is preferable if the model can accurately capture the curve. A relaxation period of 3 h is sufficient to achieve above 98% of the SS-OCV for SOC estimation from the captured data for NMC and LFP batteries. This means that there will be a small amount of voltage evolution that would occur after the rest period is finished. A relaxation period of 3 h would also be reasonable to find the characteristics of the VR curve shape for fitting applications. This period represents all the significant VR curve shape data. For NCA batteries further investigation is required into their long-term effects as it continues to evolve and does not settle on a SS-OCV, even after 24 h.
3.3. Model Complexity
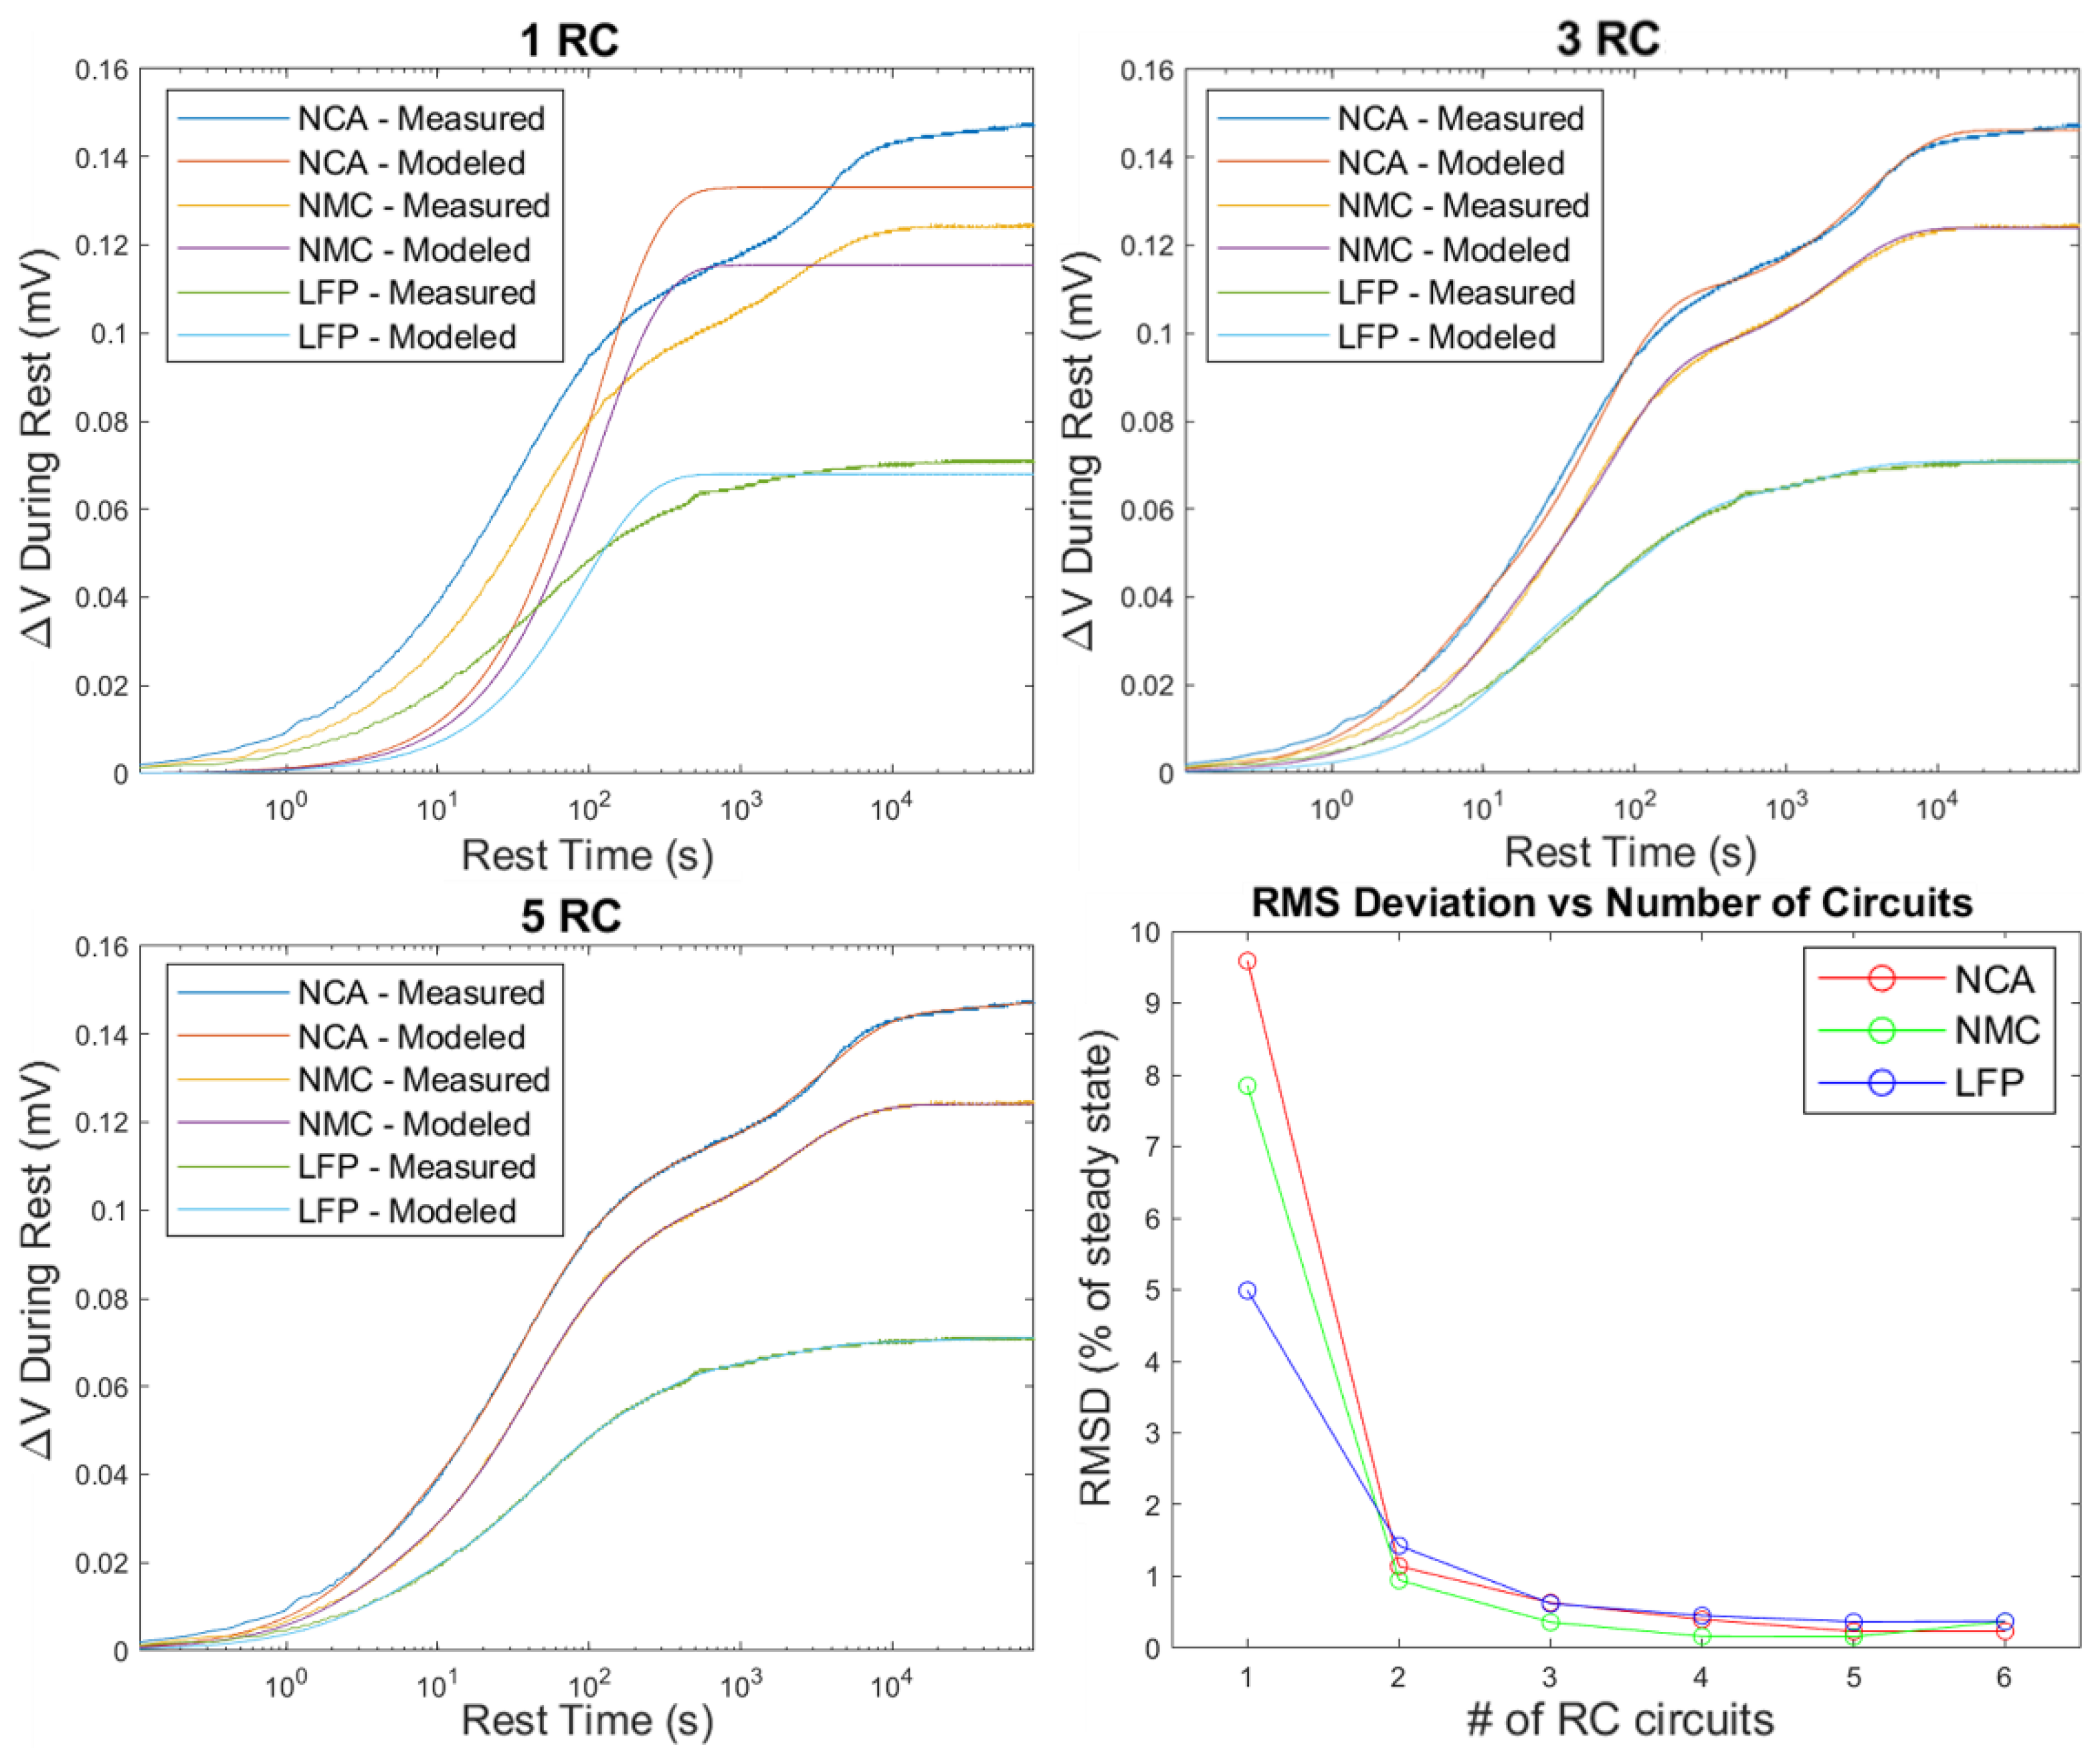
Curve fitting of the 24 h relaxation data for the different chemistries was performed using the VR equivalent circuit model. Equation (4) was curve fit for RC circuit counts ranging from
n = 1 to 6. Example results are shown for
n = 1, 3, 5 in
Figure 7. They were then evaluated for their goodness of fit, also shown in
Figure 7 as RMSD in the lower right plot.
From these graphs it is clear that as
n increases there is improvement to the RMSD of the model, albeit with diminishing returns. A difference in modeled and measured curves for the 1 and 3 RC models is noticeable, while the 5 RC model is almost indistinguishable from the measured results by visual inspection. Most of the VR curve shape can be captured with only 2 RC circuits as shown from the large drop in RMSD between the 1 and 2 RC models. This makes sense because the profile in the semi-log
Figure 6 inset is predominantly two exponential decays. The improvements to fitting after this point are based on capturing the transition period between these RCs.
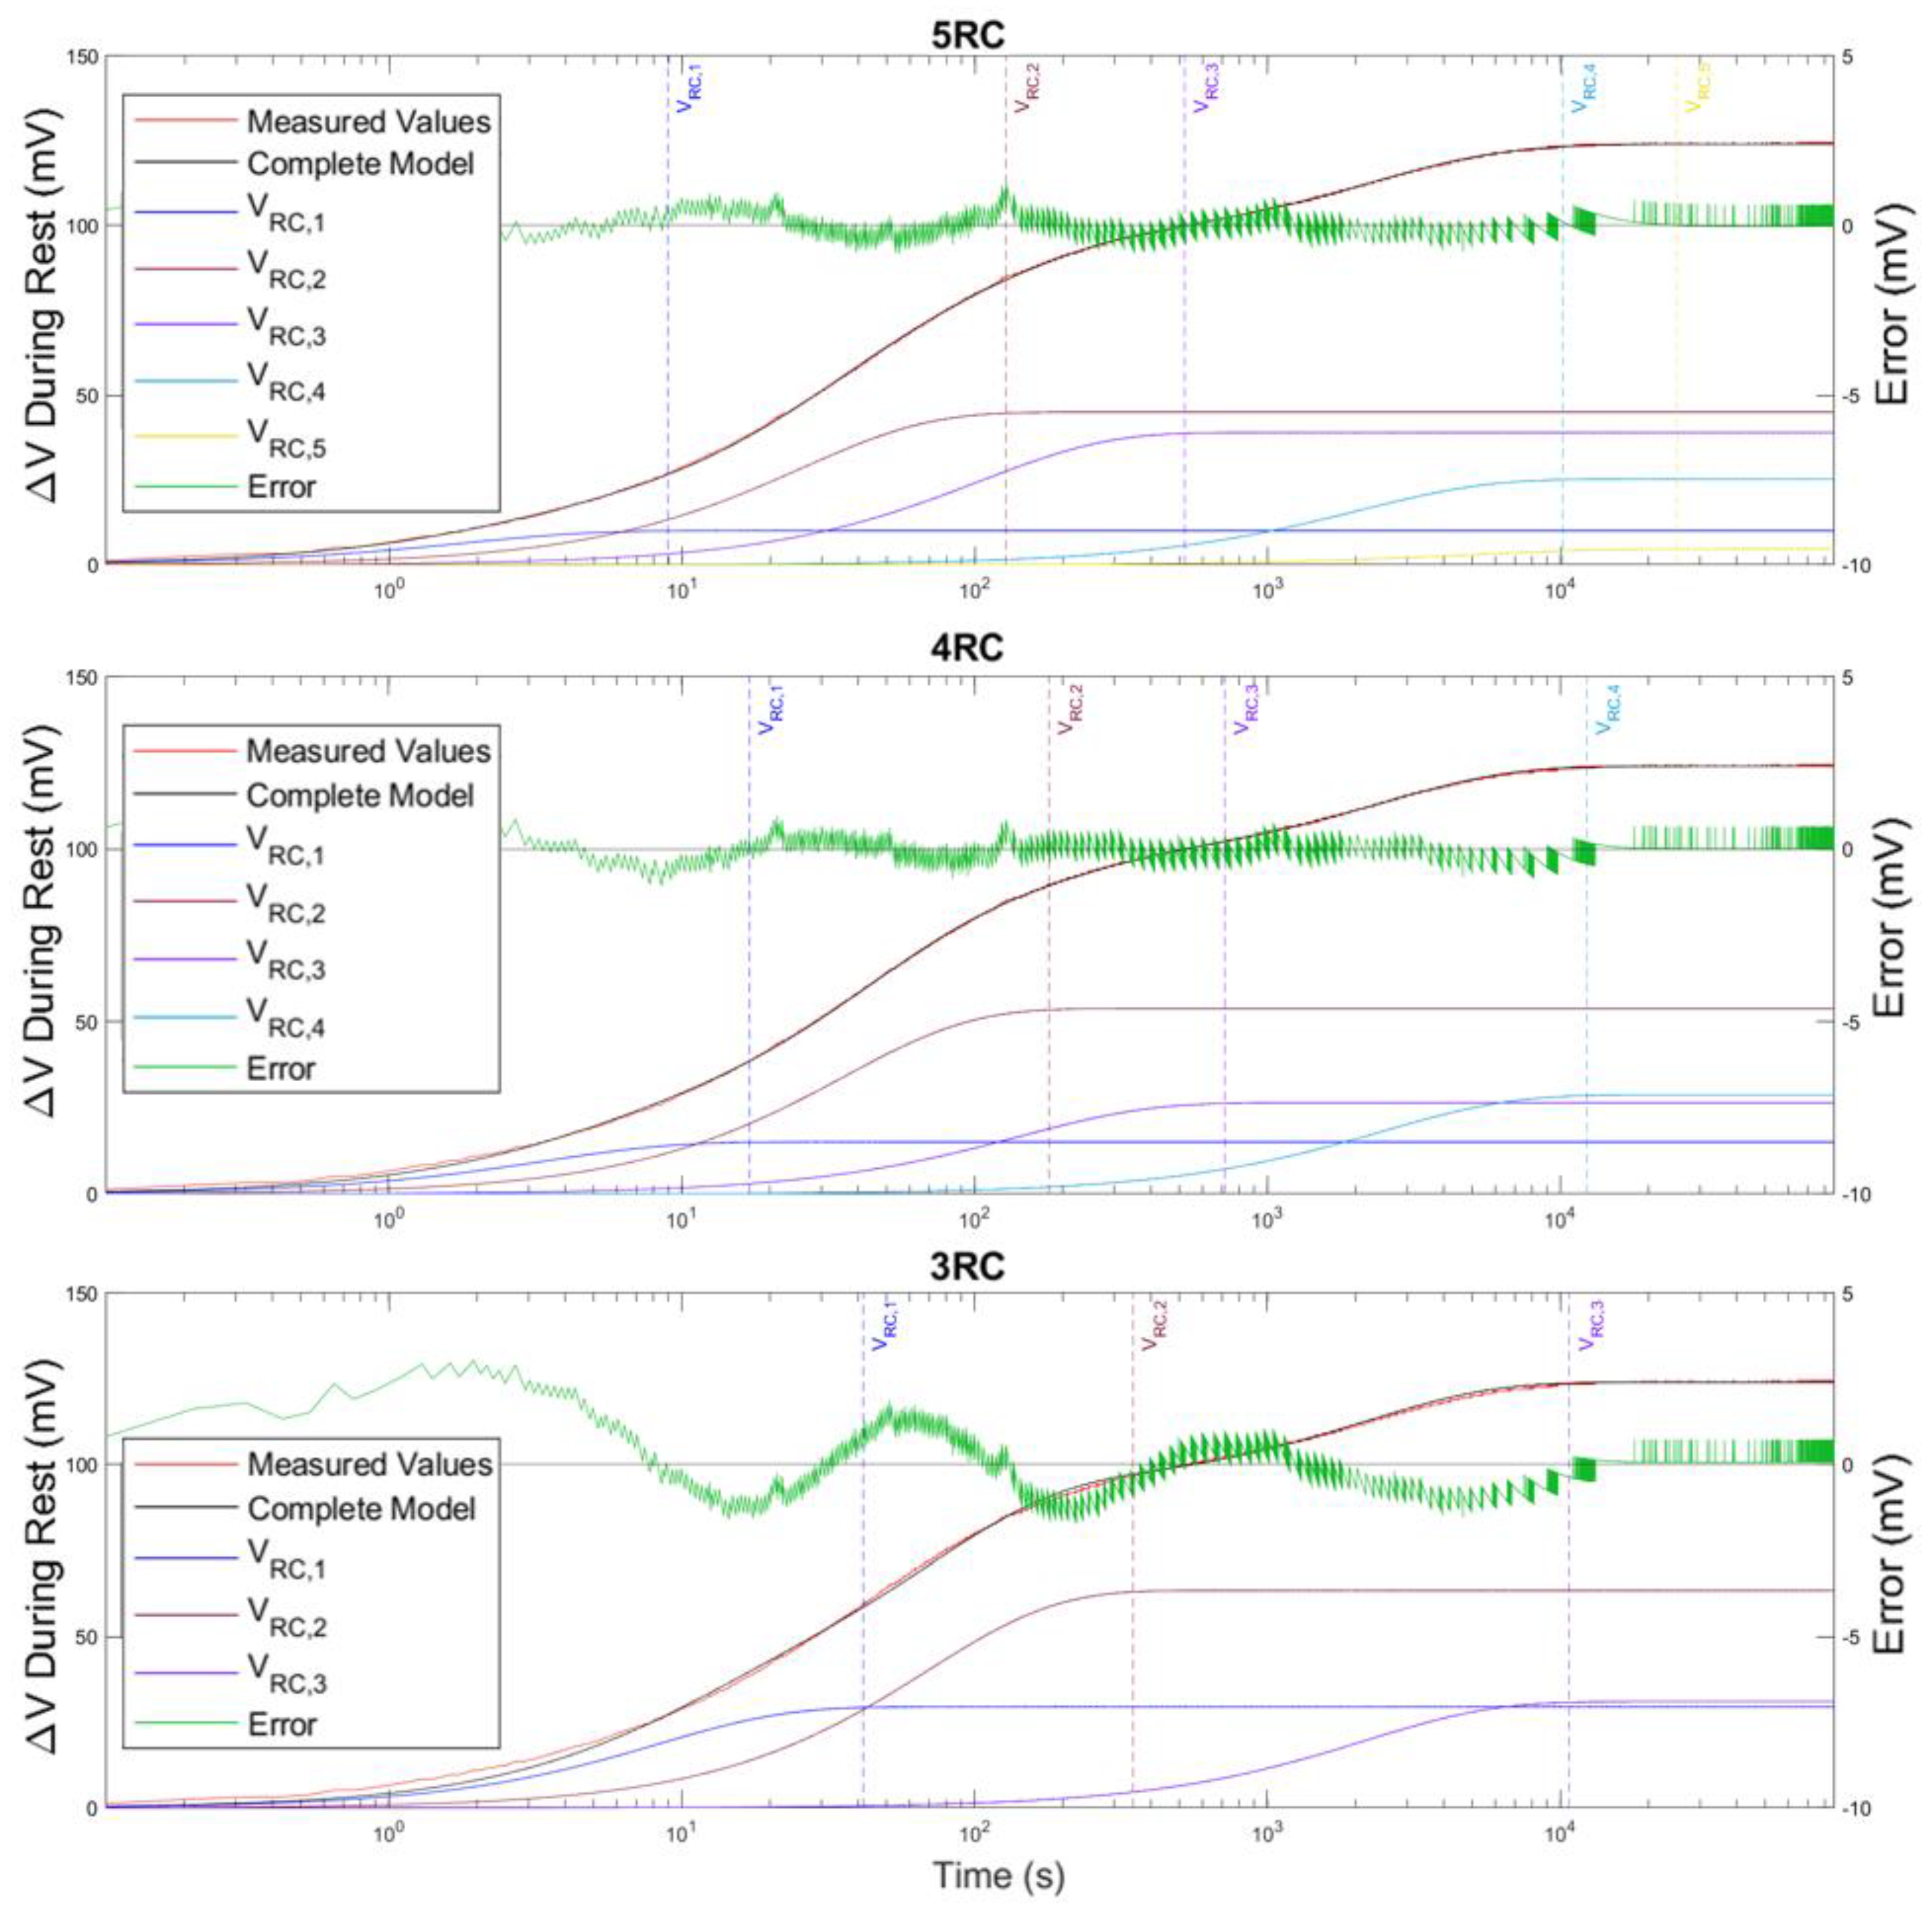
The fact that RMSD is still improving after 3 RC circuits prompted investigation into the effects of each individual RC circuit onto the total profile. This is shown in
Figure 8 for the
n = 3, 4, and 5 RC models for the NMC batteries. In these graphs, the error shown on the secondary y-axis is calculated as the difference between the measured value and the modeled value. This allows for visual inspection of the important differences in the modeled and measured curves. A vertical dashed line is included for each circuit representing the time it reaches 98% of its steady state value. This percentage was chosen for the same reasons as EST. When discussing this figure,
n RC means the model and circuit
VRC,p refers to voltage magnitude attributable to a specific RC pair of the model.
In the 3 RC model, VRC,1 VRC,2 and VRC,3 line up with the 3 linear regions observed on the semi-log plot, explaining why there is such significant improvement to the accuracy from the 1 to 2 to 3 RC models. It also explains the marginal improvements after this point as most of the behavior is captured with 3 RCs. These marginal improvements better represent the real electrochemical function which dictate the profile as it is not simply exponential decay functions.
It is important to recognize how the RC circuits resolve from the 5 RC to the 3 RC model. When changing from the 5 RC to 4 RC model, VRC,5 and VRC,4 appear to resolve into a single VRC. This new VRC has a time constant between the previous ones, and a higher Vn to account for the magnitude of both. When changing from the 4 RC to 3 RC model, the lower time constant circuits VRC,3 and VRC,2 appear to resolve. During these changes all RCs time constants migrate closer together to account for the simplification of the crossover period.
3.4. Quantifying Inaccuracy Impacts on SOC and SOH
Table 4 uses the RMSD technique given in
Section 2.5 to determine the potential SOC error for each chemistry and
n RC model. The
n RC model at which minimum SOC error or 0.5% is reached is bordered. NCA and NMC can both use the 3 RC model as it reaches the suggested SOC accuracy of 0.5%. LFP should use the 4 RC model where it reaches minimum SOC error of 2.27%, which is well above the suggested 0.5%. The flatter voltage profile of LFP drastically increases sensitivity to error when using OCV to SOC relationship.
Table 5 shows RMSD and EST for each chemistry and
n RC model. For NCA the RMSD reaches a minimum at the 5 RC model. However, the modeled EST is 85.35 h, which is well beyond the testing information of 24 h. As SS-OCV was not reached for NCA it is unknown what value of modeled EST signifies overfitting, but that it should be longer than 24 h. Testing VR beyond 24 h could be used to verify this finding.
For NMC and LFP
Table 5 shows improvement in RMSD until the 6 RC model. However, the EST of this model is 6.95 and 5.36 h, respectively, which are both substantially beyond the measured EST of 3 h. This EST metric discredits both the 5 and 6 RC model and instead the 4 RC model with appropriate EST is selected (and bordered).
4. Conclusions
While OCV is commonly used as an indicator of SOC in lithium-ion batteries, it is established from the literature that VR magnitude and curve shape varies as a function of chemistry and SOC. Our research aims to address questions of VR magnitude and curve shape, and model complexity for popular lithium-ion battery chemistries.
Five research contributions are made: (1) a set of VR guidelines are proposed that take advantage of opportunities that are practical for typical applications, such that the method is applicable to industry; (2) VR magnitude and shape are explored for three lithium-ion chemistries over a range of SOC and VR periods; (3) a new VR equivalent circuit model is proposed and justified and compared to standard equivalent circuit models to show its advantages; (4) model complexity in terms of RC pairs is explored to identify the impact of each pair and the resolving of pairs in simpler models; and (5) model fidelity and accuracy is explored to understand its impact on estimating SOC and SOH.
Findings lead to four research recommendations: (1) examine how a change in the composition of an NMC positive electrode could alter these findings; (2) examine different positive electrode material loading impacts on the results of the study; (3) extend the duration beyond a 24 h period to fully capture the VR and find SS-OCV of the NCA chemistry; and (4) cause the cell capacity to degrade by cycling and/or aging them to identify the impact it has on VR magnitude and shape, and the accuracy which it can predict SOH.


