
A Fast Prediction of Open-Circuit Voltage and a Capacity Estimation Method of a Lithium-Ion Battery Based on a BP Neural Network
Abstract
:1. Introduction
2. Capacity Estimation Method
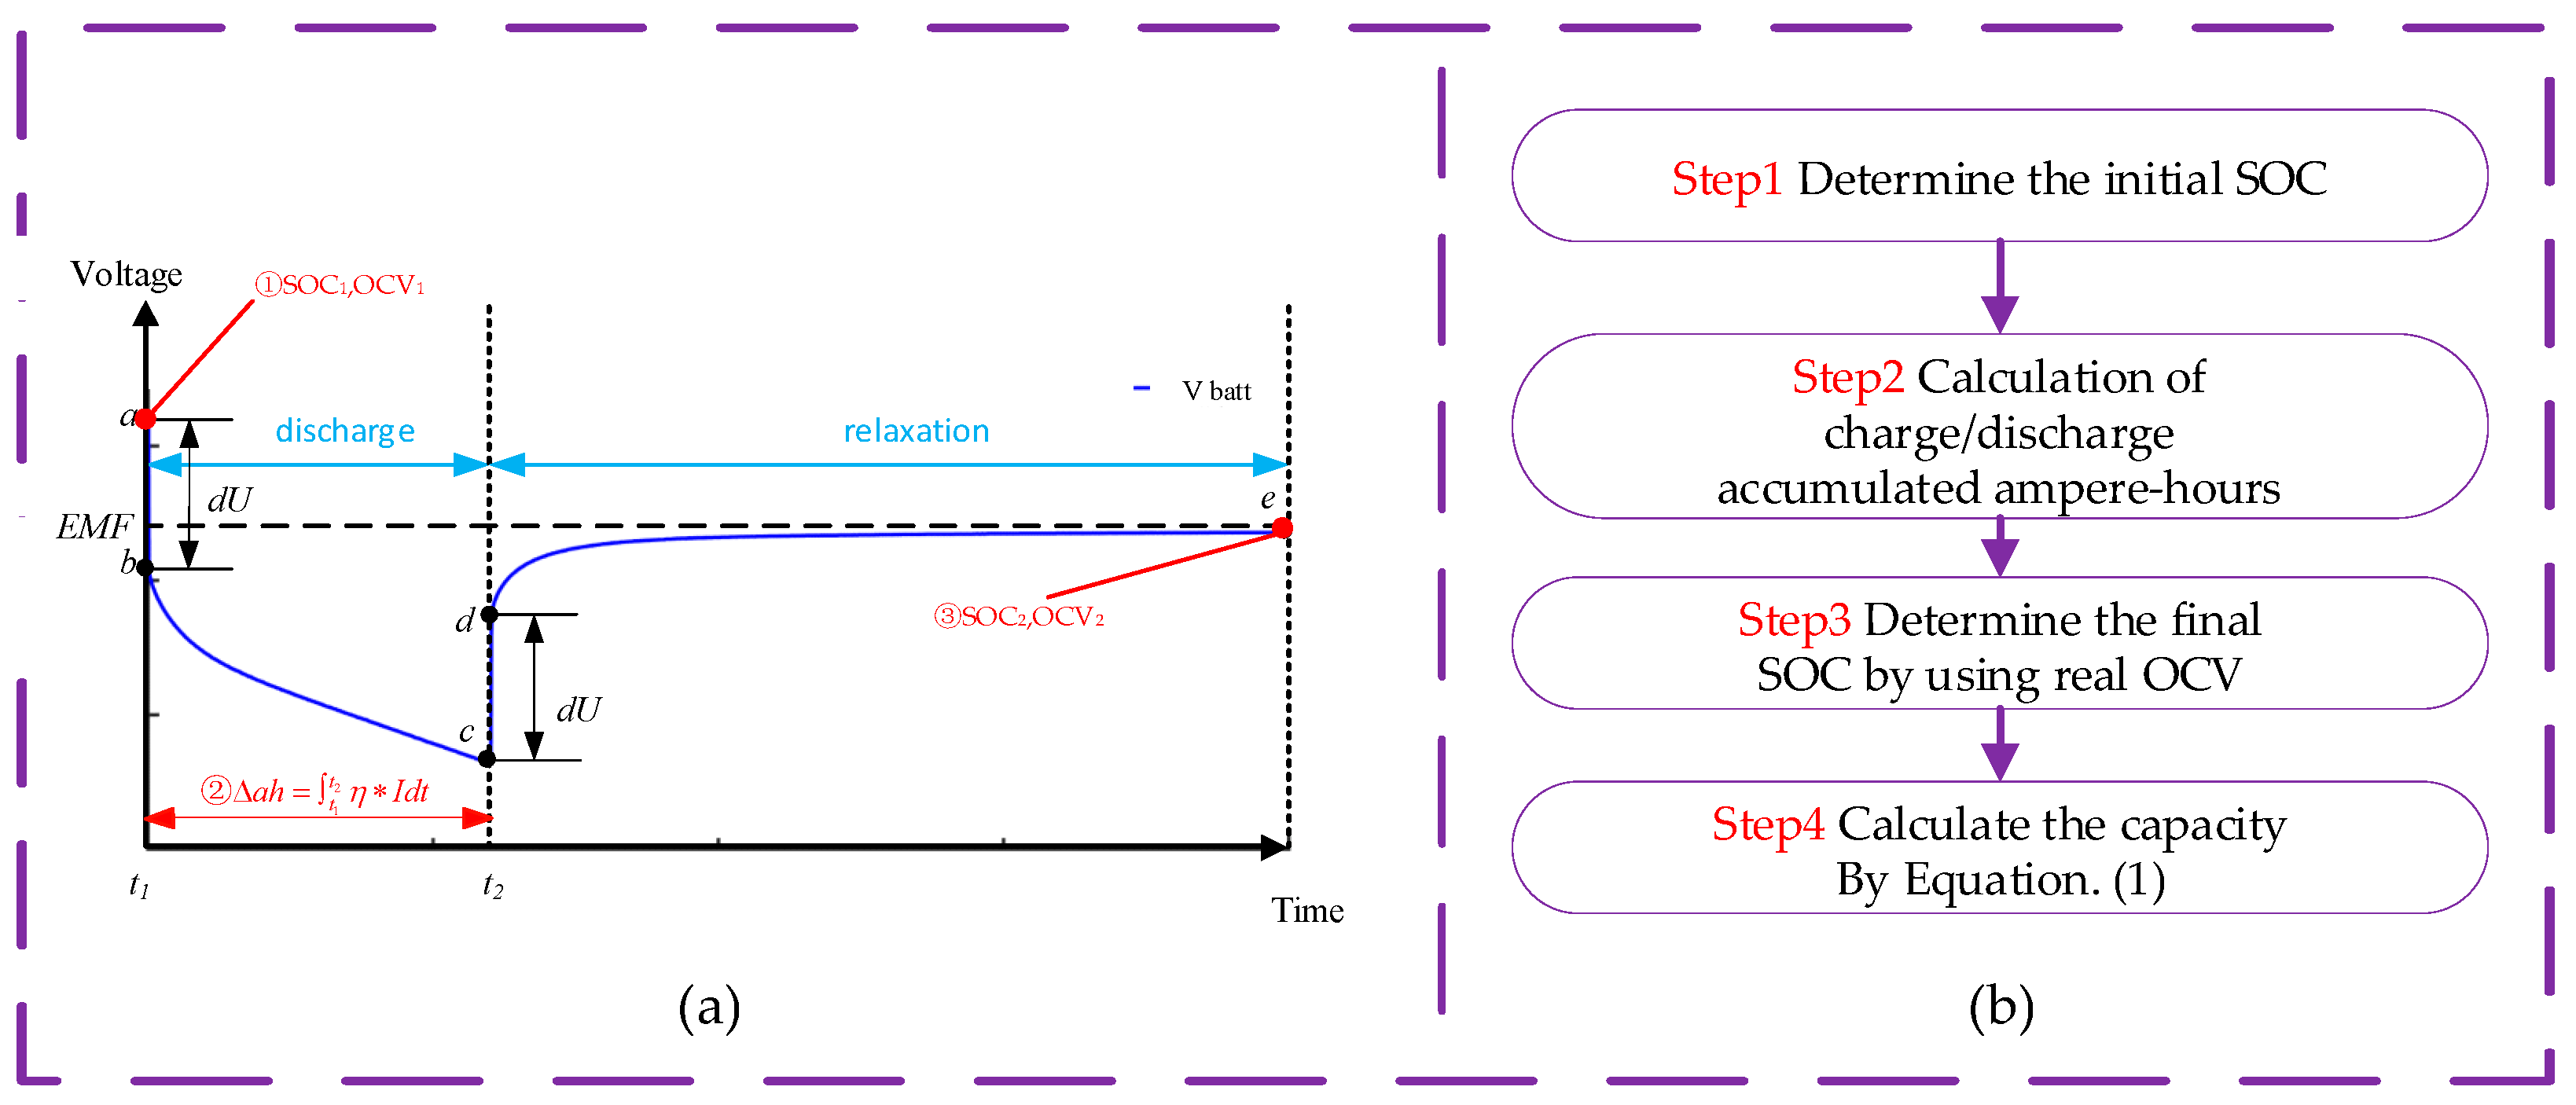
2.1. Capacity Estimation Procedure
2.2. BP Neural Network
2.3. Selection and Processing of Datasets
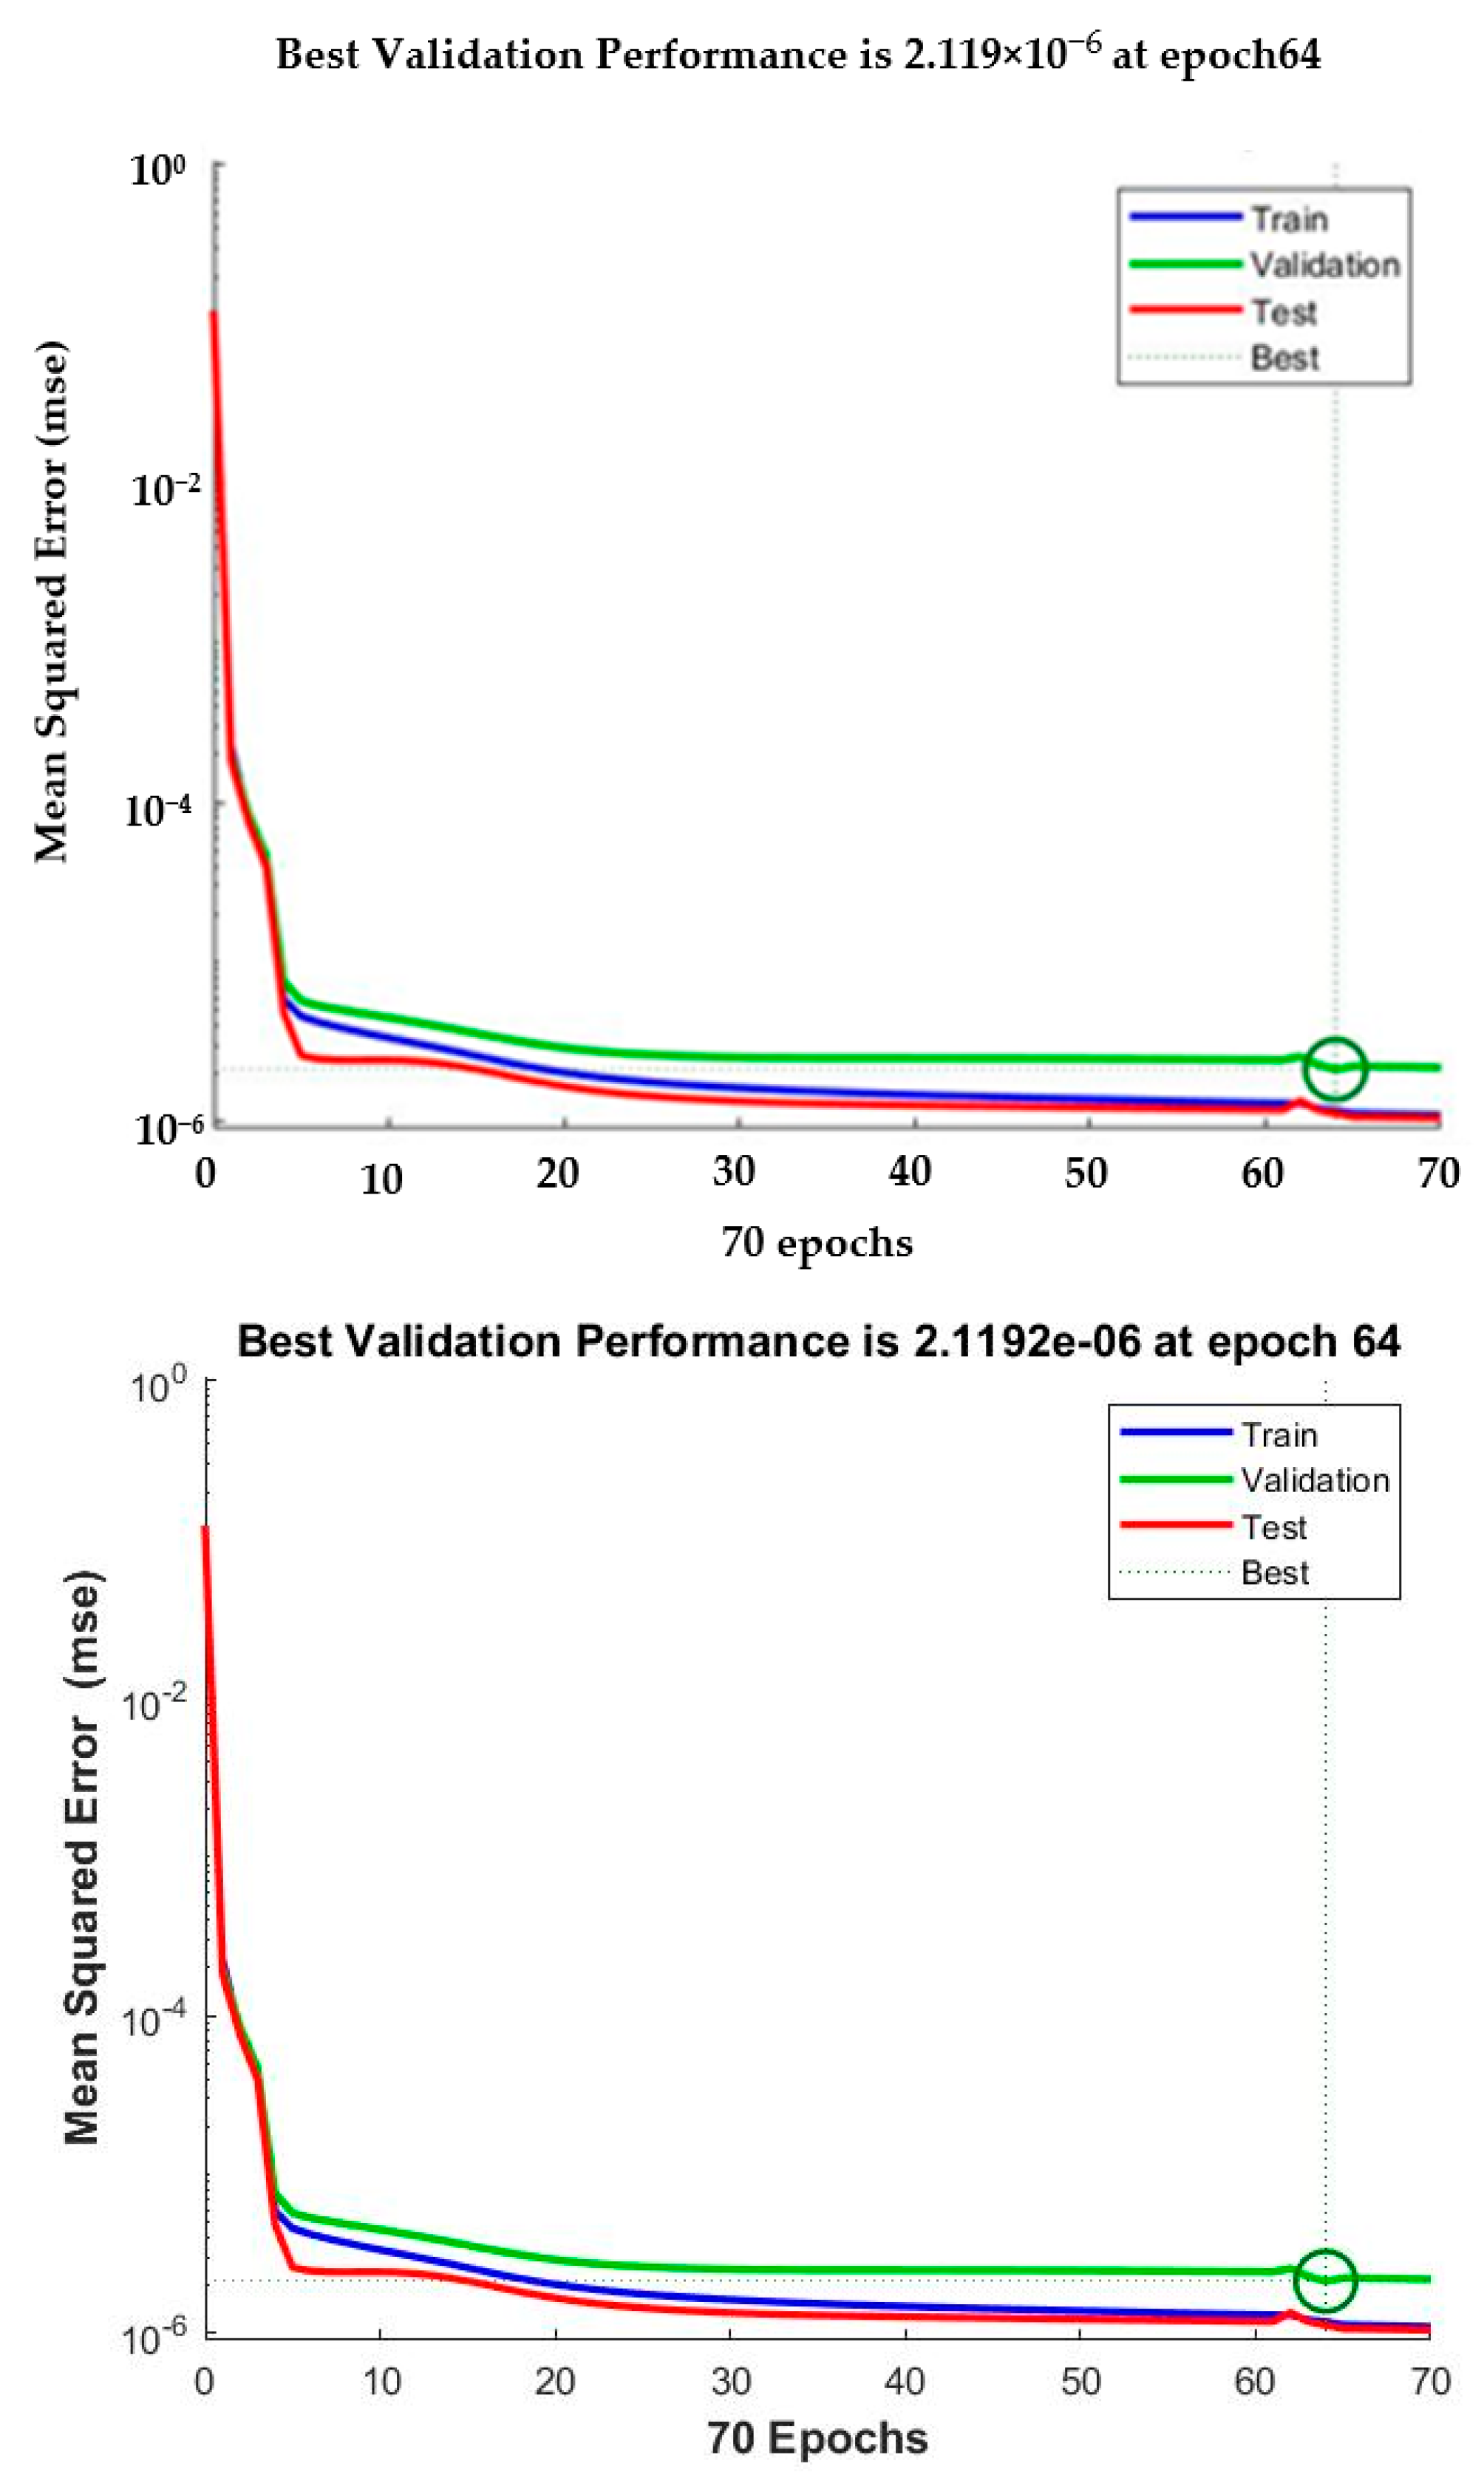
2.4. The Process of the BP Neural Network Design and Construction
3. Experimental
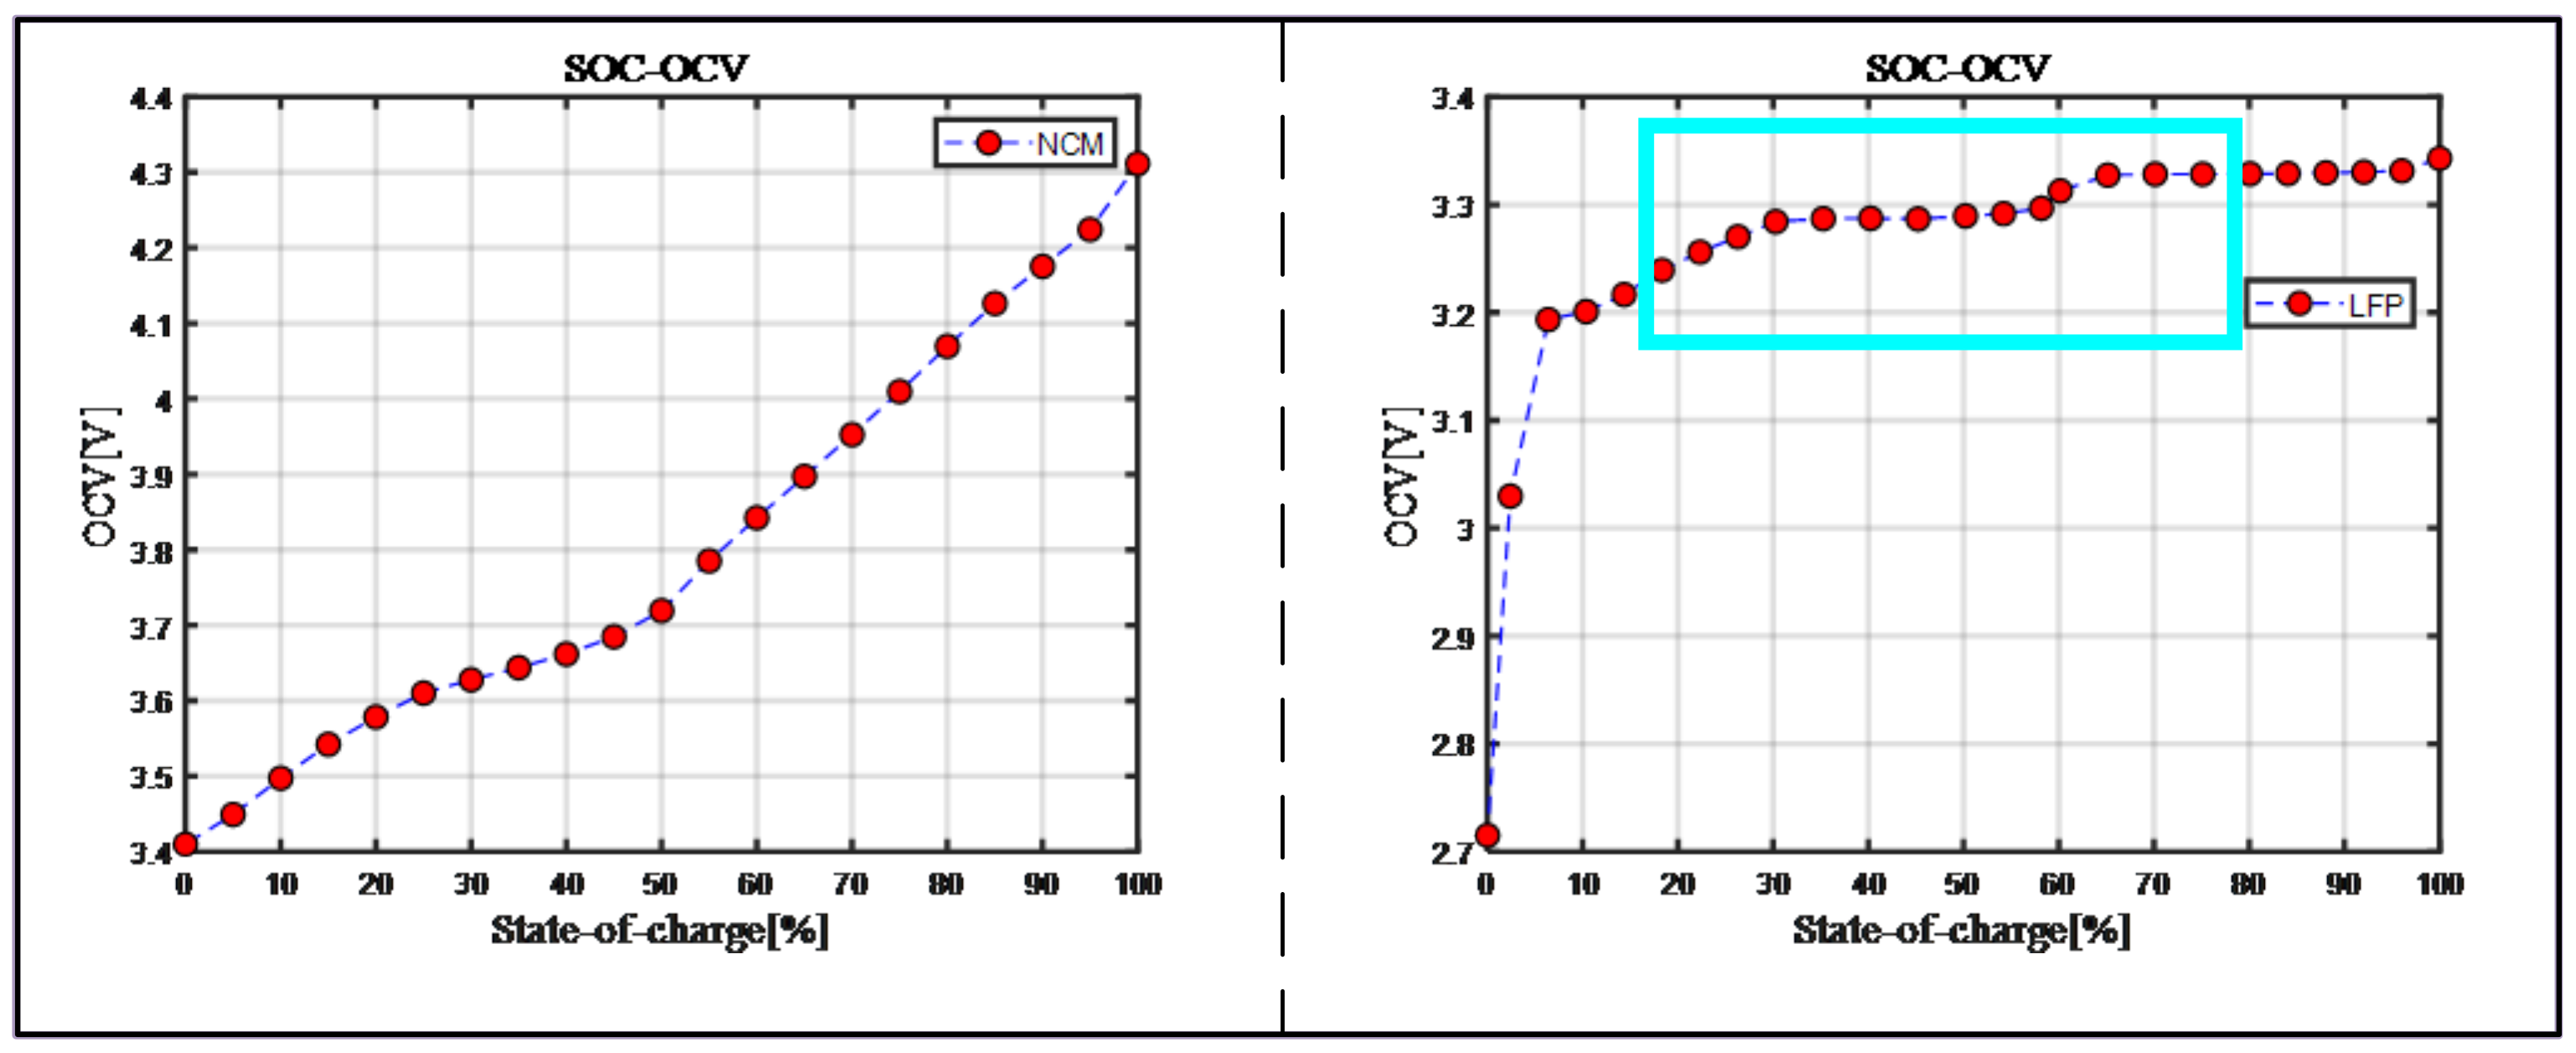
3.1. Basic Tests
3.2. Specific Experiments
4. Results and Discussion
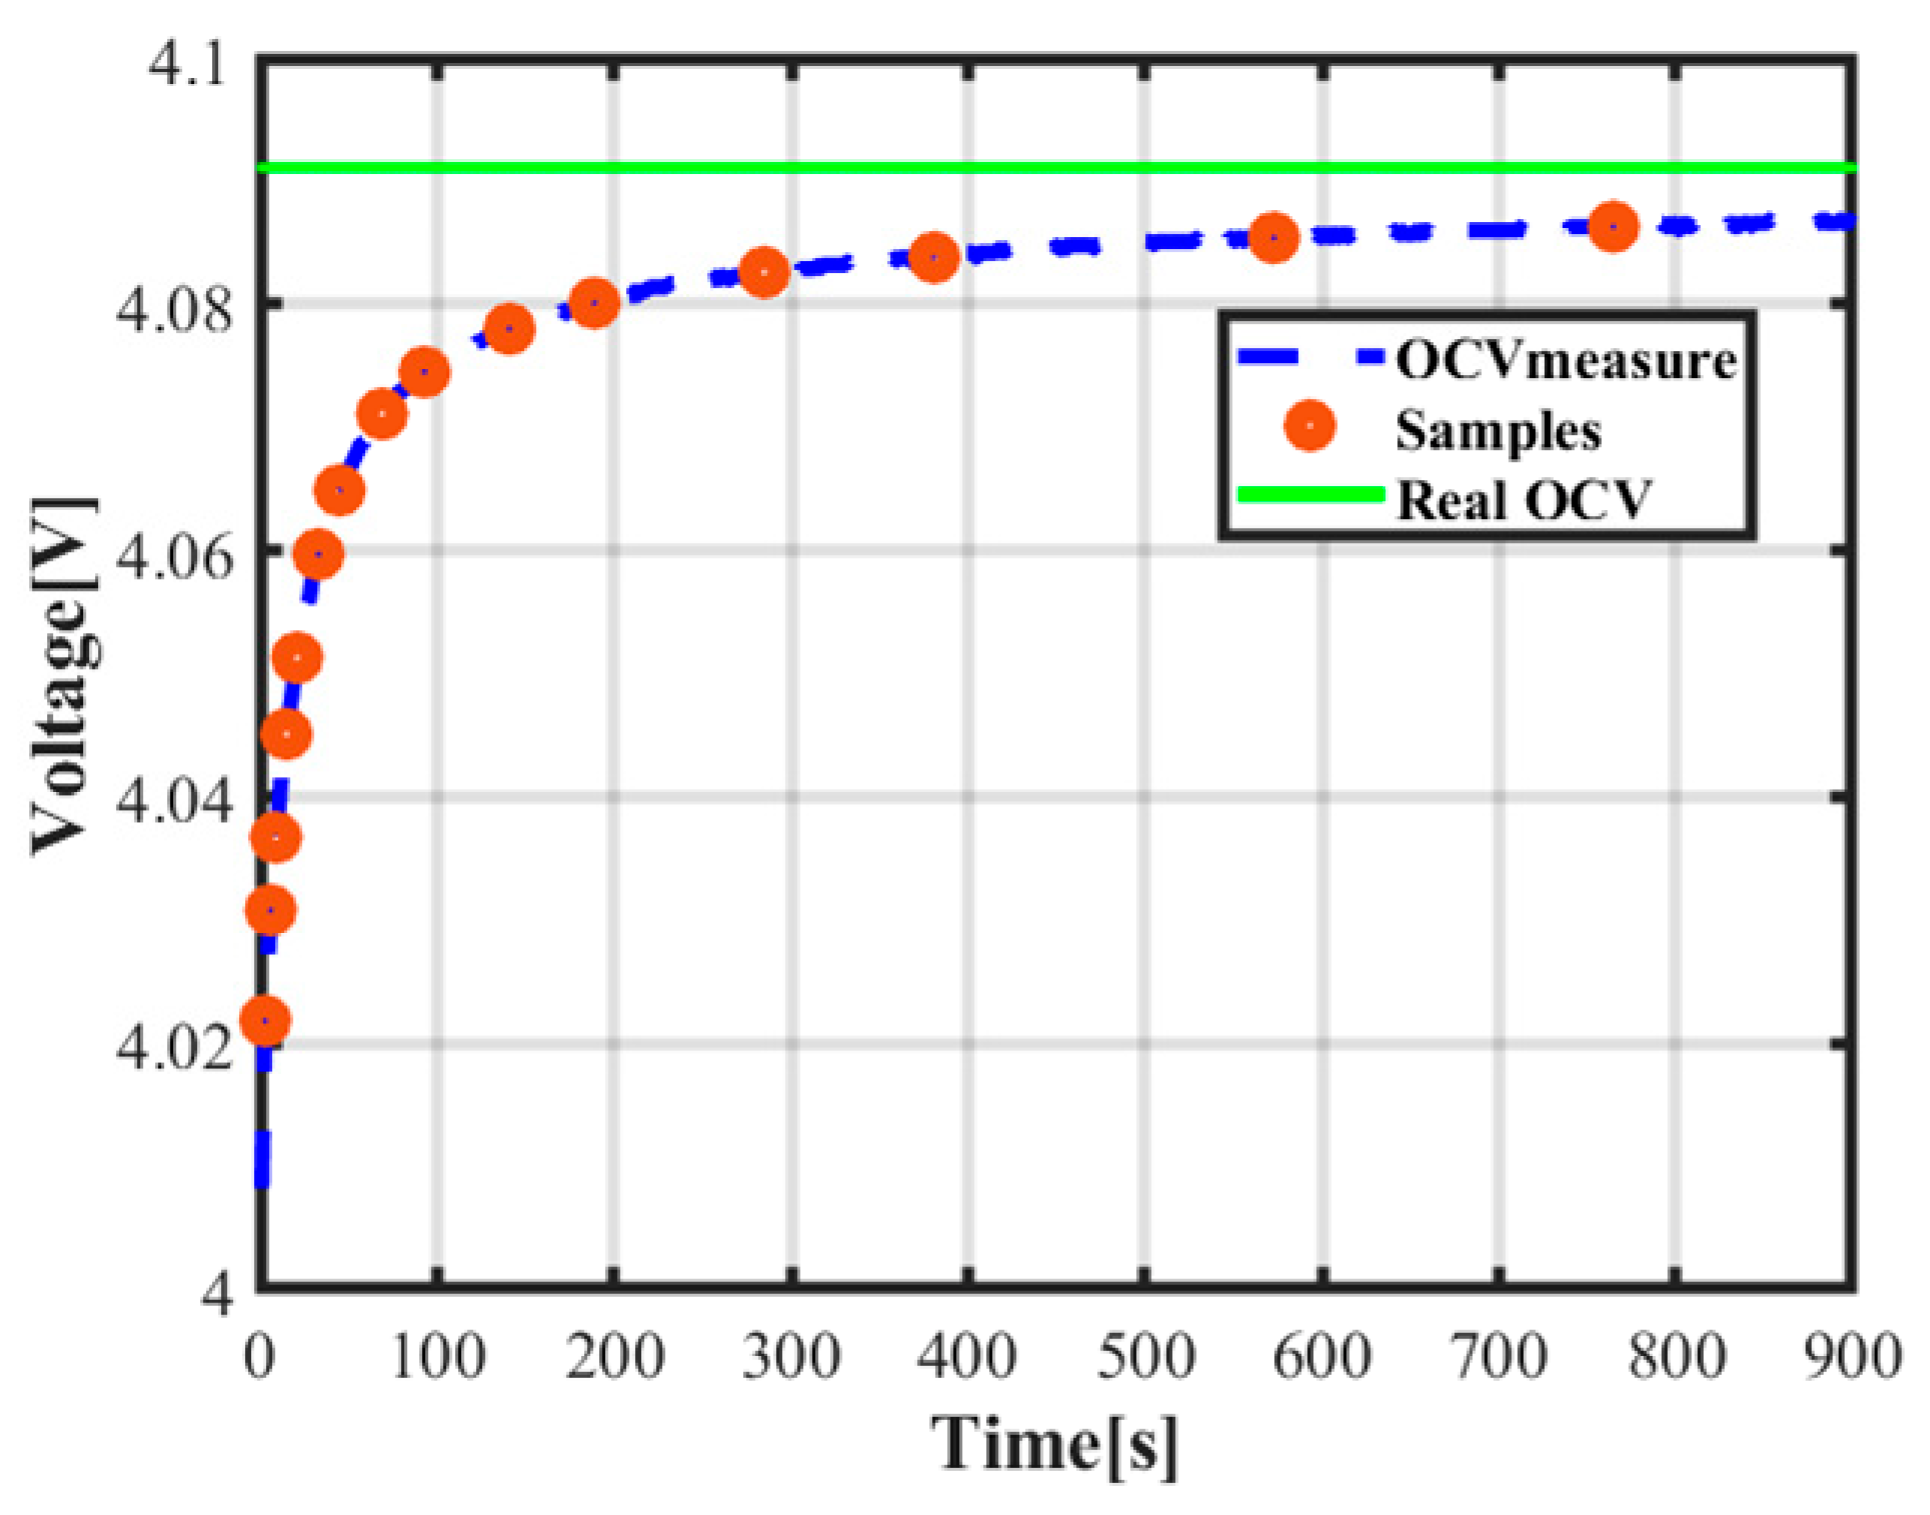
4.1. Predicted Results of the OCV
4.2. SOC and Capacity Estimation
4.3. Validation of Methods in Cloud Data
5. Conclusions
Author Contributions
Funding
Institutional Review Board Statement
Informed Consent Statement
Data Availability Statement
Acknowledgments
Conflicts of Interest
Abbreviations
| EV | Electric vehicle |
| BMS | Battery management system |
| SOC | State of charge |
| OCV | Open-circuit voltage |
| BP | Back propagation |
References
- Greene, D.L.; Ogden, J.M.; Lin, Z. Challenges in the designing, planning and deployment of hydrogen refueling infrastructure for fuel cell electric vehicles. eTransportation 2020, 6, 100086. [Google Scholar] [CrossRef]
- Dixon, J.; Bell, K. Electric vehicles: Battery capacity, charger power, access to charging and the impacts on distribution networks. eTransportation 2020, 4, 100059. [Google Scholar] [CrossRef]
- Su, L.; Wu, M.; Li, Z.; Zhang, J. Cycle life prediction of lithium-ion batteries based on data-driven methods. eTransportation 2021, 10, 100137. [Google Scholar] [CrossRef]
- Xiong, R.; Zhang, Y.; Wang, J.; He, H.; Peng, S.; Pecht, M. Lithium-Ion Battery Health Prognosis Based on a Real Battery Management System Used in Electric Vehicles. IEEE Trans. Veh. Technol. 2019, 68, 4110–4121. [Google Scholar] [CrossRef]
- Schmidt, S. Use of battery swapping for improving environmental balance and price-performance ratio of electric vehicles. eTransportation 2021, 9, 100128. [Google Scholar] [CrossRef]
- Wang, X.; Wei, X.; Zhu, J.; Dai, H.; Zheng, Y.; Xu, X.; Chen, Q. A review of modeling, acquisition, and application of lithium-ion battery impedance for onboard battery management. eTransportation 2021, 7, 100093. [Google Scholar] [CrossRef]
- Yang, X.; Doyle-Davis, K.; Gao, X.; Sun, X. Recent progress and perspectives on designing high-performance thick electrodes for all-solid-state lithium batteries. eTransportation 2022, 11, 100152. [Google Scholar] [CrossRef]
- Liao, C. Electrolytes and additives for batteries Part I: Fundamentals and insights on cathode degradation mechanisms. eTransportation 2020, 5, 100068. [Google Scholar] [CrossRef]
- Tong, S.; Klein, M.P.; Park, J.W. On-line optimization of battery open circuit voltage for improved state-of-charge and state-of-health estimation. J. Power Sources 2015, 293, 416–428. [Google Scholar] [CrossRef]
- Ablay, G. Online Condition Monitoring of Battery Systems with a Nonlinear Estimator. IEEE Trans. Energy Convers. 2014, 29, 232–239. [Google Scholar] [CrossRef]
- Mukherjee, N.; De, D. A New State-of-Charge Control Derivation Method for Hybrid Battery Type Integration. IEEE Trans. Energy Convers. 2017, 32, 866–875. [Google Scholar] [CrossRef]
- Hossain, M.; Saha, S.; Haque, M.E.; Arif, M.T.; Oo, A.M.T. A Parameter Extraction Method for the Thevenin Equivalent Circuit Model of Li-ion Batteries. In Proceedings of the 2019 IEEE Industry Applications Society Annual Meeting, Baltimore, MD, USA, 29 September–3 October 2019. [Google Scholar]
- Jaguemont, J.; Nikolian, A.; Omar, N.; Goutam, S.; Mierlo, J.V.; Bossche, P.V.d. Development of a Two-Dimensional-Thermal Model of Three Battery Chemistries. IEEE Trans. Energy Convers. 2017, 32, 1447–1455. [Google Scholar] [CrossRef]
- Thirugnanam, K.; Joy T.P., E.R.; Singh, M.; Kumar, P. Mathematical Modeling of Li-Ion Battery Using Genetic Algorithm Approach for V2G Applications. IEEE Trans. Energy Convers. 2014, 29, 332–343. [Google Scholar] [CrossRef]
- Zheng, Y.; Qin, C.; Lai, X.; Han, X.; Xie, Y. A novel capacity estimation method for lithium-ion batteries using fusion estimation of charging curve sections and discrete Arrhenius aging model. Appl. Energy 2019, 251, 113327. [Google Scholar] [CrossRef]
- Sun, T.; Xu, B.; Cui, Y.; Feng, X.; Han, X.; Zheng, Y. A sequential capacity estimation for the lithium-ion batteries combining incremental capacity curve and discrete Arrhenius fading model. J. Power Sources 2021, 484, 229248. [Google Scholar] [CrossRef]
- Yang, H.; Wang, P.; An, Y.; Shi, C.; Sun, X.; Wang, K.; Zhang, X.; Wei, T.; Ma, Y. Remaining useful life prediction based on denoising technique and deep neural network for lithium-ion capacitors. eTransportation 2020, 5, 100078. [Google Scholar] [CrossRef]
- Goh, T.; Park, M.; Seo, M.; Kim, J.G.; Kim, S.W. Capacity estimation algorithm with a second-order differential voltage curve for Li-ion batteries with NMC cathodes. Energy 2017, 135, 257–268. [Google Scholar] [CrossRef]
- Li, X.; Wang, Z.; Yan, J. Prognostic health conditio n for lithium battery using the partial incremental capacity and Gaussian process regression. J. Power Sources 2019, 421, 56–67. [Google Scholar] [CrossRef]
- Li, X.; Wang, Z.; Zhang, L.; Zou, C.; Dorrell, D.D. State-of-health estimation for Li-ion batteries by combing the incremental capacity analysis method with grey relational analysis. J. Power Sources 2019, 410–411, 106–114. [Google Scholar] [CrossRef]
- Tang, X.P.; Liu, K.L.; Lu, J.Y.; Liu, B.Y.; Wang, X.; Gao, F.R. Battery incremental capacity curve extraction by a two-dimensional Luenberger-Gaussian-moving-average filter. Appl. Energy 2020, 280, 115895. [Google Scholar] [CrossRef]
- Berecibar, M.; Garmendia, M.; Gandiaga, I.; Crego, J.; Villarreal, I. State of health estimation algorithm of LiFePO4 battery packs based on differential voltage curves for battery management system application. Energy 2016, 103, 784–796. [Google Scholar] [CrossRef]
- Ni, Y.; Xu, J.; Zhu, C.; Pei, L. Accurate residual capacity estimation of retired LiFePO4 batteries based on mechanism and data-driven model. Appl. Energy 2022, 305, 117922. [Google Scholar] [CrossRef]
- Li, R.; Wang, H.; Dai, H.; Hong, J.; Tong, G.; Chen, X. Accurate state of charge prediction for real-world battery systems using a novel dual-dropout-based neural network. Energy 2022, 250, 123853. [Google Scholar] [CrossRef]
- Xiong, R.; Yu, Q.; Wang, L.Y.; Lin, C. A novel method to obtain the open circuit voltage for the state of charge of lithium ion batteries in electric vehicles by using H infinity filter. Appl. Energy 2017, 207, 346–353. [Google Scholar] [CrossRef]
- Wei, K.X.; Chen, Q.Y. Battery SOC Estimation based on Multi-model Adaptive Kalman Filter. In Advanced Materials Research; Trans Tech Publications Ltd.: Wollerau, Switzerland, 2012. [Google Scholar]
- Ilies, A.I.; Chindris, G.; Pitica, D. A Comparison between State of Charge Estimation Methods: Extended Kalman Filter and Unscented Kalman Filter. In Proceedings of the 2020 IEEE 26th International Symposium for Design and Technology in Electronic Packaging (Siitme 2020), Pitesti, Romania, 21–24 October 2020; pp. 376–381. [Google Scholar]
- Liu, X.; Chen, Z.; Zhang, C.; Wu, J. A novel temperature-compensated model for power Li-ion batteries with dual-particle-filter state of charge estimation. Appl. Energy 2014, 123, 263–272. [Google Scholar] [CrossRef]
- He, Y.; Liu, X.; Zhang, C.; Chen, Z. A new model for State-of-Charge (SOC) estimation for high-power Li-ion batteries. Appl. Energy 2013, 101, 808–814. [Google Scholar] [CrossRef]
- Zhou, Z.; Cui, Y.; Kong, X.; Li, J.; Zheng, Y. A fast capacity estimation method based on open circuit voltage estimation for LiNixCoyMn1-x-y battery assessing in electric vehicles. J. Energy Storage 2020, 32, 101830. [Google Scholar] [CrossRef]
- Yu, Q.Q.; Wan, C.J.; Li, J.F.; E, L.; Zhang, X.; Huang, Y.H.; Liu, T. An Open Circuit Voltage Model Fusion Method for State of Charge Estimation of Lithium-Ion Batteries. Energies 2021, 14, 1797. [Google Scholar] [CrossRef]
- Yang, Y.P.; Liu, J.J.; Tsai, C.H. Improved estimation of residual capacity of batteries for electric vehicles. J. Chin. Inst. Eng. 2008, 31, 313–322. [Google Scholar] [CrossRef]
- Dewangga, B.R.; Herdjunanto, S.; Cahyadi, A. Unknown Input Observer for Battery Open Circuit Voltage Estimation: An LMI Approach. In Proceedings of the 2018 the 10th International Conference on Information Technology and Electrical Engineering (icitee), Bali, Indonesia, 24–26 July 2018; pp. 471–475. [Google Scholar]
- Zhu, J.G.; Wang, Y.X.; Huang, Y.; Gopaluni, R.B.; Cao, Y.K.; Heere, M.; Muhlbauer, M.J.; Mereacre, L.; Dai, H.F.; Liu, X.H.; et al. Data-driven capacity estimation of commercial lithium-ion batteries from voltage relaxation. Nat. Commun. 2022, 13, 1–10. [Google Scholar] [CrossRef]
- Galushkin, N.E.; Yazvinskaya, N.N.; Galushkin, D.N. Model of Relaxation Processes in Batteries. ECS Electrochem. Lett. 2015, 94–96. [Google Scholar] [CrossRef]
- Kirk, T.L.; Please, C.P.; Chapman, S.J. Physical Modelling of the Slow Voltage Relaxation Phenomenon in Lithium-Ion Batteries. J. Electrochem. Soc. 2021, 168, 060554. [Google Scholar] [CrossRef]
- Yang, J.; Du, C.Y.; Wang, T.; Gao, Y.Z.; Cheng, X.Q.; Zuo, P.J.; Ma, Y.L.; Wang, J.J.; Yin, G.P.; Xie, J.Y.; et al. Rapid Prediction of the Open-Circuit-Voltage of Lithium Ion Batteries Based on an Effective Voltage Relaxation Model. Energies 2018, 11, 3444. [Google Scholar] [CrossRef] [Green Version]
- Huang, C.; Wang, L. Gaussian process regression-based modelling of lithium-ion battery temperature-dependent open-circuit-voltage. Electron. Lett. 2017, 53, 1214–1216. [Google Scholar] [CrossRef]


| Items | Specifications |
|---|---|
| Positive and negative electrode materials | NCM/C |
| Normal capacity (Ah) | 3.1 |
| Normal voltage (V) | 3.6 |
| Charge/discharge cut-off voltage (V) | 4.1/2.5 |
| Nominal charging mode | CC-CV |
| Operating temperature (°C) | Charge −10~45/Discharge −20~60 |
| Number | The Experimental Scheme | Temperature |
|---|---|---|
| Cell1~Cell4 | Charge/discharge- rest cycle | 10 °C~25 °C~45 °C |
| Cell5 | Cycle of aging | 25 °C |
| Number | Equipment | Manufacture | Indicators |
|---|---|---|---|
| 1 | PC | Lenovo | |
| 2 | Charge and discharge machine | Neware | 0–5 V, 0–1 mA |
| 3 | Thermostat | Bell | −40–150 °C |
| Steps | Specifications |
|---|---|
| Step 1 | Set the temperature at 25 °C. |
| Step 2 | Adjust the SOC to a high SOC. |
| Step 3 | Discharge at 1 C for 10 min, and rest for 3 h. |
| Step 4 | Charge at 1 C for 10 min, and rest for 3 h. |
| Step 5 | Adjust the SOC to a medium SOC. Repeat the steps from 3 to 4. |
| Step 6 | Adjust the SOC to a low SOC. Repeat the steps from 3 to 4. |
| Step 7 | Repeat the steps from 2 to 6 with 0.5 C and 2 C current. |
| Step 8 | Set the temperature at 10 °C and 45 °C. Repeat the steps from 2 to 6. |
| Number | t1 | t2 | … | t14 | t15 | Target |
|---|---|---|---|---|---|---|
| 1 | 3.9074 | 3.9152 | … | 3.9837 | 3.9849 | 3.9890 |
| 2 | 3.7555 | 3.7630 | … | 3.8247 | 3.8268 | 3.8498 |
| 3 | 3.6092 | 3.6163 | … | 3.6796 | 3.6811 | 3.6889 |
| 4 | 3.4985 | 3.5057 | … | 3.5773 | 3.5788 | 3.5847 |
| 5 | 3.3575 | 3.3665 | … | 3.4542 | 3.4595 | 3.4747 |
| 6 | 3.8482 | 3.8560 | … | 3.9195 | 3.9205 | 3.9239 |
| 7 | 3.6982 | 3.7056 | … | 3.7670 | 3.7695 | 3.7921 |
| 8 | 3.5624 | 3.5692 | … | 3.6309 | 3.6318 | 3.6359 |
| 9 | 3.4421 | 3.4495 | … | 3.5345 | 3.5382 | 3.5481 |
| 10 | 3.2753 | 3.2899 | … | 3.3717 | 3.3742 | 3.3823 |
| … | … | … | … | … | … | … |
| 352 | 3.2592 | 3.2769 | … | 3.3640 | 3.3661 | 3.3739 |
| Cycles | Initial SOC | Real OCV/V | Estimation/V | Error/mV |
|---|---|---|---|---|
| 20 | 81.212% | 3.8227 | 3.8216 | 1.1 |
| 30 | 82.694% | 3.8354 | 3.8345 | 0.9 |
| 50 | 83.576% | 3.8452 | 3.8431 | 2.1 |
| 70 | 84.4% | 3.8541 | 3.8529 | 1.2 |
| 100 | 83.5129 | 3.8406 | 3.835 | 2.4 |
| Name | Result 1 | Result 2 | Result 3 | Result 4 | Result 5 |
|---|---|---|---|---|---|
| Initial OCV1 (V) | 3.9509 | 3.9034 | 3.6657 | 3.8028 | 3.8550 |
| Initial SOC1 (%) | 86.21 | 77.58 | 52.36 | 60.89 | 67.32 |
| Changed Ah | 0.5 | 0.5 | 0.5 | 0.5 | 0.5 |
| Predicted OCV2 (V) | 3.8053 | 3.7562 | 3.5886 | 3.6231 | 3.6949 |
| Real OCV2 (V) | 3.8061 | 3.7558 | 3.5876 | 3.6238 | 3.6938 |
| OCV prediction error (mV) | 0.7 | 0.4 | 1.0 | 0.7 | 1.1 |
| Estimated SOC2 (%) | 69.84 | 60.71 | 35.93 | 44.5 | 50.9 |
| Changed SOC (%) | 16.37 | 16.87 | 16.43 | 16.39 | 16.42 |
| Estimated capacity (Ah) | 3.154 | 3.063 | 3.144 | 3.151 | 3.145 |
| Real capacity (Ah) | 3.1 | 3.1 | 3.1 | 3.1 | 3.1 |
| Capacity estimation error (Ah) | 0.054 | 0.037 | 0.044 | 0.051 | 0.045 |
| Percentage of capacity estimation error (%) | 1.8 | 1.2 | 1.5 | 1.7 | 1.5 |
| Name | Cell 5 | Cell 6 | Cell 7 | Cell 8 |
|---|---|---|---|---|
| Initial OCV1 (V) | 3.28 | 3.28 | 3.284 | 3.283 |
| Initial SOC1 (%) | 29.0599 | 29.0599 | 30.1978 | 29.9133 |
| Changed Ah | 35.91 | 35.91 | 35.91 | 35.91 |
| Predicted OCV2 (V) | 3.3392 | 3.3338 | 3.3306 | 3.3318 |
| Real OCV2 (V) | 3.341 | 3.335 | 3.332 | 3.333 |
| OCV prediction error (mV) | 1.8 | 1.2 | 1.4 | 1.2 |
| Predicted SOC2 (%) | 98.7181 | 96.8473 | 93.3599 | 96.1544 |
| Real SOC2 (%) | 99.3418 | 97.2631 | 96.2237 | 96.5702 |
| Percentage of SOC estimation error (%) | 0.6236 | 0.157 | 2.8638 | 0.4158 |
| Changed SOC (%) | 69.6583 | 67.7885 | 63.1622 | 66.2412 |
| Predicted capacity (Ah) | 51.5516 | 52.9774 | 56.8537 | 54.211 |
| Real capacity (Ah) | 51.0942 | 52.6515 | 54.3877 | 53.872 |
| Nominal capacity (Ah) | 55 | 55 | 55 | 55 |
| Capacity estimation error (Ah) | 0.4574 | 0.3259 | 2.466 | 0.339 |
| Percentage of capacity estimation error (%) | 0.9 | 0.62 | 4.5 | 0.63 |
Publisher’s Note: MDPI stays neutral with regard to jurisdictional claims in published maps and institutional affiliations. |
© 2022 by the authors. Licensee MDPI, Basel, Switzerland. This article is an open access article distributed under the terms and conditions of the Creative Commons Attribution (CC BY) license (https://creativecommons.org/licenses/by/4.0/).
Share and Cite
Bao, W.; Liu, H.; Sun, Y.; Zheng, Y. A Fast Prediction of Open-Circuit Voltage and a Capacity Estimation Method of a Lithium-Ion Battery Based on a BP Neural Network. Batteries 2022, 8, 289. https://doi.org/10.3390/batteries8120289
Bao W, Liu H, Sun Y, Zheng Y. A Fast Prediction of Open-Circuit Voltage and a Capacity Estimation Method of a Lithium-Ion Battery Based on a BP Neural Network. Batteries. 2022; 8(12):289. https://doi.org/10.3390/batteries8120289
Chicago/Turabian StyleBao, Wenkang, Haidong Liu, Yuedong Sun, and Yuejiu Zheng. 2022. "A Fast Prediction of Open-Circuit Voltage and a Capacity Estimation Method of a Lithium-Ion Battery Based on a BP Neural Network" Batteries 8, no. 12: 289. https://doi.org/10.3390/batteries8120289