Article

Deep Eutectic Solvent (DES) for In Situ Templating Carbon Material: Carbon Characterization and Application in Supercapacitors Containing Multivalent Ions

1
Department of Physical Chemistry, “Vinča” Institute of Nuclear Sciences—National Institute of the Republic of Serbia, University of Belgrade, Mike Petrovića Alasa 12–14, 11351 Belgrade, Serbia
2
Institute of Technical Sciences of SASA, Knez Mihailova 35, 11000 Belgrade, Serbia
3
Center for Catalysis and Chemical Engineering, Institute for Chemistry, Technology and Metallurgy, University of Belgrade, Njegoševa 12, 11000 Belgrade, Serbia
4
Faculty of Physical Chemistry, University of Belgrade, Studentski Trg 12–14, 11158 Belgrade, Serbia
*
Author to whom correspondence should be addressed.
Batteries 2022, 8(12), 284; https://doi.org/10.3390/batteries8120284
Submission received: 29 October 2022 / Revised: 28 November 2022 / Accepted: 6 December 2022 / Published: 13 December 2022
(This article belongs to the Special Issue Advances in Carbon-Based Materials for Energy Storage)

Abstract

:
The development of carbon materials with desirable textures and new aqueous electrolytes is the key strategy to improve the performance of supercapacitors. Herein, a deep eutectic solvent (DES) was used for in situ templating of a carbon material. A carbon material was characterized (XRD, N2-physisorption, FTIR, SEM and EDS) and used as an electrode material for the first time in multivalent-based supercapacitors. In situ templating of carbon was performed using a novel DES, which serves as a precursor for carbon and for in situ generation of MgO. The generation of MgO and its roles in templating of carbon were discussed. Templating of carbon with MgO lead to an increase in surface area and a microporous texture. The obtained carbon was tested in multivalent-ion (Al3+ and Mg2+) electrolytes and compared with H2SO4. The charge-storage mechanism was investigated and elaborated. The highest specific capacitance was obtained for the Al(NO3)3 electrolyte, while the operating voltage follows the order: Mg(NO3)2 > Al(NO3)3 > H2SO4. Electrical double-layer capacitance (versus pseudocapacitance) was dominant in all investigated electrolytes. The larger operating voltage in multivalent electrolytes is a consequence of the lower fraction of free water, which suppresses hydrogen evolution (when compared with H2SO4). The GCD was experimentally performed on the Al(NO3)3 electrolyte, which showed good cyclic stability, with an energy density of 22.3 Wh kg−1 at 65 W kg−1.

1. Introduction

The design and formulation of new electrode materials and electrolytes for electrochemical supercapacitors have received much attention in recent decades. Although electrochemical supercapacitors provide many advantages, the main drawback is low energy densities. Low energy densities result in difficulty achieving the long-term operation necessary for some electric industries [1]. It is well known that the energy density is proportional to the capacitance of the electrode material and to the voltage squared. Consequently, there are two effective strategies to improve the energy density of supercapacitors—increasing the capacitance of the electrode material or/and increasing the operating voltage.
In the first strategy, a large number of high-capacitance materials have been developed, including carbon-based materials, transition metal oxides and different conducting polymers [2,3]. In order to achieve high capacitance values, all these materials need to have high electrical conductivity, an adequate pore size, a high surface area and adequate surface functional groups. Due to the relatively easy and cheap synthesis of porous carbon materials with all the mentioned requirements, they have found the most promising application as electrode materials in supercapacitors [2,4,5]. Different methods and precursors were used to prepare carbon materials with desirable physicochemical properties. Carbon materials with a high surface area and different surface functional groups were synthesized using biomass, polymers and different types of organic waste [6,7,8,9]. A relatively new aspect of carbon material synthesis is the application of ionic liquids and deep eutectic solvents as liquid carbon precursors [10]. Deep eutectic solvents (DESs) are organic compounds consisting of hydrogen-bond donors and hydrogen-bond acceptors. DESs have several remarkable properties, such as low cost, simple synthesis (using only two compounds without additional solvents) and low vapor pressure, and they are non-toxic solvents. Regarding the mentioned properties, DESs have numerous applications in different fields of science, including analytical chemistry, organic synthesis, catalysis and electrochemistry [11,12,13,14]. In addition to all these fields, as mentioned before, DESs have found applications in carbon material synthesis. This relatively simple method for carbon material synthesis is based on the direct high-temperature carbonization (under inert atmosphere) of DESs. Furthermore, this method does not require additional treatments of DESs before carbonization, such as high-pressure hydrothermal treatment. However, these methods allow for creating carbon materials with tunable properties, since the chemical structures and properties of deep eutectic solvents will be reflected in the obtained carbons. We should first discuss the chemical composition of DESs. Since DESs are organic compounds, their carbon nature makes them perfect carbon precursors. Furthermore, DESs usually contain other heteroatoms (such as nitrogen and boron), and they can serve as heteroatom precursors [15]. Therefore, it is easy to synthesize heteroatom-doped carbons using only one DES. Secondly, the diversity of chemical structures of DESs will be reflected in the morphology and texture of the final carbon materials, and DESs offer the possibility of preparing carbon materials with characteristic morphologies and textures [16]. In conclusion, DESs have several roles: as carbon precursors and heteroatom precursors (easy to synthesize heteroatom-doped carbons) and in templating. With all these roles, DESs are suitable low-cost precursors for the industrial large-scale production of porous carbon materials.
Recently, in order to increase the performance of carbon electrodes for supercapacitors and increase the specific surface area, new in situ templating methods based on different oxides have been introduced [17]. In situ templating implies the use of a mixture of an oxide precursor and a carbon precursor [18]. In situ generation of oxides occurs during carbonization processes, where the oxide precursor undergoes several reactions, leading to the generation of oxide nanoparticles. In situ-generated oxides serve as hard templates; therefore, the use of complicated templating procedures and pre-treatment of carbon precursors can be avoided. Different salts have been used for in situ generation of oxides, such as FeCl2, ZnCl2, Mg(CH3COOH)2 and Zn(NO3)2 [19,20,21,22]. New in situ templating methods are simple, cheap and environmentally friendly methods and offer the possibility of preparing carbon materials with different textural properties suitable for application in electrochemical supercapacitors.
In the second strategy, different electrolytes with large operating windows were developed [23]. The potential windows of aqueous electrolytes (such as the conventional 1 M H2SO4 and 6 M KOH electrolytes for supercapacitors) are limited by water decomposition (theoretically 1.23 V), which is a consequence of hydrogen and oxygen evolution. To eliminate the electrochemical instability of water and increase the potential window and energy density of supercapacitors, different organic electrolytes have been formulated. Organic electrolytes usually consist of acetonitrile or propylene carbonate, and in this case, the cell voltage is between 2.5 and 2.8 V [23]. Additionally, various organic mixtures have been employed, such as tetrabutylammonium hexafluorophosphate in acetonitrile, increasing the potential window to 2 V [24]. Recently, different ionic liquids have been used as electrolytes for supercapacitors [24]. Ionic liquids show the largest operating potential windows—in some reported cases up to a remarkable 4 V [25]. However, using organic electrolytes, in addition to large operating potential windows, has several disadvantages. Organic electrolytes are usually expensive, flammable and toxic. In order to eliminate the disadvantages of organic electrolytes, the development of new aqueous electrolytes with wide potential windows represents the future of electrochemical supercapacitors. Different aqueous electrolytes, usually alkali sulphate salts, have been used in supercapacitors. Most of them are pH neutral, such as Li2SO4, Na2SO4 and K2SO4. However, the use of all these electrolytes has disadvantages, such as low solubility and limited conductivity [26]. Therefore, nitrate salts-based electrolytes are good candidates for application in supercapacitors. Recently, the aqueous aluminum nitrate electrolyte was proposed as an electrolyte for carbon-based electrochemical supercapacitors [27]. Carbon electrodes showed a higher energy density in the Al2(SO4)3 electrolyte than in H2SO4 and Na2SO4. Gudru et al. investigated the charge-storage behavior of commercial activated carbon in both Al(NO3)3 and Mg(NO3)2 electrolytes; however, the authors reported very low capacitance values (approximately 30–40 F g−1) and short operating voltages (1 V) [28].
In this paper, we used both strategies to improve the properties of a electrochemical supercapacitor. Carbon material was prepared by an in situ templating method using deep eutectic solvent (DESs). The DES was prepared with choline chloride ([Ch]Cl) and magnesium chloride hexahydrate (MgCl2·6H2O) (Type II DESs). Both precursors for DES preparation are non-toxic and environmentally friendly. In the mentioned DES, magnesium (i.e., MgO formed during carbonization processes) serves as an in situ templating agent. The prepared carbon was tested as an electrode for energy storage in multivalent-ion electrolytes (1 M Al(NO3)3 and Mg(NO3)2) and compared with an conventional acidic electrolyte (1 M H2SO4).

2. Materials and Methods

2.1. Synthesis of Carbon Materials

Carbon materials were synthetized using DES as carbon precursor. DES was prepared by mixing choline chloride (Acros Organics, Geel, Belgium, purity 99%) with magnesium chloride hexahydrate (MgCl2·6H2O, Acros Organics, Geel, Belgium, purity 99+ %, ACS reagent) in 2:1 ratio at 60 °C. After their mixing, the transparent molecular liquid was formed. Carbonization was performed in the tube furnace (Protherm, Ergazi Mah, Ankara, Turkey) equipped with alumina tube. The ionic precursor was carbonized at 700 °C, with a heating rate of β = 10 °C min−1 and a nitrogen flow rate of 10 mL min−1. Carbonized sample was denoted as Carbunw. Furthermore, the Carbunw sample was immersed in 10% HCl (Sigma Aldrich, St. Louis, MO, USA) solution for 12 h and then washed with deionized water until the pH was 6–7. After washing, porous carbon was dried at 100 °C for 24 h and the sample was denoted as Carbw.

2.2. Characterization of Carbons

Nitrogen physisorption analysis was performed by N2 adsorption at −196 °C (Sorptomatic 1990, Thermo Finnigan, San Jose, CA, USA). First, the sample was degassed at room temperature under vacuum for 2 h and treated at 200 °C for 24 h at the same residual pressure. Obtained results were analyzed with ADP ver. 5.13 Thermo Electron software packages.
The X-ray powder diffraction (XRD) measurement was performed on a Philips PW 1050 X-ray powder diffractometer (Philips, Amsterdam, Netherlands) with Ni-filtered Cu Kα radiation and Bragg–Brentano focusing geometry. The diffractograms were recorded in the 2θ range of 10–70°, with step size of 0.02° and a counting time of 3 s per step. The calculation of the average crystallite size was conducted by using the XFIT-Koalariet software and the fundamental parameters convolution approach to generate line profiles [29].
The surface chemistry of carbons was analyzed by Fourier transform infrared (FTIR) spectroscopy. FTIR spectroscopy was performed using Nicolet iS5 FTIR spectrometer (Thermo Fisher Scientific, Waltham, MA, USA). FTIR spectra were measured in the range of 4000–400 cm−1 using the KBr pellet technique.
The morphology of carbon was investigated using scanning electron microscopy (SEM). Micrographs were recorded using FEI SCIOS 2 Dual Beam electron microscope (Thermo Fischer Scientific, Waltham, MA, USA) equipped with energy-dispersive X-ray spectroscopy (EDS) system.

2.3. Electrochemical Measurements

The working electrode was prepared using the mixture of carbon material and 5% Nafion (Sigma Aldrich, St. Louis, MO, USA) as a binder, in the ratio 95:5. The obtained mixture was suspended in ethanol and treated in an ultrasonic bath (1 h). The certain fraction of homogenized mixture was transferred onto a glassy carbon electrode (GCE) to obtain working electrode. Modified GCE was dried in an oven at 80 °C for 2 h. Electrochemical measurements were performed using Gamry 1000E potenciostat/galvanostat (Gamry, Philadelphia, PA, USA). First, electrochemical measurements were conducted in three-electrodes electrochemical cell (at room temperature), with a Pt as a counter electrode, saturated calomel electrode (SCE) as the reference electrode and modified GCE as a working electrode. The aqueous solutions of 1 M H2SO4, 1 M Al(NO3)3 and 1 M Mg(NO3)2 were used as the electrolytes. CVs were performed in different voltage intervals: for 1 M H2SO4 from 0.7 V to −0.3 V; for 1 M Al(NO3)3 from 0.7 V to −0.6 V and for 1 M Mg(NO3)2 from 0.8 V to −0.8 V. CVs were recorded in different scan rates from 5 to 500 mV s−1.
The specific capacitance (F g−1) of the electrode was calculated by the integration of CV voltammograms (cathodic or anodic), as in Equation (1):
C = I · V · d V m · v · Δ V
where I is the measured current, V is the potential, m is the mass of electroactive material layer onto the GCE, v is the applied scan rate and ΔV is the used potential window.
Dunn’s analysis was used to separate electrical double-layer capacitance (EDLC) and pseudocapacitance (PC). This method consists of several steps, as explained in reference [30]. At fixed potential, the current density (j) from the CVs could be expressed by Equation (2):
j = k 1 · v + k 2 · v 0.5
where the first term k 1 · v accounts for current densities contributed from electrical double-layer capacitance (EDLC) and the second term k 2 · v 0.5 is associated with pseudocapacitive reactions. Reforming Equation (2) by dividing v 0.5 on both sides yields to Equation (3):
j · v 0.5 = k 1 · v 0.5 + k 2
By reading j from CVs at a series of scan rates and the plotting j · v 0.5 vs. v 0.5 , the linear fit is obtained with a slope of k 1 and y-intercept of k 2 . Determination of k1 and k2 values in Equation (2) allows us to estimate EDLC and PC contribution at specific potential and selected scan rate (v). For this method, we used cathodic and anodic current at each 0.1 V. Plotting calculated current densities contributed from electrical double-layer capacitance vs. specific potentials can be obtained by EDLC contribution at specific scan rate (v).
The galvanostatic charge–discharge (GCD) experiments were performed in a two-electrode cell using different current densities in the potential range from 0 to 1.3 V. Two-electrode set-up consisted of two stainless steel electrodes covered with layer of electrode material (prepared as described above). Between two electrodes, a filter paper soaked with 1 M Al(NO3)3 electrolyte was placed. The specific capacitance of electrode material was calculated using Equation (4):
C = 2 · I · Δ t Δ V · m
where I is the constant current of charge–discharge process, Δt is discharging time, ΔV is potential window and m is mass of active material.

3. Results and Discussions

3.1. Characterization of Carbon Materials

The N2 adsorption/desorption isotherms of the tested materials are shown in Figure 1 (and Figure S1 shows pore size distribution). Based on their shapes and the values of the calculated textural parameters (Table 1), the materials differ significantly.
The isotherm of the Carbunw sample belongs to Type III according to the IUPAC nomenclature [31], which is characteristic for non-porous or macroporous materials with weak adsorbent–adsorbate interaction. Small values of the constant CBET, related to the energy of adsorption in the first adsorbed layer (CBET = 48) and total specific surface area (SSABET = 4.8 m2/g), as well as small values of the total specific volume (Vtot = 0.015 cm3/g), confirm the non-porous nature of the Carbunw sample. The content of micropores in the Carbunw sample is so small (Table 1) that the application of the Horvath–Kawazoe (HK) method for determining their distribution is practically impossible. On the other hand, a small, but still measurable content of mesopores (Vmeso-DH) enables reliable determination of median pore diameters (Dmed-DH), a diameter that corresponds to 50% of the pore volume, which amounts to 14.1 nm.
Textural characteristics significantly alter upon 10% HCl treatment. The shape of the isotherm changes and becomes Type II for the Carbw sample, which is characteristic of macroporous materials. Although the application of Gurevitsch’s rule for determining Vtot due to the absence of a plateau at higher relative pressures (p/p0) is not entirely justified, the comparison was made in order to evaluate overall changes in the pore system. The corresponding value of Vtot at the same p/p0 of 0.98 increases more than 14 times for Carbw sample; furthermore, the increase in the specific surface is even more pronounced because the washed material showed a 30 times higher value of the specific surface (146 m2/g vs. 4.8 m2/g). This indicates that the change in texture includes all pore systems, especially the smaller ones, which contribute more significantly to the specific surface area. Indeed, the existence of a mesoporous system in the material was confirmed by the clear presence of the isothermal slope (in the region p/p0 above 0.2) and the existence of a hysteresis loop, to a certain extent, while the application of the HK method in the micropore region gives a measurable value of the median diameter at about 0.95 nm, and the median pore diameter of the mesopores is 20.7 nm. Finally, the value of the constant CBET reaches a value of 570, which indicates a multifold increase in the adsorption energy of N2 on the surface of the Carbw sample and further underlines the difference in all the textural properties of the washed and unwashed samples.
Observed differences in textural properties of materials, such as Carbunw and Carbw, must be the consequence of template removal in HCl. Namely, for the synthesis of porous carbons, the ionic liquid consists of cholinium chloride, and MgCl2 (in molar ration 2:1) was used. Cholinium chloride served as a carbon precursor, while MgCl2 served as a templating agent for pore development. During the high-temperature carbonization, it could be expected that the cholinium cation decomposes into porous carbon, and it is well known that organic cations (contained in different compounds, i.e., in ionic liquids) introduce some pores and act as a self-porogen precursor [32]. Furthermore, carbon networks could be formed and pores could be developed with the help of chloride anions through substitution, addition and aromatization reactions [19]. However, it has previously been shown that the obtained Carbunw material is practically non-porous. This means that the contribution of the newly formed species (MgO) from the second constituent (MgCl2) completely prevents the development of a measurable pore system, either by filling them or overlapping them on the surface of the particles. Indeed, MgCl2 acts exactly as a porogen agent. MgCl2 could be transformed, in several steps, to MgO during the high-temperature carbonization process (around 700 °C) [33]. Many of the formed MgO whiskers act as obstacles that block all pore types, resulting in the impossibility of detecting them by N2 physisorption. MgO was removed from the carbon surface/and or pore system upon acid washing, thus causing the specific surface area increase due to pore opening. Therefore, in situ-generated magnesium oxide serves as a hard-templating agent.
The presence of MgO and the assumption that during carbonization MgCl2 transforms into in situ-generated MgO (which serves further as a hard-templating agent) were confirmed by XRD analysis. The XRD patterns of Carbunw and Carbw samples are presented in Figure 2. In the sample Carbunw, there are three prominent crystalline peaks observed at 2θ of 37°, 43° and 62° and all are indexed to MgO periclase (PDF No. 4-829; cubic space group Fm-3m, No. 225). The average crystallite size of MgO phase was calculated to be 36 nm. On the other hand, the diffractogram of Carbw omits MgO periclase peaks, thus indicating a successful removal of MgO upon acidic treatment. The diffractogram of Carbw includes one semicrystalline peak at 26° superposed on an amorphous halo, which belong to graphitic (PDF No. 75-444) and disordered carbon phases. These results indicate that the calcination of the DES precursor (mixture of cholinimum chloride and MgCl2), which subsequently removes MgO with HCl, leads to the formation of a mainly disordered carbon phase that is graphitized to a small degree (the estimated degree of crystallinity does not surpass 10%). The broadness of the XRD peak located at 2θ~26° originates from a broad (002) reflection, which precisely interprets the presence of a small number of well-stacked layers with a uniform interlayer distance (d002) greater than that of the graphite. The elevated broadness is due to the disordered nature of the obtained carbon. Because only (002) reflection exists, the presence of the stacking of the layers should be expected, which is characteristic of “soft” carbons. Additionally, it must be emphasized that the inter-graphene distance depends on the carbon “source”, preparation procedure and chemical treatment.
To further investigate material surface chemistry, FTIR analysis was performed (Figure 3). As shown in Figure 3, a series of adsorbing peaks appear in the investigated regions of both materials, indicating that materials have dominantly oxygen surface functional groups. The peak at 3430 cm−1 belongs to OH stretching vibrations and it appears in all spectra. The two peaks at 2919 cm−1 and 2850 cm−1 correspond to the vibrations of the C-H groups. The peak observed at 1630 cm−1 is attributed to the stretching vibrations of C=X (where X=C, O) [34]. These C=O vibration bands could be further attributed to carboxylic groups; however, the carbonyl and lactone groups are mostly responsible because they are stable at lower temperatures and the material was prepared at 700 °C [35]. In addition to the mentioned vibrations, this peak is also attributed to the stretching C=N vibrations, and the distinct peak at 1385 cm−1 could be identified as C-N vibration modes [36]. This indicates that nitrogen functional groups are also present in the carbon structure in addition to the oxygen functionalities. The nitrogen atoms originate from the carbon precursor, i.e., choline, which contained nitrogen in the structure. The broad band in the region between 1200 and 970 cm−1 can be the consequence of two overlapping bands: C-O and C-N banding vibration peaks. The C-O stretching vibration peak (from COOH) typically appears between 1120 cm−1 and 1160 cm−1 [37,38], while the C-N band is usually centered around 1040 cm−1 [36].
The morphology of Carbw was examined by scanning electron microscopy (SEM) combined with energy-dispersive X-ray spectroscopy (Figure 4a,b). Micrographs (Figure 4a) showed a large number of 3D network structures with interconnected sheets. These interconnected sheets showed nanometer thickness.
Additionally, EDS showed the presence of carbon, oxygen and nitrogen atoms (78.9 at.%, 13.9 at.% and 7.2 at.%, respectively). The presence of nitrogen atoms is directly related to the nitrogen presence in choline chloride, which was used as a carbon precursor. From Figure 4b, it is evident that carbon, oxygen and nitrogen have uniform distribution.

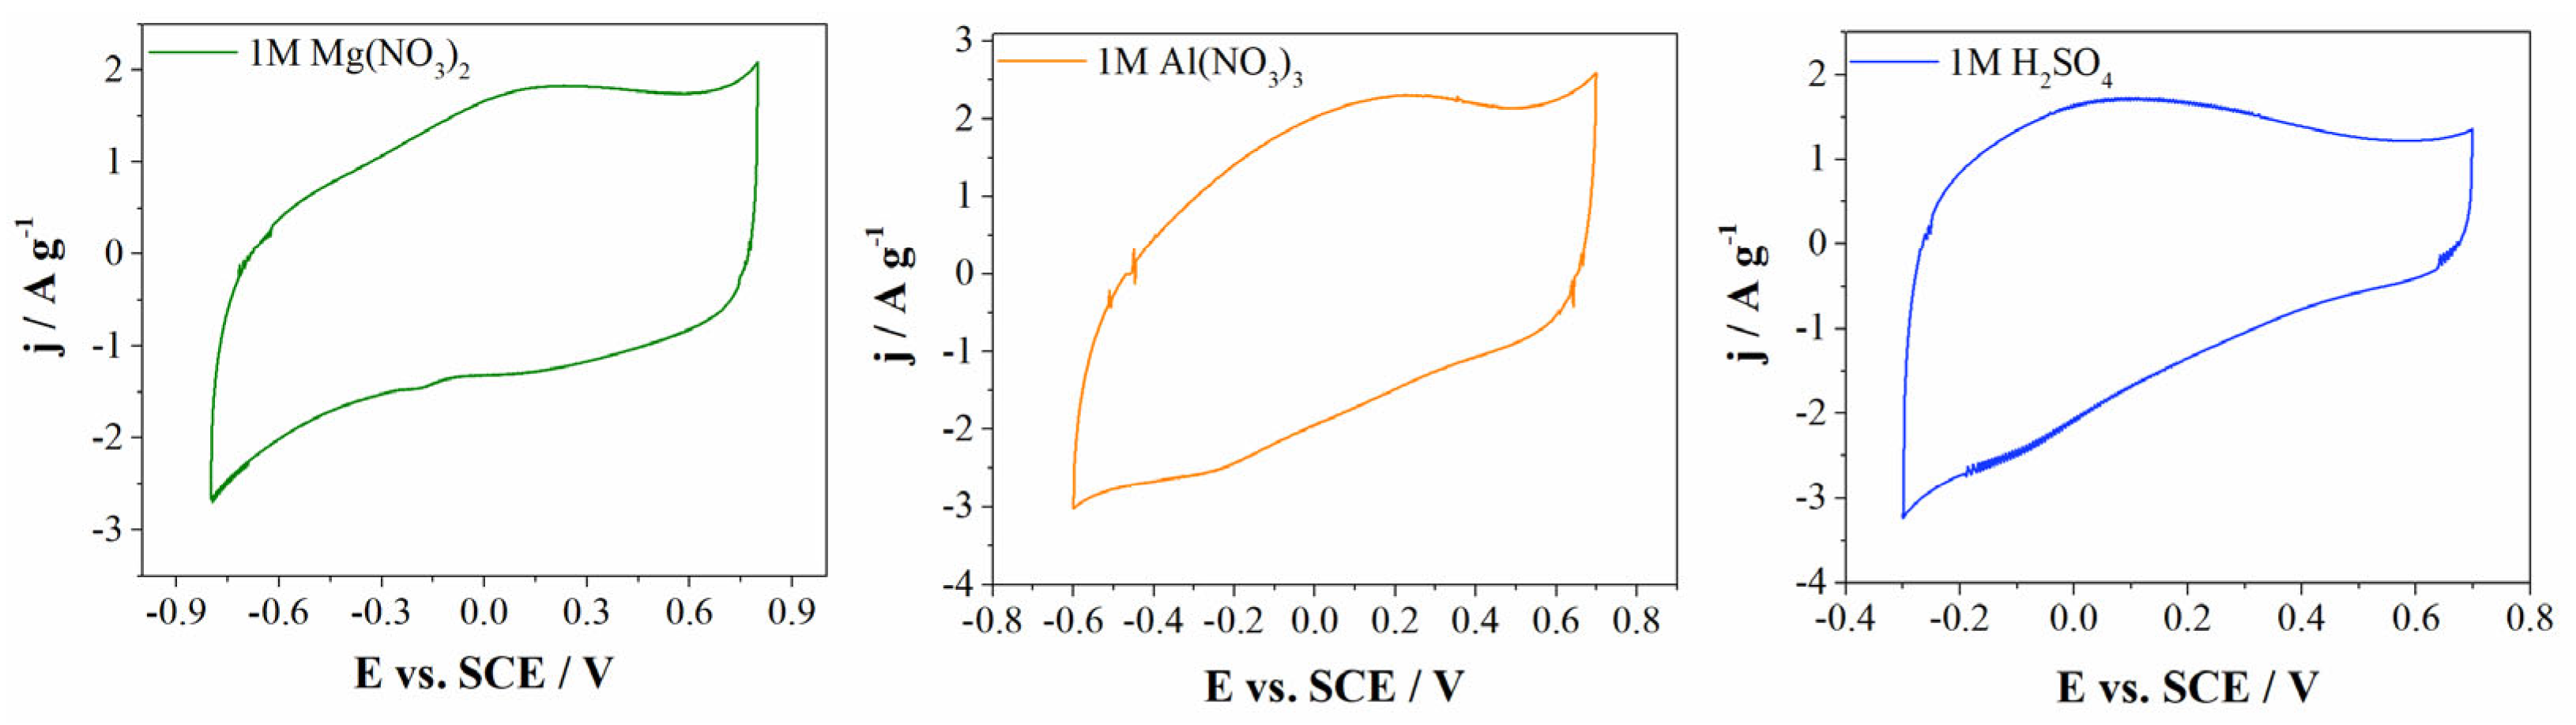
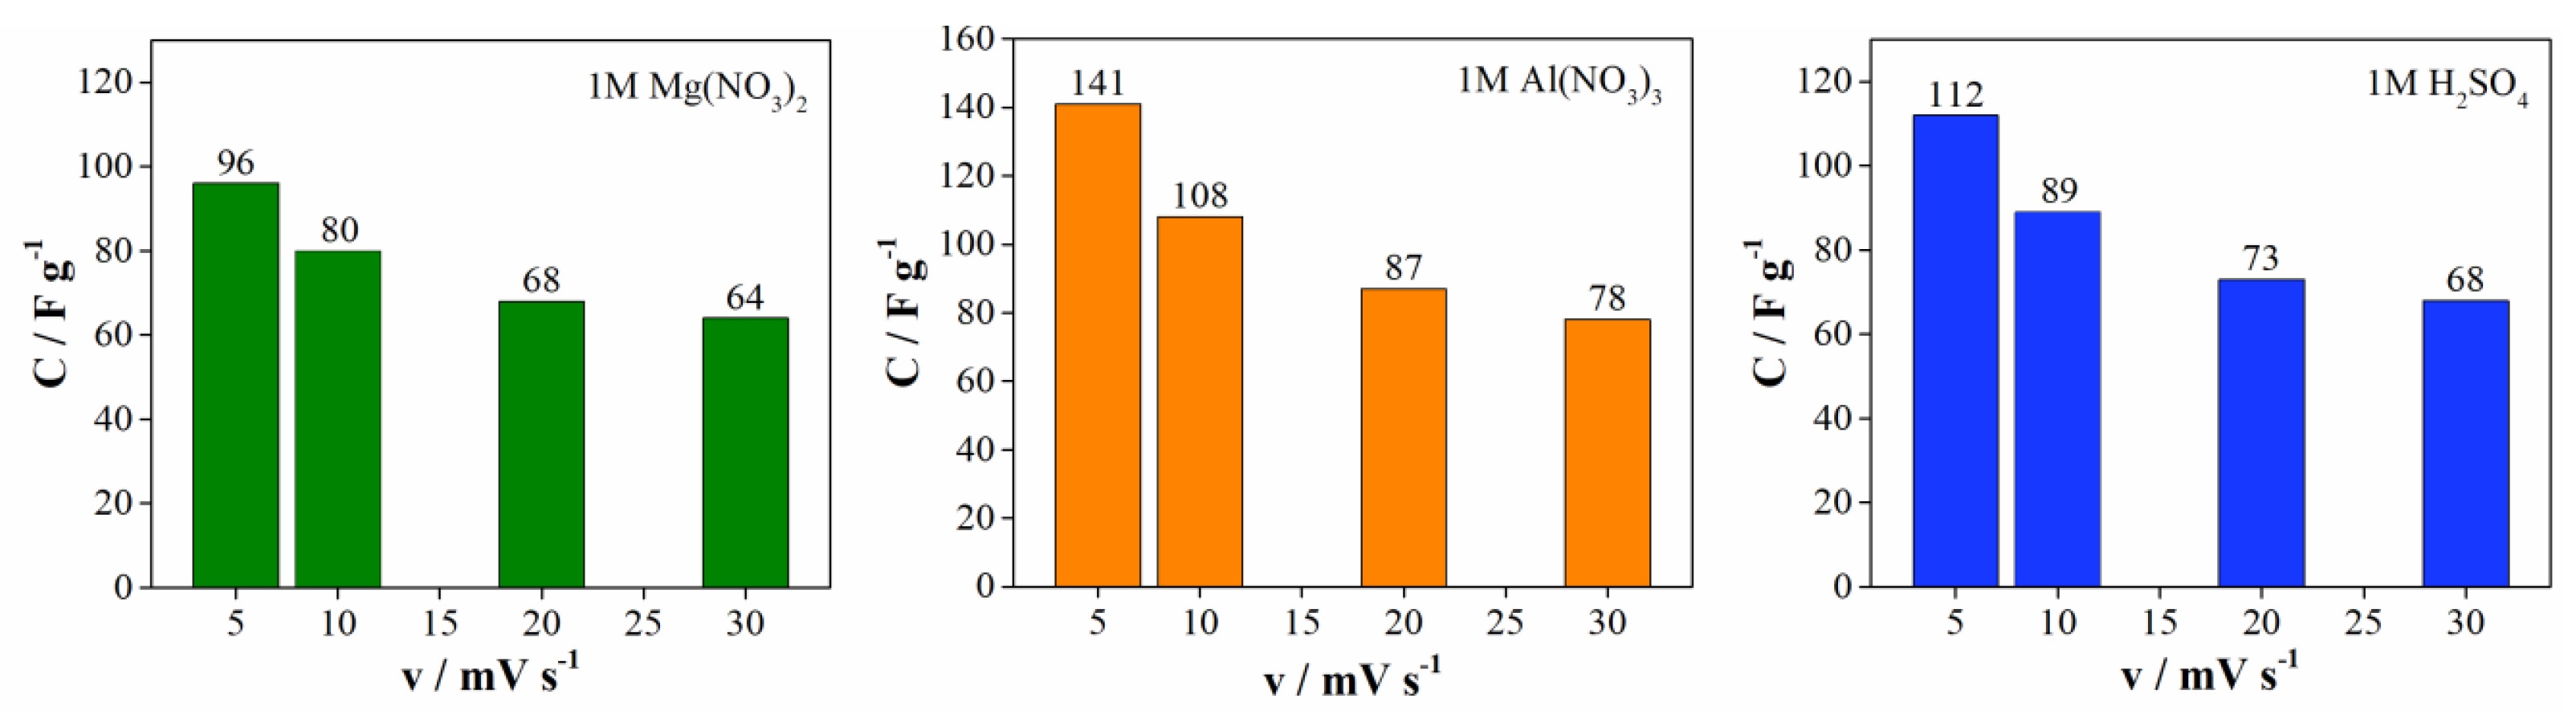
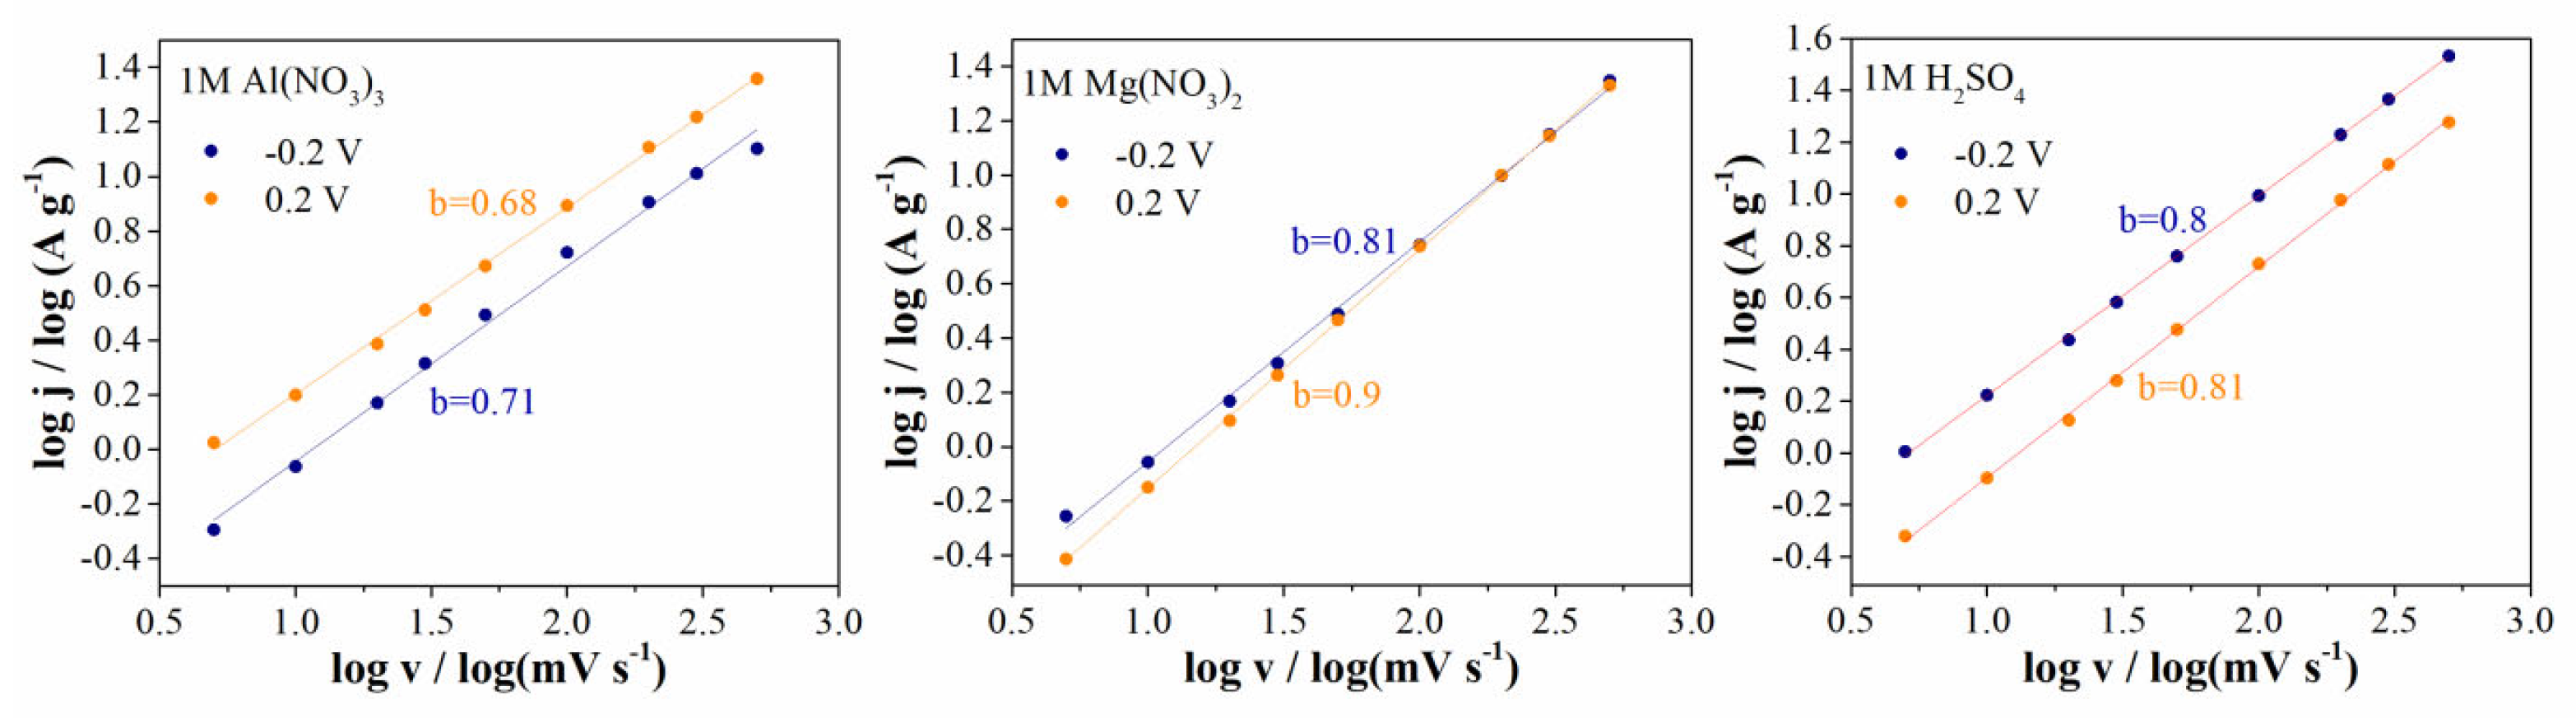
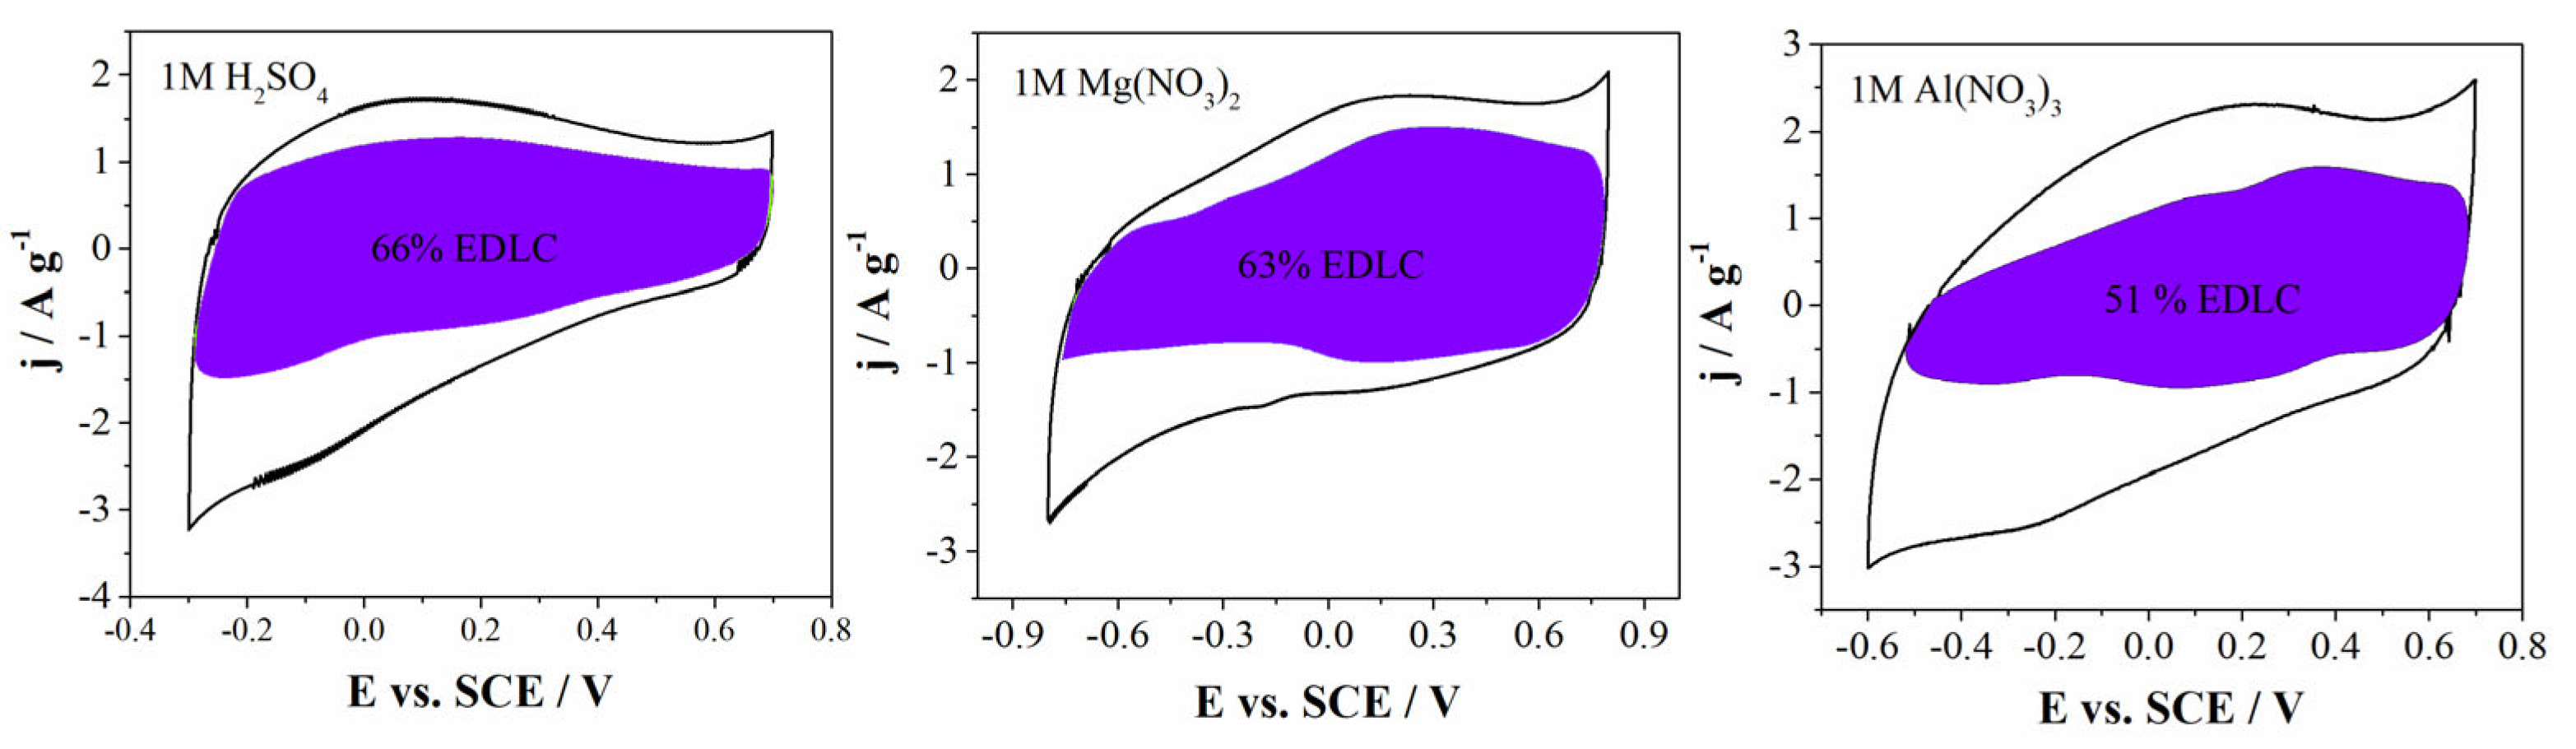
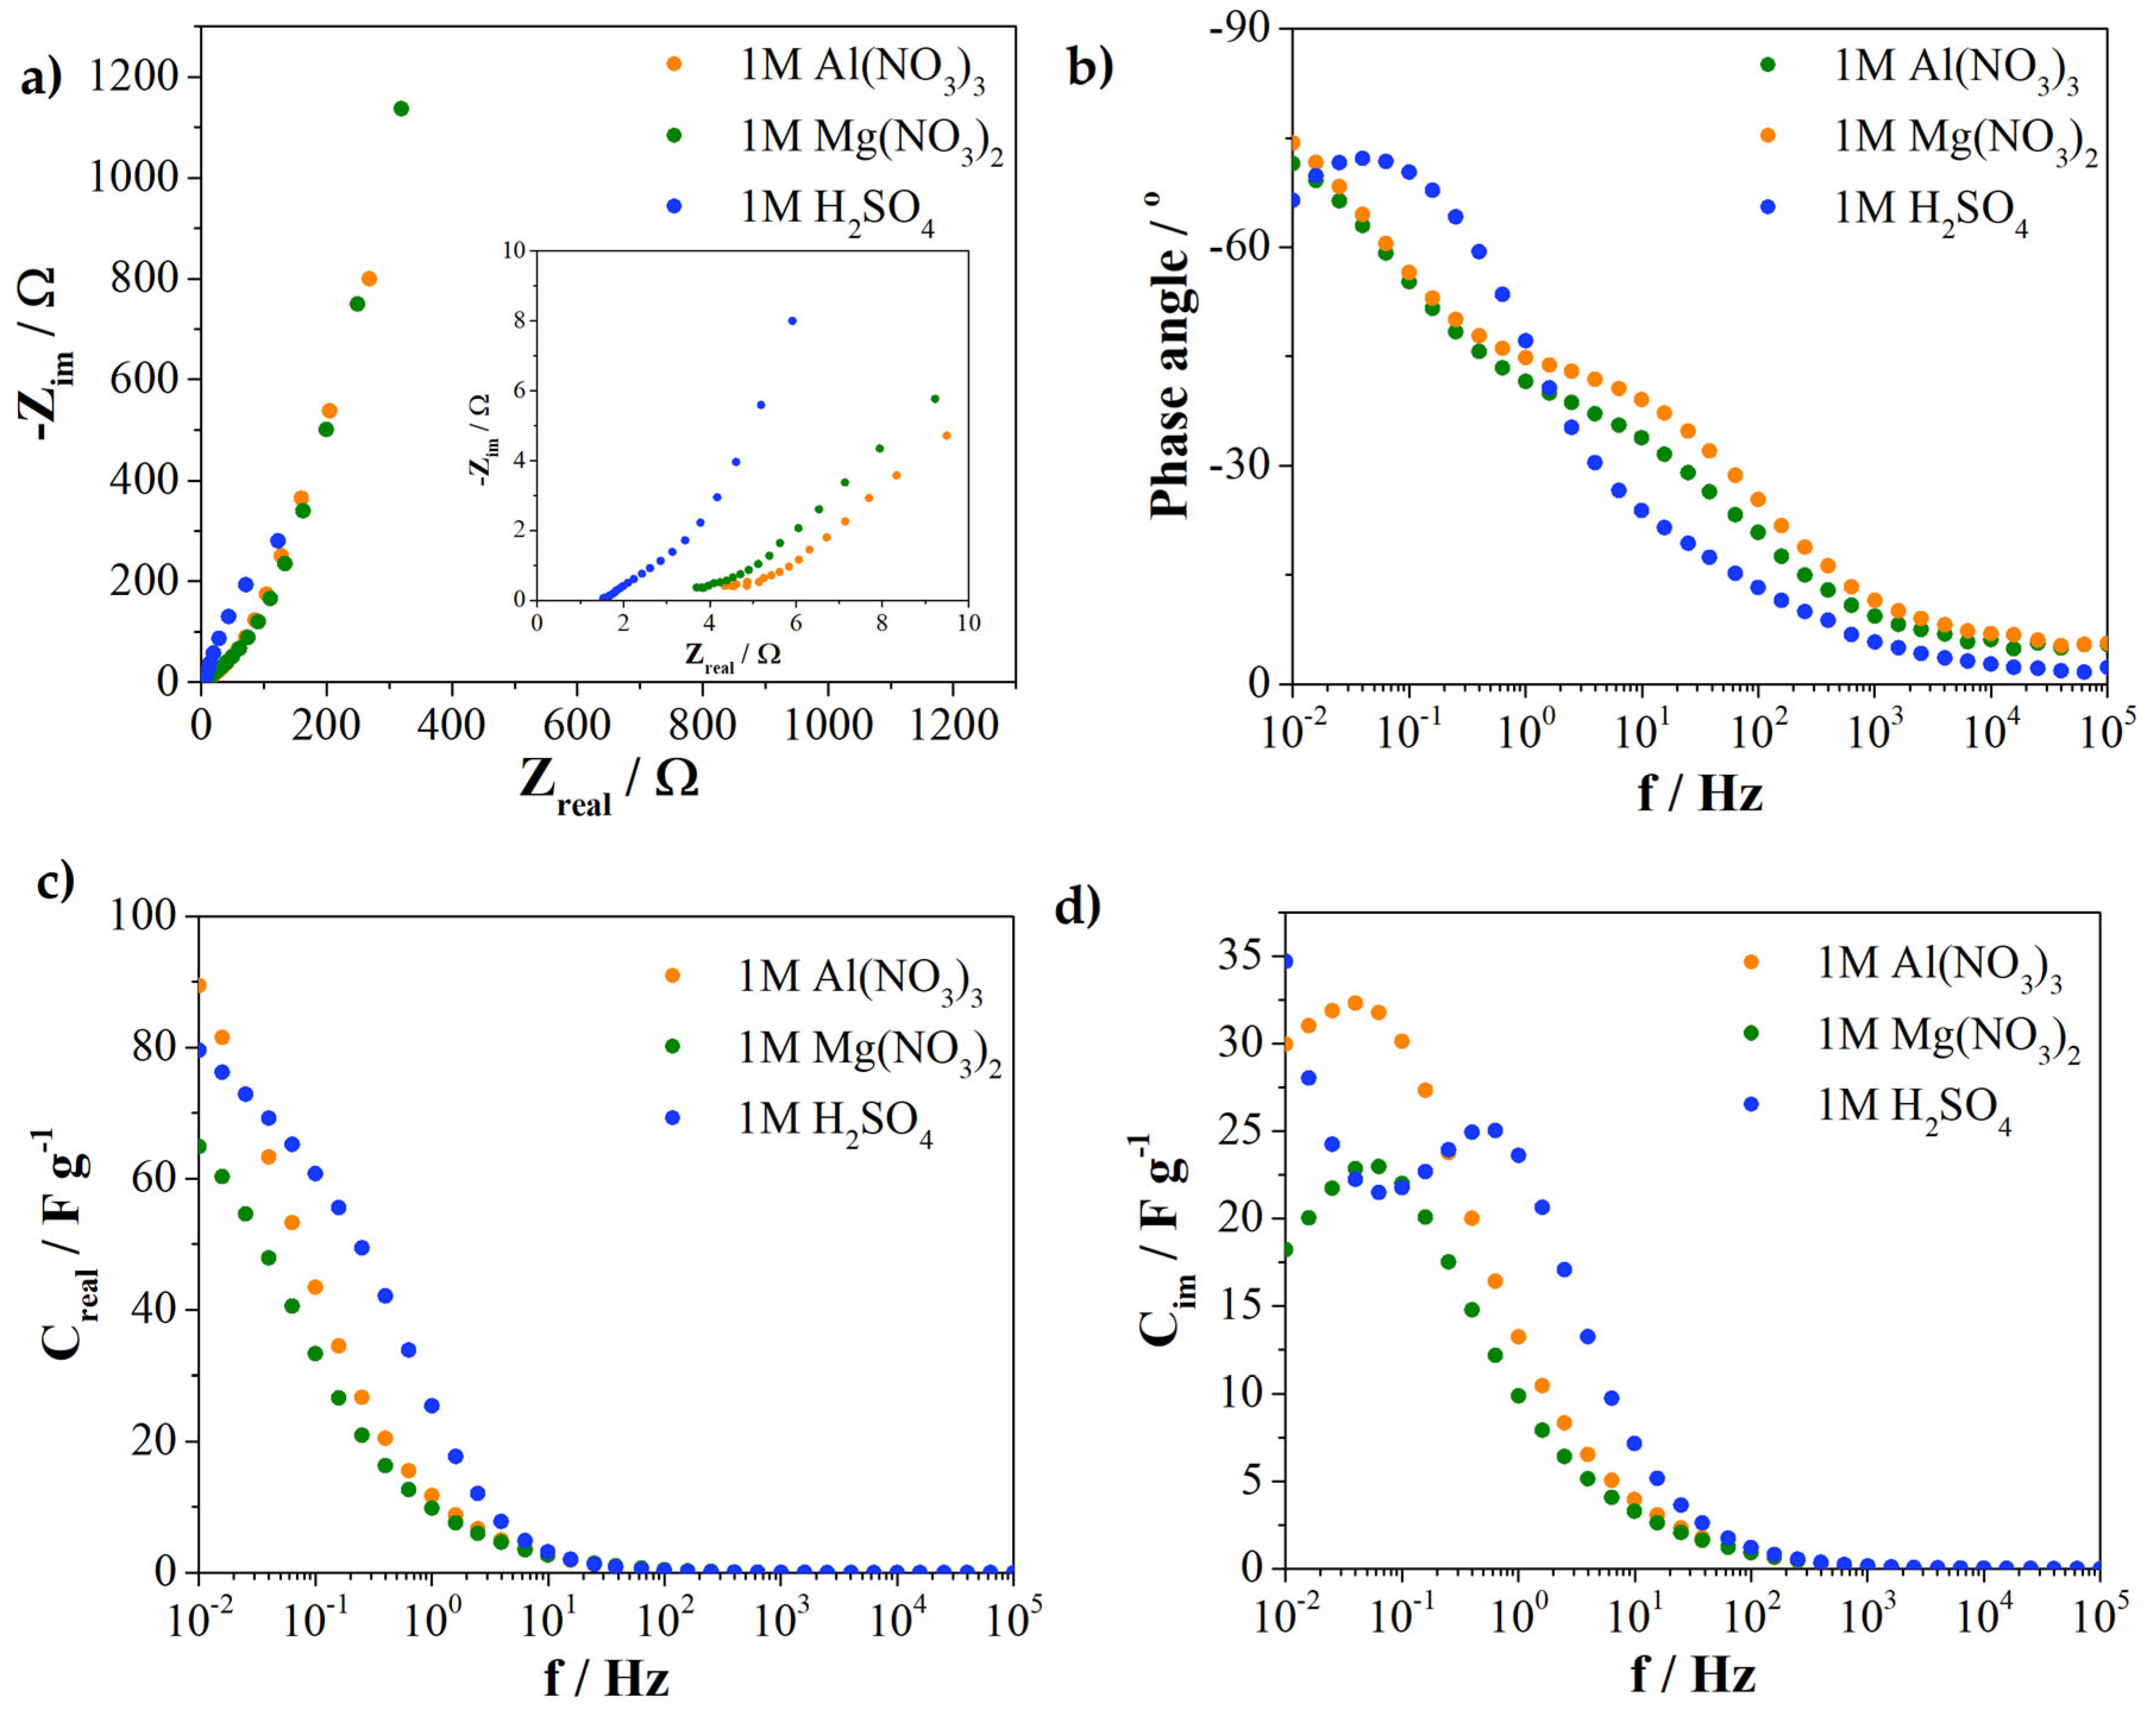
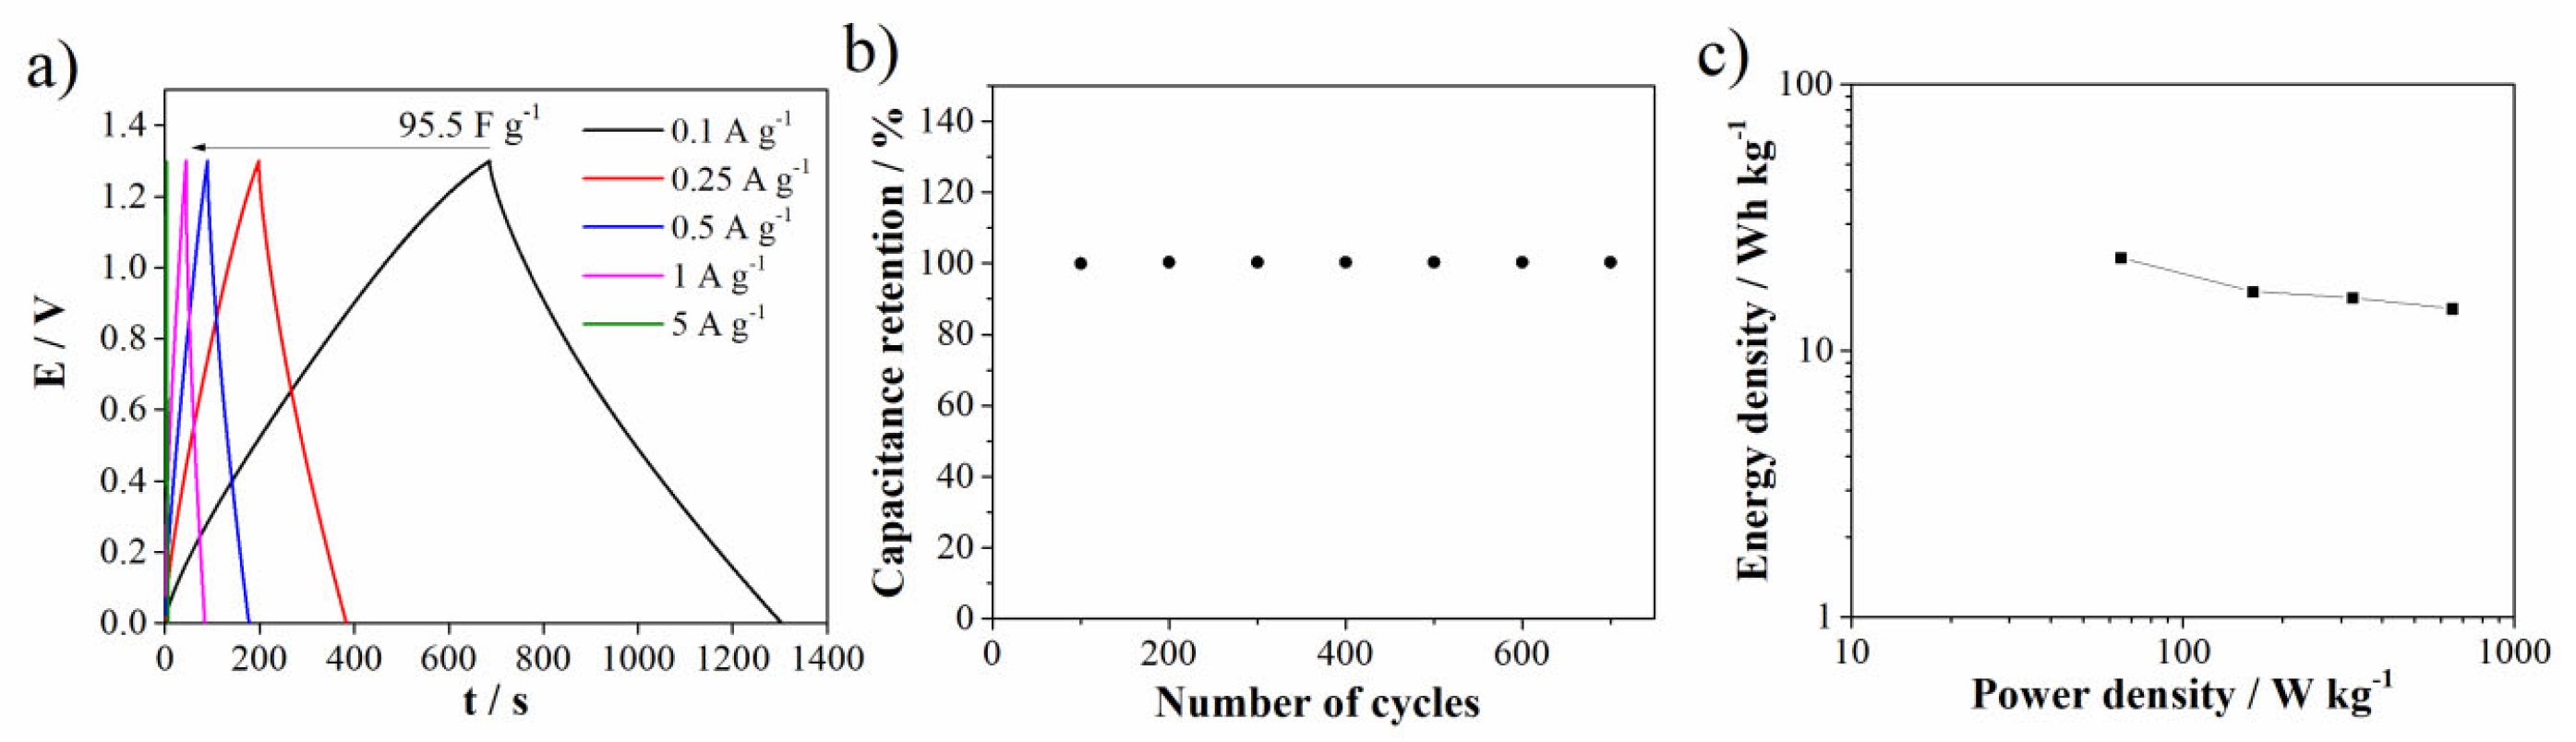
3.2. Electrochemical Investigation of Energy Storage

Material Carbw was further selected to investigate energy storage, since it has developed a microporous structure and high surface area value. In the first step, energy storage behavior was not only investigated in conventional 1M H2SO4 electrolyte but also in aqueous electrolytes containing multivalent ions, such as Al3+ (1 M Al(NO3)3 electrolyte) and Mg2+ (1 M Mg(NO3)2 electrolyte). Figure 5 represents the cyclic voltammograms of the Carbw electrode material in the three mentioned electrolytes at a scan rate 20 mV s−1. Comparisons of cyclic voltammograms indicate the dependence of the charge storage on the type of electrolytic solution. As can be seen from Figure 5 and Figure S2 (Supplementary Materials), the charge storage was most pronounced in electrolytes containing multivalent cations, i.e., Al3+ and Mg2+, when compared with the commonly used 1M H2SO4 electrolyte.
The enhanced charge storage of carbon in multivalent-based electrolytes is the consequence of the larger potential window when compared with the one obtained in 1M H2SO4. Herein, the lowest potential was found for 1M H2SO4 (1 V), while corresponding values for 1M Al(NO3)3 and 1M Mg(NO3)2 are 1.3 V and 1.6 V, respectively. Regarding the operating voltage, Carbw material showed larger or similar values in multivalent-based electrolytes compared to other reported materials in highly corrosive and toxic 6M KOH electrolytes, such as MnO-based hybrid electrode material (1.3 V), N-,S-doped hierarchical carbon encapsulated in graphene (1 V) or N-doped honeycomb-like porous carbon (1.6 V) [39,40,41].
Figure 6 shows the dependence of the specific capacitance as a function of scan rate for all investigated electrolytes. The specific capacitance, calculated at 5 mV s−1, is found to be higher in Al(NO3)3 (141 F g−1) than in H2SO4 (112 F g−1) and Mg(NO3)2 (96 F g−1), while the calculated values at 20 mV s−1 amount to 87 F g−1 for Al(NO3)3, 73 F g−1 for H2SO4 and 68 F g−1 for Mg(NO3)2. As the scan rate increases, the specific capacitance decreases, and the best capacitance retention was obtained with the Mg(NO3)2 electrolyte (Figure S3). Capacitance retention (at 400 mV s−1 relative to 5 mV s−2, Figure S3) decreases in the order: Mg(NO3)2 > H2SO4 > Al(NO3)3.
An important question arises here—why do multivalent-ions electrolytes (Mg(NO3)2 and Al(NO3)3) show better electrochemical behavior for energy storage when compared with H2SO4? To address this issue, the mechanism of multivalent-ion storage will be investigated in terms of determining pseudocapacitance (PC) and electrical double-layer capacitance (EDLC) contribution.
The capacitive effects were analyzed using cyclic voltammetry by varying the scan rate from 5 to 500 mV s−1. Surface-controlled (EDLC and Faradaic pseudocapacitance reactions) diffusion-controlled or intercalation processes (ion insertion/extrusion in bulk materials) are classified as the main charge-storage processes [37,42]. By applying power law j = a·vb, we can obtain the relation between current density and scan rate (log(j) = (b)log(v) + log(a), a and b are variable parameters) [42]. From the slope of the linear plot log(j) versus log(v), parameter b can be evaluated. The b value provides information about the charge-storage mechanism. If the b value is equal or close to 0.5, the charge-storage mechanism is diffusion controlled. On the other hand, if the b value is equal or close to 1, the charge-storage mechanism is surface controlled.
Figure 7 shows the linear plot of log(j) versus log(v), which is obtained at 0.2 and −0.2 V, respectively, for all three electrolytes. As can be seen from Figure 7, the b value is close to 1 for 1M H2SO4 and 1M Mg(NO3)2, which is characteristic of electrochemical supercapacitors, and the charge storage is non-diffusion limited (adsorption of ions and fast surface oxido-reduction reaction). In the case of the 1M Al(NO3)3 electrolyte, the b values obtained at two potentials lie between 0.5 and 0.8, which is characteristic of a supercapattery [37].
For further investigation, Dunn’s analysis was employed. The diffusion-controlled current and the capacitive current can be separated using Dunn’s analysis [43]. As can be seen from Figure 8, the electrical double-layer capacitance (EDLC) contribution is dominant for all electrolytes, ranging from 49% for Al(NO3)3, 63% for Mg(NO3)2 and 66% for H2SO4. The EDLC contribution roughly corresponds to the capacitance retention. In order to explain this energy-storage behavior, the size of the hydrated ions should be considered. The sizes of hydrated H3O+ and SO42− ions are 0.36–0.42 nm and 0.53 nm, respectively. Furthermore, the sizes of hydrated NO3, Mg3+ and Al3+ ions are 0.68, 0.86 nm and 0.96 nm, respectively [28]. This similar EDLC contribution to the total capacitance could be explained with the size of hydrated electrolyte ions ranging from 0.36 to 0.96 nm. It is well known that the diameter of pores should be close to the size of hydrated ions for electrical double-layer formation. Additionally, the lowest EDLC contribution was obtained in the Al-based electrolyte, which could be attributed to the slightly larger size of the hydrated Al3+ ions compared with the median pore diameter of the investigated materials (0.95 nm) (Table 1). The mentioned size of the hydrated Al3+ ions leads to their impossibility to penetrate into small microspores (i.e., ultramicropores). For that reason, the mentioned lower EDLC was determined for the Al-based electrolyte. If we use Dunn’s analysis again (Figure 8), during the positive polarization of the electrode, the shaded area in the CVs (noted as EDLC contribution) is larger compared with the area during negative polarization. Therefore, during the positive polarization of electrode, the contribution of EDLC is higher; therefore, it can be concluded that electrolyte anions (SO42− and NO3) are mostly involved in EDLC formation. Contrary, during negative polarization, the shaded areas in the CVs are lower and pseudocapacitance contribution is dominant, mostly arising from the Faradaic reaction between the surface functional groups of material and the cations of the electrolytes (H+, Mg2+ and Al3+). From these results, we acquire the impression that in the formation of EDLC, anions are mostly involved, while in pseudocapacitive reaction, cations are dominantly involved.
Pseudocapacitance contribution takes around 40% from the total capacitance; therefore, it is necessary to deliberate it. First, according to the previous assumption, we will be discussed the role of electrolyte cations. In the H2SO4 electrolyte, a pronounced slope during the negative scan could be observed. This CV shape indicating that H+ ions are involved in Faradaic reactions. It is well known that series of oxido/reduction reactions associated with oxygen (especially C=O and C-O) and nitrogen functional groups can occur in H2SO4 electrolytes [44,45]. In multivalent-ion electrolytes, pseudocapacitive reactions are associated with Al3+ and Mg2+ cations. Divalent (Mg2+) and trivalent (Al3+) ions bear more charges than univalent H+ ions, and the investigated material could store more energy per unit surface area [46].
Zou et al. [47] showed that Mg2+ ions (aqueous MgSO4 electrolyte) have high affinity toward N atoms, resulting in enhanced charge-storage behavior due to the pseudocapacitive reaction between Mg2+ and nitrogen. Additionally, Luo et al. [46] suggested that Ca2+ ions form the redox reaction between −COOH and CO functional groups. A similar mechanism could be proposed (Equation (5)) for Mg2+, in which divalent magnesium reacts with COOH functional groups.
C O O H + M g 2 + C O O M g + + H + + e
One of the reactions that could occur at the carbon/electrolyte interface is indirectly related to Al3+ cations. Namely, in Al(NO3)3 aqueous solution, Al3+ ion form the complex (equilibrium reaction) described by Equation (6) [48]:
[ A l ( H 2 O ) 6 ] 3 + + H 2 O [ A l ( H 2 O ) 5 ( O H ) ] 2 + + [ H H 2 O ] 1 +
During complex formation, a donation of protons (by the hydration shell) to another water molecule of the solvent occurs. The formed protons can also take a part in pesudocapacitance reaction and contribute to the total capacitance.
The larger potential window obtained for Al(NO3)3 and Mg(NO3)2 could be attributed to the electroreduction of water, i.e., hydrogen evolution at negative potentials. On the electroreduction of water, the pH of the electrolyte solution has the greatest impact. Moreover, 1 M H2SO4 is strong acid with a pH < 1, while the pH of Al(NO3)3 and Mg(NO3)2 are higher (~2 and ~5, respectively). As the pH increases for the electrolyte solution, the electrochemical stability of the water also increases, consequently leading to an increase in the operating potential window. Additionally, free water fraction is one of the dominant factors affecting the stability of the electrolyte [49]. If we calculate ratios of H2SO4/H2O, Al(NO3)3/H2O and Mg(NO3)2/H2O (by the weight) for the preparation of 1 M electrolytes, it flows into the next order as: Al(NO3)3/H2O > Mg(NO3)2/H2O > H2SO4/H2O. The calculated ratios imply that dissolved salts have lower amounts of free water compared with H2SO4. In the Al3+ and Mg2+ electrolytes, more water molecules are included in the formation of the ion solvation shell and less free water could be found in these electrolytes compared with H2SO4 [49,50]. A lower fraction of free water suppresses hydrogen evolution and reduces the electrochemical activity of water. The larger potential window for Mg(NO3)2, besides lowering the amount of free water compared with Al(NO3)3, could be explained by the higher pH value.
This can be confirmed by the shape of the CV curves obtained with the negative scan. CV shape could indicate that hydrogen deposition on the carbon electrode is partly involved in the capacitance contribution. The slope (evaluated from CV curves obtained in the negative scan) was higher for H2SO4 (3.46 A·V·g−1), followed by multivalent-ion electrolyte Al(NO3)3 (1.7 A·V·g−1) and Mg(NO3)2 (0.88 A·V·g−1). In H2SO4 media, H3O+ is an easily available proton source following the reaction H 3 O + + e H + H 2 O , as well as the Faradaic reaction, which, according to this process, proceeds at negative potential values [51]. This is in a good agreement with the assumption that in the pseudocapacitive reaction, electrolyte cations are mostly involved.
On the other hand, the hydrogen deposition in the multivalent-ions electrolyte is almost negligible; furthermore, the values of the slopes are lower when compared with H2SO4. This indicates that less hydrogen is stored within carbon pores, the number of available water molecules is lower and, therefore, hydrogen generation is reduced [26].
Electrochemical impedance spectroscopy (EIS), evaluated at 0.2 V versus SCE, was used to investigate the kinetics of the charge-storage process. As can be seen from the Nyquist diagram (Figure 9a), the overall resistance increases in the order: H2SO4, Al(NO3)3 and Mg(NO3)2. Furthermore, charge-transfer resistance was obviously lower for multivalent-ion electrolytes compared with the conventional H2SO4. In addition, the Bode’s plot (Figure 9b) showed deviation from −90° (therefore deviation from the ideal capacitive behavior). The highest phase angle was obtained for Mg(NO3)2 and Al(NO3)3 (−74° and −71°, respectively) compared with acidic electrolytes (−66°). Phase angle follows the trend of the pH of electrolyte solutions. Phase angle decreases with the decreasing pH of the electrolytes.
A complex capacitance analysis, namely the real (Creal) and imaginary parts (Cim) of capacitance, are shown in Figure 9c,d. The trend of the capacitance change in the low-frequency region (10−2 Hz) corresponds to the trend obtained by the cyclic voltammetry. As the frequency increases, the real capacitance value decreases as a consequence of the impossibility of ion penetration into pores at high-frequency values. The real capacitance value in the low-frequency region (from 0.1 Hz to 1 Hz) is higher when compared with multivalent-ion electrolytes in the same frequency region. This kind of behavior was expected since the EIS was performed at positive potential (0.2 V). At positive potential, negative ions penetrate into material pores. Since the hydrated radius of SO42− is lower compared with the nitrate anions, the ability to penetrate into smaller pores at higher frequencies is better. Therefore, the capacitance is higher in the mentioned frequency range compared with the electrolytes containing nitrate ions. The overlapping curves obtained for Mg(NO3)2 and Al(NO3)3 in this frequency region could support the mentioned assumption.
The relaxation time (τ0) is calculated as a reciprocal value of f0. The presence of the maximum in the plot of Cim vs. f (Figure 9d) corresponds to f0. At this point, resistive and capacitive impedances are equal, and relaxation time represents the point between capacitive and resistive behavior. H2SO4, Al(NO3)3 and Mg(NO3)2 showed f0 values of 0.636 Hz, 0.063 Hz and 0.041 Hz, respectively. The obtained f0 values correspond to τ0 of 1.57 s, 15.9 s and 24.4 s for H2SO4, Al(NO3)3 and Mg(NO3)2, respectively. The relaxation time values increase as the pH value of the electrolytes increase.
GCD (in two-electrode configuration) was performed in 1M Al(NO3)3 since the investigated electrode showed enhanced capacitance performances in an aluminum electrolyte. GCD was performed using different current densities (Figure 10a). As the current density increases, the specific capacitance decreases. At the same current density (0.1 A g−1), other carbon materials prepared by more complex synthesis procedures showed shorter discharge times (as well lower potential ranges than 1.3 V) compared with Carbw [52]. Figure 10b shows good capacitance retention after 700 cycles of charge/discharge.
Figure 10c shows the Ragone plot of the investigated material in the 1M Al(NO3)3 electrolyte. The energy density and power density were calculated according to the formulas reported in Ref. [53], based on the mass of the electrode material in the single electrode. The investigated material delivered an energy density of 22.3 Wh kg−1 at a low power density of 65 W kg−1. On the other hand, at a power density of 650 W kg−1, the energy density was 14.4 Wh kg−1. Furthermore, if we compare the results with the literature data, for an example, with biomass-derived carbon (with 12.38 Wh kg−1 at 99.72 W kg−1) [54] or activated carbon derived from ethylenediamine tetraacetic acid (with 17.01 Wh kg−1 at 350 W kg−1) [55], it can be concluded that the Carbw showed comparable results in terms of energy and power density.

4. Conclusions

This study presents an investigation of the application of deep eutectic solvent (DES) (MgCl2·6H2O—[Ch]Cl) for carbon materials synthesis. Our characterization of synthesized carbon materials using N2 physisorption and XRD analysis revealed differences between unwashed (Carbunw) and washed (Carbw) carbon materials. XRD analysis showed the presence of magnesium oxide on the Carbunw material, while the presence of MgO was not detected on Carbw. The specific surface area was found to increase upon washing the material. This difference in specific surface area is the consequence of the decomposition of [Ch][Cl] and the generation of magnesium oxide during the carbonization processes. Generated MgO whiskers act as obstacles, blocking the pores of the carbon material. MgO removal from the carbon surface with acidic treatment leads to pores formation and specific surface area increases. These results indicate that during the carbonization process, in situ-generated magnesium oxide serves as a hard-templating agent.
Carbw was further tested as an electrode material in electrolytes containing multivalent ions and compared with a conventional H2SO4 electrolyte. For all investigated electrolytes, the potential window increases in the following order: 1M H2SO4 (1 V), 1M Al(NO3)3 (1.3 V) and 1M Mg(NO3)2 (1.6 V). The specific capacitance, calculated at 5 mV s−1, is found to be higher in Al(NO3)3 (141 F g−1) than in H2SO4 (112 F g−1) and Mg(NO3)2 (96 F g−1). Larger potential windows obtained in multivalent-ions electrolytes can be attributed to the lower fraction of free water. A lower fraction of free water was found to suppress the hydrogen evolution and reduce its electrochemical activity compared with H2SO4. It was established that Carbw showed the best charge-storage behavior in Al3+ ions-based electrolytes and delivered an energy density of 22.3 Wh kg−1 at a low power density of 65 W kg−1 and 14.4 at 650 W kg−1.

Supplementary Materials

The following supporting information can be downloaded at: https://www.mdpi.com/article/10.3390/batteries8120284/s1, Figure S1: Pore size distribution curves for (a) Carbunw mesopores, (b) Carbw mesopores and (c) Carbw micropores; Figure S2: CV curves of carbon electrode in all investigated electrolytes at different scan rates; Figure S3: Capacitance retention.

Author Contributions

Conceptualization, N.Z., B.J. and M.V.; methodology, N.Z., B.J. and M.V.; validation, N.Z., B.J., M.M., S.B., J.K., I.P. and M.V.; formal analysis, N.Z.; investigation, N.Z., B.J., M.M., S.B., J.K., I.P. and M.V.; resources, N.Z. and M.V.; data curation, N.Z., B.J. and M.V.; writing—original draft preparation, N.Z.; writing—review and editing, N.Z., B.J. and M.V.; visualization, N.Z., B.J. and M.V.; supervision, N.Z., B.J., M.M., J.K., S.B., I.P. and M.V.; project administration, M.V. All authors have read and agreed to the published version of the manuscript.

Funding

This research is supported by the Science Fund of the Republic of Serbia, PROMIS, #6062667, HISUPERBAT, and the Ministry of Education, Science and Technological Development of the Republic of Serbia, under Contract numbers 451-03-68/2022-14/200017, 451-03-68/2022-14/200105, 451-03-68/2022-14/200146 and 451-03-68/2022-14/200026.

Data Availability Statement

Not applicable.

Acknowledgments

This research is supported by the Science Fund of the Republic of Serbia, PROMIS, #6062667, HISUPERBAT. Authors would like to acknowledge financial support of Ministry of Education, Science and Technological Development of the Republic of Serbia, under Contract numbers 451-03-68/2022-14/200017, 451-03-68/2022-14/200105, 451-03-68/2022-14/200146, 451-03-68/2022-14/200026.

Conflicts of Interest

The authors declare no conflict of interest.

References

  1. Guo, J.; Ma, Y.; Zhao, K.; Wang, Y.; Yang, B.; Cui, J.; Yan, X. High-Performance and Ultra-Stable Aqueous Supercapacitors Based on a Green and Low-Cost Water-In-Salt Electrolyte. ChemElectroChem 2019, 6, 5433–5438. [Google Scholar] [CrossRef]
  2. Lokhande, P.E.; Chavan, U.S.; Pandey, A. Materials and Fabrication Methods for Electrochemical Supercapacitors: Overview. Electrochem. Energy Rev. 2020, 3, 155–186. [Google Scholar] [CrossRef]
  3. Han, X.; Xiao, G.; Wang, Y.; Chen, X.; Duan, G.; Wu, Y.; Gong, X.; Wang, H. Design and Fabrication of Conductive Polymer Hydrogels and Their Applications in Flexible Supercapacitors. J. Mater. Chem. A 2020, 8, 23059–23095. [Google Scholar] [CrossRef]
  4. Yang, L.; Guo, X.; Jin, Z.; Guo, W.; Duan, G.; Liu, X.; Li, Y. Emergence of Melanin-Inspired Supercapacitors. Nano Today 2021, 37, 101075. [Google Scholar] [CrossRef]
  5. Wang, Y.; Zhang, L.; Hou, H.; Xu, W.; Duan, G.; He, S.; Liu, K.; Jiang, S. Recent Progress in Carbon-Based Materials for Supercapacitor Electrodes: A Review. J. Mater. Sci. 2020, 56, 173–200. [Google Scholar] [CrossRef]
  6. Xiao, J.; Han, J.; Zhang, C.; Ling, G.; Kang, F.; Yang, Q.H. Dimensionality, Function and Performance of Carbon Materials in Energy Storage Devices. Adv. Energy Mater. 2022, 12, 2100775. [Google Scholar] [CrossRef]
  7. Zheng, S.; Zhang, J.; Deng, H.; Du, Y.; Shi, X. Chitin Derived Nitrogen-Doped Porous Carbons with Ultrahigh Specific Surface Area and Tailored Hierarchical Porosity for High Performance Supercapacitors. J. Bioresour. Bioprod. 2021, 6, 142–151. [Google Scholar] [CrossRef]
  8. Yang, J.; Li, H.; He, S.; Du, H.; Liu, K.; Zhang, C.; Jiang, S. Facile Electrodeposition of NiCo2O4 Nanosheets on Porous Carbonized Wood for Wood-Derived Asymmetric Supercapacitors. Polymers 2022, 14, 2521. [Google Scholar] [CrossRef]
  9. Li, H.; Cao, L.; Zhang, H.; Tian, Z.; Zhang, Q.; Yang, F.; Yang, H.; He, S.; Jiang, S. Intertwined Carbon Networks Derived from Polyimide/Cellulose Composite as Porous Electrode for Symmetrical Supercapacitor. J. Colloid Interface Sci. 2022, 609, 179–187. [Google Scholar] [CrossRef]
  10. Ge, X.; Gu, C.; Wang, X.; Tu, J. Deep Eutectic Solvents (DESs)-Derived Advanced Functional Materials for Energy and Environmental Applications: Challenges, Opportunities, and Future Vision. J. Mater. Chem. A 2017, 5, 8209–8229. [Google Scholar] [CrossRef]
  11. Jagirani, M.S.; Soylak, M. Deep Eutectic Solvents-Based Adsorbents in Environmental Analysis. TrAC Trends Anal. Chem. 2022, 157, 116762. [Google Scholar] [CrossRef]
  12. Rodríguez-Álvarez, M.J.; García-Garrido, S.E.; Perrone, S.; García-Álvarez, J.; Capriati, V. Deep Eutectic Solvents and Heterogeneous Catalysis with Metallic Nanoparticles: A Powerful Partnership in Sustainable Synthesis. Curr. Opin. Green Sustain. Chem. 2022, 39, 100723. [Google Scholar] [CrossRef]
  13. Shao, J.; Ni, Y.; Yan, L. Oxidation of Furfural to Maleic Acid and Fumaric Acid in Deep Eutectic Solvent (DES) under Vanadium Pentoxide Catalysis. J. Bioresour. Bioprod. 2021, 6, 39–44. [Google Scholar] [CrossRef]
  14. Abbott, A.P. Deep Eutectic Solvents and Their Application in Electrochemistry. Curr. Opin. Green Sustain. Chem. 2022, 36, 100649. [Google Scholar] [CrossRef]
  15. Carrasco-Huertas, G.; Jiménez-Riobóo, R.J.; Gutiérrez, M.C.; Ferrer, M.L.; Del Monte, F. Carbon and Carbon Composites Obtained Using Deep Eutectic Solvents and Aqueous Dilutions Thereof. Chem. Commun. 2020, 56, 3592–3604. [Google Scholar] [CrossRef]
  16. Carriazo, D.; Serrano, M.C.; Gutiérrez, M.C.; Ferrer, M.L.; del Monte, F. Deep-Eutectic Solvents Playing Multiple Roles in the Synthesis of Polymers and Related Materials. Chem. Soc. Rev. 2012, 41, 4996–5014. [Google Scholar] [CrossRef]
  17. Duan, G.; Zhao, L.; Zhang, C.; Chen, L.; Zhang, Q.; Liu, K.; Wang, F. Pyrolysis of Zinc Salt-Treated Flax Fiber: Hierarchically Porous Carbon Electrode for Supercapacitor. Diam. Relat. Mater. 2022, 129, 109339. [Google Scholar] [CrossRef]
  18. Shao, J.; Ma, F.; Wu, G.; Dai, C.; Geng, W.; Song, S.; Wan, J. In-Situ MgO (CaCO3) Templating Coupled with KOH Activation Strategy for High Yield Preparation of Various Porous Carbons as Supercapacitor Electrode Materials. Chem. Eng. J. 2017, 321, 301–313. [Google Scholar] [CrossRef]
  19. Tian, D.; Xu, Z.; Zhang, D.; Zhou, Y.; Sun, Z. Multifaceted Roles of FeCl2 on Pore Formation of Polyester Fabric Wastes-Based Activated Carbon. Colloids Surf. A Physicochem. Eng. Asp. 2020, 598, 124756. [Google Scholar] [CrossRef]
  20. Zhang, Z.J.; Dong, C.; Ding, X.Y.; Xia, Y.K. A Generalized ZnCl2 Activation Method to Produce Nitrogen-Containing Nanoporous Carbon Materials for Supercapacitor Applications. J. Alloys Compd. 2015, 636, 275–281. [Google Scholar] [CrossRef]
  21. Bian, S.W.; Baltrusaitis, J.; Galhotra, P.; Grassian, V.H. A Template-Free, Thermal Decomposition Method to Synthesize Mesoporous MgO with a Nanocrystalline Framework and Its Application in Carbon Dioxide Adsorption. J. Mater. Chem. 2010, 20, 8705–8710. [Google Scholar] [CrossRef]
  22. Wang, C.; O’Connell, M.J.; Chan, C.K. Facile One-Pot Synthesis of Highly Porous Carbon Foams for High-Performance Supercapacitors Using Template-Free Direct Pyrolysis. ACS Appl. Mater. Interfaces 2015, 7, 8952–8960. [Google Scholar] [CrossRef] [PubMed]
  23. Zhong, C.; Deng, Y.; Hu, W.; Qiao, J.; Zhang, L.; Zhang, J. A Review of Electrolyte Materials and Compositions for Electrochemical Supercapacitors. Chem. Soc. Rev. 2015, 44, 7484–7539. [Google Scholar] [CrossRef] [PubMed]
  24. Vaquero, S.; Díaz, R.; Anderson, M.; Palma, J.; Marcilla, R. Insights into the Influence of Pore Size Distribution and Surface Functionalities in the Behaviour of Carbon Supercapacitors. Electrochim. Acta 2012, 86, 241–247. [Google Scholar] [CrossRef]
  25. Aradilla, D.; Gentile, P.; Ruiz, V.; Gómez-Romero, P.; Wimberg, J.; Iliev, B.; Schubert, T.J.S.; Sadki, S.; Bidan, G. SiNWs-Based Electrochemical Double Layer Micro-Supercapacitors with Wide Voltage Window (4V) and Long Cycling Stability Using a Protic Ionic Liquid Electrolyte. Adv. Nat. Sci. Nanosci. Nanotechnol. 2015, 6, 015004. [Google Scholar] [CrossRef] [Green Version]
  26. Abbas, Q.; Gollas, B.; Presser, V. Reduced Faradaic Contributions and Fast Charging of Nanoporous Carbon Electrodes in a Concentrated Sodium Nitrate Aqueous Electrolyte for Supercapacitors. Energy Technol. 2019, 7, 1900430. [Google Scholar] [CrossRef] [PubMed] [Green Version]
  27. Gezović, A.; Mišurović, J.; Milovanović, B.; Etinski, M.; Krstić, J.; Grudić, V.; Dominko, R.; Mentus, S.; Vujković, M.J. High Al-Ion Storage of Vine Shoots-Derived Activated Carbon: New Concept for Affordable and Sustainable Supercapacitors. J. Power Sources 2022, 538, 231561. [Google Scholar] [CrossRef]
  28. Icaza, J.C.; Guduru, R.K. Effect of Ion Charges on the Electric Double Layer Capacitance of Activated Carbon in Aqueous Electrolyte Systems. J. Power Sources 2016, 336, 360–366. [Google Scholar] [CrossRef]
  29. Cheary, R.W.; Coelho, A. Fundamental Parameters Approach to X-ray Line-Profile Fitting. J. Appl. Crystallogr. 1992, 25, 109–121. [Google Scholar] [CrossRef]
  30. Zhou, Z.; Liu, T.; Khan, A.U.; Liu, G. Block Copolymer–Based Porous Carbon Fibers. Sci. Adv. 2019, 5, eaau6852. [Google Scholar] [CrossRef]
  31. Thommes, M.; Kaneko, K.; Neimark, A.V.; Olivier, J.P.; Rodriguez-Reinoso, F.; Rouquerol, J.; Sing, K.S.W. Physisorption of Gases, with Special Reference to the Evaluation of Surface Area and Pore Size Distribution (IUPAC Technical Report). Pure Appl. Chem. 2015, 87, 1051–1069. [Google Scholar] [CrossRef] [Green Version]
  32. Zhang, S.; Dokko, K.; Watanabe, M. Direct Synthesis of Nitrogen-Doped Carbon Materials from Protic Ionic Liquids and Protic Salts: Structural and Physicochemical Correlations between Precursor and Carbon. Chem. Mater. 2014, 26, 2915–2926. [Google Scholar] [CrossRef]
  33. Xu, Z.; Yuan, Z.; Zhang, D.; Chen, W.; Huang, Y.; Zhang, T.; Tian, D.; Deng, H.; Zhou, Y.; Sun, Z. Highly Mesoporous Activated Carbon Synthesized by Pyrolysis of Waste Polyester Textiles and MgCl2: Physiochemical Characteristics and Pore-Forming Mechanism. J. Clean. Prod. 2018, 192, 453–461. [Google Scholar] [CrossRef]
  34. Biniak, S.; Trykowski, G.; Walczyk, M.; Richert, M. Thermo-Chemical Modification of Low-Dimensional Carbons: An Infrared Study. J. Appl. Spectrosc. 2016, 83, 580–585. [Google Scholar] [CrossRef]
  35. Figueiredo, J.L.; Pereira, M.F.R.; Freitas, M.M.A.; Órfão, J.J.M. Modification of the Surface Chemistry of Activated Carbons. Carbon N. Y. 1999, 37, 1379–1389. [Google Scholar] [CrossRef]
  36. Yang, W.; Du, Z.; Ma, Z.; Wang, G.; Bai, H.; Shao, G. Facile Synthesis of Nitrogen-Doped Hierarchical Porous Lamellar Carbon for High-Performance Supercapacitors. RSC Adv. 2016, 6, 3942–3950. [Google Scholar] [CrossRef]
  37. Cymann-Sachajdak, A.; Graczyk-Zajac, M.; Trykowski, G.; Wilamowska-Zawłocka, M. Understanding the Capacitance of Thin Composite Films Based on Conducting Polymer and Carbon Nanostructures in Aqueous Electrolytes. Electrochim. Acta 2021, 383, 138356. [Google Scholar] [CrossRef]
  38. Liu, J.; Wang, X.; Gao, J.; Zhang, Y.; Lu, Q.; Liu, M. Hollow Porous Carbon Spheres with Hierarchical Nanoarchitecture for Application of the High Performance Supercapacitors. Electrochim. Acta 2016, 211, 183–192. [Google Scholar] [CrossRef]
  39. Guo, W.; Guo, X.; Yang, L.; Wang, T.; Zhang, M.; Duan, G.; Liu, X.; Li, Y. Synthetic Melanin Facilitates MnO Supercapacitors with High Specific Capacitance and Wide Operation Potential Window. Polymer 2021, 235, 124276. [Google Scholar] [CrossRef]
  40. Cao, L.; Li, H.; Liu, X.; Liu, S.; Zhang, L.; Xu, W.; Yang, H.; Hou, H.; He, S.; Zhao, Y.; et al. Nitrogen, Sulfur Co-Doped Hierarchical Carbon Encapsulated in Graphene with “Sphere-in-Layer” Interconnection for High-Performance Supercapacitor. J. Colloid Interface Sci. 2021, 599, 443–452. [Google Scholar] [CrossRef]
  41. Wang, F.; Chen, L.; Li, H.; Duan, G.; He, S.; Zhang, L.; Zhang, G.; Zhou, Z.; Jiang, S. N-Doped Honeycomb-like Porous Carbon towards High-Performance Supercapacitor. Chin. Chem. Lett. 2020, 31, 1986–1990. [Google Scholar] [CrossRef]
  42. Pholauyphon, W.; Bulakhe, R.N.; Manyam, J.; In, I.; Paoprasert, P. High-Performance Supercapacitors Using Carbon Dots/Titanium Dioxide Composite Electrodes and Carbon Dot-Added Sulfuric Acid Electrolyte. J. Electroanal. Chem. 2022, 910, 116177. [Google Scholar] [CrossRef]
  43. Tiwari, P.; Jaiswal, J.; Chandra, R. Hierarchal Growth of MoS2@CNT Heterostructure for All Solid State Symmetric Supercapacitor: Insights into the Surface Science and Storage Mechanism. Electrochim. Acta 2019, 324, 134767. [Google Scholar] [CrossRef]
  44. Oh, Y.J.; Yoo, J.J.; Kim, Y.I.; Yoon, J.K.; Yoon, H.N.; Kim, J.H.; Park, S. Bin Oxygen Functional Groups and Electrochemical Capacitive Behavior of Incompletely Reduced Graphene Oxides as a Thin-Film Electrode of Supercapacitor. Electrochim. Acta 2014, 116, 118–128. [Google Scholar] [CrossRef] [Green Version]
  45. Nie, Y.F.; Wang, Q.; Chen, X.Y.; Zhang, Z.J. Nitrogen and Oxygen Functionalized Hollow Carbon Materials: The Capacitive Enhancement by Simply Incorporating Novel Redox Additives into H2SO4 Electrolyte. J. Power Sources 2016, 320, 140–152. [Google Scholar] [CrossRef]
  46. Luo, H.; Zheng, L.; Lei, L.; Zhang, D.; Wu, J.; Yang, J. Supercapacitive Behavior of Mesoporous Carbon CMK-3 in Calcium Nitrate Aqueous Electrolyte. Korean J. Chem. Eng. 2014, 31, 712–718. [Google Scholar] [CrossRef]
  47. Zou, K.; Tan, H.; Wang, L.; Qian, Y.; Deng, Y.; Chen, G. Biomass Waste-Derived Nitrogen-Rich Hierarchical Porous Carbon Offering Superior Capacitive Behavior in an Environmentally Friendly Aqueous MgSO4 Electrolyte. J. Colloid Interface Sci. 2019, 537, 475–485. [Google Scholar] [CrossRef]
  48. Vujković, M.J.; Etinski, M.; Vasić, B.; Kuzmanović, B.; Bajuk-Bogdanović, D.; Dominko, R.; Mentus, S. Polyaniline as a Charge Storage Material in an Aqueous Aluminum-Based Electrolyte: Can Aluminum Ions Play the Role of Protons? J. Power Sources 2021, 482, 228937. [Google Scholar] [CrossRef]
  49. Suo, L.; Borodin, O.; Wang, Y.; Rong, X.; Sun, W.; Fan, X.; Xu, S.; Schroeder, M.A.; Cresce, A.V.; Wang, F.; et al. “Water-in-Salt” Electrolyte Makes Aqueous Sodium-Ion Battery Safe, Green, and Long-Lasting. Adv. Energy Mater. 2017, 7, 1701189. [Google Scholar] [CrossRef]
  50. Wang, Y.; Meng, X.; Sun, J.; Liu, Y.; Hou, L. Recent Progress in “Water-in-Salt” Electrolytes Toward Non-Lithium Based Rechargeable Batteries. Front. Chem. 2020, 8, 595. [Google Scholar] [CrossRef]
  51. Jurewicz, K.; Frackowiak, E.; Béguin, F. Towards the Mechanism of Electrochemical Hydrogen Storage in Nanostructured Carbon Materials. Appl. Phys. A Mater. Sci. Process. 2004, 78, 981–987. [Google Scholar] [CrossRef]
  52. Wang, S.; Cao, K.; Xu, L.; Zhao, D.; Tong, Y. Carbon Nanotubes/Reduced Graphene Oxide Composites as Electrode Materials for Supercapacitors. Appl. Phys. A Mater. Sci. Process. 2022, 128, 1–10. [Google Scholar] [CrossRef]
  53. Xiang, C.; Li, M.; Zhi, M.; Manivannan, A.; Wu, N. A Reduced Graphene Oxide/Co3O4 Composite for Supercapacitor Electrode. J. Power Sources 2013, 226, 65–70. [Google Scholar] [CrossRef] [Green Version]
  54. Zheng, J.; Yan, B.; Feng, L.; Zhang, Q.; Zhang, C.; Yang, W.; Han, J.; Jiang, S.; He, S. Potassium Citrate Assisted Synthesis of Hierarchical Porous Carbon Materials for High Performance Supercapacitors. Diam. Relat. Mater. 2022, 128, 109247. [Google Scholar] [CrossRef]
  55. Liu, D.; Liu, Y.; Ding, Y.; Fan, B. Preparation of N/O Co-Doped Porous Carbon by a One-Step Activation Method for Supercapacitor Electrode Materials. RSC Adv. 2022, 12, 20866–20875. [Google Scholar] [CrossRef]
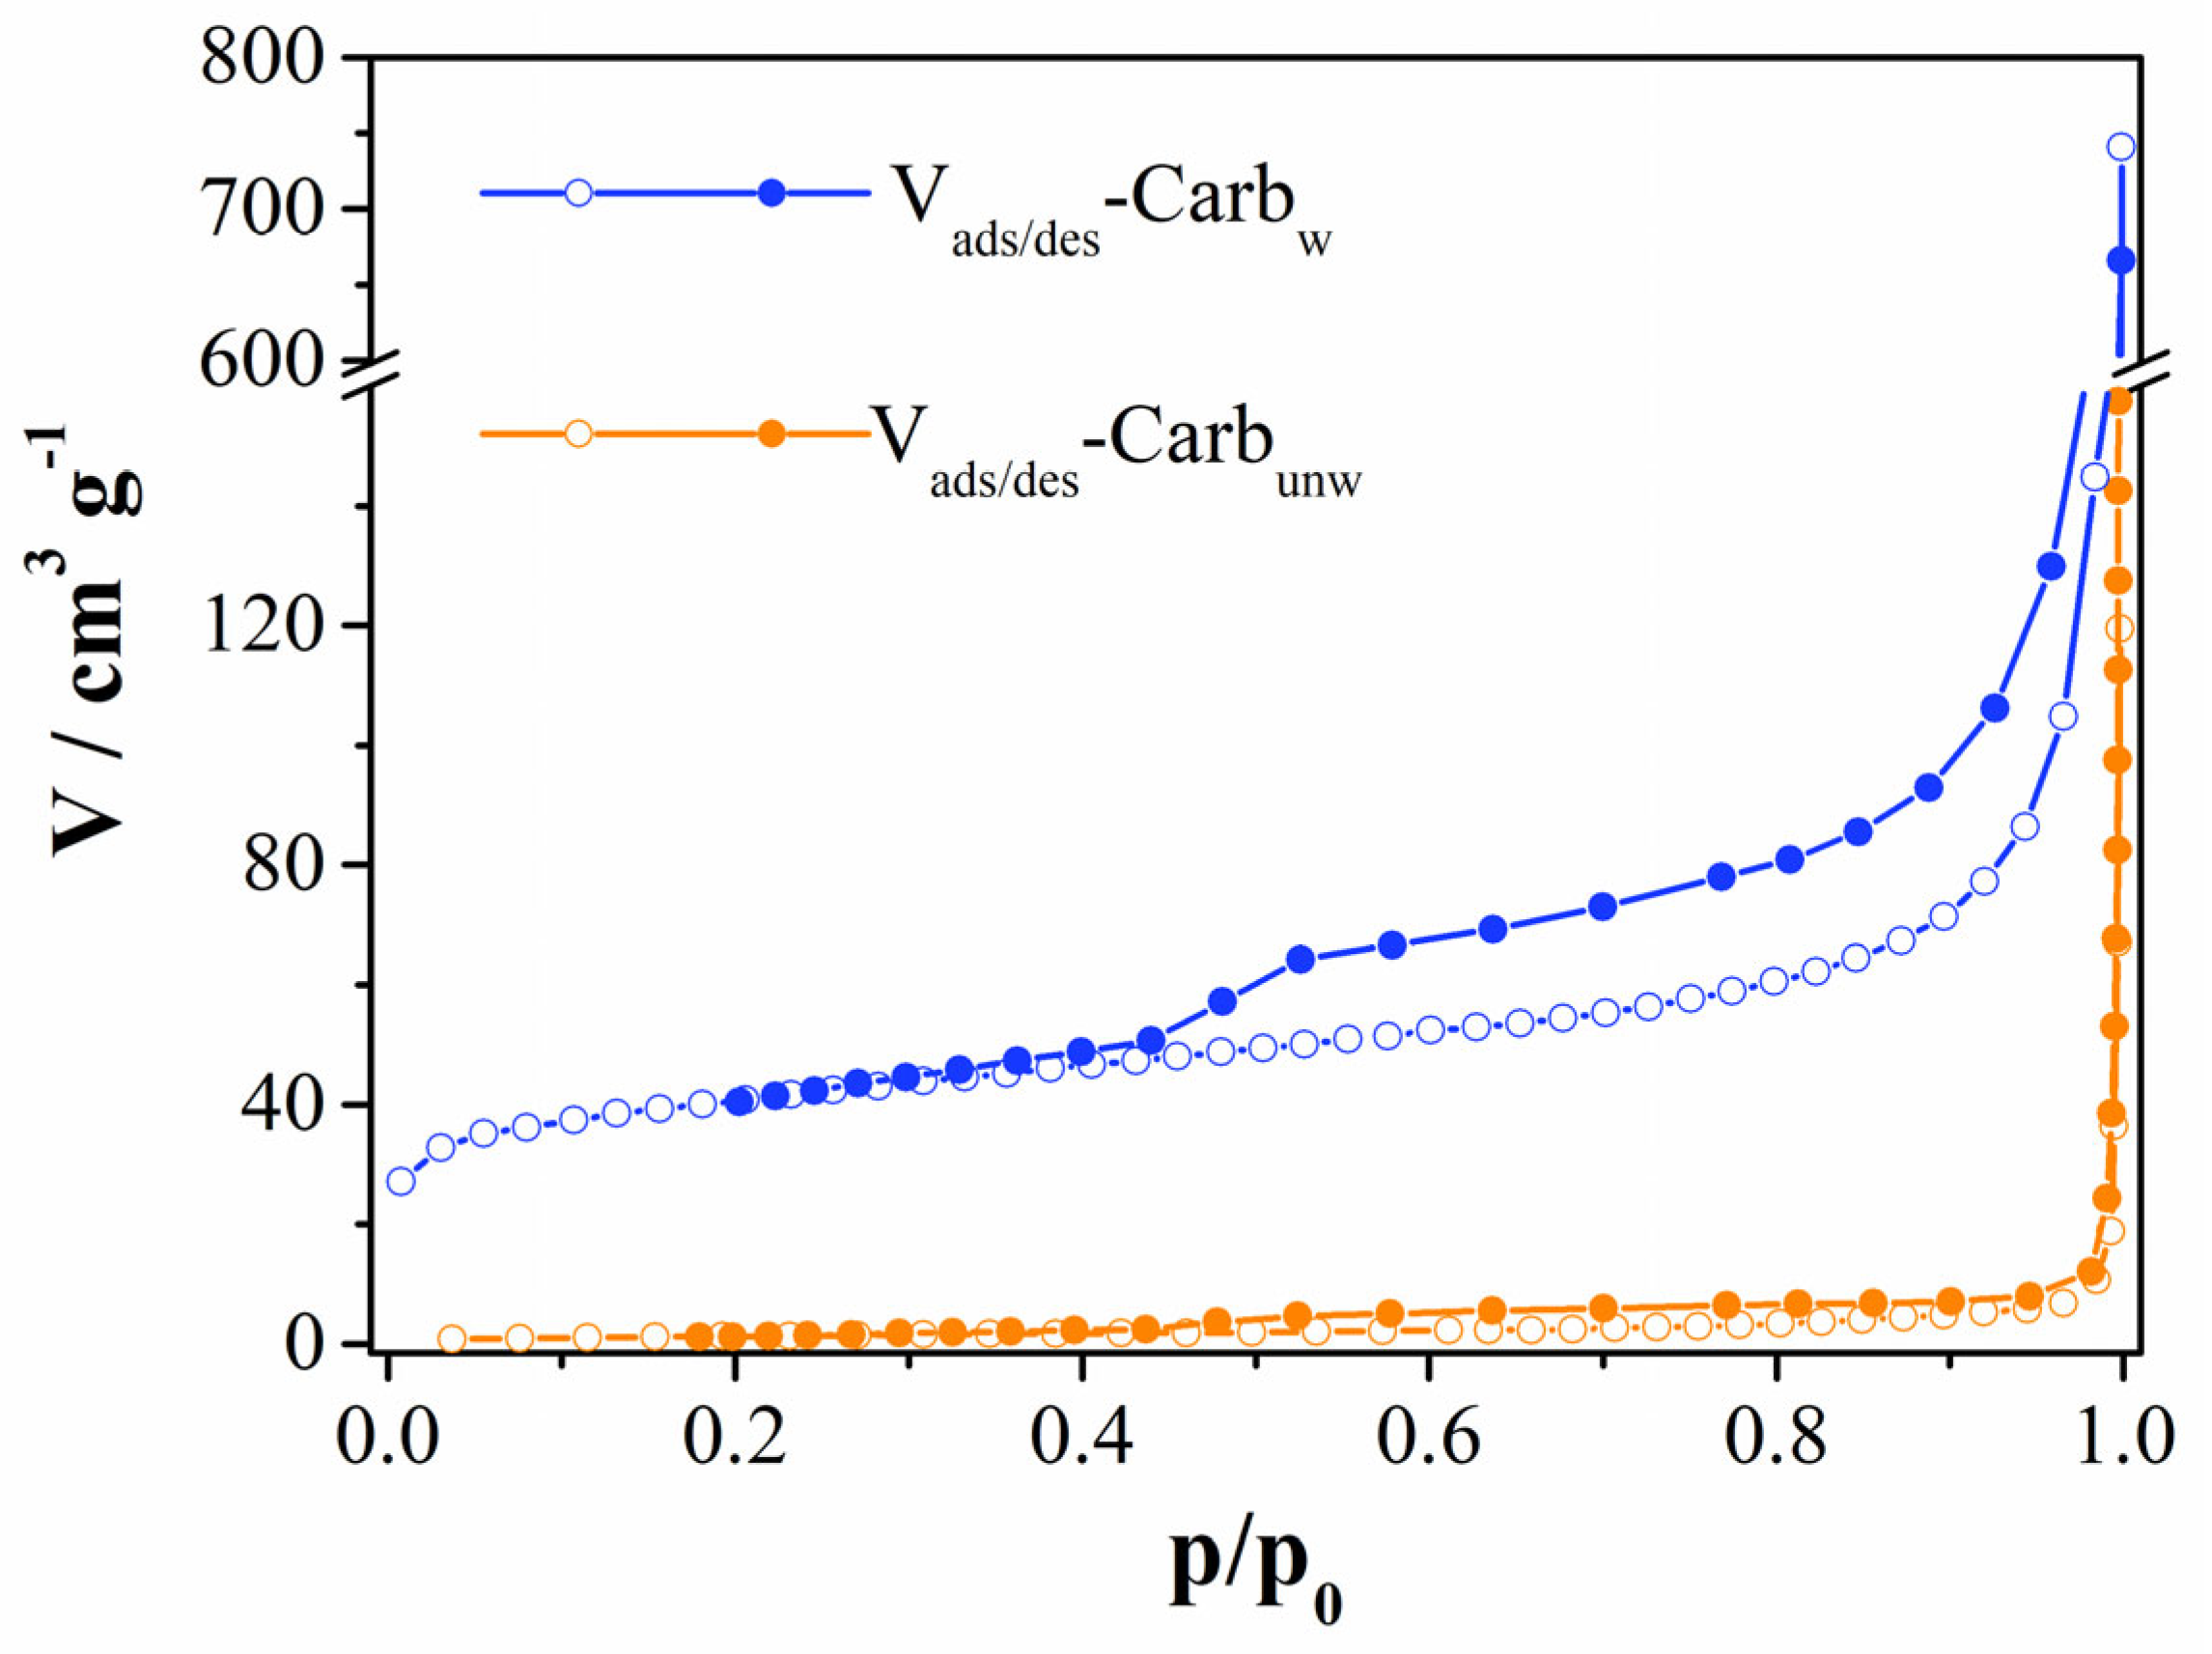
Figure 1. N2 adsorption and desorption isotherms for Carbw and Carbunw.
Batteries 08 00284 g001
Figure 2. XRD diffractograms for: (a) Carbunw and (b) Carbw materials.
Batteries 08 00284 g002
Figure 3. FTIR spectra of Carbw material.
Batteries 08 00284 g003
Figure 4. (a) SEM micrographs of Carbw at different magnification (30 µm, 10 µm and 4 µm) and (b) EDS elemental mapping of carbon, nitrogen and oxygen at Carbw surface.
Batteries 08 00284 g004
Figure 5. CVs of Carbw materials at scan rate 20 mV s−1 in 1 M H2SO4, 1 M Al(NO3)3 and 1 M Mg(NO3)2 electrolytes, with inserted specific capacitance versus scan rates.
Batteries 08 00284 g005
Figure 6. Specific capacitance versus scan rates for all investigated electrolytes.
Batteries 08 00284 g006
Figure 7. Linear plotting of log current density (absolute values obtained at negative scan direction) versus log scan rate at two potentials and evaluated b values.
Batteries 08 00284 g007
Figure 8. CVs of Carbw and separation of total current (solid line) and capacitive currents (shaded regions) at scan rate of 20 mV s−1 in all investigated electrolytes.
Batteries 08 00284 g008
Figure 9. Impedance diagram in all investigated electrolytes: (a) Nyquist plot, (b) Bode plot (recorded at 0.2 V vs. SCE) and complex capacitance analysis, (c) Creal vs. frequency plot and (d) Cim vs. frequency plot.
Batteries 08 00284 g009
Figure 10. (a) GCD curves at different current densities in 1 M Al(NO3)3, (b) stability of electrode material (recorded at 5 A g−1) and (c) Ragone plot.
Batteries 08 00284 g010
Table 1. Textural characteristics of Carbunw and Carbw.
MethodTextural Parameter, Abbreviation, UnitCarbunwCarbw
Brunauer–Emmet–TellerSpecific surface area, SSABET, m2 g−14.8146
t-plot, (Lippens and de Boer)Specific surface area, SSAt-plot, m2 g−14.8138
Mesopores, (Dollimore–Heal)Specific mesopore volume, Vmeso-DH, cm3 g−10.0100.109
Median mesopore diameter, Dmeso-DH, nm14.120.7
Mesopores surface area, Smeso-DH, m2 g−14.150.4
Mesopores, t-plot (Lippens–de Boer)Mesopores surface area, Smeso-t-plot, m2 g−12.942.6
Micropores, t-plot (Lippens–de Boer)Micropore volume, Vmic-t-plot, cm3 g−10.0040.056
Micropores, (Horvath–Kawazoe)Micropore volume, Vmic-HK, cm3 g−1-0.060
Median pore diameter, Dmic-HK, nm-0.9
Gurevitsch’s rule at p/p0 = 0.98Total pore volume, Vtot, cm3 g−10.0150.212
Publisher’s Note: MDPI stays neutral with regard to jurisdictional claims in published maps and institutional affiliations.

