
Verification of the Modified Degradation Mode Identification Technique by Employing Electrochemical Impedance Spectroscopy and Differential Voltage Analysis
Abstract
:1. Introduction
2. Capacity Measurement
3. Assessment of Battery Degradation Mode
3.1. DM Detection
3.1.1. Modified DM Identification Technique
4. Experimental Details
4.1. Cell Specification and Experimental Setup
4.2. Ageing Test
4.3. Reference Performance Test
4.4. Electrochemical Impedance Spectroscopy (EIS)
5. Results
5.1. SoH Measurement
5.2. DM Detection
6. Correlation with EIS and DV Curve
6.1. EIS Data Analysis
6.2. DV Analysis
7. Further Work
8. Conclusions
Author Contributions
Funding
Institutional Review Board Statement
Informed Consent Statement
Data Availability Statement
Conflicts of Interest
References
- Casals, L.C.; García, B.A.; Canal, C. Second life batteries lifespan: Rest of useful life and environmental analysis. J. Environ. Manag. 2019, 232, 354–363. [Google Scholar] [CrossRef] [PubMed]
- Hawkins, T.R.; Singh, B.; Majeau-Bettez, G.; Strømman, A.H. Comparative Environmental Life Cycle Assessment of Conventional and Electric Vehicles. J. Ind. Ecol. 2013, 17, 53–64. [Google Scholar] [CrossRef]
- Martinez-Laserna, E.; Sarasketa-Zabala, E.; Sarria, I.V.; Stroe, D.-I.; Swierczynski, M.; Warnecke, A.; Timmermans, J.-M.; Goutam, S.; Omar, N.; Rodriguez, P. Technical Viability of Battery Second Life: A Study from the Ageing Perspective. IEEE Trans. Ind. Appl. 2018, 54, 2703–2713. [Google Scholar] [CrossRef]
- SMMT Driving the Motor Industry. Car Registration. Available online: https://www.smmt.co.uk/vehicle-data/car-registrations/ (accessed on 5 November 2022).
- Parry, T.; Department for Transport, UK. Vehicle Licensing Statistics: Annual 2018. 2019. Available online: https://assets.publishing.service.gov.uk/government/uploads/system/uploads/attachment_data/file/800502/vehicle-licensing-statistics-2018.pdf (accessed on 1 November 2022).
- Cluzel, C.; Element Energy Ltd. Batteries on Wheels: The Role of Battery Electric Cars in the EU Power System and Beyond. Available online: http://www.element-energy.co.uk/wordpress/wp-content/uploads/2019/06/20190604_Element-Energy_Battery-study_launch-event-Final.pdf (accessed on 3 November 2022).
- Hendrickson, T.P.; Kavvada, O.; Shah, N.; Sathre, R.; Scown, C.D. Life-cycle implications and supply chain logistics of electric vehicle battery recycling in California. Environ. Res. Lett. 2015, 10, 014011. [Google Scholar] [CrossRef]
- Neubauer, J.S.; Wood, E.; Pesaran, A. A second life for electric vehicle batteries: Answering questions on battery degradation and value. SAE Int. J. Mater. Manuf. 2015, 8, 544–553. [Google Scholar] [CrossRef] [Green Version]
- Schuster, S.F.; Brand, M.J.; Berg, P.; Gleissenberger, M.; Jossen, A. Lithium-ion cell-to-cell variation during battery electric vehicle operation. J. Power Sources 2015, 297, 242–251. [Google Scholar] [CrossRef]
- Ungurean, L.; Cârstoiu, G.; Micea, M.V.; Groza, V. Battery state of health estimation: A structured review of models, methods and commercial devices. Int. J. Energy Res. 2017, 41, 151–181. [Google Scholar] [CrossRef]
- Barré, A.; Deguilhem, B.; Grolleau, S.; Gérard, M.; Suard, F.; Riu, D. A review on lithium-ion battery ageing mechanisms and estimations for automotive applications. J. Power Sources 2013, 241, 680–689. [Google Scholar] [CrossRef] [Green Version]
- Foster, M.; Isely, P.; Standridge, C.R.; Hasan, M.M. Feasibility assessment of remanufacturing, repurposing, and recycling of end of vehicle application lithium-ion batteries. J. Ind. Eng. Manag. (JIEM) 2014, 7, 698–715. [Google Scholar] [CrossRef] [Green Version]
- Wu, B.; Yufit, V.; Merla, Y.; Martinez-Botas, R.F.; Brandon, N.P.; Offer, G.J. Differential thermal voltammetry for tracking of degradation in lithium-ion batteries. J. Power Sources 2015, 273, 495–501. [Google Scholar] [CrossRef]
- Barai, A.; Uddin, K.; Dubarry, M.; Somerville, L.; McGordon, A.; Jennings, P.; Bloom, I. A comparison of methodologies for the non-invasive characterisation of commercial Li-ion cells. Prog. Energy Combust. Sci. 2019, 72, 1–31. [Google Scholar] [CrossRef]
- Dubarry, M.; Devie, A.; Liaw, B.Y. The value of battery diagnostics and prognostics. J. Energy Power Sources 2014, 1, 242–249. [Google Scholar]
- Mowri, S.T.; Barai, A.; Gupta, A.; Marco, J. Modification of Degradation Mechanism Identification Technique for Cell Grading. In Proceedings of the 2021 IEEE Vehicle Power and Propulsion Conference (VPPC), Gijon, Spain, 25–28 October 2021; pp. 1–7. [Google Scholar] [CrossRef]
- Farmann, A.; Waag, W.; Marongiu, A.; Sauer, D.U. Critical review of on-board capacity estimation techniques for lithium-ion batteries in electric and hybrid electric vehicles. J. Power Sources 2015, 281, 114–130. [Google Scholar] [CrossRef]
- Pastor-Fernández, C.; Bruen, T.; Widanage, W.D.; Gama-Valdez, M.A.; Marco, J. A Study of Cell-to-Cell Interactions and Degradation in Parallel Strings: Implications for the Battery Management System. J. Power Sources 2016, 329, 574–585. [Google Scholar] [CrossRef] [Green Version]
- Andre, D.; Appel, C.; Soczka-Guth, T.; Sauer, D.U. Advanced mathematical methods of SOC and SOH estimation for lithium-ion batteries. J. Power Sources 2013, 224, 20–27. [Google Scholar] [CrossRef]
- Belt, J.R.; Ho, C.D.; Motloch, C.G.; Miller, T.J.; Duong, T.Q. A capacity and power fade study of Li-ion cells during life cycle testing. J. Power Sources 2003, 123, 241–246. [Google Scholar] [CrossRef]
- Uddin, K.; Perera, S.; Widanage, W.D.; Somerville, L.; Marco, J. Characterising Lithium-Ion Battery Degradation through the Identification and Tracking of Electrochemical Battery Model Parameters. Batteries 2016, 2, 13. [Google Scholar] [CrossRef]
- Vetter, J.; Novák, P.; Wagner, M.R.; Veit, C.; Möller, K.-C.; Besenhard, J.O.; Winter, M.; Wohlfahrt-Mehrens, M.; Vogler, C.; Hammouche, A. Ageing mechanisms in lithium-ion batteries. J. Power Sources 2005, 147, 269–281. [Google Scholar] [CrossRef]
- Dubarry, M.; Truchot, C.; Liaw, B.Y. Synthesise battery degradation modes via a diagnostic and prognostic model. J. Power Sources 2012, 219, 204–216. [Google Scholar] [CrossRef]
- Birkl, C.R.; Roberts, M.R.; McTurk, E.; Bruce, P.G.; Howey, D.A. Degradation diagnostics for lithium ion cells. J. Power Sources 2017, 341, 373–386. [Google Scholar] [CrossRef]
- Marongiu, A.; Nlandi, N.; Rong, Y.; Sauer, D.U. On-board capacity estimation of lithium iron phosphate batteries by means of half-cell curves. J. Power Sources 2016, 324, 158–169. [Google Scholar] [CrossRef]
- Pastor-Fernández, C.; Yu, T.F.; Widanage, W.D.; Marco, J. Critical review of non-invasive diagnosis techniques for quantification of degradation modes in lithium-ion batteries. Renew. Sustain. Energy Rev. 2019, 109, 138–159. [Google Scholar] [CrossRef]
- Pastor-Fernández, C.; Uddin, K.; Chouchelamane, G.H.; Widanage, W.D.; Marco, J. A Comparison between Electrochemical Impedance Spectroscopy and Incremental Capacity-Differential Voltage as Li-ion Diagnostic Techniques to Identify and Quantify the Effects of Degradation Modes within Battery Management Systems. J. Power Sources 2017, 360, 301–318. [Google Scholar] [CrossRef]
- Pastor-Fernández, C.; Widanage, W.D.; Marco, J.; Gama-Valdez, M.; Chouchelamane, G.H. Identification and quantification of ageing mechanisms in Lithium-ion batteries using the EIS technique. In Proceedings of the 2016 IEEE Transportation Electrification Conference and Expo (ITEC), Dearborn, MI, USA, 27–29 June 2016; pp. 1–6. [Google Scholar] [CrossRef] [Green Version]
- Abraham, D.P.; Poppen, S.D.; Jansen, A.N.; Liu, J.; Dees, D.W. Application of a lithium–tin reference electrode to determine electrode contributions to impedance rise in high-power lithium-ion cells. Electrochim. Acta 2004, 49, 4763–4775. [Google Scholar] [CrossRef]
- Broussely, M.; Biensan, P.; Bonhomme, F.; Blanchard, P.; Herreyre, S.; Nechev, K.; Staniewicz, R. Main aging mechanisms in Li ion batteries. J. Power Sources 2005, 146, 90–96. [Google Scholar] [CrossRef]
- Zhu, J.; Darma, M.S.D.; Knapp, M.; Sørensen, D.R.; Heere, M.; Fang, Q.; Wang, X.; Dai, H.; Mereacre, L.; Senyshyn, A.; et al. Investigation of lithium-ion battery degradation mechanisms by combining differential voltage analysis and alternating current impedance. J. Power Sources 2020, 448, 227575. [Google Scholar] [CrossRef]
- Keil, P.; Jossen, A. Calendar Aging of NCA Lithium-Ion Batteries Investigated by Differential Voltage Analysis and Coulomb Tracking. J. Electrochem. Soc. 2016, 164, A6066–A6074. [Google Scholar] [CrossRef]
- Dubarry, M.; Liaw, B.Y. Identify capacity fading mechanism in a commercial LiFePO4 cell. J. Power Sources 2009, 194, 541–549. [Google Scholar] [CrossRef]
- Dubarry, M.; Liaw, B.Y.; Chen, M.-S.; Chyan, S.-S.; Han, K.-C.; Sie, W.-T.; Wu, S.-H. Identifying battery aging mechanisms in large format Li ion cells. J. Power Sources 2011, 196, 3420–3425. [Google Scholar] [CrossRef]
- Dubarry, M.; Svoboda, V.; Hwu, R.; Liaw, B.Y. Incremental Capacity Analysis and Close-to-Equilibrium OCV Measurements to Quantify Capacity Fade in Commercial Rechargeable Lithium Batteries. Electrochem. Solid-State Lett. 2006, 9, A454–A457. [Google Scholar] [CrossRef]
- Sarasketa-Zabala, E.; Aguesse, F.; Villarreal, I.; Rodriguez-Martinez, L.; López, C.M.; Kubiak, P. Understanding lithium inventory loss and sudden performance fade in cylindrical cells during cycling with deep-discharge steps. J. Phys. Chem. C 2015, 119, 896–906. [Google Scholar] [CrossRef]
- Jia, X.; Zhang, C.; Zhang, L.; Zhang, W. The Degradation Characteristics and Mechanism of Li [Ni0.5Co0.2Mn0.3]O2 Batteries at Different Temperatures and Discharge Current Rates. J. Electrochem. Soc. 2020, 167, 020503. [Google Scholar] [CrossRef]
- Stiaszny, B.; Ziegler, J.C.; Krauß, E.E.; Schmidt, J.P.; Ivers-Tiffée, E. Electrochemical characterisation and post-mortem analysis of aged LiMn2O4–Li (Ni0.5Mn0.3Co0.2)O2/graphite lithium ion batteries. Part I: Cycle aging. J. Power Sources 2014, 251, 439–450. [Google Scholar] [CrossRef]
- Waldmann, T.; Wilka, M.; Kasper, M.; Fleischhammer, M.; Wohlfahrt-Mehrens, M. Temperature dependent ageing mechanisms in Lithium-ion batteries—A Post-Mortem study. J. Power Sources 2014, 262, 129–135. [Google Scholar] [CrossRef]
- Broussely, M.; Herreyre, S.; Biensan, P.; Kasztejna, P.; Nechev, K.; Staniewicz, R. Aging mechanism in Li ion cells and calendar life predictions. J. Power Sources 2001, 97, 13–21. [Google Scholar] [CrossRef]
- Waldmann, T.; Ghanbari, N.; Kasper, M.; Wohlfahrt-Mehrens, M. Correlations between Electrochemical Data and Results from Post-Mortem Analysis of Aged Lithium-Ion Batteries. J. Electrochem. Soc. 2015, 162, A1500. [Google Scholar] [CrossRef]
- Aurbach, D.; Markovsky, B.; Rodkin, A.; Cojocaru, M.; Levi, E.; Kim, H.-J. An analysis of rechargeable lithium-ion batteries after prolonged cycling. Electrochim. Acta 2002, 47, 1899–1911. [Google Scholar] [CrossRef]
- Ramadass, P.; Haran, B.; White, R.; Popov, B.N. Capacity fade of Sony 18650 cells cycled at elevated temperatures: Part I. Cycling performance. J. Power Sources 2002, 112, 606–613. [Google Scholar] [CrossRef] [Green Version]
- Dubarry, M.; Truchot, C.; Liaw, B.Y.; Gering, K.; Sazhin, S.; Jamison, D.; Michelbacher, C. Evaluation of commercial lithium-ion cells based on composite positive electrode for plug-in hybrid electric vehicle applications. Part II. Degradation mechanism under 2C cycle aging. J. Power Sources 2011, 196, 10336–10343. [Google Scholar] [CrossRef]
- Podias, A.; Pfrang, A.; Di Persio, F.; Kriston, A.; Bobba, S.; Mathieux, F.; Messagie, M.; Boon-Brett, L. Sustainability Assessment of Second Use Applications of Automotive Batteries: Ageing of Li-Ion Battery Cells in Automotive and Grid-Scale Applications. World Electr. Veh. J. 2018, 9, 24. [Google Scholar] [CrossRef] [Green Version]
- Wood, E.; Alexander, M.; Bradley, T.H. Investigation of battery end-of-life conditions for plug-in hybrid electric vehicles. J. Power Sources 2011, 196, 5147–5154. [Google Scholar] [CrossRef]
- Huang, S.-C.; Tseng, K.-H.; Liang, J.-W.; Chang, C.-L.; Pecht, M.G. An Online SOC and SOH Estimation Model for Lithium-Ion Batteries. Energies 2017, 10, 512. [Google Scholar] [CrossRef]
- Martinez-Laserna, E.; Sarasketa-Zabala, E.; Stroe, D.-I.; Swierczynski, M.; Warnecke, A.; Timmermans, J.M.; Goutam, S.; Rodriguez, P. Evaluation of lithium-ion battery second life performance and degradation. In Proceedings of the ECCE 2016—IEEE Energy Conversion Congress and Exposition, Milwaukee, WI, USA, 18–22 September 2016; IEEE: Washington, DC, USA, 2016; pp. 1–7. [Google Scholar]


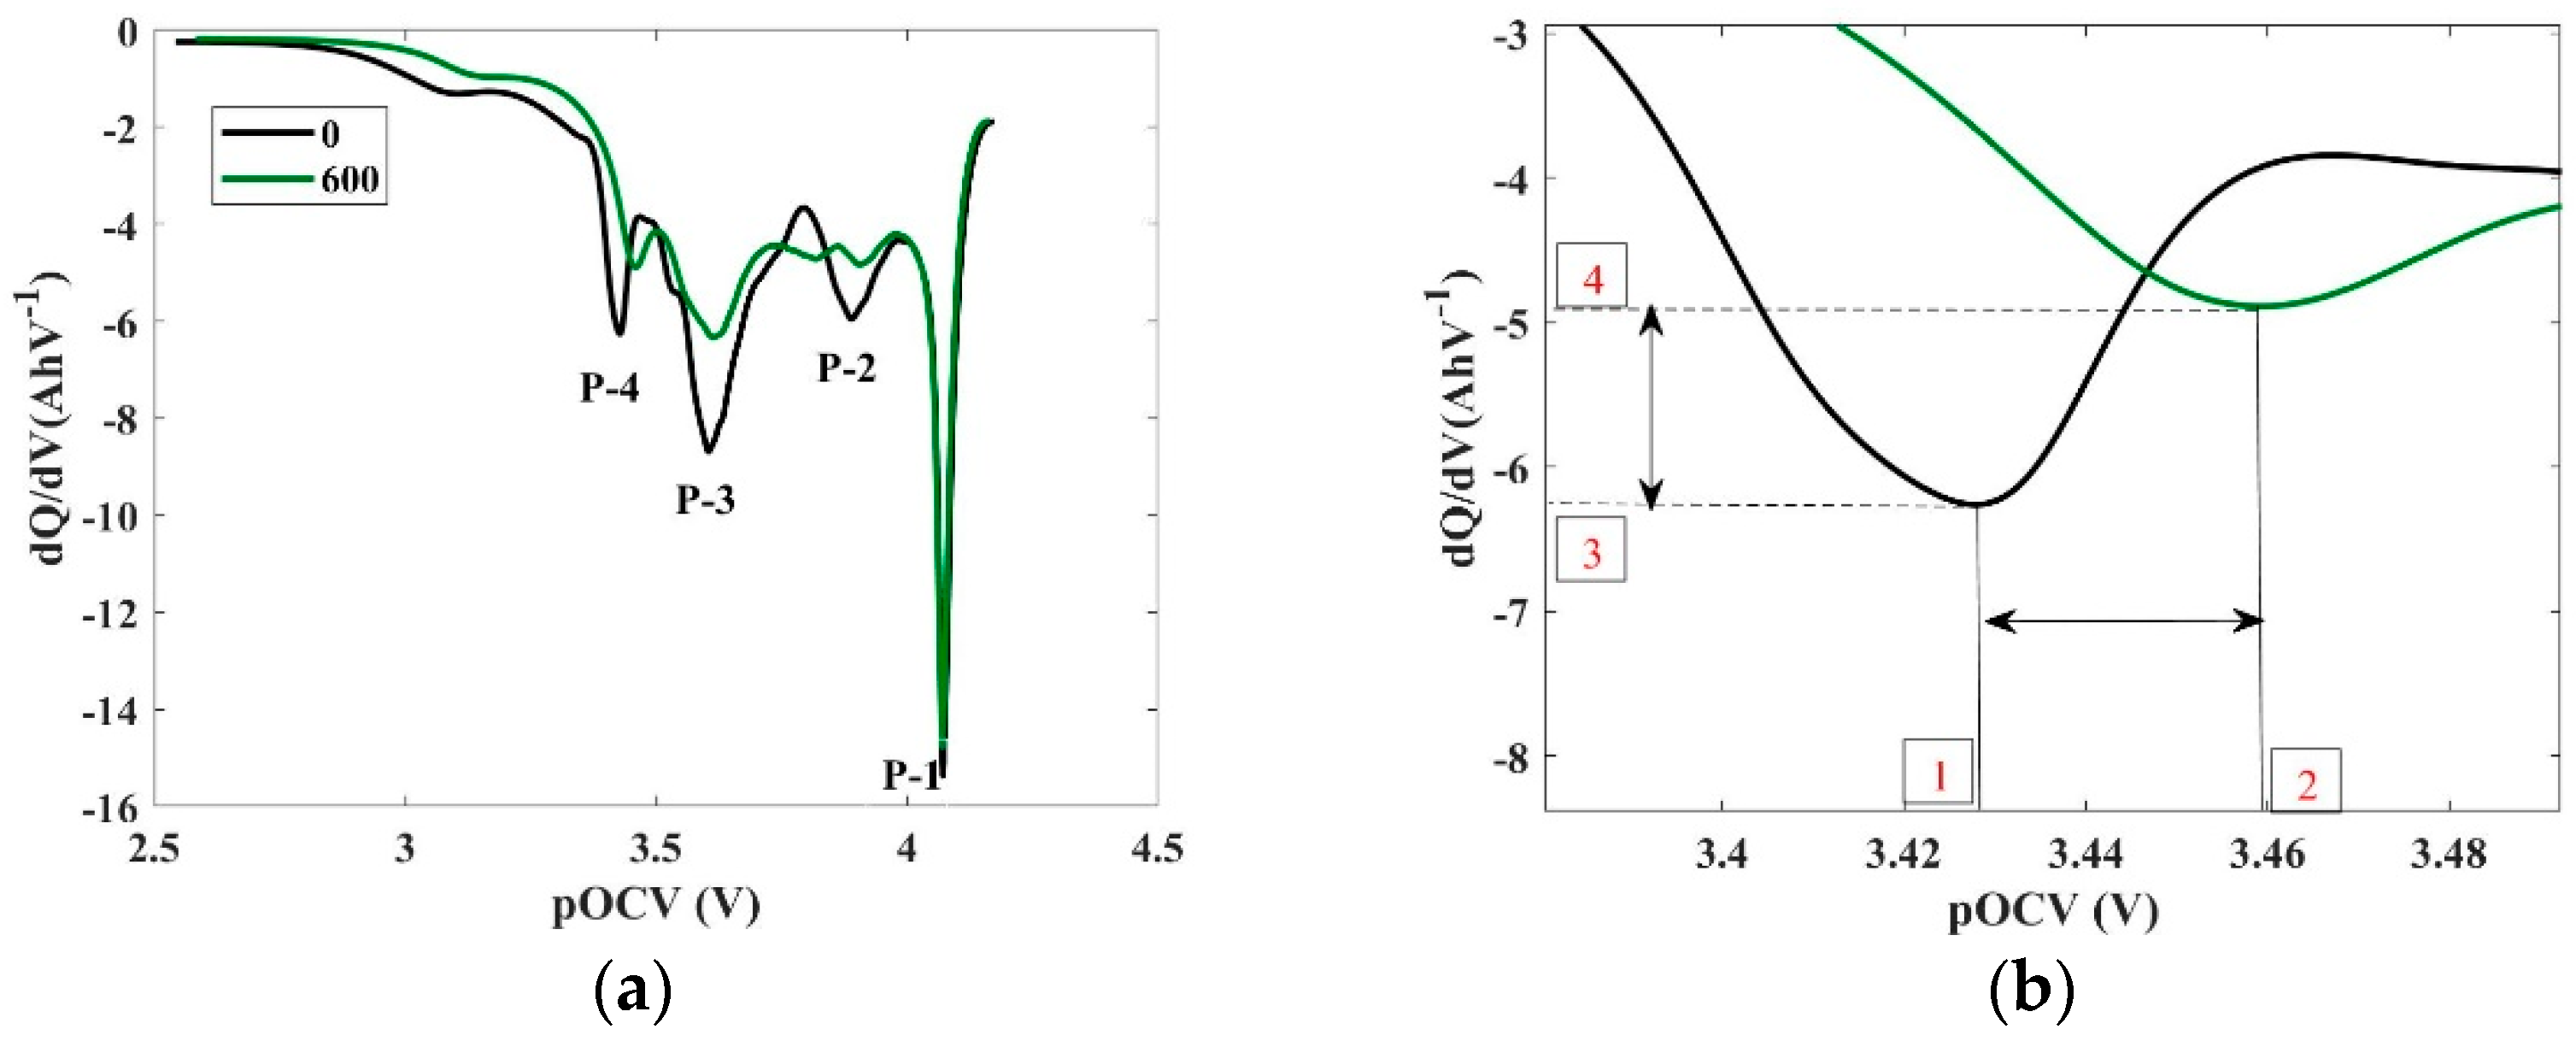
| Changes in IC Peak | Unit | Changes in DV Peak | Unit | DM |
|---|---|---|---|---|
| Shrinkage of the magnitude of the peaks along with the shifting in the direction of higher voltages | [AhV−1] and V | Shifting of the DV curves in the direction of the lower capacities without shifting of the DV peaks | [Ah] | LLI |
| Shifting of the peaks in the direction of the lower voltages | V | Insufficient change | [Ah] | CL |
| Shrinkage of the magnitude of the peak at a nearly persistent voltage | [AhV−1] | Shifting of the DV curves in the direction of the lower capacities | [VAh−1] | LAM |
| ECM-Component | Unit | Most Relevant DM |
|---|---|---|
| Growth of Rohm | [Ω] | CL |
| Growth of Rsei & Rct | [Ω] | LLI |
| Growth of Rw | [Ω] | LAM |
| Characteristics | Dubarry Method | Carlos Method | Modified DM Identification Method |
|---|---|---|---|
| Definition of DMs | LLI, LAMdePE, LAMliPE, LAMdeNE, LAMliNE | LAM, LLI and CL | LAM, LLI and CL |
| Assumption of DM | From IC peak change | From IC peak change | From IC peak change |
| Detection of IC peak change | Visual Inspection | Not Defined | Measurement of the IC peak positions at the new and aged condition |
| Suitable for cell grading | Not Defined | Not Defined | Could be used for cell grading |
| Sl No | Cycling Condition (Ch-Dch) |
|---|---|
| 1 | 0.5C_1C |
| 2 | 0.7C_0.3C |
| 3 | 0.7C_0.5C |
| 4 | 0.7C_1C |
| 5 | 0.7C_1.5C |
| Cell | P4 | P3 | P2 | P1 | SoH% |
|---|---|---|---|---|---|
| Cell A | LAM | LLI | LAM | LLI | 80.58 |
| Cell B | LAM | LLI | LAM | LLI | 80.54 |
| Cell C | LLI | LLI | LAM | LLI | 79 |
| Cell D | LAM | LLI | LAM | LLI | 81.16 |
| Cell E | LAM | LLI | LAM | LLI | 78.76 |
| Cell F | LAM | LLI | LAM | LLI | 77.56 |
| Cell G | PD (Peak Disappeared) | LLI | LAM | LLI | 78.58 |
| Cell H | LAM | LLI | LLI | LLI | 79.35 |
| Cell I | LLI | LLI | LLI | LLI | 78.51 |
| Cell J | PD | LLI | LAM | LLI | 81.56 |
| Cell K | LAM | LLI | LAM | LLI | 79.14 |
| Cell L | LLI | LLI | LLI | LLI | 76.95 |
| Cell M | LLI | LLI | LLI | LLI | 78.56 |
| Cell N | LLI | LLI | LLI | LLI | 78.4 |
| Cell O | LLI | LLI | LLI | LLI | 76.75 |
| Cell P | LAM | LLI | LLI | LLI | 77.96 |
| Cell Q | LAM | LLI | LLI | LLI | 78.36 |
| Cell R | LAM | LLI | LLI | LLI | 79.74 |
| Cell S | LAM | LLI | LLI | LLI | 76.95 |
| Cell T | LAM | LLI | LLI | LLI | 79.76 |
| Cell U | PD | LLI | LLI | LLI | 80.76 |
| Cell V | LAM | LLI | LLI | LLI | 80.56 |
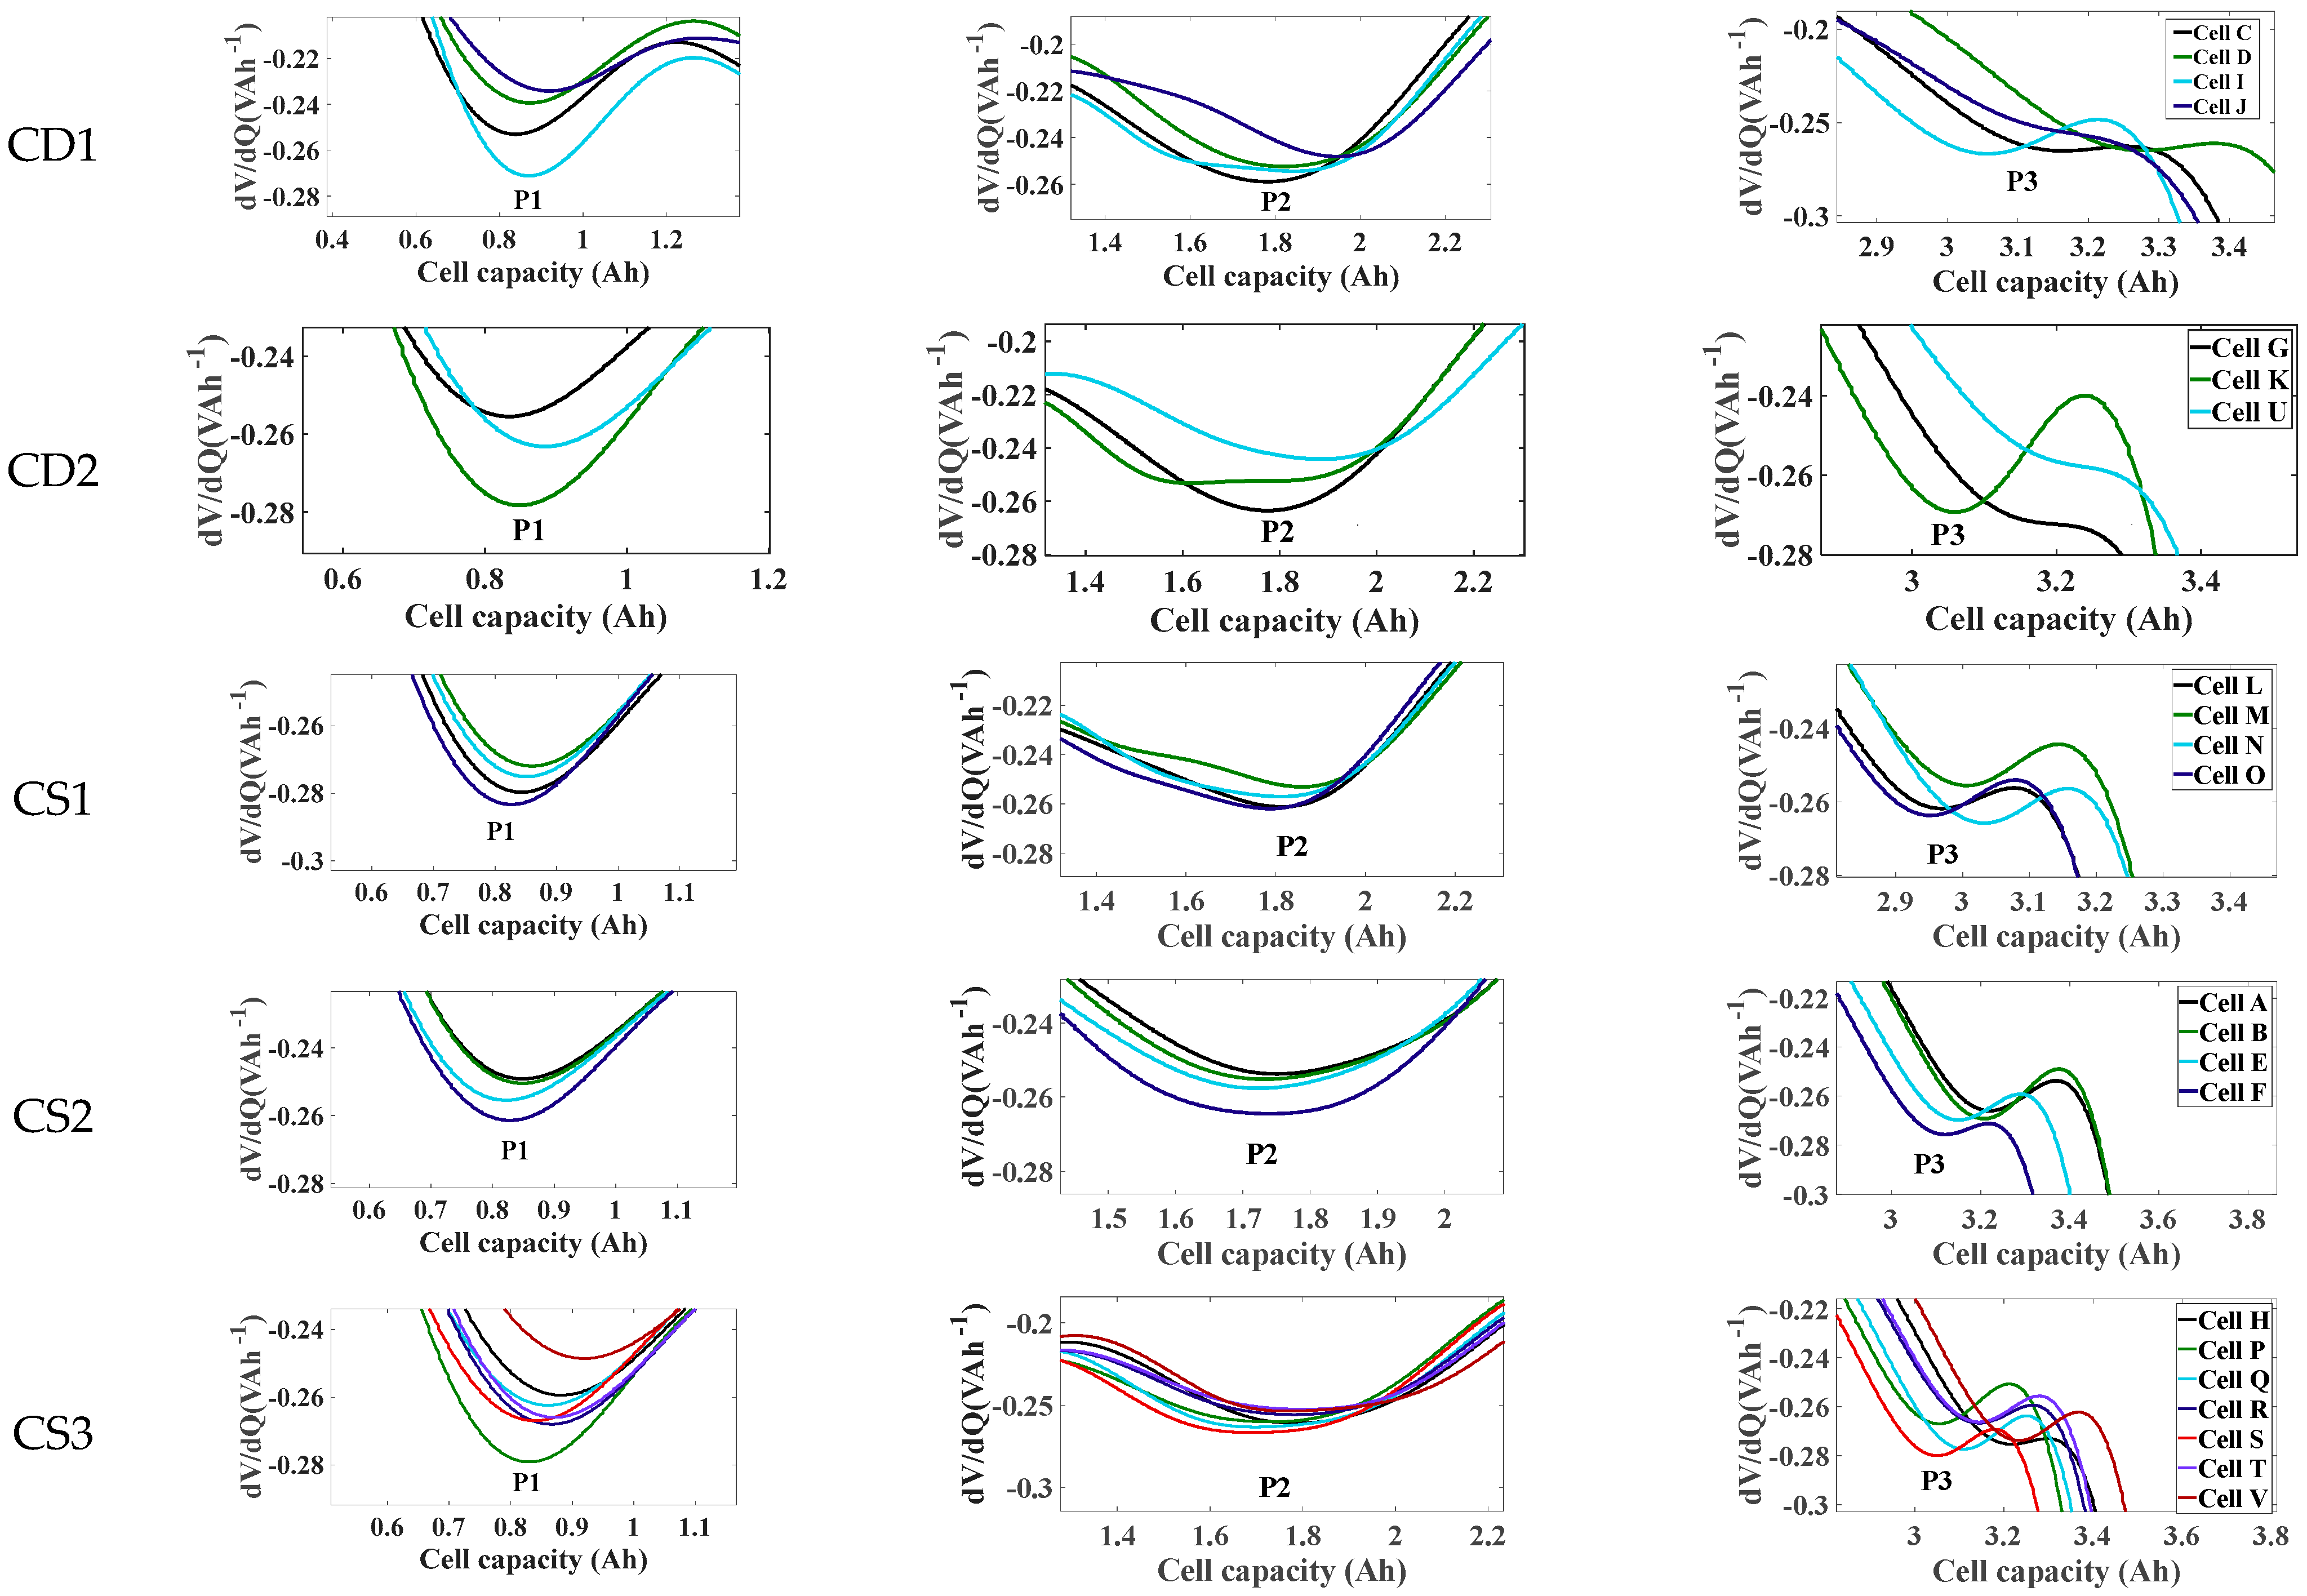
| Same DM Cell Group | |||||||
|---|---|---|---|---|---|---|---|
| CS1 | Cell L | Cell M | Cell N | Cell O | |||
| CS2 | Cell A | Cell B | Cell E | Cell F | |||
| CS3 | Cell H | Cell P | Cell Q | Cell R | Cell S | Cell T | Cell V |
| Different DM cell Group | |||||||
| CD1 | Cell C | Cell D | Cell J | Cell I | |||
| CD2 | Cell G | Cell K | Cell U | ||||
| CS1 | CS2 | |||||||
|---|---|---|---|---|---|---|---|---|
| %SoC | Cell | LLI% (EIS) | LAM% (EIS) | Ratio of LAM and LLI | Cell | LLI% (EIS) | LAM% (EIS) | Ratio of LAM and LLI |
| 50% | L | 30.422 | 272.73 | 8.93 | A | 94.59 | 125.64 | 1.32 |
| M | 31.02 | 283.86 | 9.15 | B | 92.76 | 139.22 | 1.50 | |
| N | 31.76 | 284.97 | 8.97 | E | 101.38 | 100.27 | 0.98 | |
| O | 684.49 | 274.40 | 0.40 | F | 78.63 | 105.28 | 1.33 | |
| %SoC | Cell | LLI% (EIS) | LAM% (EIS) | Ratio of LAM and LLI |
|---|---|---|---|---|
| 50% | M | 31.02 | 283.86 | 9.15 |
| A | 94.59 | 125.64 | 1.32 | |
| H | 53.366 | 80.806 | 1.51 |
| Q80_SD (x-Axis) | dV/dQ80_SD (y-Axis) | ||
|---|---|---|---|
| CS1 | P1 | 0.013 | 0.004 |
| P2 | 0.029 | 0.003 | |
| P3 | 0.032 | 0.003 | |
| CS2 | P1 | 0.010 | 0.005 |
| P2 | 0.011 | 0.004 | |
| P3 | 0.041 | 0.003 | |
| CS3 | P1 | 0.026 | 0.009 |
| P2 | 0.039 | 0.005 | |
| P3 | 0.063 | 0.005 | |
| CD1 | P1 | 0.031 | 0.014 |
| P2 | 0.067 | 0.004 | |
| P3 | 0.082 | 0.001 | |
| CD2 | P1 | 0.021 | 0.009 |
| P2 | 0.116 | 0.008 | |
| P3 | 0.072 | 0.006 |
Publisher’s Note: MDPI stays neutral with regard to jurisdictional claims in published maps and institutional affiliations. |
© 2022 by the authors. Licensee MDPI, Basel, Switzerland. This article is an open access article distributed under the terms and conditions of the Creative Commons Attribution (CC BY) license (https://creativecommons.org/licenses/by/4.0/).
Share and Cite
Tasnim Mowri, S.; Barai, A.; Gupta, A.; Marco, J. Verification of the Modified Degradation Mode Identification Technique by Employing Electrochemical Impedance Spectroscopy and Differential Voltage Analysis. Batteries 2022, 8, 274. https://doi.org/10.3390/batteries8120274
Tasnim Mowri S, Barai A, Gupta A, Marco J. Verification of the Modified Degradation Mode Identification Technique by Employing Electrochemical Impedance Spectroscopy and Differential Voltage Analysis. Batteries. 2022; 8(12):274. https://doi.org/10.3390/batteries8120274
Chicago/Turabian StyleTasnim Mowri, Sadia, Anup Barai, Aniruddha Gupta, and James Marco. 2022. "Verification of the Modified Degradation Mode Identification Technique by Employing Electrochemical Impedance Spectroscopy and Differential Voltage Analysis" Batteries 8, no. 12: 274. https://doi.org/10.3390/batteries8120274