Article

Characteristic Prediction and Temperature-Control Strategy under Constant Power Conditions for Lithium-Ion Batteries

1
School of Automotive Engineering, Harbin Institute of Technology, Weihai 264209, China
2
Guangdong Guanghua Sci-Tech Co., Ltd., Shantou 515000, China
3
School of Chemical Engineering and Chemistry, Harbin Institute of Technology, Harbin 150001, China
4
Zhuhai Zhongli New Energy Sci-Tech Co., Ltd., Zhuhai 519000, China
*
Author to whom correspondence should be addressed.
Batteries 2022, 8(11), 217; https://doi.org/10.3390/batteries8110217
Submission received: 10 October 2022 / Revised: 1 November 2022 / Accepted: 2 November 2022 / Published: 4 November 2022
(This article belongs to the Section Battery Modelling, Simulation, Management and Application)

Abstract

:
Accurate characteristic prediction under constant power conditions can accurately evaluate the capacity of lithium-ion battery output. It can also ensure safe use for new-energy vehicles and electrochemical energy storage. As the battery voltage continues to drop under constant power conditions, the battery current output will accordingly increase, which brings a risk of thermal runaway in instances of weak heat dissipation. Therefore, knowing how to control the battery temperature is very critical for safe use. At present, the model-based method for characteristic prediction and temperature control has been used by most scholars, and that is also the key to this method. This work firstly extends a cell model to a pack-based electrochemical two-dimensional thermal coupling model, considering the heterogeneity of different cells inside the pack, and obtains the model parameters for a prismatic lithium-ion battery with a rated capacity of 42 Ah. Characteristic prediction under constant power conditions is then conducted based on an iterative solution method. Validations of characteristic prediction indicate the convenience of the developed models, with average absolute errors of voltage and temperature less than 36 mV and 0.4 K, respectively, and power error less than 0.005%. Finally, two model-based temperature feed-forward control strategies with lower cooling costs and shorter prediction times were developed based on the battery characteristic predictions, which leaves room for further controller development.

1. Introduction

With the increasingly serious problems of environmental pollution and energy shortages, lithium-ion batteries, as one of the clean new energy sources, have been widely used in many industrial fields such as new-energy vehicles, energy storage, etc. It is necessary to predict battery characteristics under constant power conditions for their safe use, due to the potential of overheating.
Currently, the methods for battery power estimation mainly include model-based methods and machine-learning-based methods. Liu et al. [1] used a fractional equivalent circle model (ECM) to estimate the state of power (SOP) and used small-order calculus with state of charge (SOC), battery voltage, and current as constraints. It could be seen from the experiment that the maximum relative error of SOP estimation results was 1.34%. Feng et al. [2] used a novel ECM which added moving average noise to a resistor–capacitor circuit model to accurately capture battery dynamics. A recursive extended least squares algorithm was used to identify the ECM parameters online and showed high accuracy in the experiment. Waag et al. [3] proposed a nonlinear model-based method for predicting the available power in li-ion battery packs using the current dependence of the battery’s resistance. Accurate power prediction was possible at room lower temperatures and where the current dependence was larger. Pan et al. [4] proposed a multi-constraint power capacity forecasting method, which could overcome the shortcomings of three single constraints, including voltage, current, and SOC, and an extended Kalman filter algorithm was subsequently used for power state prediction. Most of the model-based methods are predicted by the ECM of the power battery, and the prediction effects of these methods depend on the model used. Guo et al. [5] experimentally studied the polarization characteristics of the battery in a series of decreasing pulse tests; constructed a feedforward neural network with inputs of SOC, discharge rate, and pulse running time, and characterized the polarization voltage by modeling the polarization resistance excited by the current; and then proposed a data-model fusion method to make accurate online SOP estimation in a prediction window of 30 s to 120 s. This machine-learning-based method had high accuracy but required a large amount of data to train the algorithm.
As the battery voltage gradually decreases with the descending of the SOC and the voltage drops sharply at the end of discharge, the battery current will gradually increase to meet the constant power output requirement. Due to the tight arrangement of the battery pack, there is a risk of thermal runaway under poor heat dissipation conditions. It is thus necessary to predict the power characteristics of the battery in advance and control the temperature of the battery pack. Current methods for heat dissipation mainly include air cooling [6], liquid cooling [7], phase-change material heat dissipation [8], heat pipe heat dissipation [9], and so on.
As there exists an unpredictable and uncertain time delay before a temperature-control system functions, a reasonable temperature-control strategy is thus essential to realizing rapid regulation of battery temperature. General battery system temperature-control strategies include: PID-based control, fuzzy-algorithm-based control, model-based predictive control, and coupling control in several ways. Cen et al. [10] used a PID algorithm to design an air-conditioning system for an electric vehicle to accomplish air circulation in the vehicle and the battery pack. Extensive experimental studies indicated that the optimized values could keep the maximum temperature difference below 2 °C at discharge rates of 0.5 C and 1 C. The control strategy was easy to implement, but its response speed was slow. Afzal et al. [11] developed a new technique for the multi-objective optimization of battery system thermal management using a hybrid genetic algorithm. Jiaqiang E. et al. [12] used the fuzzy grey relational theory and the orthogonal experimental design method to discuss the influence of the optimal forced air-cooling model parameters on the temperature-control ability of the battery module. Fuzzy-based control had strong robustness; however the required expert experience is difficult to obtain and the fuzzification of the collected information would probably lead to a decrease in accuracy. Zhu et al. [13] proposed a model-based predictive control strategy based on finite sets that could simultaneously minimize the energy consumption of cooling or heating. Model-based predictive control is suitable for the control of nonlinear and hysteretic systems, and has the capabilities of advanced prediction, time-varying online iterative optimization, and accurate output feedback correction, and its applicability is related to the accuracy of the battery model.
Currently, the commonly used models include ECM and the electrochemical model. Electrochemical models are favored by many scholars because of their high accuracy in battery state estimation at various conditions [14,15,16]. J. Newman et al. first established a pseudo-two-dimensional (P2D) model [17]. Its accuracy and versatility are good, but the calculation process is complicated and difficult to implement. Some scholars have added descriptions of temperature distribution onto the P2D model and others have proposed thermal coupling models [18,19]. The developed model could be used to optimize the design of thermal management systems and perform aging analysis [20,21,22,23,24]. It could also be used to analyze the battery’s internal heat generation and simulate the surface temperature change of different materials [25,26,27,28]. Romero-Becerril et al. [29] developed a single-particle (SP) model, which used the behavior of a single active particle to substitute for the chemical reaction behavior of the entire electrode. On the basis of the SP model, Luo Weilin et al. [30] proposed an improved SP model, which comprehensively balanced the accuracy and operation time. How to ensure simulation accuracy at a full-charge state operating range and realize rapid calculation becomes the key point in terms of characteristic prediction and temperature control.
This paper’s contribution is as follows: (1) an electrochemical-two-dimensional thermal coupling model is developed for a typical battery pack configuration, considering the differences among single cells, (2) a model-driven battery characteristic prediction algorithm is proposed to predict the voltage, current, and temperature of the battery pack under constant power conditions, and (3) two effective temperature-control strategies are proposed to keep the temperature within a certain range. The rest of this work is as follows: Section 2 introduces the battery pack modeling method and characteristic prediction method under constant power conditions for a battery pack; Section 3 introduces the experiments and verifies the accuracy of the prediction algorithm; Section 4 introduces the model-based thermal control strategy, followed by conclusions in Section 5.

2. Battery Model and Characteristic Prediction Method

2.1. Modeling for a Single Cell

The active positive and negative electrode materials of a lithium-ion battery are regarded as composed of spherical active particles. During the use of the battery, there are several physical and chemical processes: solid-phase diffusion, electrochemical reactions on particle surfaces, liquid-phase diffusion and internal heat generation, heat transfer from the interior of the battery to the outer shell, and heat dissipation on the battery surface. To simplify the calculation of the electrochemical characteristics of the battery, this work assumes that the reaction distribution at each position inside the battery is uniform. Based on Fick’s second law, the change law of solid-phase lithium-ion concentration in the direction of the radius of active battery material is established; the concentration polarization is described by parameters of Pconi, i = n,p and parameters of τe that reflect the degree of polarization and the time length of the establishment of the concentration difference, which participate in the calculation of the polarization overpotential represented by ηcon; the difficulty of the electrochemical reaction inside the battery is described by parameters of the Pact polarization coefficient and it participates in the calculation of the reaction polarization overpotential, represented by ηact; the ohmic polarization overpotential, represented by ηohm, follows Ohm’s law, and then the battery terminal voltage Uapp can be calculated from ηcon, ηact, ηohm, and the open circuit voltage, which is represented by Eocv.
To quickly predict the change of battery temperature characteristics, this work assumes that the temperature distribution inside the battery is uniform. The heat-generation rate equation can be obtained based on the Bernardi heat generation model. In this paper, the thermal resistance model is used to describe the heat exchange process between the electrode winding body and the battery shell, as well as the battery shell and the external environment. Due to the thermal anisotropy of the prismatic battery, the temperature gradient distribution exists in two directions: x and y, which are shown in Figure 1.
Change in the internal temperature affects the electrochemical reaction processes, and it will affect the model parameters for electrochemical behaviors. It is well-known that the influence of the thermal change on the parameters can be described by the Arrhenius equation. Open-circuit voltage Eocv and other overpotentials ηact and ηcon are dependent on temperature. The Nernst equation correction equation for Eocv is shown in Equation (1), where Tref is the reference temperature and is the open-circuit potential in electrochemistry:
E ocv = E ocv ref + ( T     T ref ) d E ocv d T
Detailed descriptions of simplified electrochemical-thermal coupling models have been introduced in our previous work [29]. The main numerical equations of the model are shown in Table 1.

2.2. Parameter Identification

To realize the model simulation, the model parameters needed to be obtained in advance. Except for inherent characteristic parameters such as weight and length, model parameters which appear in Table 1 needed to be obtained individually via the identification method.
There was an obvious time difference among the electrochemical processes of the battery, and the response degrees of different processes caused by the same current excitation were also different, so the decoupling of each part could be completed [30]. The current used for identification is shown in Figure 2.
The thermal parameters that needed to be determined mainly included Cp, λx, λy, Rcondx, and Rcondy. Cp, λx, and λy can be calculated according to the ratio of different components of the battery. The equivalent specific heat capacity Cp,battery can be calculated by Equation (2), where mi and cp,i are the mass and specific heat capacity of the corresponding component material. The calculation of λx and λy was performed as shown in Equation (3), where La andi are the thickness of the component material in the corresponding axial direction, and λa and iare the thermal conductivity of the corresponding component material.
C p , battery = i = 1 n C p , i m i i = 1 n m i
λ a = i = 1 n L a , i i = 1 n ( L a , i / λ a , i ) ,   a = x ,   y
Rcondx and Rcondy were used to characterize the heat transferred from the inside to the outside in two directions, respectively. They can be obtained iteratively through Equation (4). The initial values of Rcondx and Rcondy are 0.01.
R condx = T k + 1 T surfx k T surfx k + 1 T surfx k m can C can Δ t + V h x l y ( T surfx k T a ) ,   R condy   = T k + 1 T surfy k T surfy k + 1 T surfy k m can C can Δ t + V h y l x ( T surfy k T a )

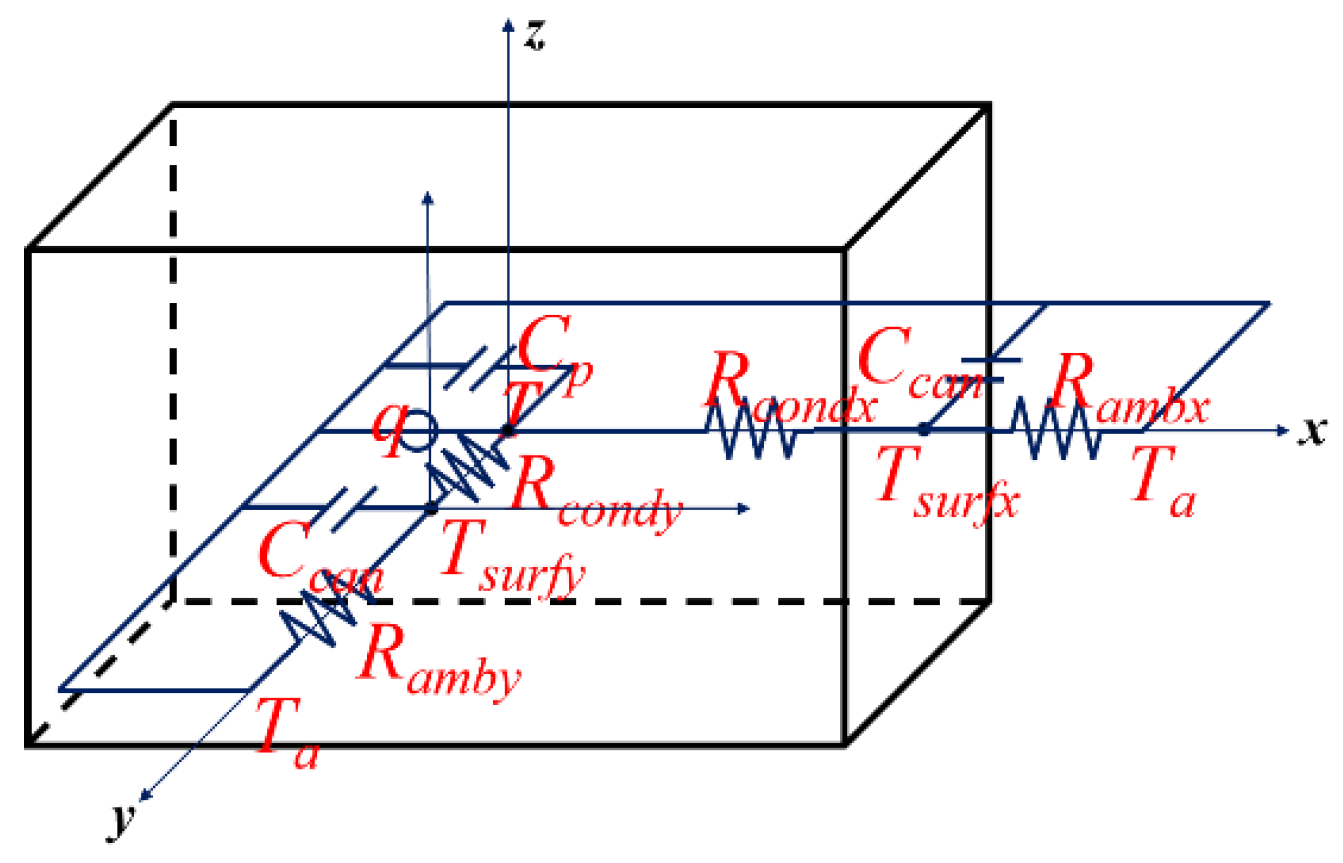
2.3. Modeling a Battery Pack

Taking a three-series battery-pack structure as the modeling object, the electrical connection and the thermal connection of each single lithium-ion battery in the battery pack were studied. The series of functional modules is shown in Figure 3.
The electrochemical reactions of the cells are independent of each other; the external characteristic behaviors of the battery pack can be regarded as the linear superposition of the cells connected in series, as shown in Equation (5), where Uapp, i, and i = total, 1,2,3 are the total voltage of the battery pack and each cell, and Ii and i = total, 1,2,3 are the total current and the current of each cell. The behaviors of the external characteristics of the cell were determined by the model parameters, and the corresponding model parameter sets of different cells are also different. The parameter acquisition of each cell was the same as described above.
U app , total = U app , 1 + U app , 2 + U app , 3 ,   I total = I 1 = I 2 = I 3
The multi-physics model of the battery pack uses a thermal resistance network method to establish the thermal connection between the cells, assuming that the temperature fields inside the cells are independent of each other and the thermal connection between the cells is established through the thermal gap between the cells. The thermal resistance network diagram of the battery pack is shown in Figure 4. In the process of battery grouping, the batteries are assembled by bonding their larger surfaces with the purpose of improving space utilization. Gap in Figure 4 is the air interstice inside the battery pack.
The symmetrical end faces have the same heat transfer coefficient for a single cell. For a pack as in Figure 4, the heat transfer coefficients h of the inner and outer faces for cell 1 and cell 3 are different, while the h of the two inner faces for cell 2 remains identical. Calculation of the internal temperatures of cell 1 and cell 2 is shown in Equation (6), where ( T surfx , L k + T surfx , R k ) / 2 represents the ambient temperature of the gap.
T 1 k + 1 = T 1 k + Δ t m cell , 1 C p , 1 ( Q ˙ 1 1 R condx , 1 + 8 V λ x , 1 l x 2 ( T 1 k ( T surfx , L 1 k + T surfx , R 1 k ) / 2 ) ( 1 R condy , 1 + 8 V λ y , 1 l y 2 ) ( T 1 k T surfy , 1 k ) ) T 3 k + 1 = T 3 k + Δ t m cell , 3 C p , 3 ( Q ˙ 3 1 R condx , 3 + 8 V λ x , 3 l x 2 ( T 3 k ( T surfx , L 3 k + T surfx , R 3 k ) / 2 ) ( 1 R condy , 3 + 8 V λ y , 3 l y 2 ) ( T 3 k T surfy , 3 k ) )
Obviously, cell 1 and cell 3, as the two outermost cells of the battery pack, have different heat transfer coefficients on the outer and inner end faces. The heat transfer coefficient of the inner end gap decreases with the thinness of the gap space, and hd represents the heat transfer coefficient of the gap. Since the internal temperature fields of the cells are assumed to be independent of each other, the establishment of the thermal connection is based on the heat exchange between the shell temperature and the gap of each cell. Therefore, the difference in the group arrangement position of the different cells can be indirectly characterized by the difference in the heat transfer coefficient.
The assumptions of the thermal model are shown in Table 2.

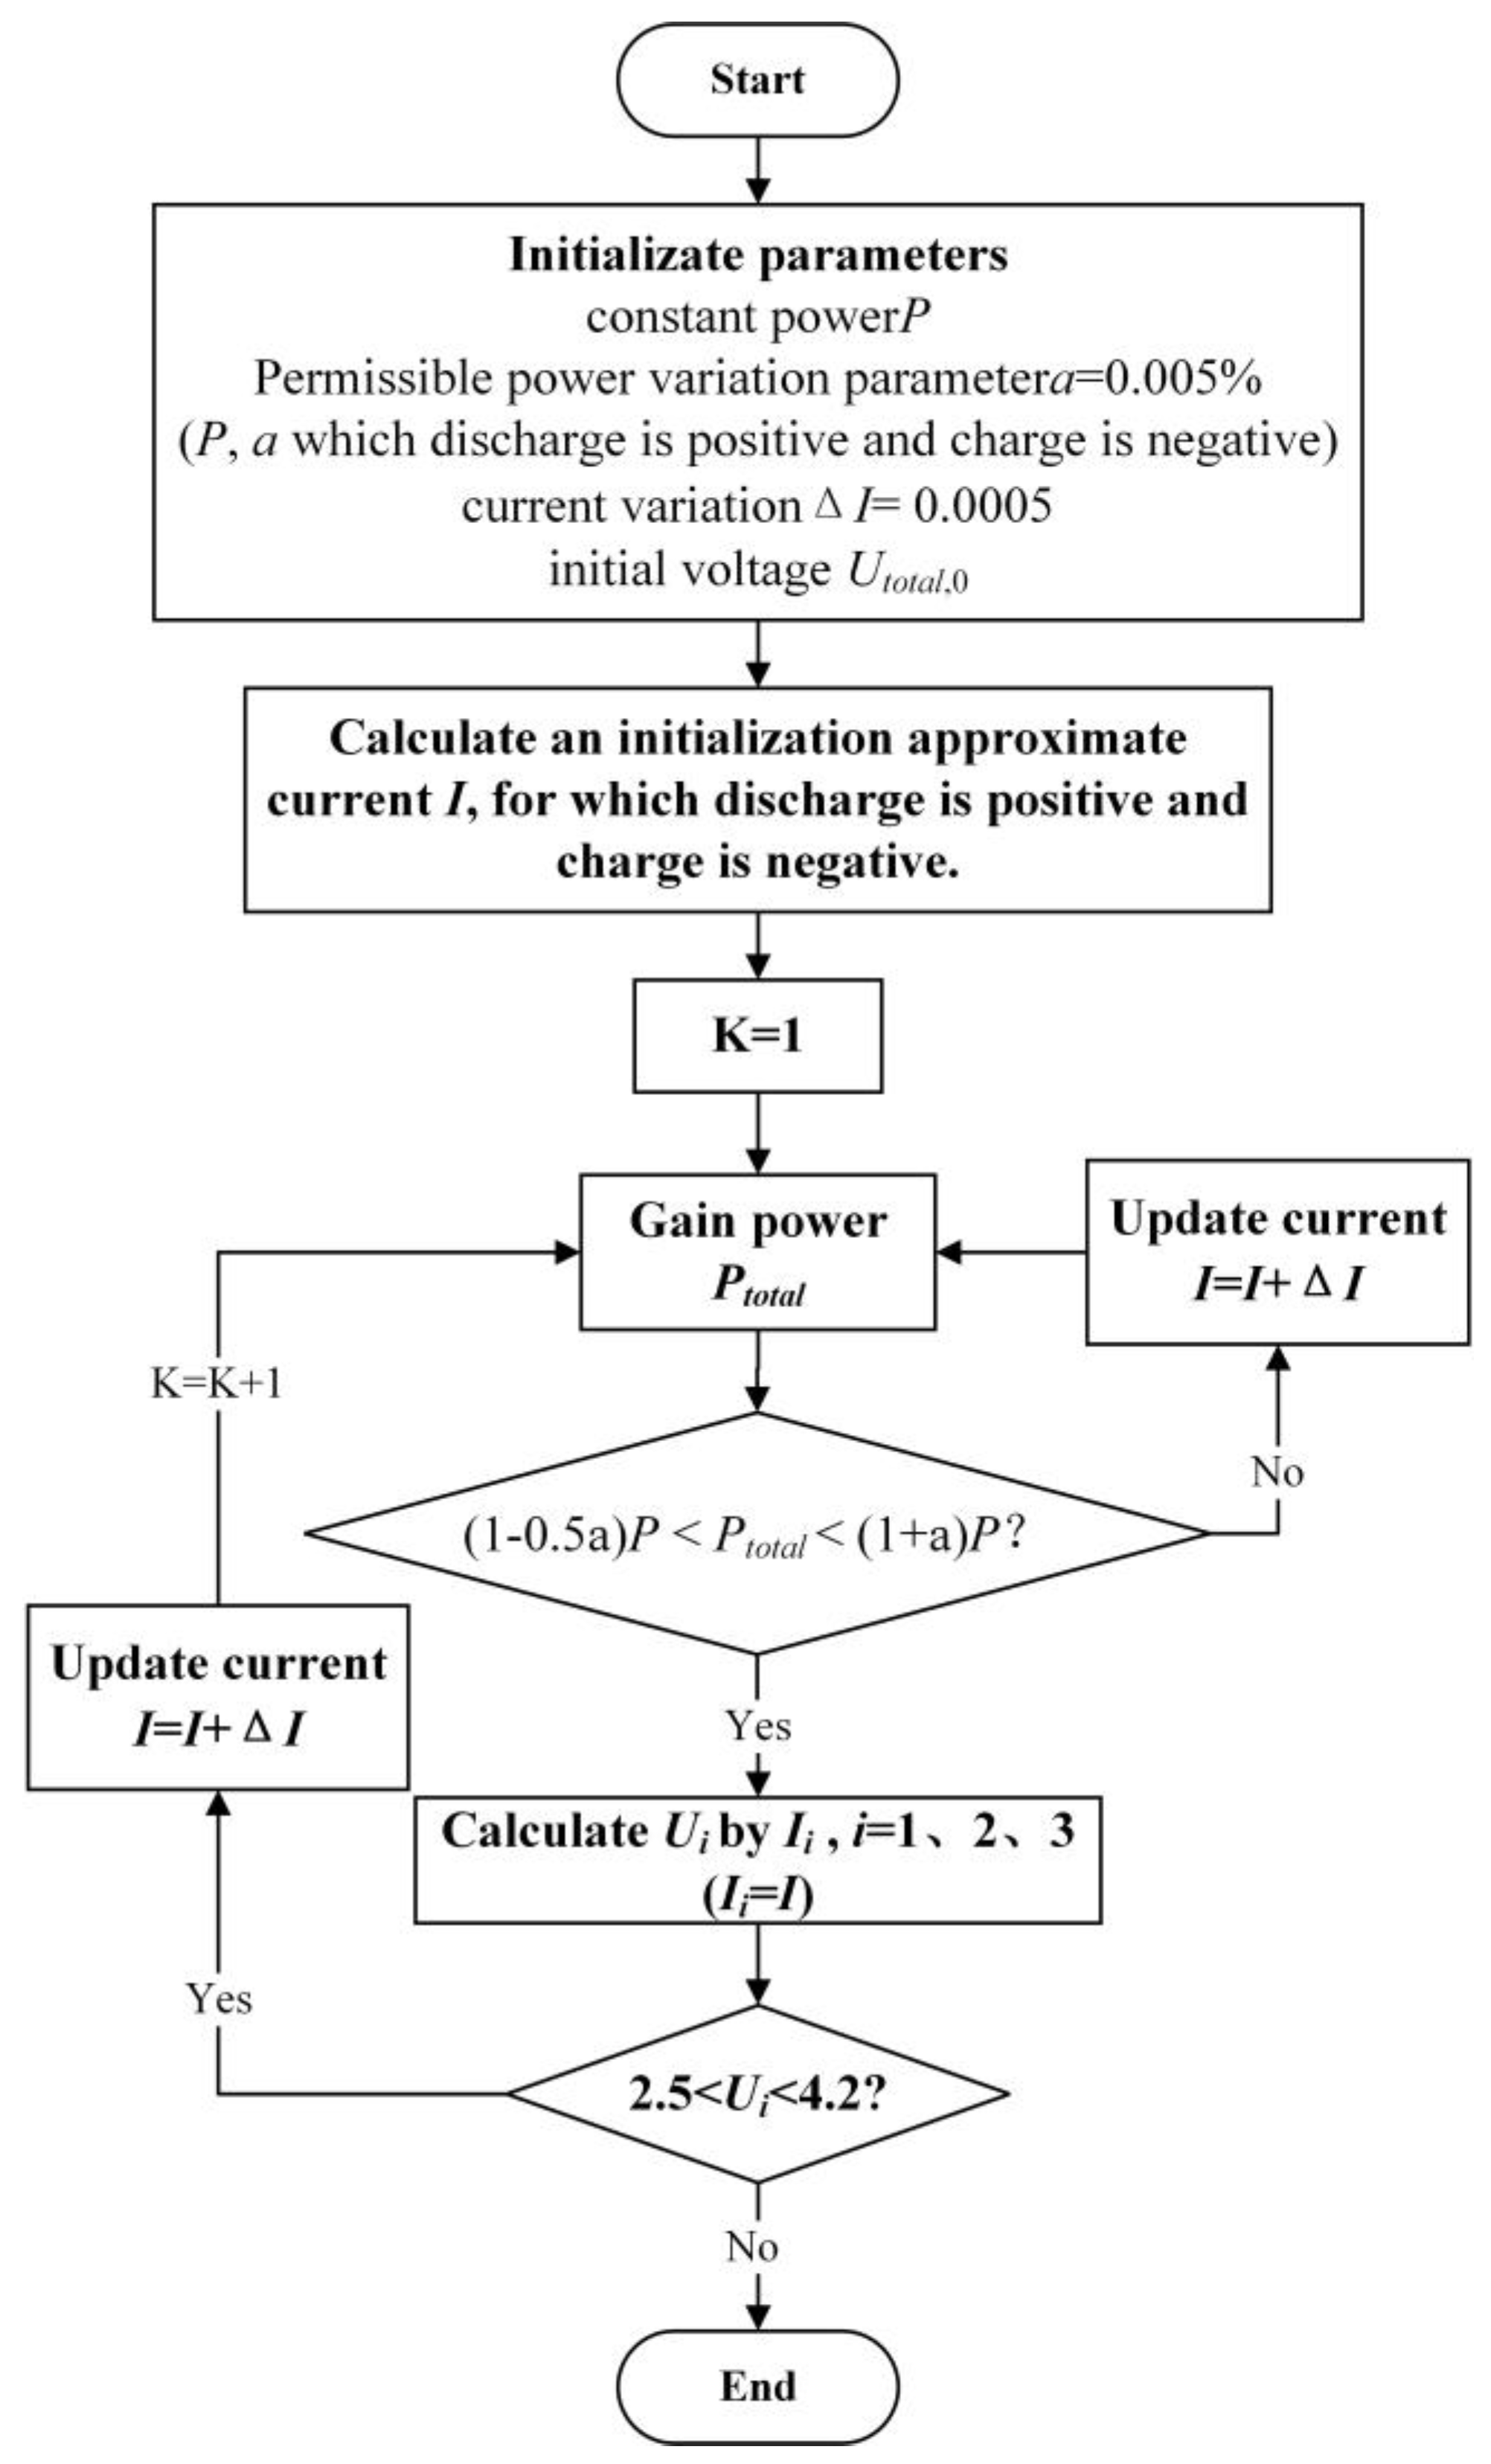
2.4. Characteristic Prediction under Constant Power Conditions
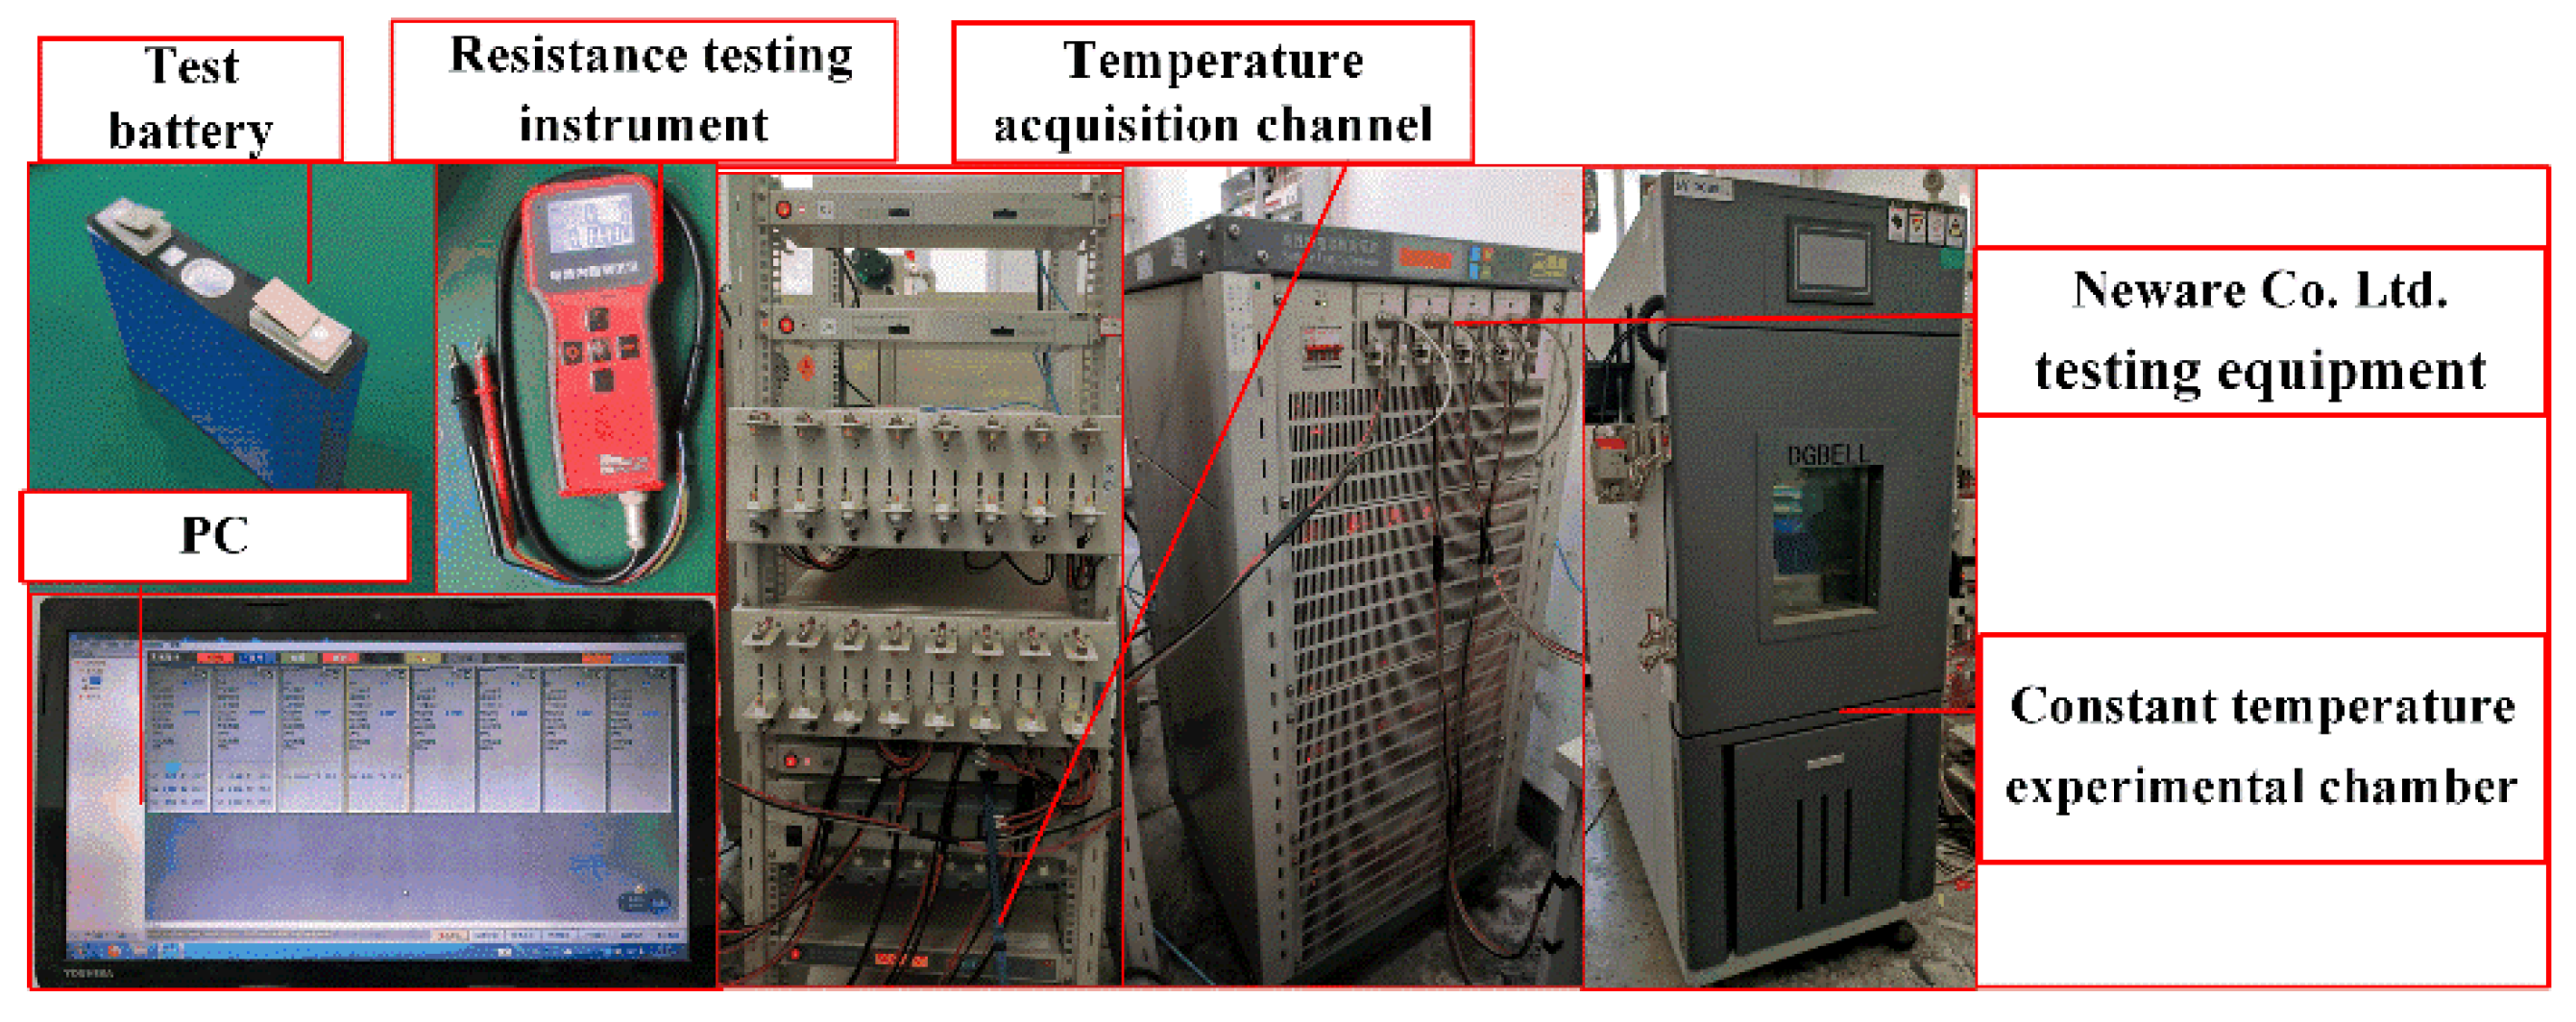
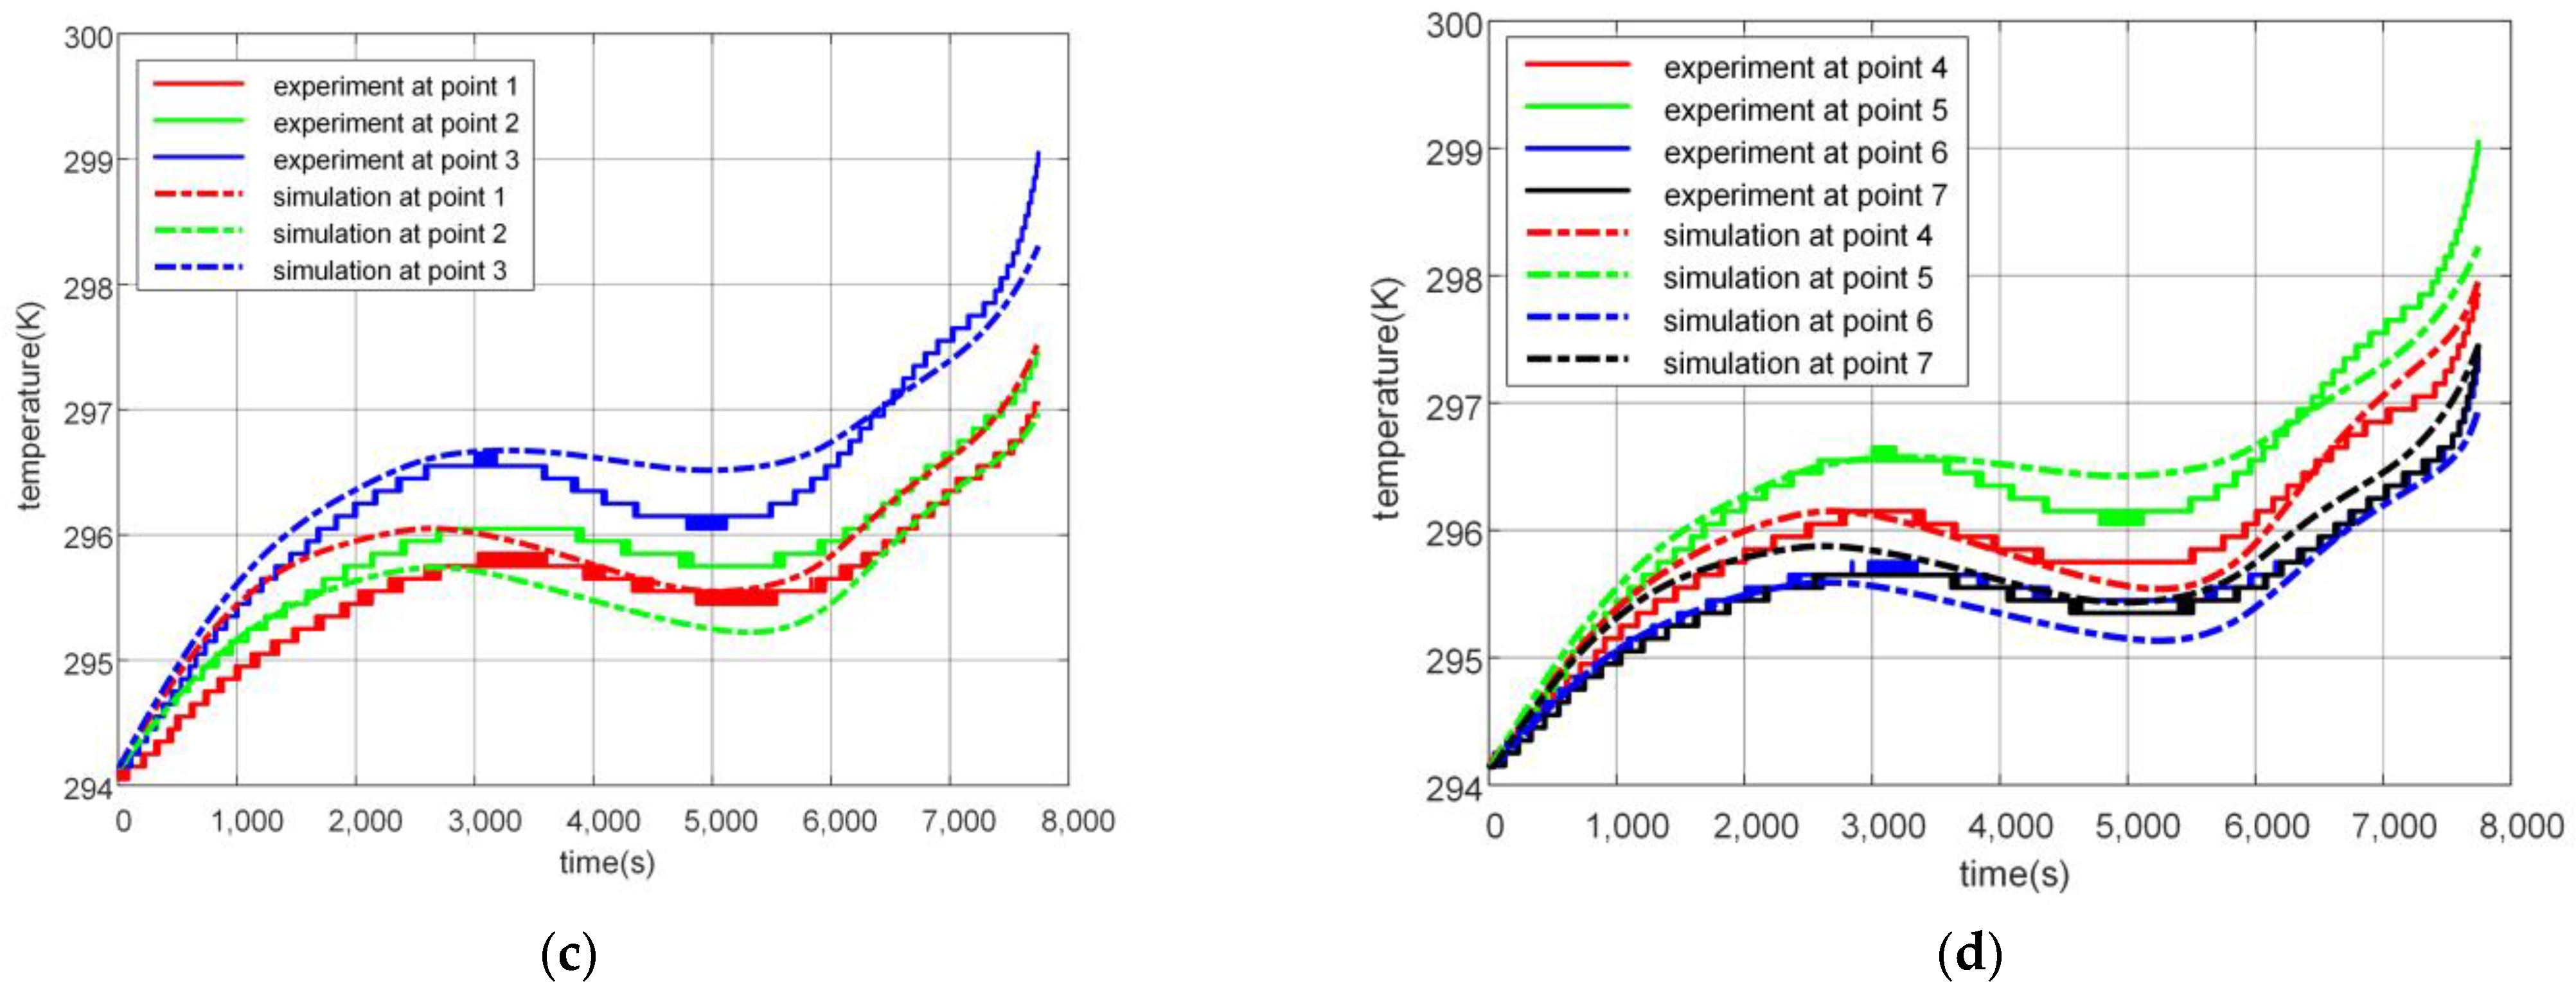
Equation (7) can be used to calculate the power of the battery pack, where Ptotal is the power of the battery pack:
P total = U total I total
A current iterative solution method was used to simulate battery characteristic performance when a cell is discharging at constant power. The processes of the prediction algorithm are shown in Figure 5.
As shown in Figure 5, the parameters were first initialized, including constant power, initial voltage, current variations, and allowable error value of power output; secondly, initial approximate current was determined by Equation (8), where I is the initial approximate current, P is the set constant power value, and Utotal,0 is the initial terminal voltage; thirdly, the battery power and current were calculated repeatedly until the error was within the allowable range; finally, if the voltage of any cell exceeded the upper and lower cut-off voltage, the above processes ended.
I = P / U total , 0

3. Experiment

In this paper, MATLAB and Python were used for calculation and simulation. The data collection of terminal voltage, current, and temperature was achieved using equipment from Neware Co. Ltd., and the environmental temperature was controlled by a thermal chamber provided by Dongguan Bell Experiment Equipment Co., Ltd. During the testing processes, the above data were acquired synchronously. Note that the measurement errors of the equipment were 0.1 mV, 0.1 mA, and 0.1 K, respectively. A prismatic battery with a rated capacity of 42 Ah was selected as the research object. The specifications of this battery are shown in Figure 6 and Table 3. Table 4 and Figure 7 show the battery parameters. As shown in Figure 7, there is a gap between the two directions of Rcond, which is determined by the different properties of the two directions of the battery.
To verify simulation accuracy, a 20 A constant-current discharge experiment was conducted at a constant temperature of 293.15 K, and the connection mode and temperature acquisition points are shown in Figure 8.
The comparison of terminal voltage and temperature is shown in Figure 9. The mean absolute errors are shown in Table 5.
It can be concluded from Figure 9 that the temperature rise fluctuated noticeably in the middle period of discharge (about 3000 s–6000 s), and errors between the simulation and experiment are larger. During the whole discharge process, the temperature curves of cell 1 and cell 3 were slightly different, and cell 2 is obviously different from the others, which is because cell 1 and cell 3 were fresh batteries, and cell 2 was an aged battery used for many tests. Because these batteries had different historical usage times, different health conditions, and different capacities, for the same charging and discharging conditions the heat production of the battery was naturally different. In addition, due to their arrangement positions, the heat dissipation condition of cell 2 was not as good as the others—the temperature rise was larger. In the x direction, which is shown in Figure 4, cell 1 and cell 3 were symmetrically distributed in the arrangement structure, and the temperature rise was nearly the same. The temperature difference between shells at the middle and the end of the discharge (after 3000 s) is in contact with the gap which is shown in Figure 4. The results of comparing the accuracy of this model with other simulations are shown in Table 6. It can be seen from Table 6 that the accuracy of the model simulations has been further developed.
Results of the comparison of measurements and predictions under constant power conditions of 120 W and 135 W are shown in Figure 10. Due to the intrinsic error of the experimental equipment, the power of the experimental equipment is greater than the expected value. The comparison of voltage and current at constant power discharge between the prediction and the experiment is shown in Figure 11. The predicted and simulated discharge times are shown in Table 7.
As shown in Figure 11, when discharging at constant power, the voltage decreased, and then the current needed to increase to keep the power constant. Therefore, there was a short-term output of considerable current for the discharge terminal under constant power conditions. It can be concluded from Figure 11 that the current should increase by about 7 A. In addition, when the required power increased, the voltage decreased faster and the current increased faster compared to lower power conditions. With the increasing current, the temperature increased. The maximum temperature changes under several constant power conditions can be found in Figure 12 and specific maximum temperature rise values are shown in Table 8. It can be seen that the temperature rose rapidly at the end of discharge and the maximum temperature rise values increased with the increase in power. So, in order to ensure the safety of the batteries and prevent the temperature from getting out of control, the temperature rise needs to be controlled within a certain threshold.

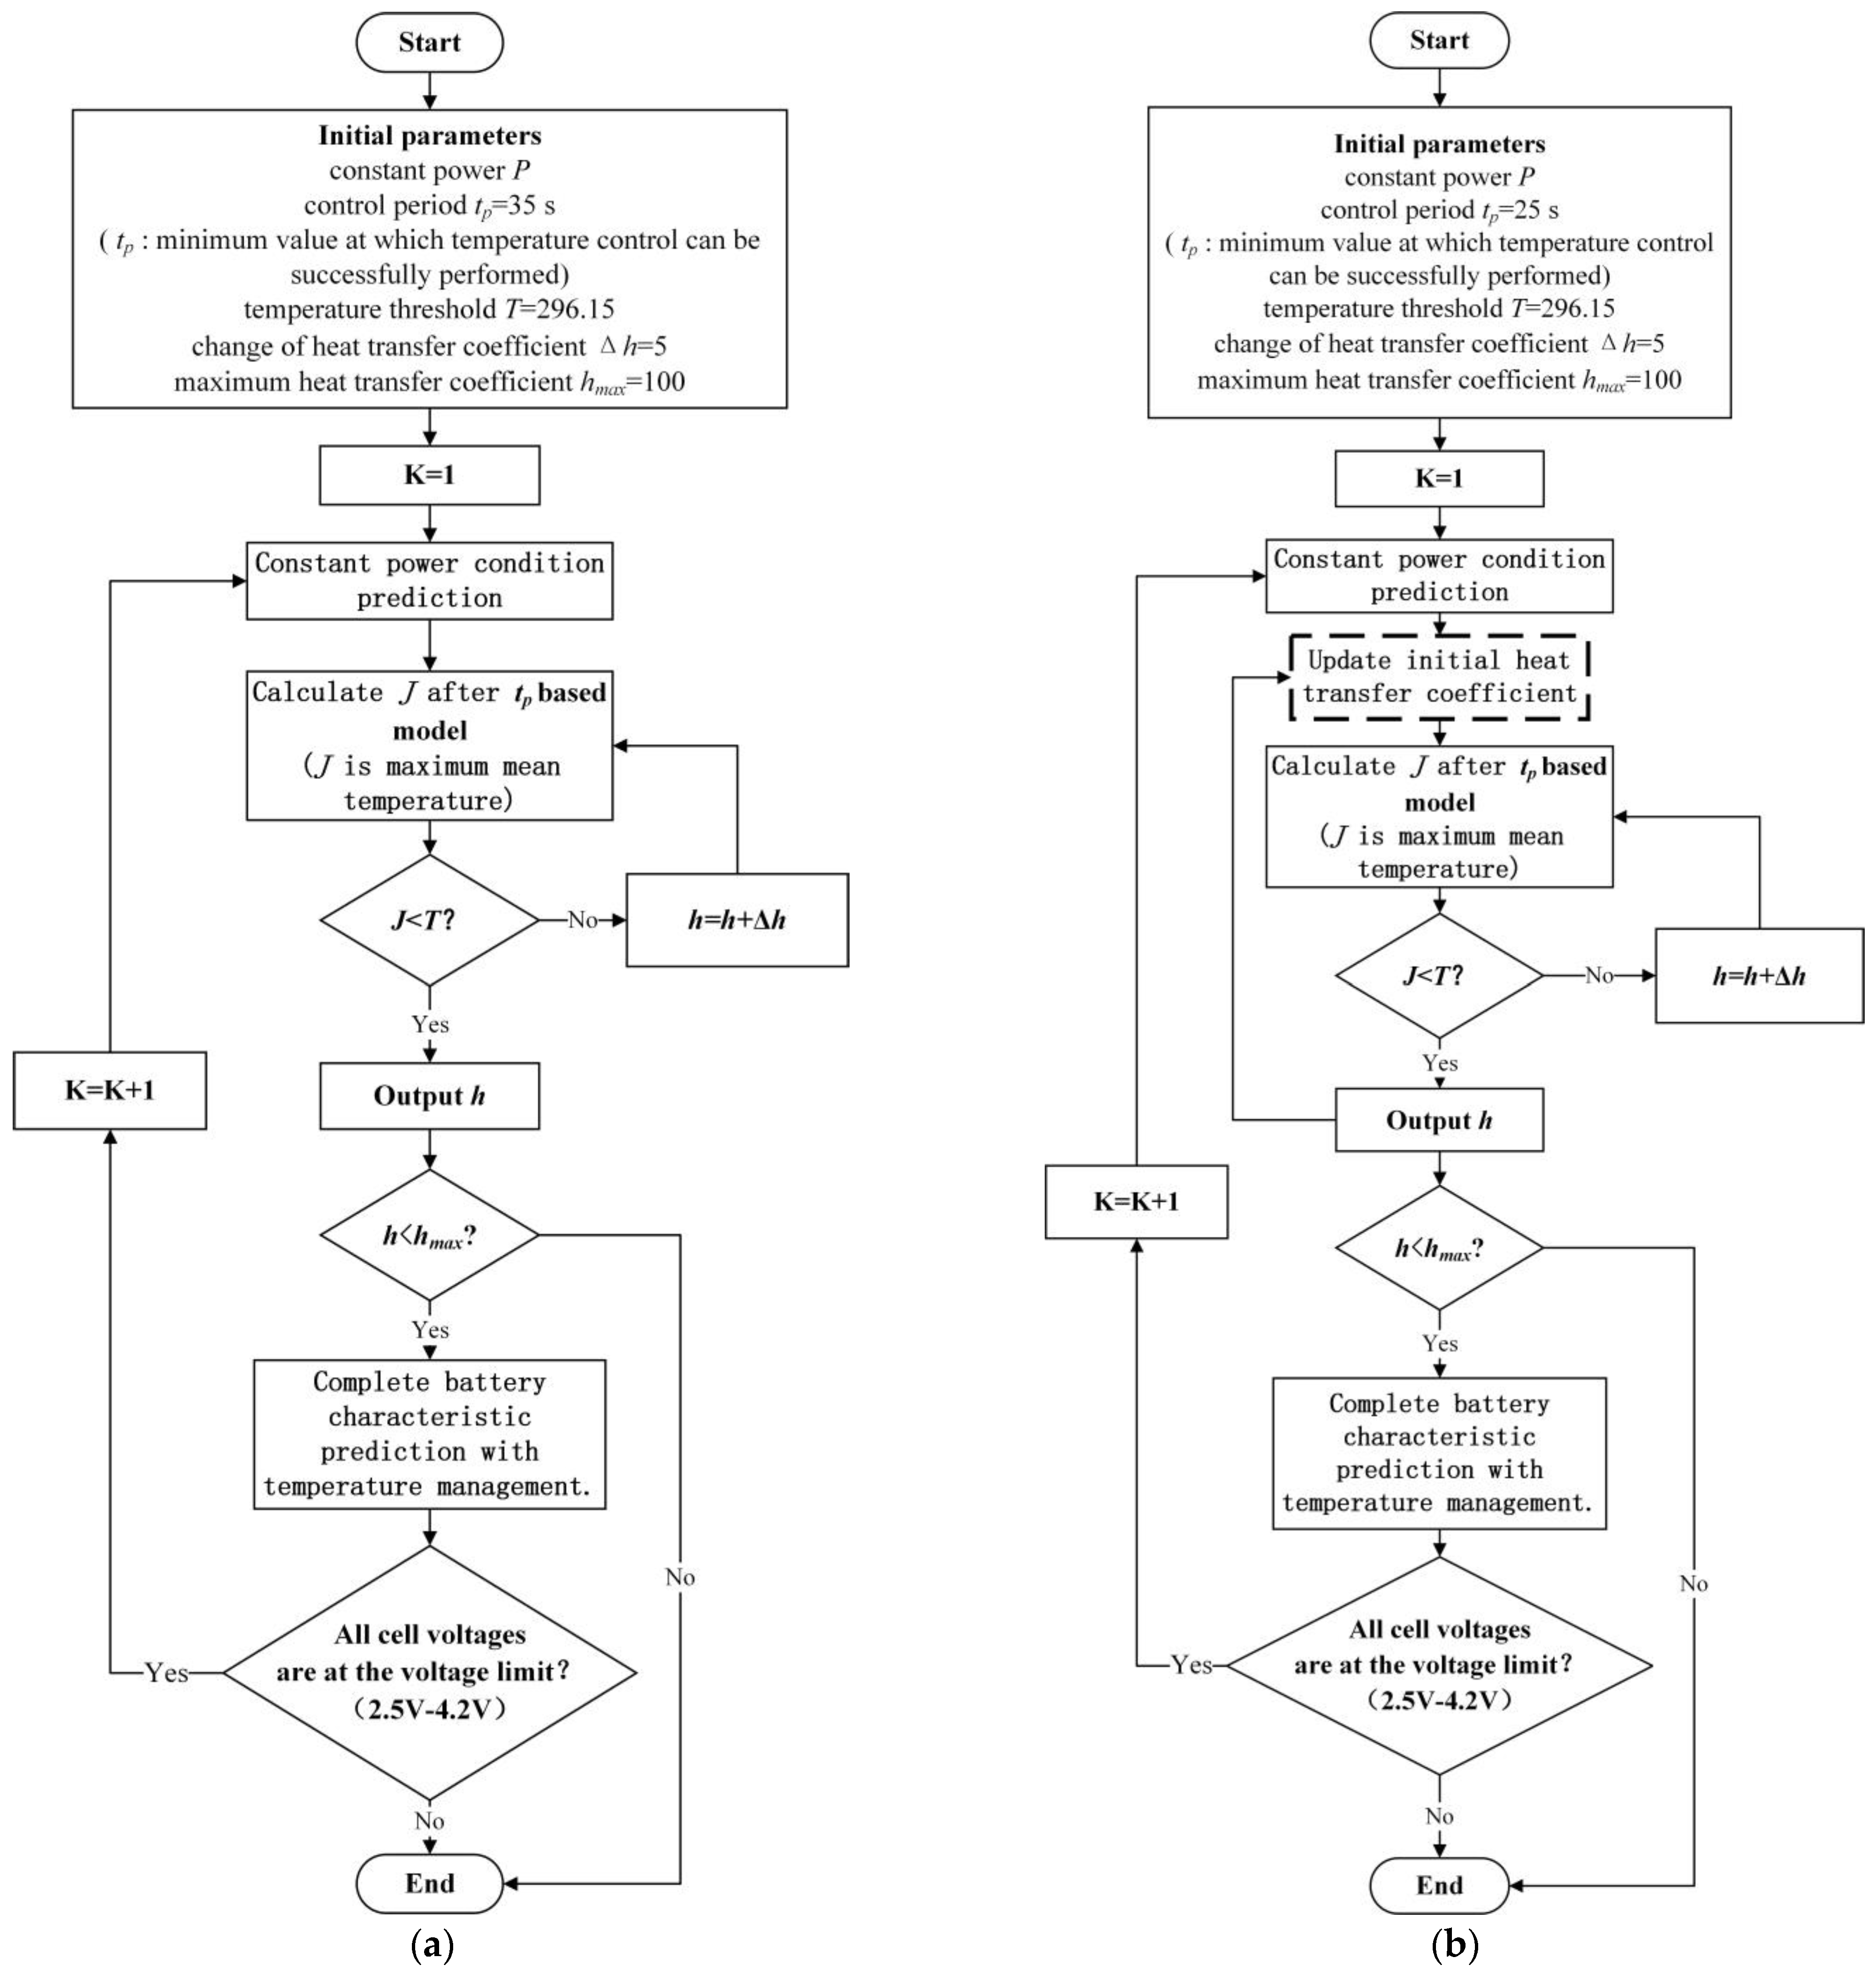
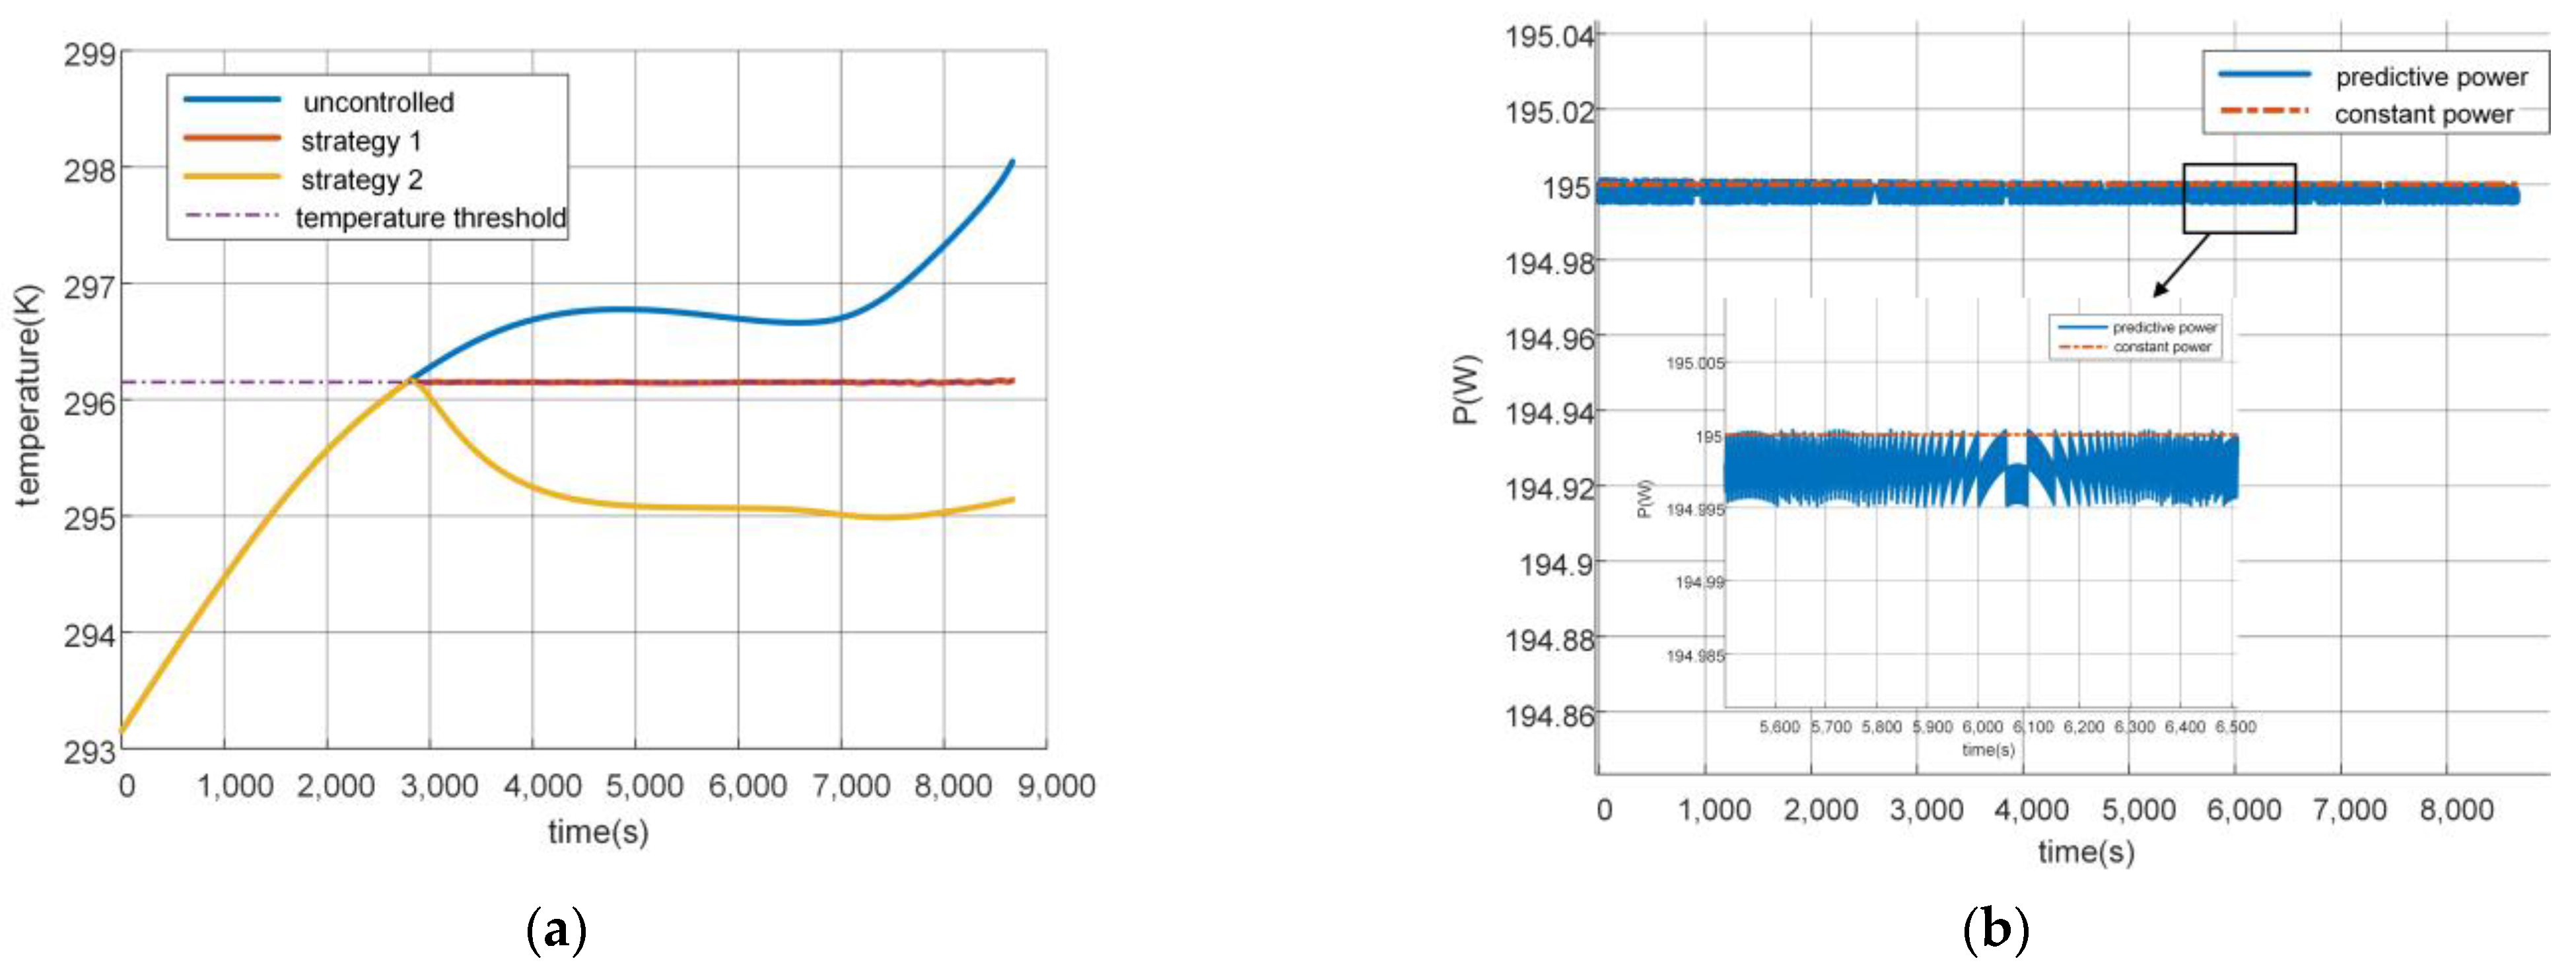
4. Temperature-Control Strategies

The basic idea of a cooling method is to change the surface h and further reduce the battery temperature. Without discussing the specific cooling methods, this work developed a temperature-control strategy to keep battery temperature within a certain threshold on the basis of model prediction. According to the specific scale of the battery pack, the maximum h was considered to be 100 (W m−2 K−1) with reference to the air-cooling mode. Based on the above model, with the purpose of reducing the cooling cost or shortening the predicted consumption time, two temperature-control strategies were proposed to change the heat transfer coefficient (h) by iterative solution according to the predicted temperature. Two brief flow charts of these methods are shown in Figure 13, with the variable search noted by dotted lines.
A larger required h means more work needs to be performed by the cooling system and takes heat away from the battery, which will increase the cost. Thus, it is necessary to properly adjust the cooling system to obtain a suitable h. As for the strategy of using a constant search range for h, at each iterative calculation, h is searched in a constant large search range to obtain the most suitable h. As shown in Figure 13a, battery temperature is first predicted after a certain interval time of tp, which is defined as the period of model-based temperature prediction. If the predicted temperature reaches the threshold, it is necessary to adjust the temperature-control means at this time, such as increasing the coolant flow rate for an air-cooled system or the wind speed for a liquid-cooled system. If the obtained h exceeds the upper limit assumed in advance, it is assumed that the system cannot meet the cooling requirements, and the batteries will be forced to stop discharging.
To reduce the calculation cost of the developed strategy and increase the system’s rapid-response capability, an optimal h is supposed to be selected at a variable search range. As shown in Figure 13b, the initial lower limit h in each iteration process is replaced by an h obtained in the previous process, which can reduce the search range, and the tp of this strategy is thus smaller, which can reduce the time to obtain the maximum mean temperature. The maximum temperature of the battery pack is the internal temperature of cell 2, which can be seen for the simulation and the experiment in Figure 9. To sum up, Strategy 1 can obtain a more suitable heat transfer coefficient and cost less, and Strategy 2 needs shorter calculational time and has a steadier heat transfer coefficient.
The control temperature threshold in this work was selected as 296.15 K. The maximum temperature variation curves at different constant powers of 165 W, 180 W, and 195 W are shown in Figure 14a, Figure 15a and Figure 16a, and figures that can be used to prove that the battery was discharged at constant power during temperature-control are shown in Figure 14b, Figure 15b and Figure 16b, as well as the simulation time for the two strategies shown in Table 9. It should be noted that the simulation time shown in Table 9 is the consumption time of each iterative computation for temperature control.
Taking the control strategy at constant 165 W power for example, variation results of the required h for temperature-control with the two control strategies are shown in Figure 17. The battery temperature was controlled with an increasing h when it reached the threshold at about 4500 s, which could be seen from the variations in battery temperature in Figure 14a. Different control effectiveness can be observed with these two control strategies: (1) the amplitude of h in Strategy 1 was smaller than that of Strategy 2, because Strategy 1 had a longer control period of tp; (2) when the battery temperature was effectively controlled, the heat transfer coefficient of Strategy 1 decreased compared with an unchanged value in Strategy 2. In addition, when the temperature was controlled in a certain control period near the end of discharge in Strategy 1, the temperature of the battery soon reached the threshold again because of the obvious temperature rise. In order to achieve the temperature-control effect, Strategy 1 had to increase the heat transfer coefficient, thus resulting in a fluctuated h within a large range.

5. Conclusions

In this work, the heterogeneity of a battery pack of three cells connected in series was characterized using an electrochemical-thermal coupling model. The simulation accuracy of terminal voltage and temperature was verified at discharge as a 20 A constant-current load. Validations showed that the average absolute errors of battery terminal voltage and temperature were less than 36 mV and 0.4 K, respectively. Based on the model, an iterative solution method was used to predict the characteristics under constant-power conditions. Experimental verification showed that the power error was below 0.005%, and the discharge time deviation was within 30 s. Two temperature-control strategies were developed with the battery characteristic prediction method, and the effectiveness of the two methods was proven by simulation. A temperature-control strategy based on variable search range of heat transfer coefficient needs a shorter calculational time, while a temperature-control strategy based on constant search range of heat transfer coefficient costs less.

Author Contributions

Writing—original draft, J.L. and S.X.; methodology, J.L. and S.X.; Funding acquisition, J.L. and Z.W.; supervision, C.D.; writing—review & editing, C.D.; software, M.Z. All authors have read and agreed to the published version of the manuscript.

Funding

This research was funded by [China Postdoctoral Science Foundation] grant number [2021M690740]; this research was funded by [Gradient utilization and industrialization demonstration of lithium-ion power battery] grant number [ZH01110405180053PWC].

Institutional Review Board Statement

Not applicable.

Informed Consent Statement

Not applicable.

Conflicts of Interest

The authors declare no conflict of interest.

Nomenclature

Δ x 1 intermediate variable of Δ x (-)
Δ y deviations between ysurf and yavg (-)
Δ y 1 intermediate variable of Δ y (-)
τi, i = n, psolid-phase diffusion time constant of electrodes (s)
τeliquid-phase diffusion time constant (s)
ηactreaction polarization overpotential (V)
ηconconcentration polarization overpotential (V)
ηohmohmic polarization overpotential (V)
dEocv/dTentropy coefficient of the battery material (-)
Vbattery volume (m3)
lxbattery length (m)
lybattery width respectively (m)
mrollmass of the electrode winding body (kg)
Δttime step (s)
hi, i = x,yx, y dimension heat exchange coefficient (W m−2K−1)
Rcondi, i = x, yinternal thermal resistance of the battery in two directions (K W−1)
Rambthermal resistance between the battery shell and the environment (K W−1)
Cpequivalent specific heat capacity of the battery (J kg−1K−1)
λi, i = x, ytwo-direction equivalent thermal conductivity of the battery (W m−1K−1)
Taenvironment temperature (K)
Tsurfi, i = x, y shell temperature in two directions (K)
kdiscrete step number
Icurrent (A)
c 0 initial electrolyte concentration (mol m–3)
Eocvopen-circuit voltage, OCV (V)
FFaraday constant (C mol–1)
Pactcoefficient of anode reaction polarization (m–1.5 mol0.5 s)
Pconi,i = p, npositive and negative proportional coefficient of liquid-phase diffusion (mol m–3 A–1)
Qi, i = n, pcapacities of effective active material in the electrodes (A s)
Rideal gas constant (J mol–1 K–1)
Rohmohmic resistance (Ω)
Tbattery internal temperature (K)
t+transport number (-)
Uappterminal voltage for single cell (V)
x0initial stoichiometric number of the negative electrode (-)
xavgsolid-phase average stoichiometric number of the negative electrode (-)
xsurfsolid-phase surface stoichiometric number of the negative electrode (-)
y0initial stoichiometric number of the positive electrode (-)
yavgsolid-phase average stoichiometric number of the positive electrode (-)
ysurfsolid-phase surface stoichiometric number of the positive electrode (-)
Δ c i ,   i = p ,   n change of electrolyte concentration in positive and negative current collectors (mol m–3)
Δ x   deviations between xsurf and xavg (-)

References

  1. Liu, C.H.; Hu, M.H.; Jin, G.Q.; Xu, Y.D.; Zhai, J. State of power estimation of lithium-ion battery based on fractional-order equivalent circuit model. J. Energy Storage 2021, 41, 102954. [Google Scholar] [CrossRef]
  2. Feng, T.H.; Yang, L.; Zhao, X.W.; Zhang, H.D.; Qiang, J.X. Online identification of lithium-ion battery parameters based on an improved equivalent-circuit model and its implementation on battery state-of-power prediction. J. Power Sources 2015, 281, 192–203. [Google Scholar] [CrossRef]
  3. Waag, W.; Fleische, C.; Sauer, D.U. Adaptive on-line prediction of the available power of lithium-ion batteries. J. Power Sources 2013, 242, 548–559. [Google Scholar] [CrossRef]
  4. Pan, R.; Wang, Y.J.; Zhang, X.; Yang, D.; Chen, Z.H. Power capability prediction for lithium-ion batteries based on multiple constraints analysis. Electrochim. Acta 2017, 238, 120–133. [Google Scholar] [CrossRef]
  5. Guo, R.H.; Shen, W.X. A data-model fusion method for online state of power estimation of lithium-ion batteries at high discharge rate in electric vehicles. Energy 2022, 254, 124270. [Google Scholar] [CrossRef]
  6. Wang, H.M.; Li, H.Q.; Ji, Z.Y.; Yang, Z.; Jiang, C.L.; Lin, H. Cooling the electrode tabs with air to manage the heat transferred through the collectors in traction battery. J. Energy Storage 2022, 48, 103982. [Google Scholar] [CrossRef]
  7. Xie, J.K.; Wang, Y.; He, S.M.; Zhang, G.Q.; Liu, X.Y.; Yang, X.Q. A simple cooling structure with precisely-tailored liquid cooling plate for thermal management of large battery module. Appl. Therm. Eng. 2022, 212, 118575. [Google Scholar] [CrossRef]
  8. Ajour, M.N.; Milyani, A.H.; Abu-Hamdeh, N.H.; Karimipour, A. Thermal management of a lithium ion battery pack connected to a solar panel using a comparison of two cavities filled with phase change materials: Oval and rectangular. J. Energy Storage 2022, 52, 105061. [Google Scholar] [CrossRef]
  9. Xie, Y.; Li, H.H.; Zhang, Y.J.; Xu, Y.D.; Fowler, M.; Tran, M.K.; Zhang, X.; Chen, B.; Deng, S.S. Improving thermal performance of battery at high current rate by using embedded heat pipe system. J. Energy Storage 2022, 46, 103809. [Google Scholar] [CrossRef]
  10. Cen, J.W.; Jiang, F.M. Li-ion power battery temperature control by a battery thermal management and vehicle cabin air conditioning integrated system. Energy Sustain. Dev. 2020, 57, 141–148. [Google Scholar] [CrossRef]
  11. Afzal, A.; Ramis, M.K. Multi-objective optimization of thermal performance in battery system using genetic and particle swarm algorithm combined with fuzzy logics. J. Energy Storage 2020, 32, 101815. [Google Scholar] [CrossRef]
  12. Jiaqiang, E.; Zeng, Y.; Jin, Y.; Zhang, B.; Huang, Z.H.; Wei, K.X.; Chen, J.W.; Zhu, H.; Deng, Y.W. Heat dissipation investigation of the power lithium-ion battery module based on orthogonal experiment design and fuzzy grey relation analysis. Energy 2020, 211, 118596. [Google Scholar]
  13. Yin, Y.L.; Choe, S.Y. Actively temperature controlled health-aware fast charging method for lithium-ion battery using nonlinear model predictive control. Appl. Energy 2020, 271, 115232. [Google Scholar] [CrossRef]
  14. Pang, H.; Mou, L.J.; Guo, L.; Zhang, F.Q. Parameter identification and systematic validation of an enhanced single-particle model with aging degradation physics for Li-ion batteries. Electrochim. Acta 2019, 307, 474–487. [Google Scholar] [CrossRef]
  15. Wu, L.X.; Pang, H.; Geng, Y.F.; Liu, X.F.; Liu, J.H.; Liu, K. Low-complexity state of charge and anode potential prediction for lithium-ion batteries using a simplified electrochemical model-based observer under variable load condition. Int. J. Energy Res. 2022, 46, 11834–11848. [Google Scholar] [CrossRef]
  16. Bi, Y.; Choe, S. An adaptive sigma-point Kalman filter with state equality constraints for online state-of-charge estimation of a Li(NiMnCo)O2/Carbon battery using a reduced-order electrochemical model. Appl. Energy 2020, 258, 113925. [Google Scholar] [CrossRef]
  17. Doyle, M.; Fuller, T.F.; Newman, J. Modeling of galvanostatic charge and discharge of the lithium/polymer/insertion cell. J. Electrochem. Soc. 1993, 140, 1526–1533. [Google Scholar] [CrossRef]
  18. Kumaresan, K.; Sikha, G.; White, R.E. Thermal Model for a Li-Ion Cell. J. Electrochem. Soc. 2008, 155, A164–A171. [Google Scholar] [CrossRef]
  19. Xu, M.; Zhang, Z.Q.; Wang, X.; Jia, L.; Yang, L.J. Two-dimensional electrochemical–thermal coupled modeling of cylindrical LiFePO4 batteries. J. Power Sources 2014, 256, 233–243. [Google Scholar] [CrossRef]
  20. Viswanathan, V.V.; Choi, D.; Wang, D.H.; Xu, W.; Towne, S.; Williford, R.E.; Zhang, J.; Liu, J.; Yang, Z.G. Effect of entropy change of lithium intercalation in cathodes and anodes on Li-ion battery thermal management. J. Power Sources 2010, 195, 3720–3729. [Google Scholar] [CrossRef]
  21. Yang, T.R.; Yang, N.X.; Zhang, X.W.; Li, G.J. Investigation of the thermal performance of axial-flow air cooling for the lithium-ion battery pack. Int. J. Therm. Sci. 2016, 108, 132–144. [Google Scholar] [CrossRef]
  22. Somasundaram, K.; Birgersson, E.; Mujumdar, A.S. Thermal–electrochemical model for passive thermal management of a spiral-wound lithium-ion battery. J. Power Sources 2012, 203, 84–96. [Google Scholar] [CrossRef]
  23. Basu, S.; Hariharan, K.S.; Kolake, S.M.; Song, T.; Sohn, D.K.; Yeo, T. Coupled electrochemical thermal modelling of a novel Li-ion battery pack thermal management system. Appl. Energy 2016, 181, 1–13. [Google Scholar] [CrossRef]
  24. Saw, L.H.; Ye, Y.H.; Tay, A.A.O. Electrochemical–thermal analysis of 18650 Lithium Iron Phosphate cell. Energy Convers. Manag. 2013, 75, 162–174. [Google Scholar] [CrossRef]
  25. Jiang, F.M.; Peng, P.; Sun, Y.Q. Thermal analyses of LiFePO4/graphite battery discharge processes. J. Power Sources 2013, 243, 181–194. [Google Scholar] [CrossRef]
  26. Vazquez-Arenas, J.; Gimenez, L.E.; Fowler, M.; Han, T.; Chen, S. A rapid estimation and sensitivity analysis of parameters describing the behavior of commercial Li-ion batteries including thermal analysis. Energy Convers. Manag. 2014, 87, 472–482. [Google Scholar] [CrossRef]
  27. Romero-Becerril, A.; Alvarez-Icaza, L. Comparison of discretization methods applied to the single-particle model of lithium-ion batteries. J. Power Sources 2011, 196, 10267–10279. [Google Scholar] [CrossRef]
  28. Luo, W.L.; Lyu, C.; Wang, L.X.; Zhang, L.Q. A new extension of physics-based single particle model for higher charge–discharge rates. J. Power Sources 2013, 241, 295–310. [Google Scholar] [CrossRef]
  29. Xu, S.C.; Wang, Y.H.; Shao, J.Y.; Lin, J.F.; Yu, Q.Q. An electrochemical-thermal coupling model for prismatic lithium-ion batteries over wide temperature range. Appl. Therm. Eng. 2022, 217, 119282. [Google Scholar] [CrossRef]
  30. Li, J.F.; Wang, L.X.; Lyu, C.; Liu, E.H.; Xing, Y.J.; Pecht, M. A parameter estimation method for a simplified electrochemical model for Li-ion batteries. Electrochim. Acta 2018, 275, 50–58. [Google Scholar] [CrossRef]
  31. Gottapu, M.; Goh, T.; Kaushik, A.; Adiga, S.P.; Bharathraj, S.; Patil, R.S.; Kim, D.; Ryu, Y. Fully coupled simplified electrochemical and thermal model for series-parallel configured battery pack. J. Energy Storage 2021, 36, 102424. [Google Scholar] [CrossRef]
  32. Hosseinzadeh, E.; Marco, J.; Jennings, P. Combined electrical and electrochemical-thermal model of parallel connected large format pouch cells. J. Energy Storage 2019, 22, 194–207. [Google Scholar] [CrossRef]
  33. Wang, S.X.; Li, K.X.; Tian, Y.; Wang, J.Y.; Wu, Y.K.; Ji, S. An experimental and numerical examination on the thermal inertia of a cylindrical lithium-ion power battery. Appl. Therm. Eng. 2019, 154, 676–685. [Google Scholar] [CrossRef] [Green Version]
  34. Yang, X.L.; Hu, X.B.; Chen, Z.; Chen, Y.J. Effect of ambient dissipation condition on thermal behavior of a lithium-ion battery using a 3D multi-partition model. Appl. Therm. Eng. 2020, 178, 1359–4311. [Google Scholar] [CrossRef]
Figure 1. Structure diagram of the two-dimensional thermal resistance model [29].
Batteries 08 00217 g001
Figure 2. The current used for identification [29].
Batteries 08 00217 g002
Figure 3. Module series diagram.
Batteries 08 00217 g003
Figure 4. Battery pack thermal resistance network diagram.
Batteries 08 00217 g004
Figure 5. Schematic diagram of battery characteristic prediction under constant power conditions.
Batteries 08 00217 g005
Figure 6. Relevant experimental equipment [29].
Batteries 08 00217 g006
Figure 7. Curves of parameters Rcondx and Rcondy.
Batteries 08 00217 g007
Figure 8. Battery pack and temperature acquisition point arrangement.
Batteries 08 00217 g008
Figure 9. Simulation results of battery pack at constant current 20 A at 20 °C. (a) Comparison of total terminal voltage. (b) Comparison of internal temperature. (c) Comparison of temperature at points 1–3. (d) Comparison of temperature at points 4–7.
Batteries 08 00217 g009aBatteries 08 00217 g009b
Figure 10. Comparison chart of power at 120 W (left) and 135 W (right).
Batteries 08 00217 g010
Figure 11. Voltage contrast (left) and current contrast (right) under constant power conditions.
Batteries 08 00217 g011
Figure 12. Maximum temperature change diagram under several constant power conditions.
Batteries 08 00217 g012
Figure 13. Temperature-control strategies. (a) Strategy 1: Constant search range of heat transfer coefficient. (b) Strategy 2: Variable search range of heat transfer coefficient.
Batteries 08 00217 g013
Figure 14. 165 W constant-power condition. (a) Temperature contrast. (b) Power comparison.
Batteries 08 00217 g014
Figure 15. 180 W constant-power condition. (a) Temperature contrast. (b) Power comparison.
Batteries 08 00217 g015
Figure 16. 195 W constant-power condition. (a) Temperature contrast. (b) Power comparison.
Batteries 08 00217 g016
Figure 17. h comparison under constant 165 W power conditions.
Batteries 08 00217 g017
Table 1. Numerical equations of the model.
Correlation MechanismEquations
Terminal voltage U app ( k ) = E ocv ( k )     η con ( k )     η act ( k )     η ohm ( k )
Open circuit potential correction E ocv ( k ) = E ocv ref ( k ) + ( T ( k )     T ref ) d E ocv d T
Basic working principle x avg ( k ) = x 0     t 1 t k I d t / Q n , x surf ( k ) = x avg ( k )     Δ x ( k ) , Δ x ( k ) = Δ x 1 ( k ) + 2 7 τ n I ( k ) / Q n ,
y avg ( k ) = y 0 + t 1 t k I d t / Q p , y surf ( k ) = y avg ( k ) + Δ y ( k ) , Δ y ( k ) = Δ y 1 ( k ) + 2 7 τ p I ( k ) / Q p ,
E ocv ( k ) = U p y surf ( k )     U n x surf ( k )
Solid diffusion Δ x 1 ( k + 1 ) = Δ x 1 ( k ) + 1 τ n [ 12 τ n I ( k ) 7 Q n     Δ x 1 ( k ) ] Δ t ,   Δ y 1 ( k + 1 ) = Δ y 1 ( k ) + 1 τ p [ 12 τ p I ( k ) 7 Q p Δ y 1 ( k ) ] Δ t
Liquid phase diffusion Δ c n ( k + 1 ) = Δ c n ( k ) + 1 τ e P conn I ( k )     Δ c n ( k ) Δ t ,   Δ c p ( k + 1 ) = Δ c p ( k ) + 1 τ e P conp   Δ c p ( k ) Δ t ,  
η con ( k ) = 2 RT ( k ) F 1     t + ln c 0 + Δ c p ( k ) c 0     Δ c n ( k )
Reactive polarization η act ( k ) = 2 RT ( k ) F [ ln ( m n 2 ( k ) + 1 + m n ( k ) )     ln ( m p 2 ( k ) + 1 + m p ( k ) ) ]
m p ( k ) = 1 6 Q p c 0 0 . 5 1 ( 1     y surf ( k ) ) 0 . 5 ( y surf ( k ) ) 0 . 5 P act I ( k ) ,   m n = 1 6 Q n c 0 0 . 5 1 ( 1   x surf ( k ) ) 0 . 5 ( x surf ( k ) ) 0 . 5 P act I ( k )
Ohmic polarization η ohm = R ohm I   ( k )
Heat production Q ˙ ( k ) = I ( k ) T ( k ) d E ocv d T + I ( k ) ( E ocv ( k )     U app ( k ) )
Internal temperature T k + 1 = T k + Δ t m roll C p ( Q ˙ ( k )     1 R condx + 8 V λ x l x 2 ( T k     T surfx k )     ( 1 R condy + 8 V λ y l y 2 ) ( T k     T surfy k ) )
Shell temperature T surfx k + 1 = T surfx   k + Δ t m can C can ( 1 R condx ( T k + 1   T surfx k )     Vh x l y ( T surfx k     T a ) )
T surfy k + 1 = T surfy k + Δ t m can C can ( 1 R condy ( T k + 1     T surfy k )     Vh x l y ( T surfy k     T a ) )
Table 2. Assumptions of the thermal model.
AssumptionsExplanations
The temperature conduction in z direction which is shown in Figure 1 is ignored.The laminated structure inside the battery only exists in the x and y directions, but not in the z direction. The temperature difference in the z direction is ignored.
The temperature distribution inside the battery is uniform.In order to reduce the complexity of battery modeling and simulation time, this work ignores the temperature difference at different positions inside the battery, referring to a lumped-parameter thermal model.
The resistance of wires in the battery pack is ignored.Compared with the internal resistance of the battery, the wire resistance is too small and is ignored.
Table 3. Battery specification.
SpecificationParameterSpecificationParameter
Height10 ± 2 mmWeightabout 0.721 kg
Width25 ± 2 mmPositive electrode materialNCM
Length150 ± 2 mmNegative electrode materialGraphite
Table 4. Battery parameters.
ParametersCell 1Cell 2Cell 3
y0, x00.4023, 0.71440.4073, 0.75490.403, 0.7196
Qp, Qnl348200, 222740320500, 212700335900, 221000
τp, τn10, 1040,4010,10
Pact453910334060361500
Pconp, Pconn219.1852, 115.7789721.0612, 20.4525219.7746115.3661
Rohm0.00070.000152290.0007
τe50410.6422100
hx, hy, hd5, 30, 25, 30, 25, 30, 2
Cp1160.171160.171160.17
λx, λy2.35, 0.15262.35, 0.15262.35, 0.1526
Table 5. Mean absolute errors of temperature.
State EstimatorMean ErrorsState EstimatorMean Errors
Total terminal voltage (V)0.036Point 4 temperature (K)0.141
Point 1 temperature (K)0.361Point 5 temperature (K)0.167
Point 2 temperature (K)0.164 Point 6 temperature (K)0.069
Point 3 temperature (K)0.222 Point 7 temperature (K)0.276
Table 6. Comparison results with other authors regarding temperature-simulation accuracy.
OthersThis WorkType
ReferenceType of Battery PackWorking
Condition
Ambient TemperatureValuesWorking ConditionValues
[31]7S4P0.17 C (6.03 A) discharge25 °C0.990.5 C (20 A)
discharge
0.9938Maximum accuracy
(Accuracy is 1-mean relative errors)
0.4 C (14.444 A) charge25 °C0.98
0.3 C (10.18 A) discharge25 °C0.96
0.4 C (14.444 A) charge25 °C0.97
0.4 C (14.44 A) discharge25 °C0.96
0.4 C (14.44 A) charge25 °C0.95
[23]5S1P0.9 C discharge23.3 °C0.95
[32]5S1PWLTP class 3 drive cycle5 °C6.7%0.5 C (20 A)
discharge
1.35%Maximum relative errors
25 °C1.5%
45 °C1.5%
[33]1S1P40 C (44 A) discharge25 °C6.22%0.5 C (20 A)
discharge
[34]1S1P1 C (2.2 A) dischargeAbout 12.5 °C3.5%
2 C (4.4 A) discharge
3 C (6.6 A) discharge
0.9 C discharge23.3 °C
Table 7. Time of constant power discharge.
Power (W)Predicted Discharge Time (s)Experimental Discharge Time (s)
1351259412621
1201418814168
Table 8. Specific temperature-rise values.
Constant Power (W)Temperature Rise (K)Constant Power (W)Temperature Rise (K)
1202.961654.10
1353.331804.50
1503.721954.90
Table 9. Simulation time per cycle for two strategies.
Power165 W180 W195 W
Simulation time for Strategy 1 (s)0.5050.5970.718
Simulation time for Strategy 2 (s)0.3270.3820.399
Publisher’s Note: MDPI stays neutral with regard to jurisdictional claims in published maps and institutional affiliations.

