
Understanding Voltage Behavior of Lithium-Ion Batteries in Electric Vehicles Applications
 , , ,
, , ,  ,
, 

Abstract
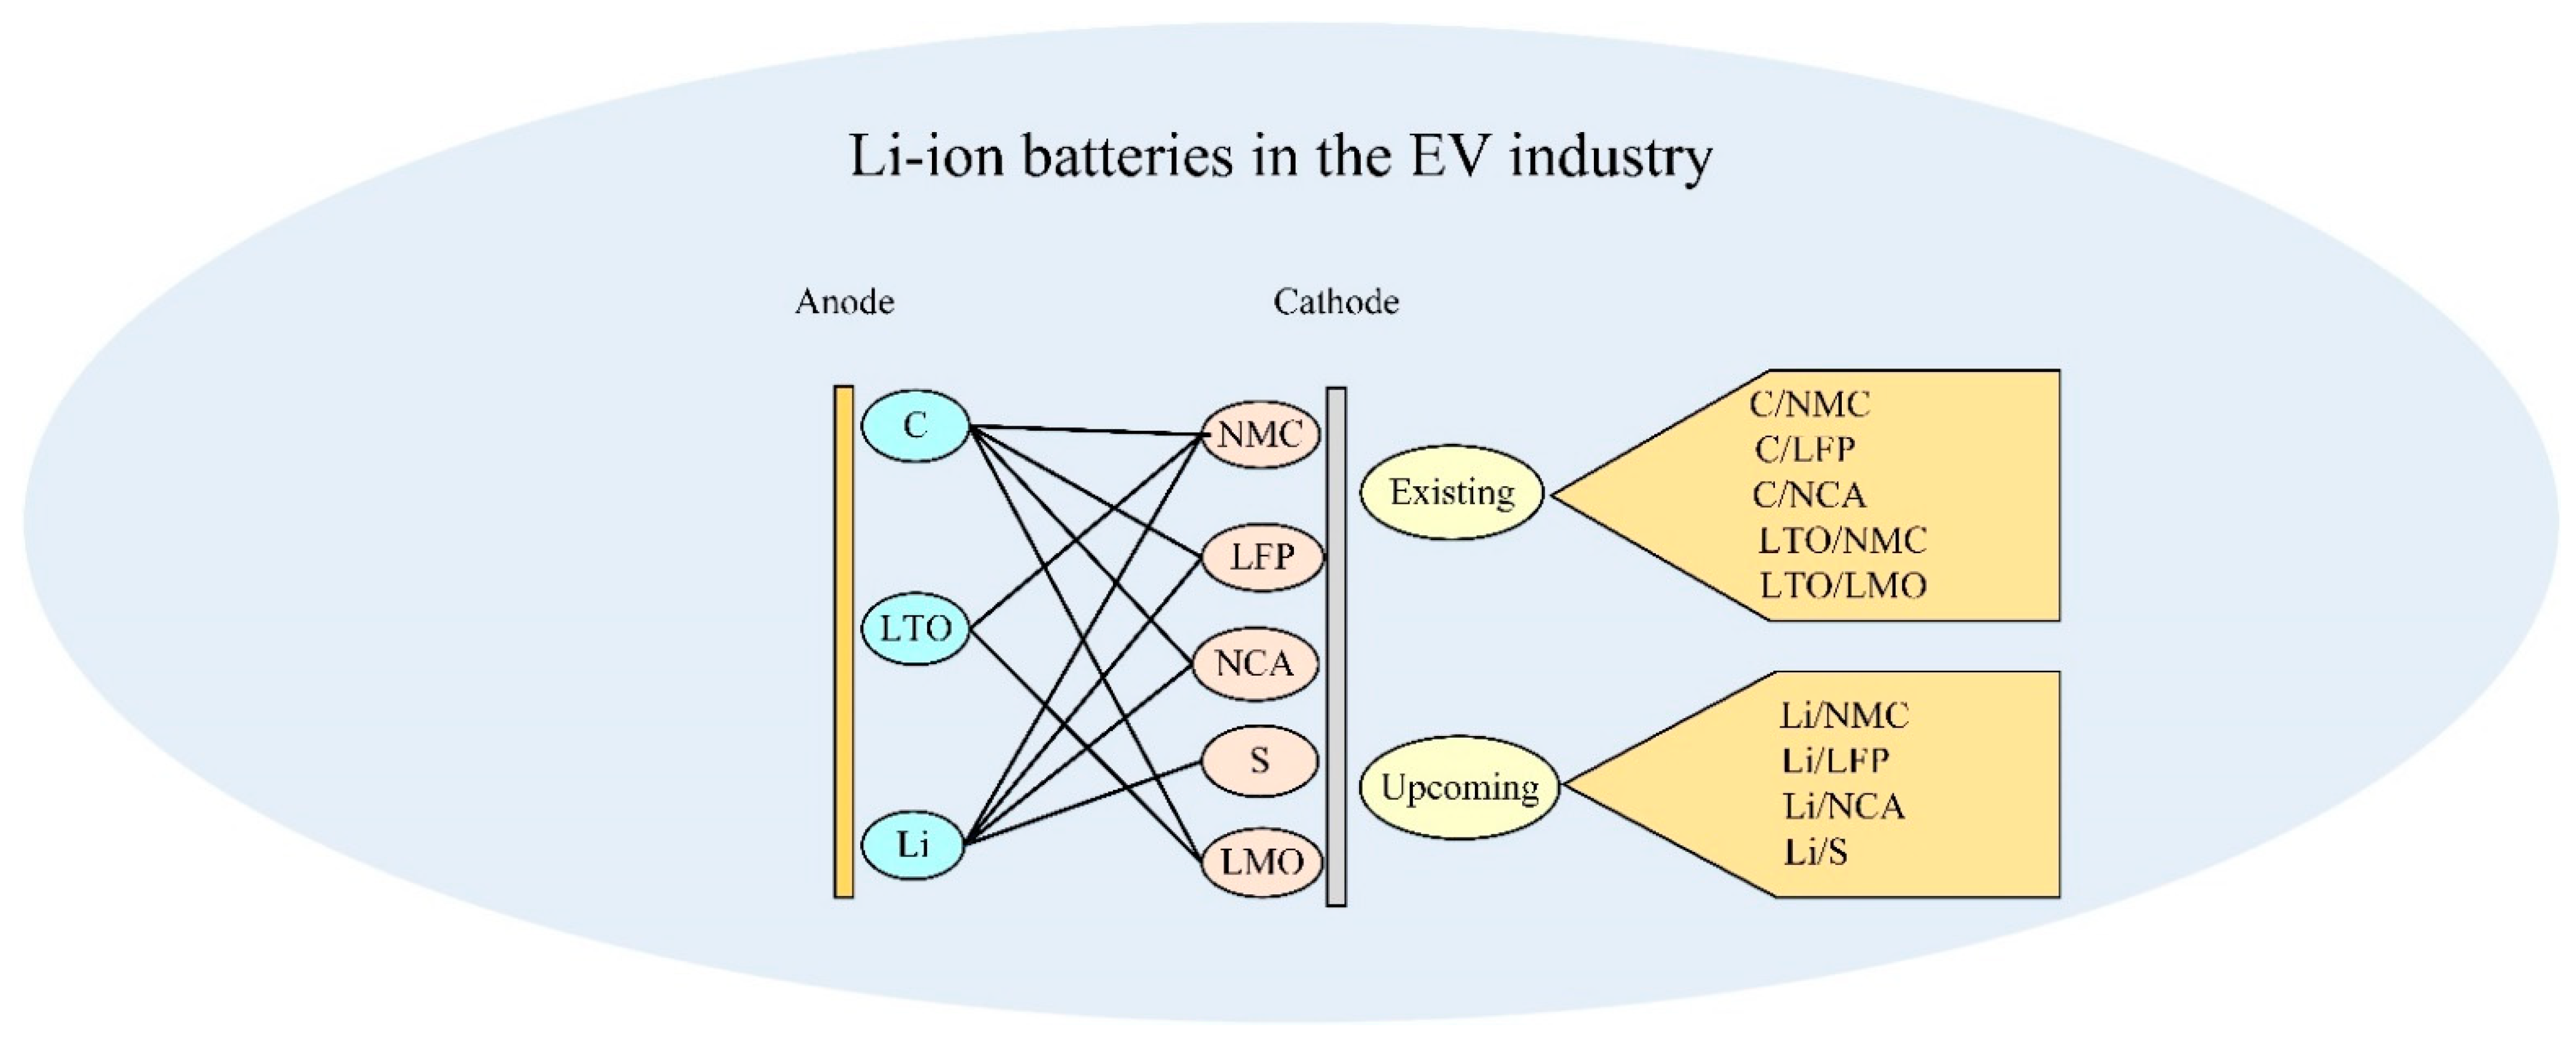
:1. Introduction
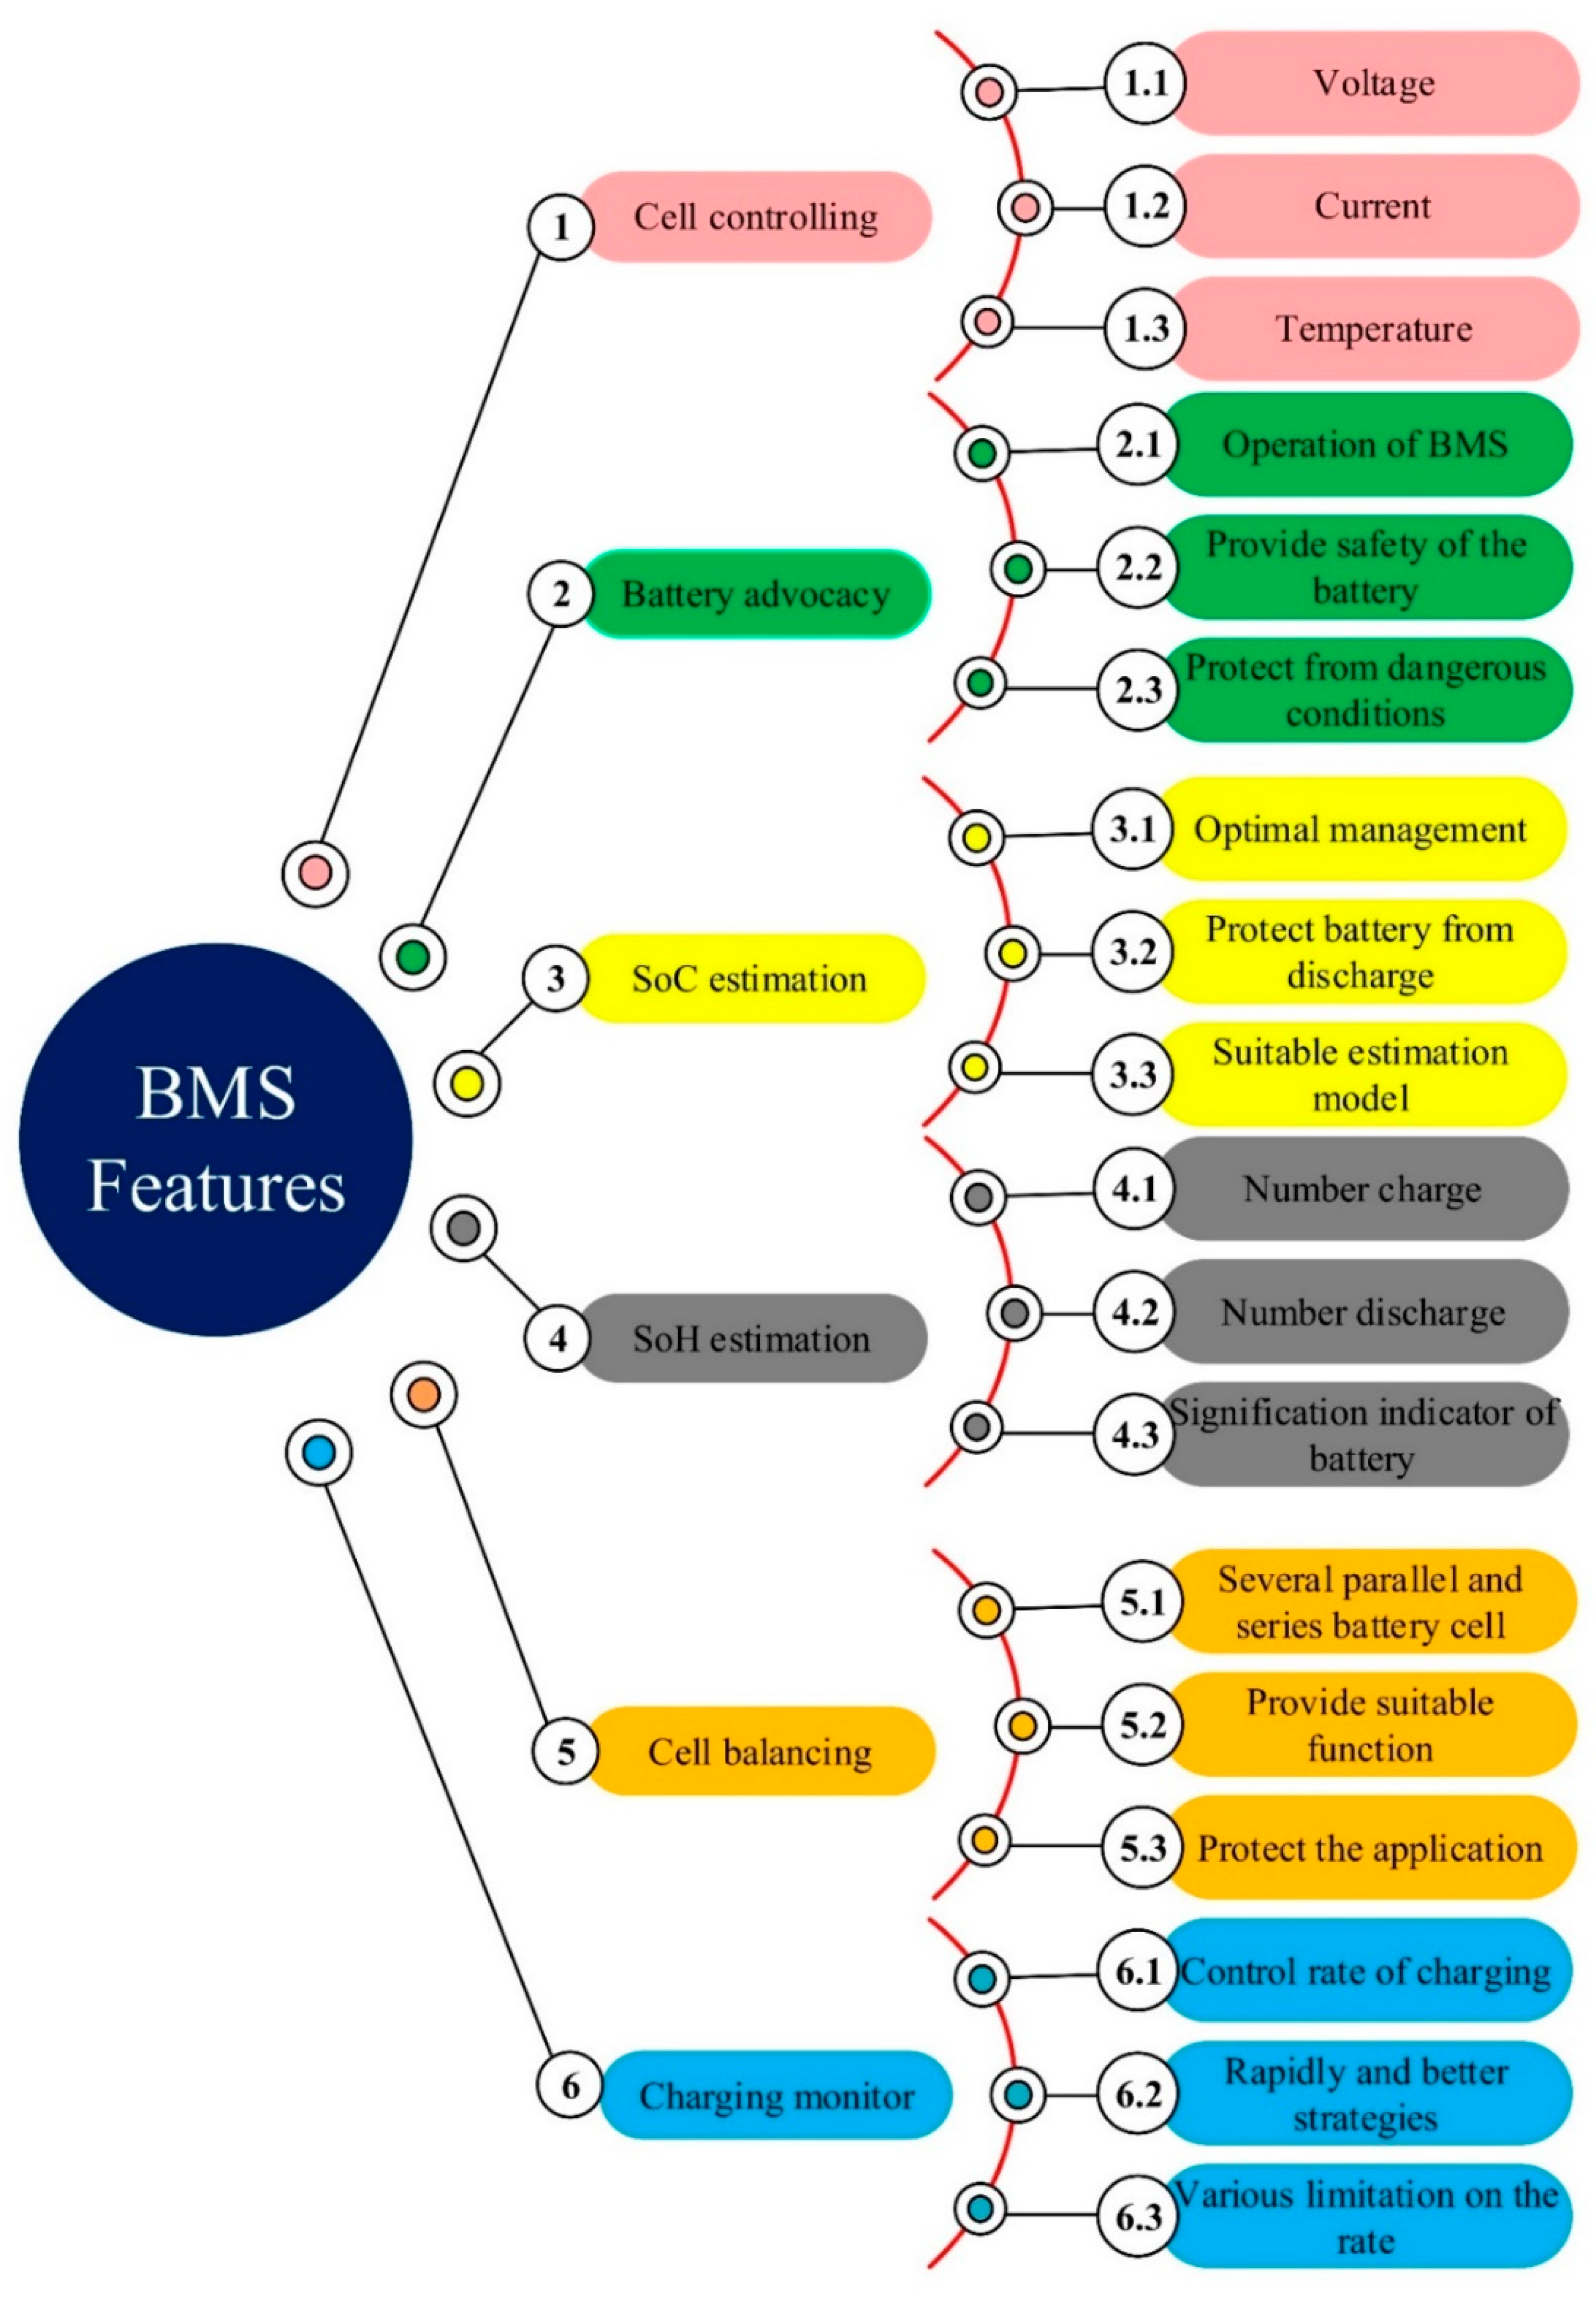
2. Battery Management System (BMS)
- Expenditure consists of producing, reparation, function, and transforming expenditure;
- The life cycle is determined by charging or discharging;
- The power supply is determined by the charging or discharging amount and energy storage amount;
- Security determines the safety or hazardous elements because of the functional operating temperature.
- Cell monitoring: It consists of current, voltage, and temperature situations;
- Battery safety: To provide the security of the battery and eliminate it from dangerous situations;
- SoC evaluation: SoC is a metric of the existing charge storage in the battery that shows the entire status of battery charging;
- SoH evaluation: SoH is a significant metric of battery operation features. It forecasts the quantity of charging and discharging duration;
- Cell regulation: It consists of various arrangements of battery cells to provide suitable functions to the battery system.
- CAN-bus component, which is applied for relating with control elements;
- The DC/DC component converts the power source into the power supply;
- The battery current evaluation component is applied for calculating the charging and discharging current situation;
- A battery voltage evaluation component is used to calculate the voltage situation;
- A temperature evaluation component is applied to check the case of selected cells;
- The data flash memory component is applied for recording data for evaluation.
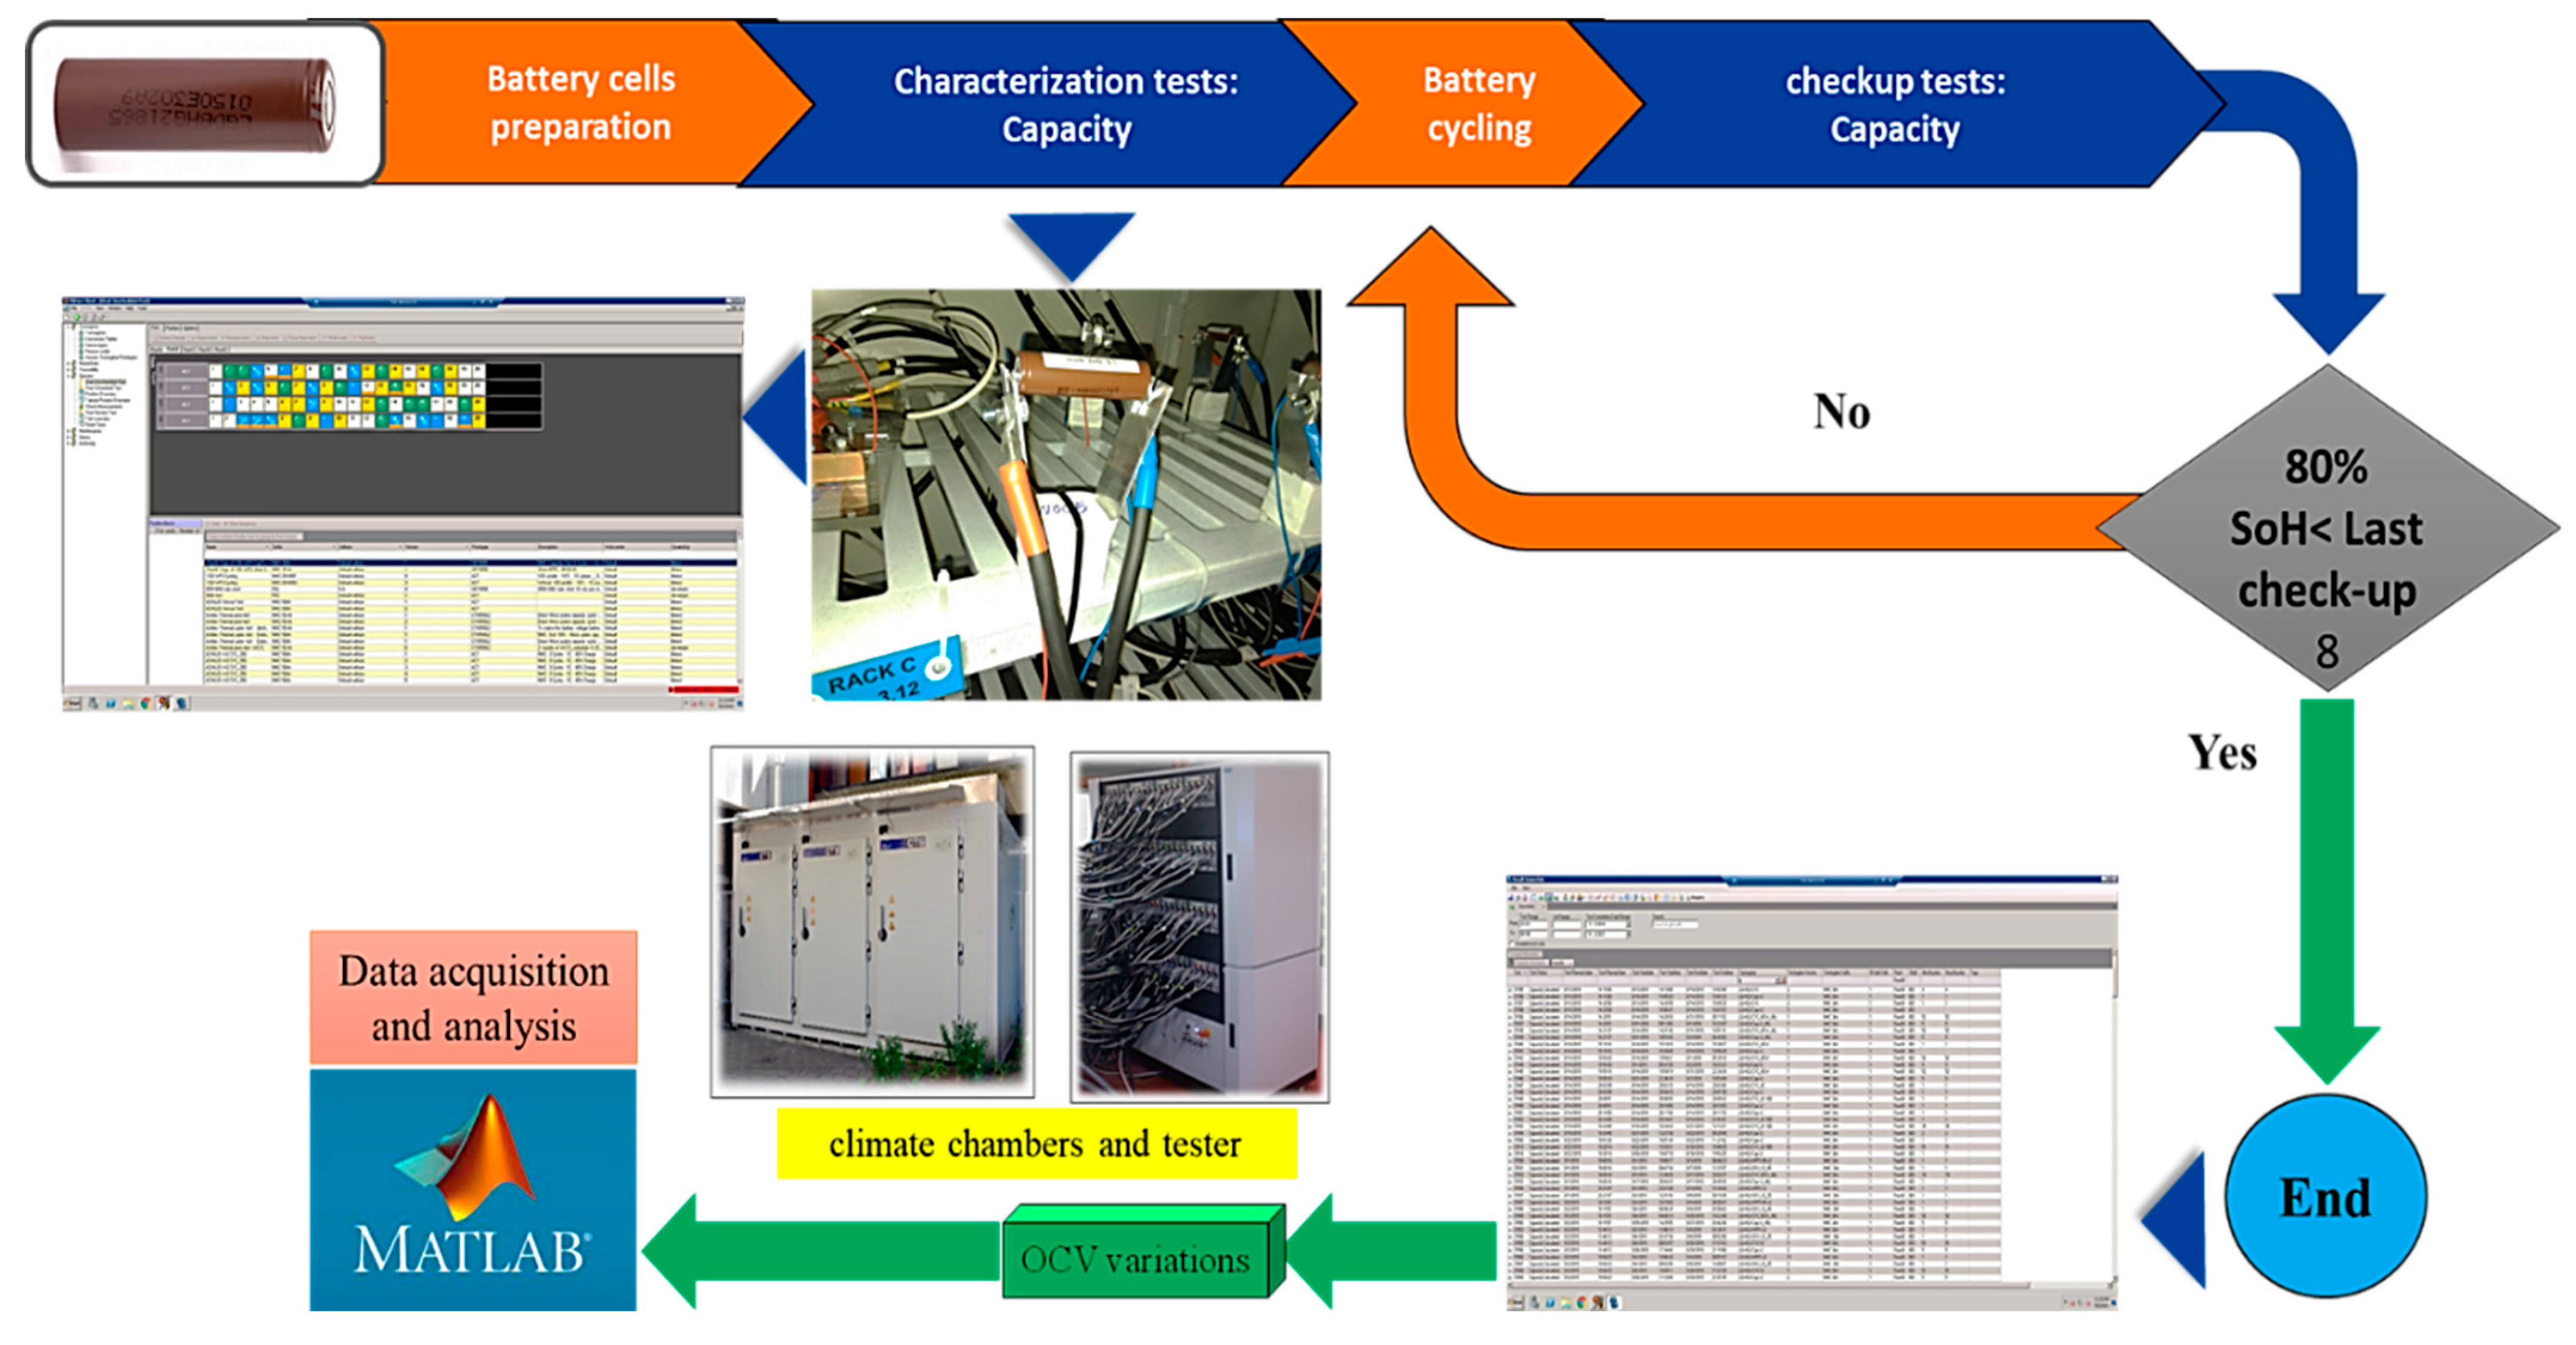
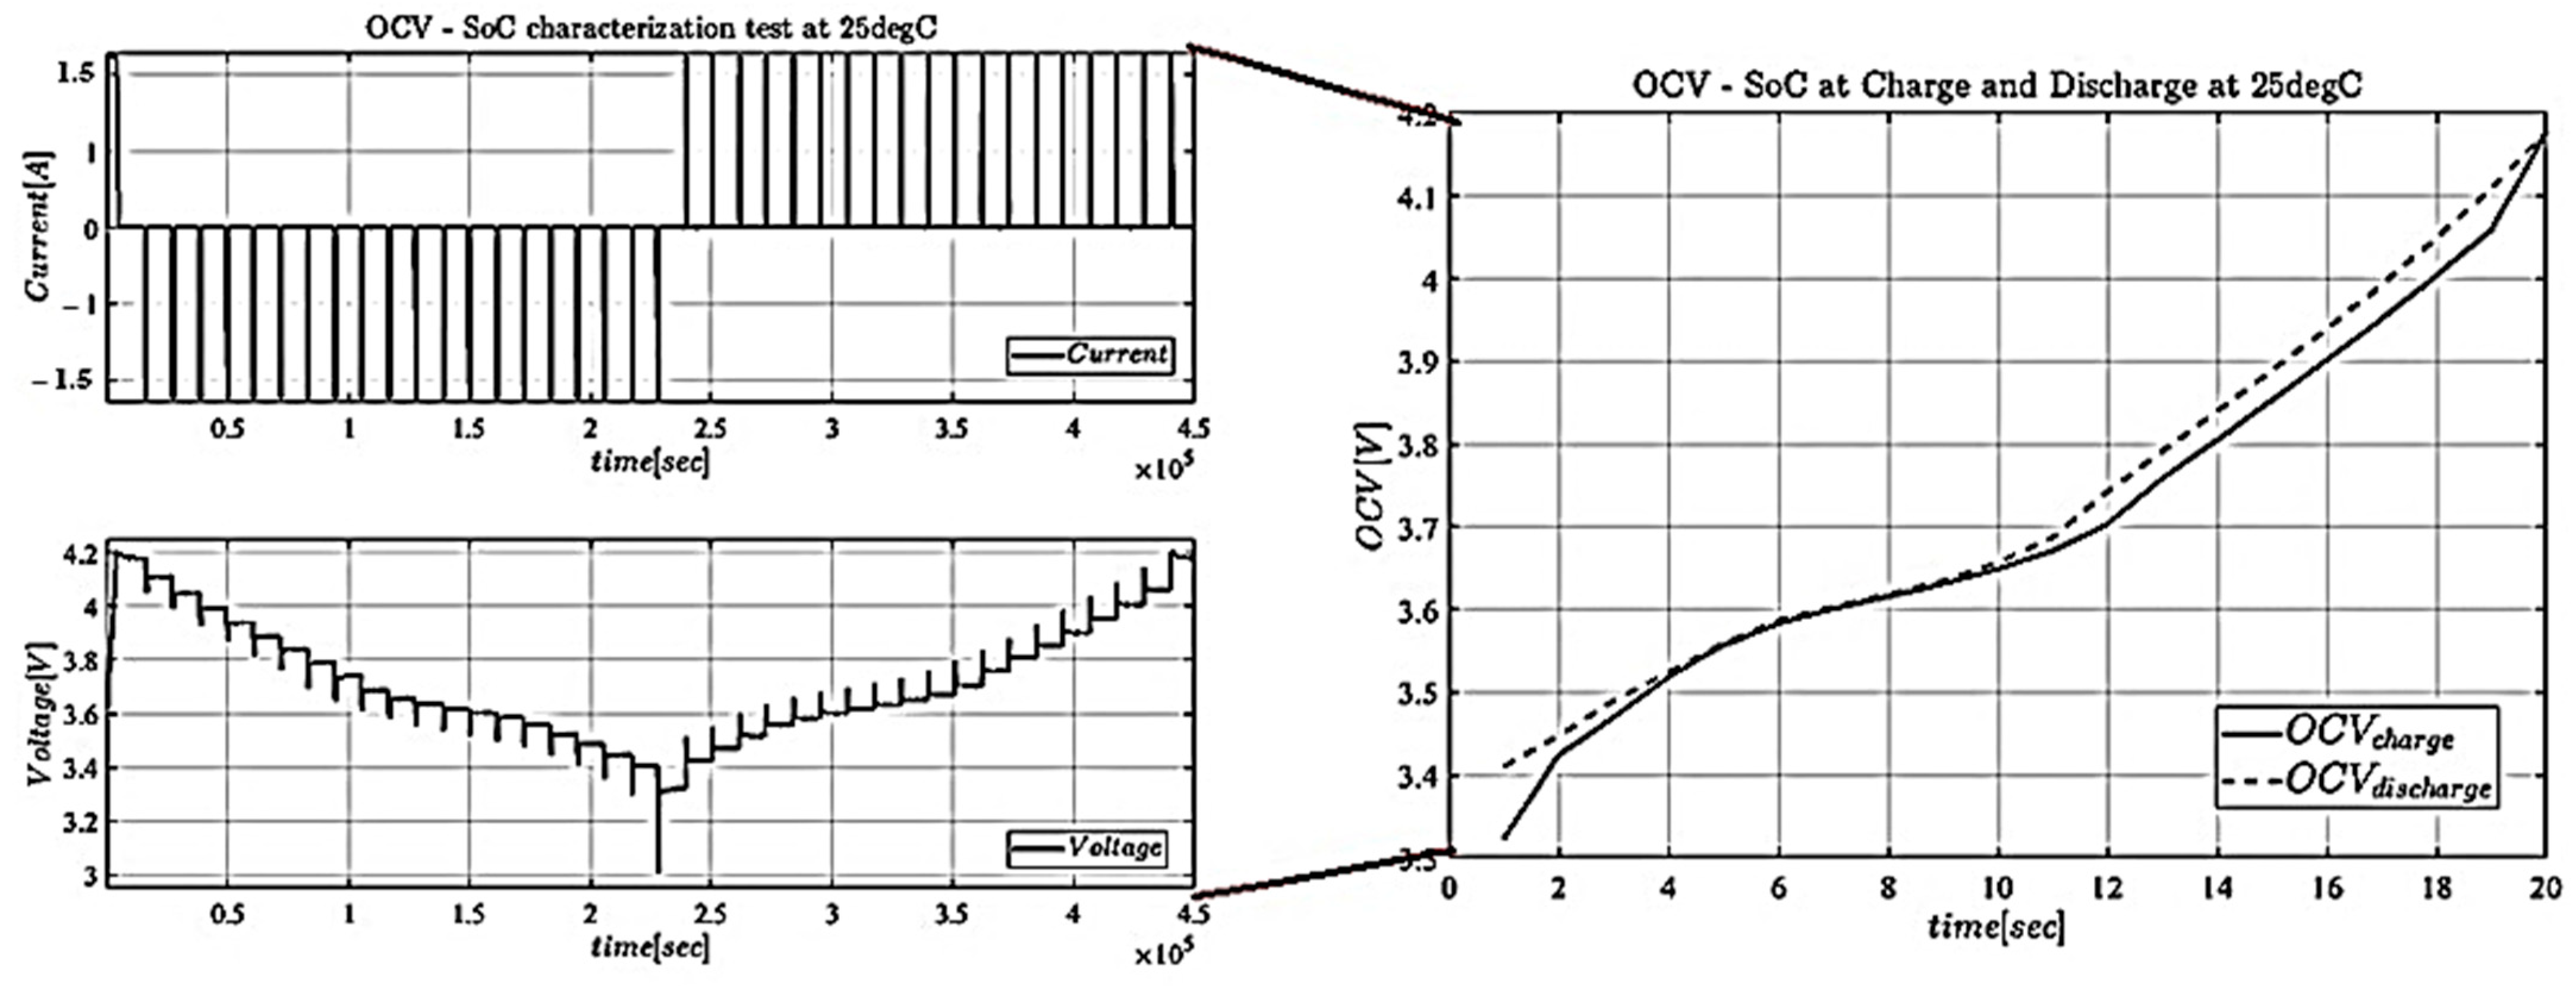
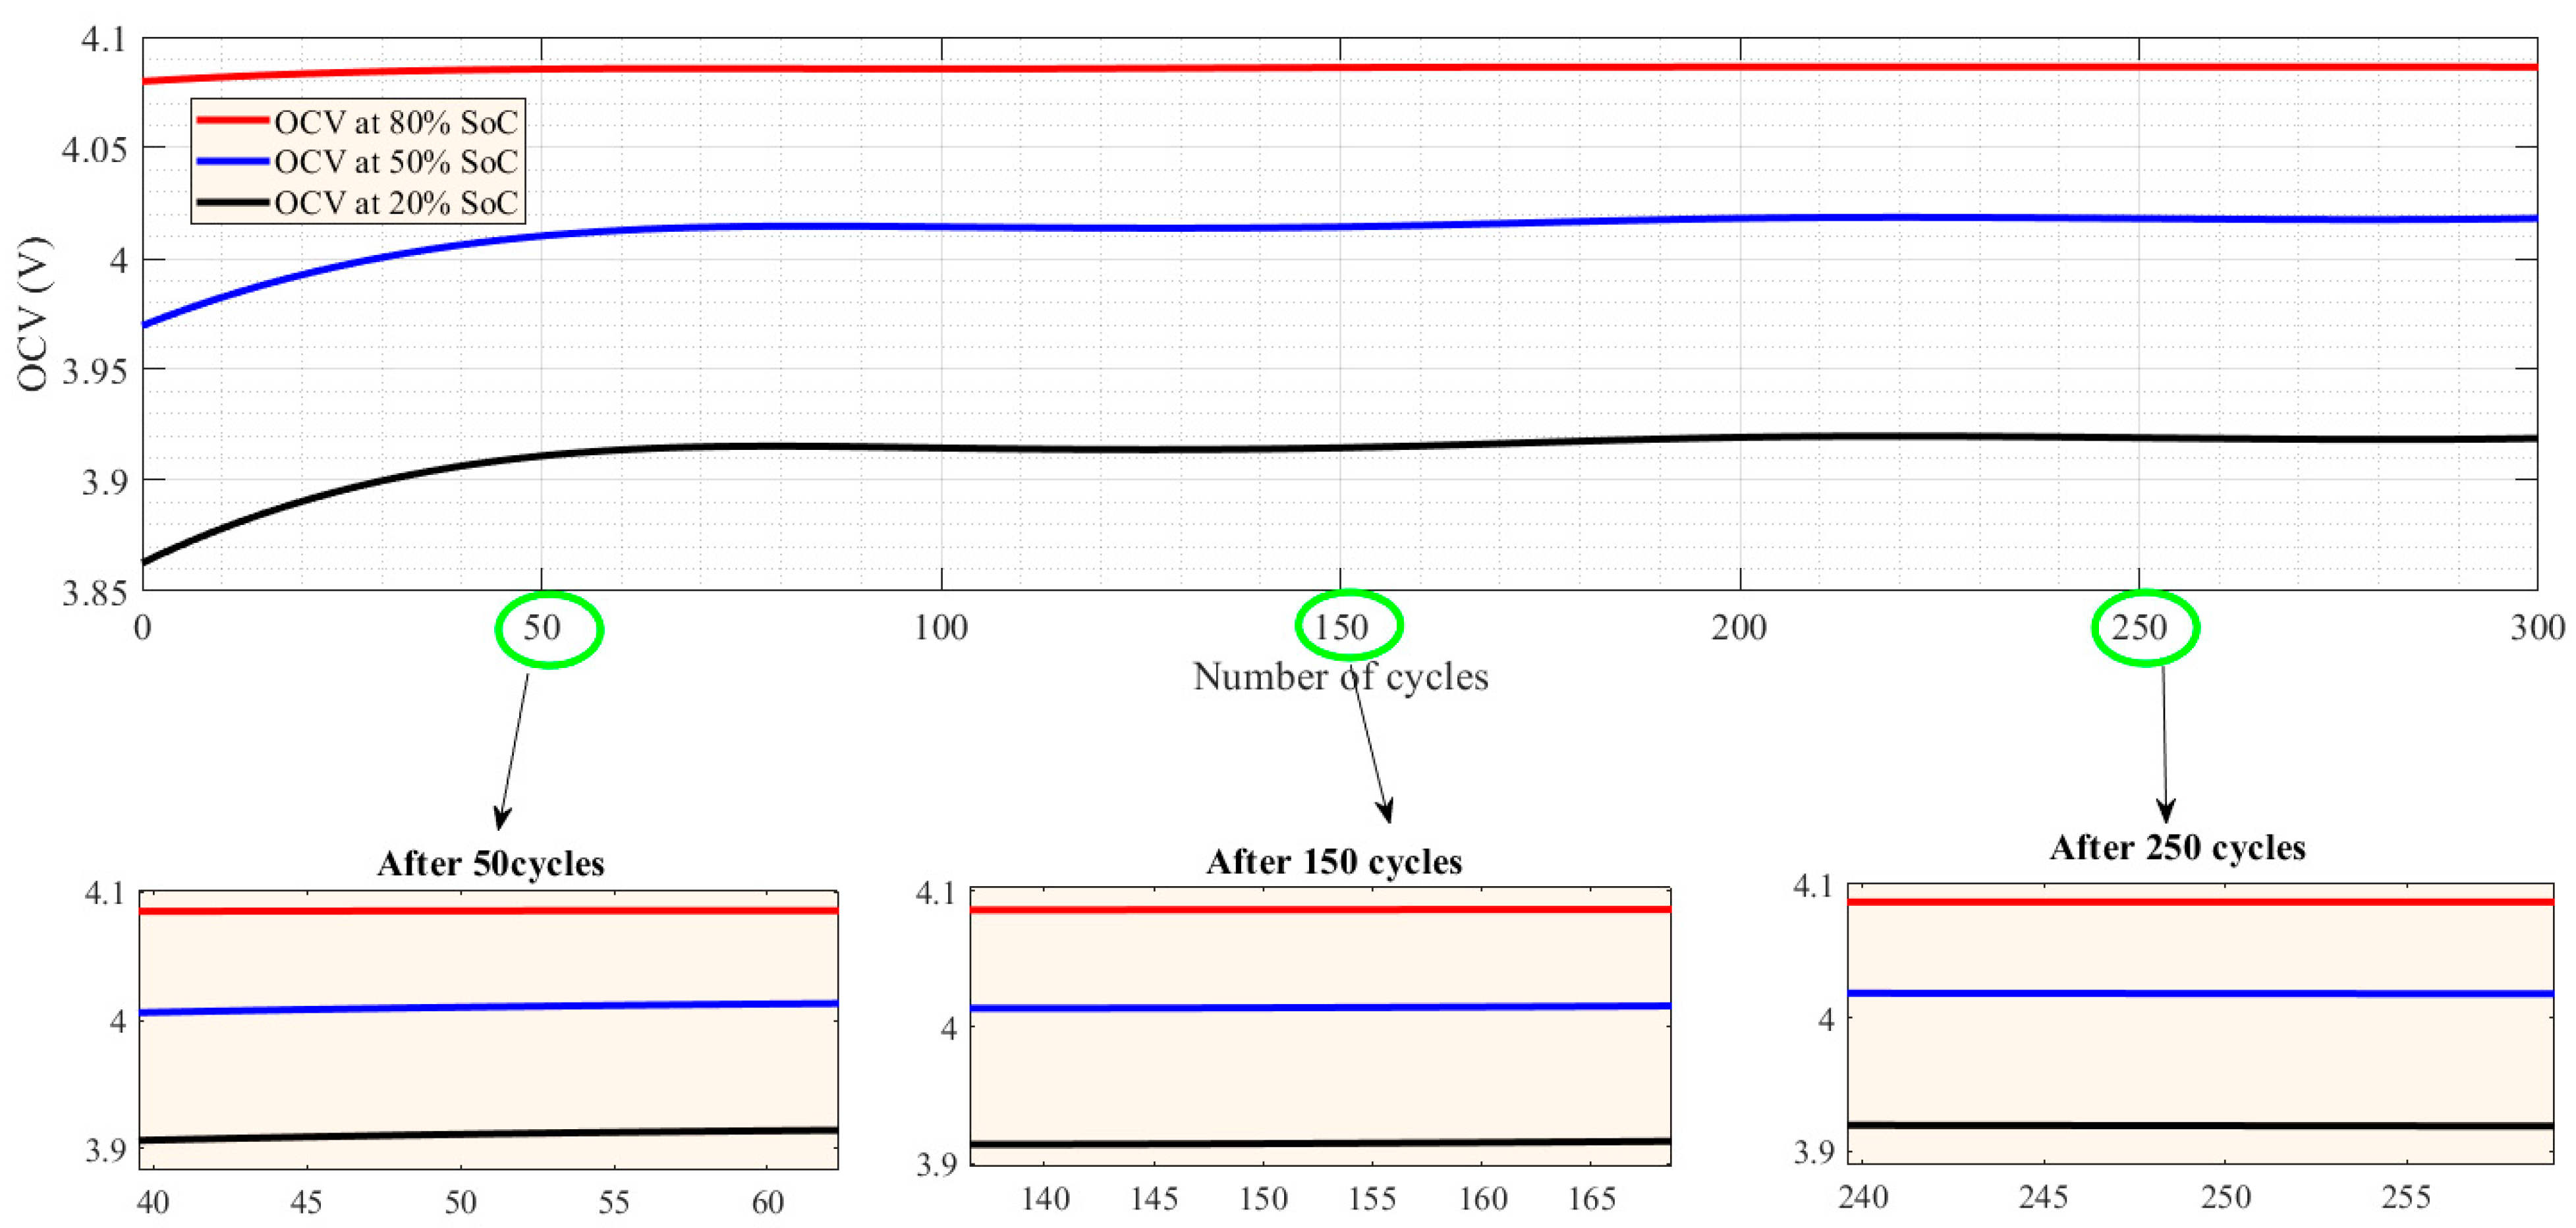
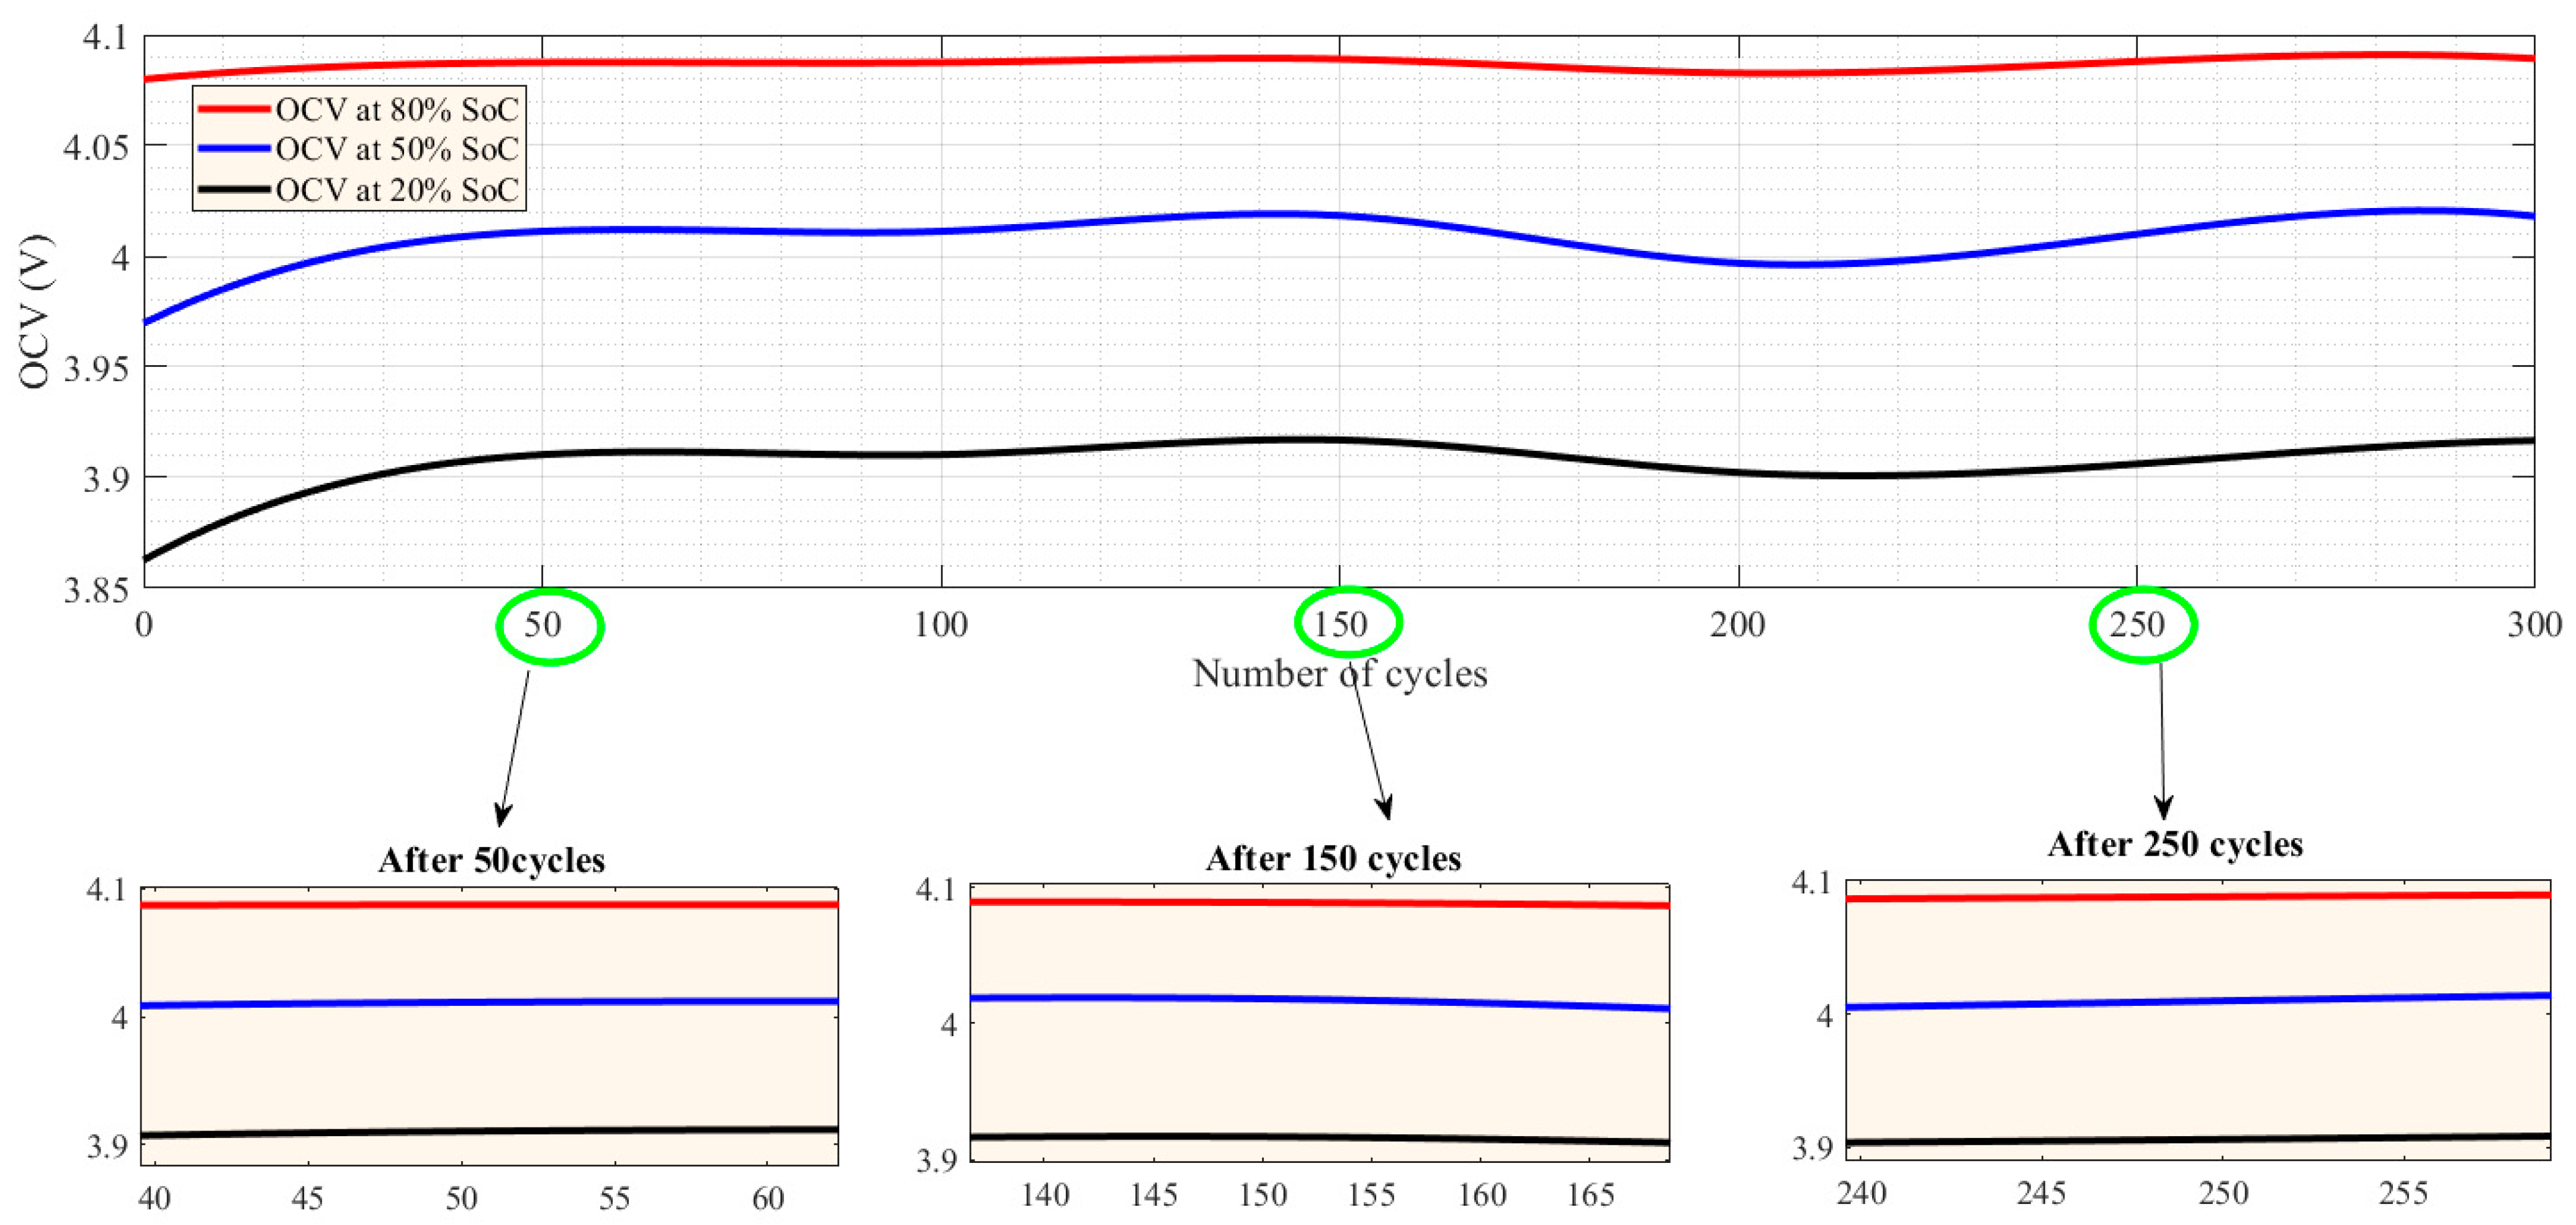
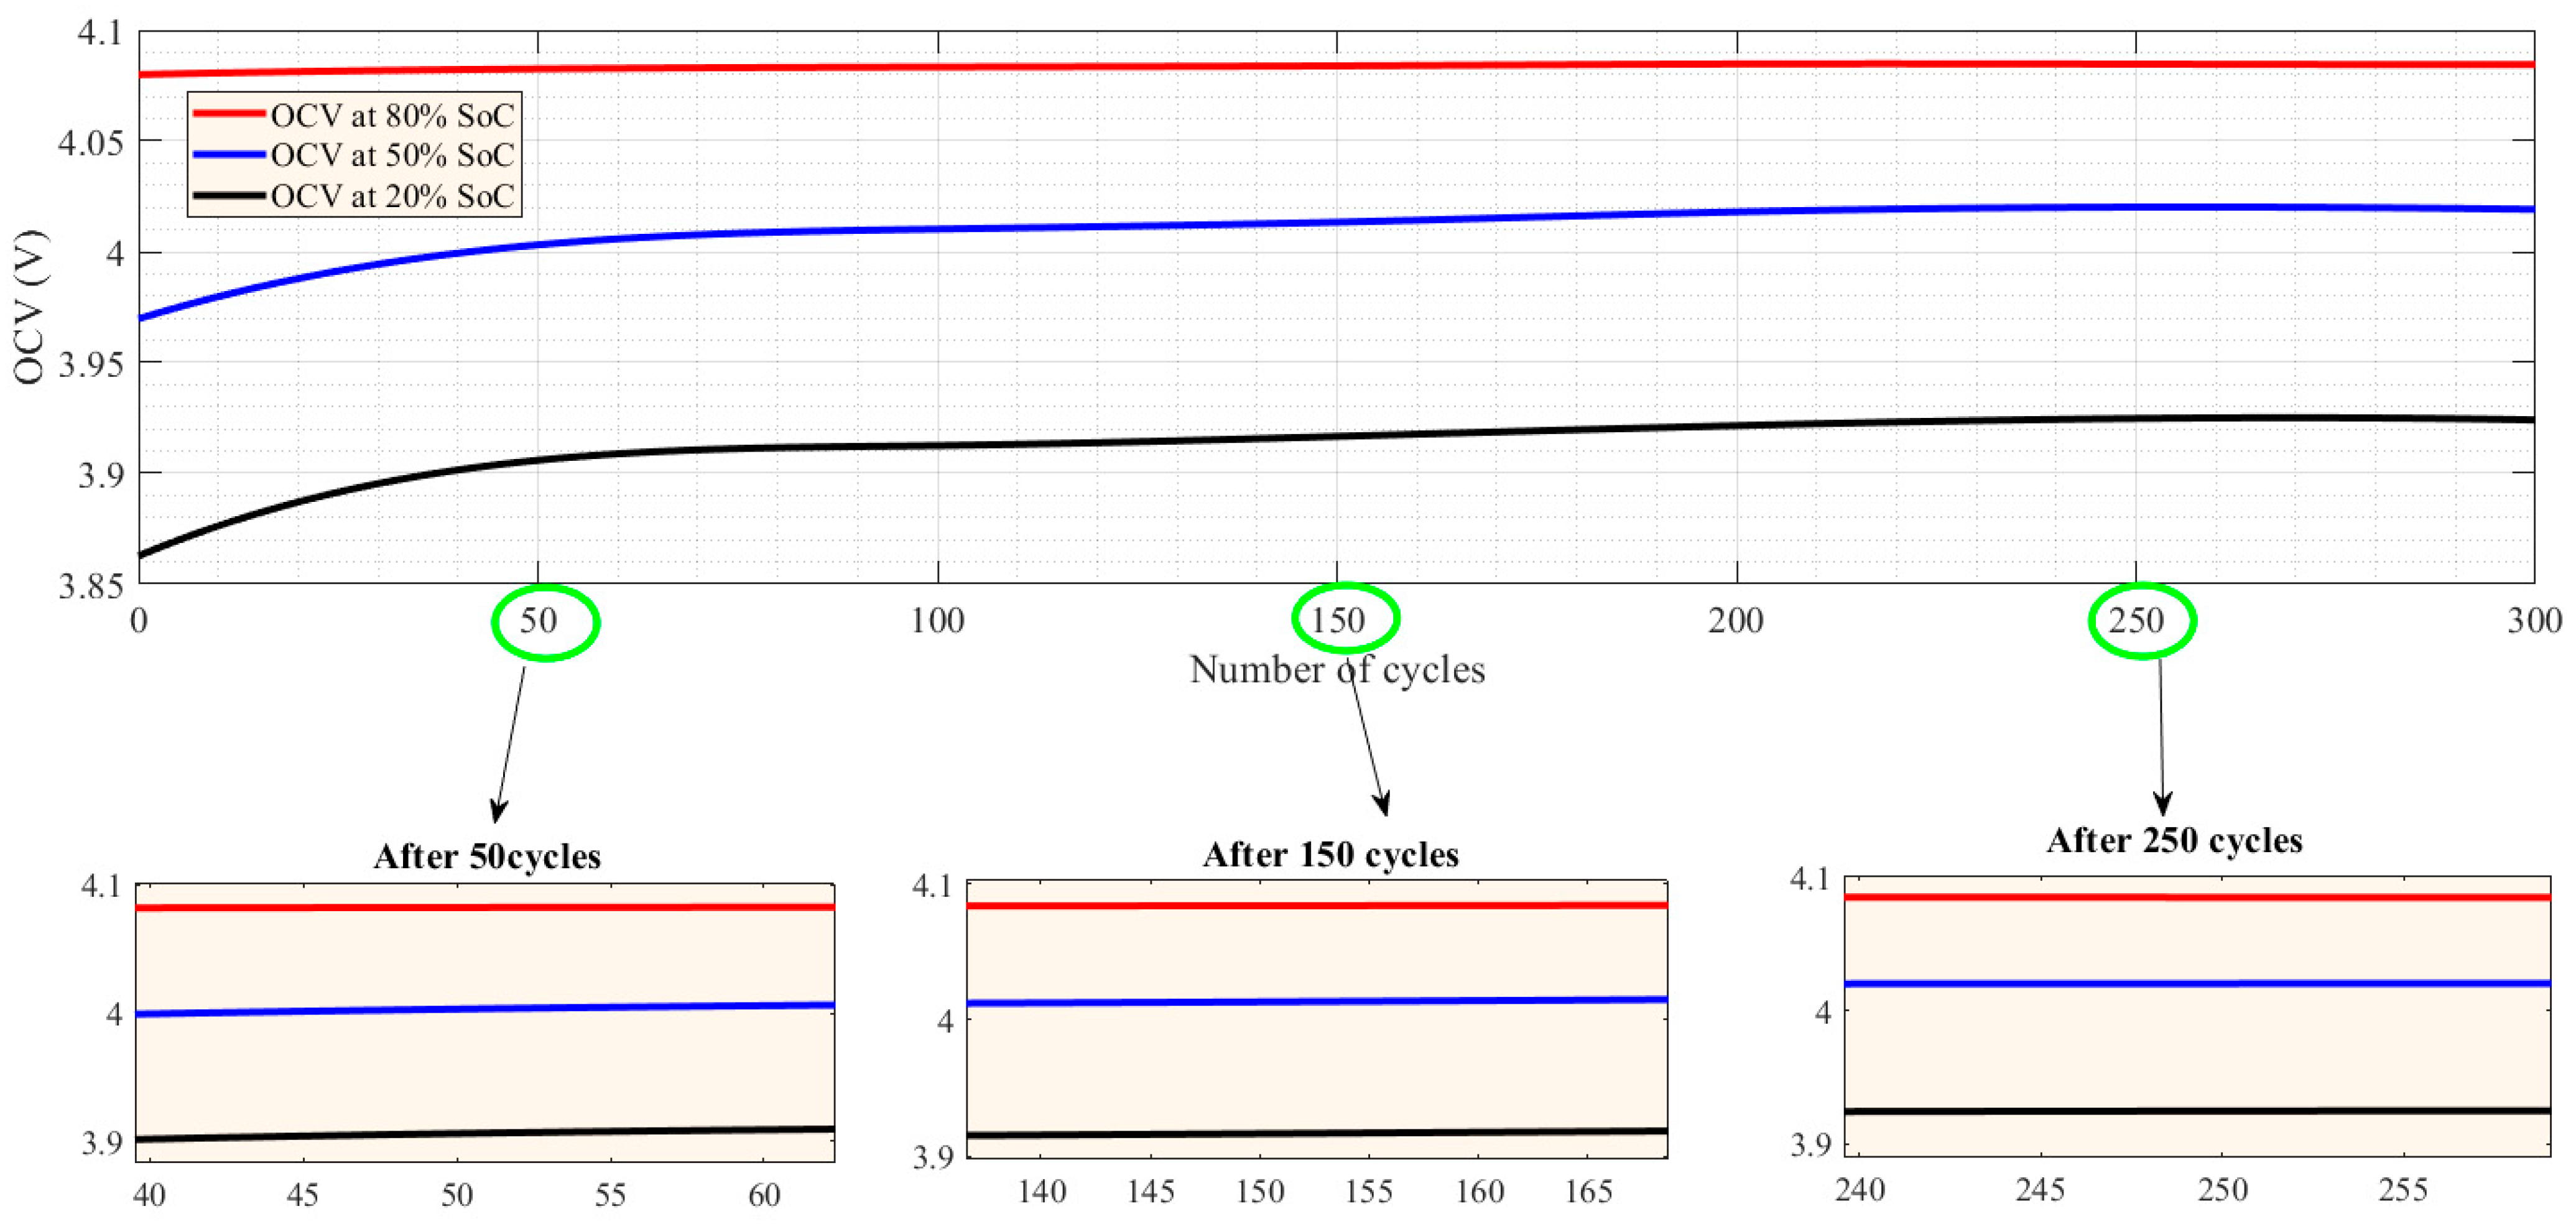
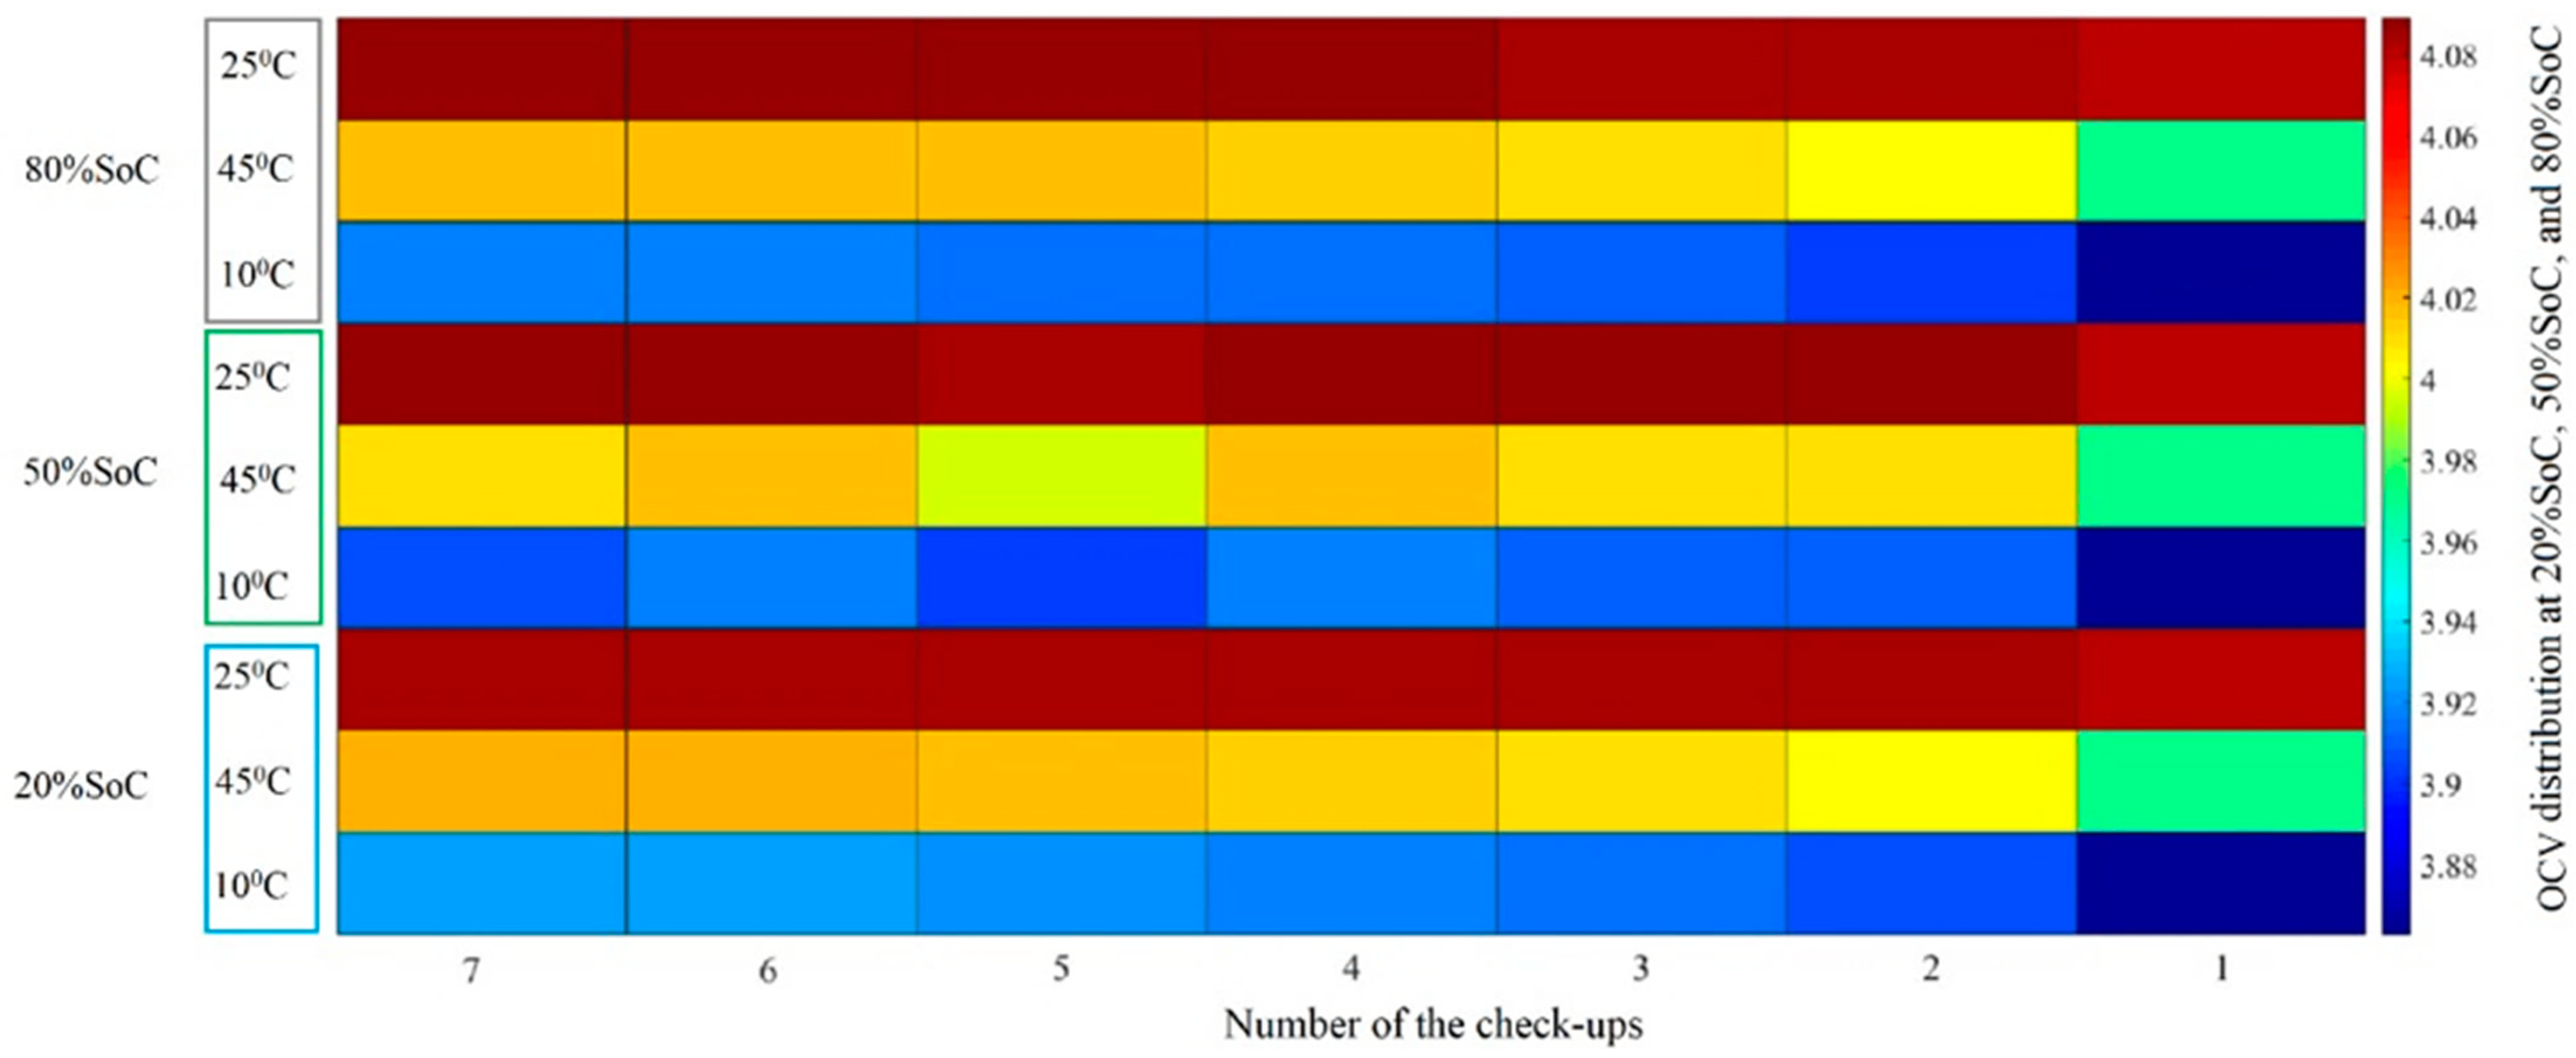
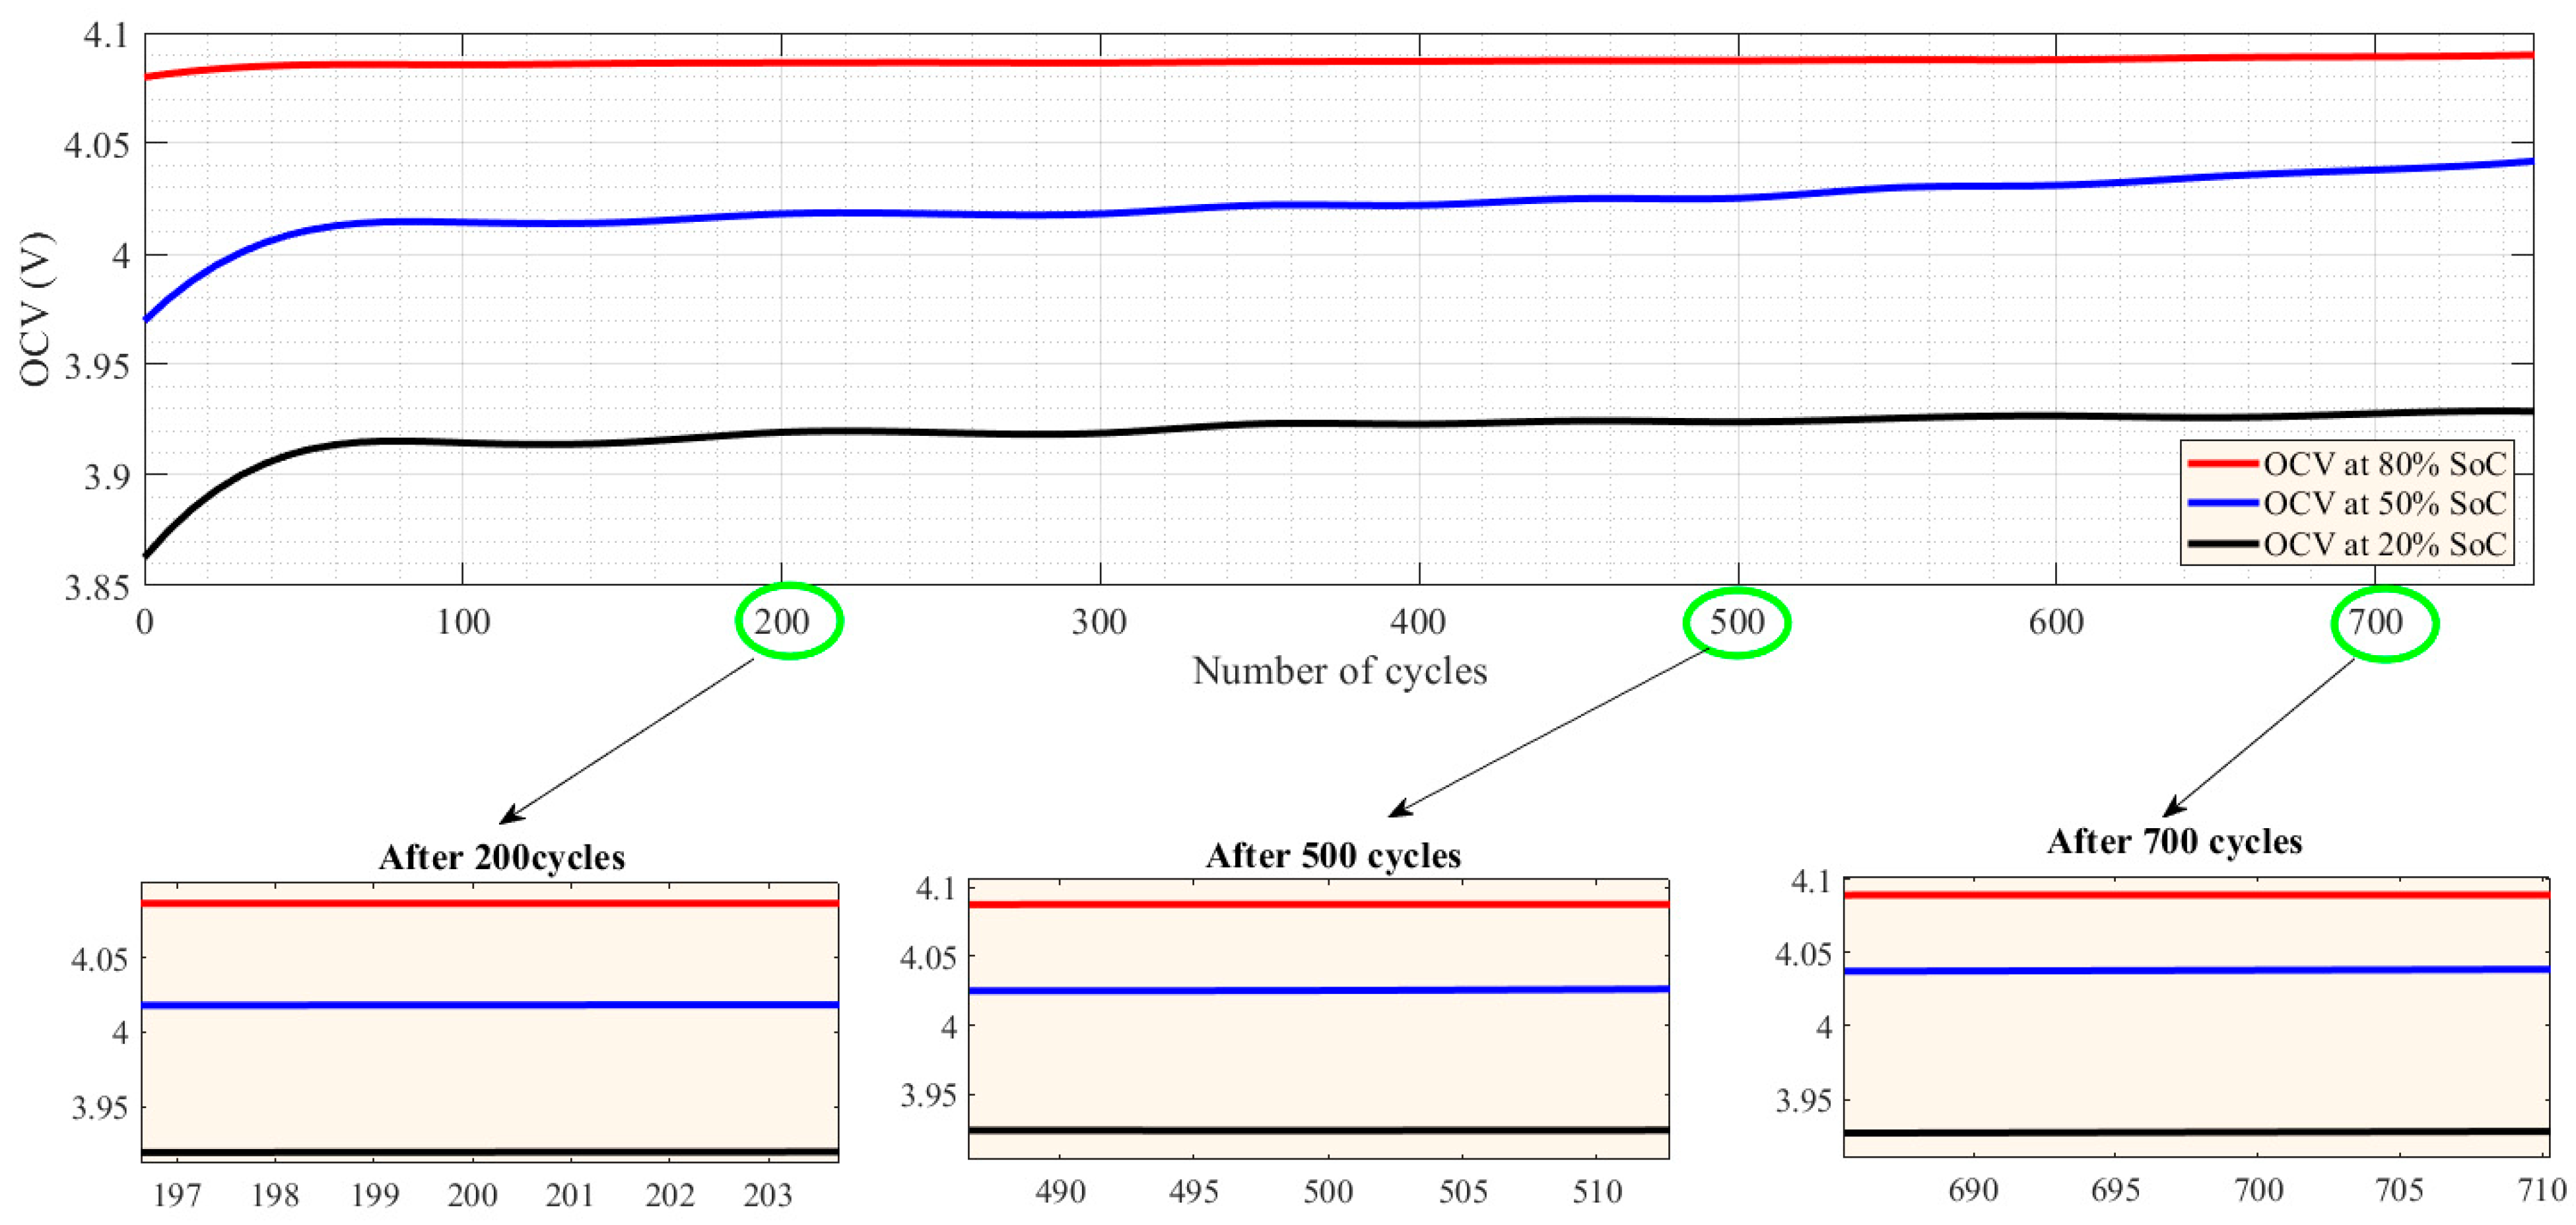
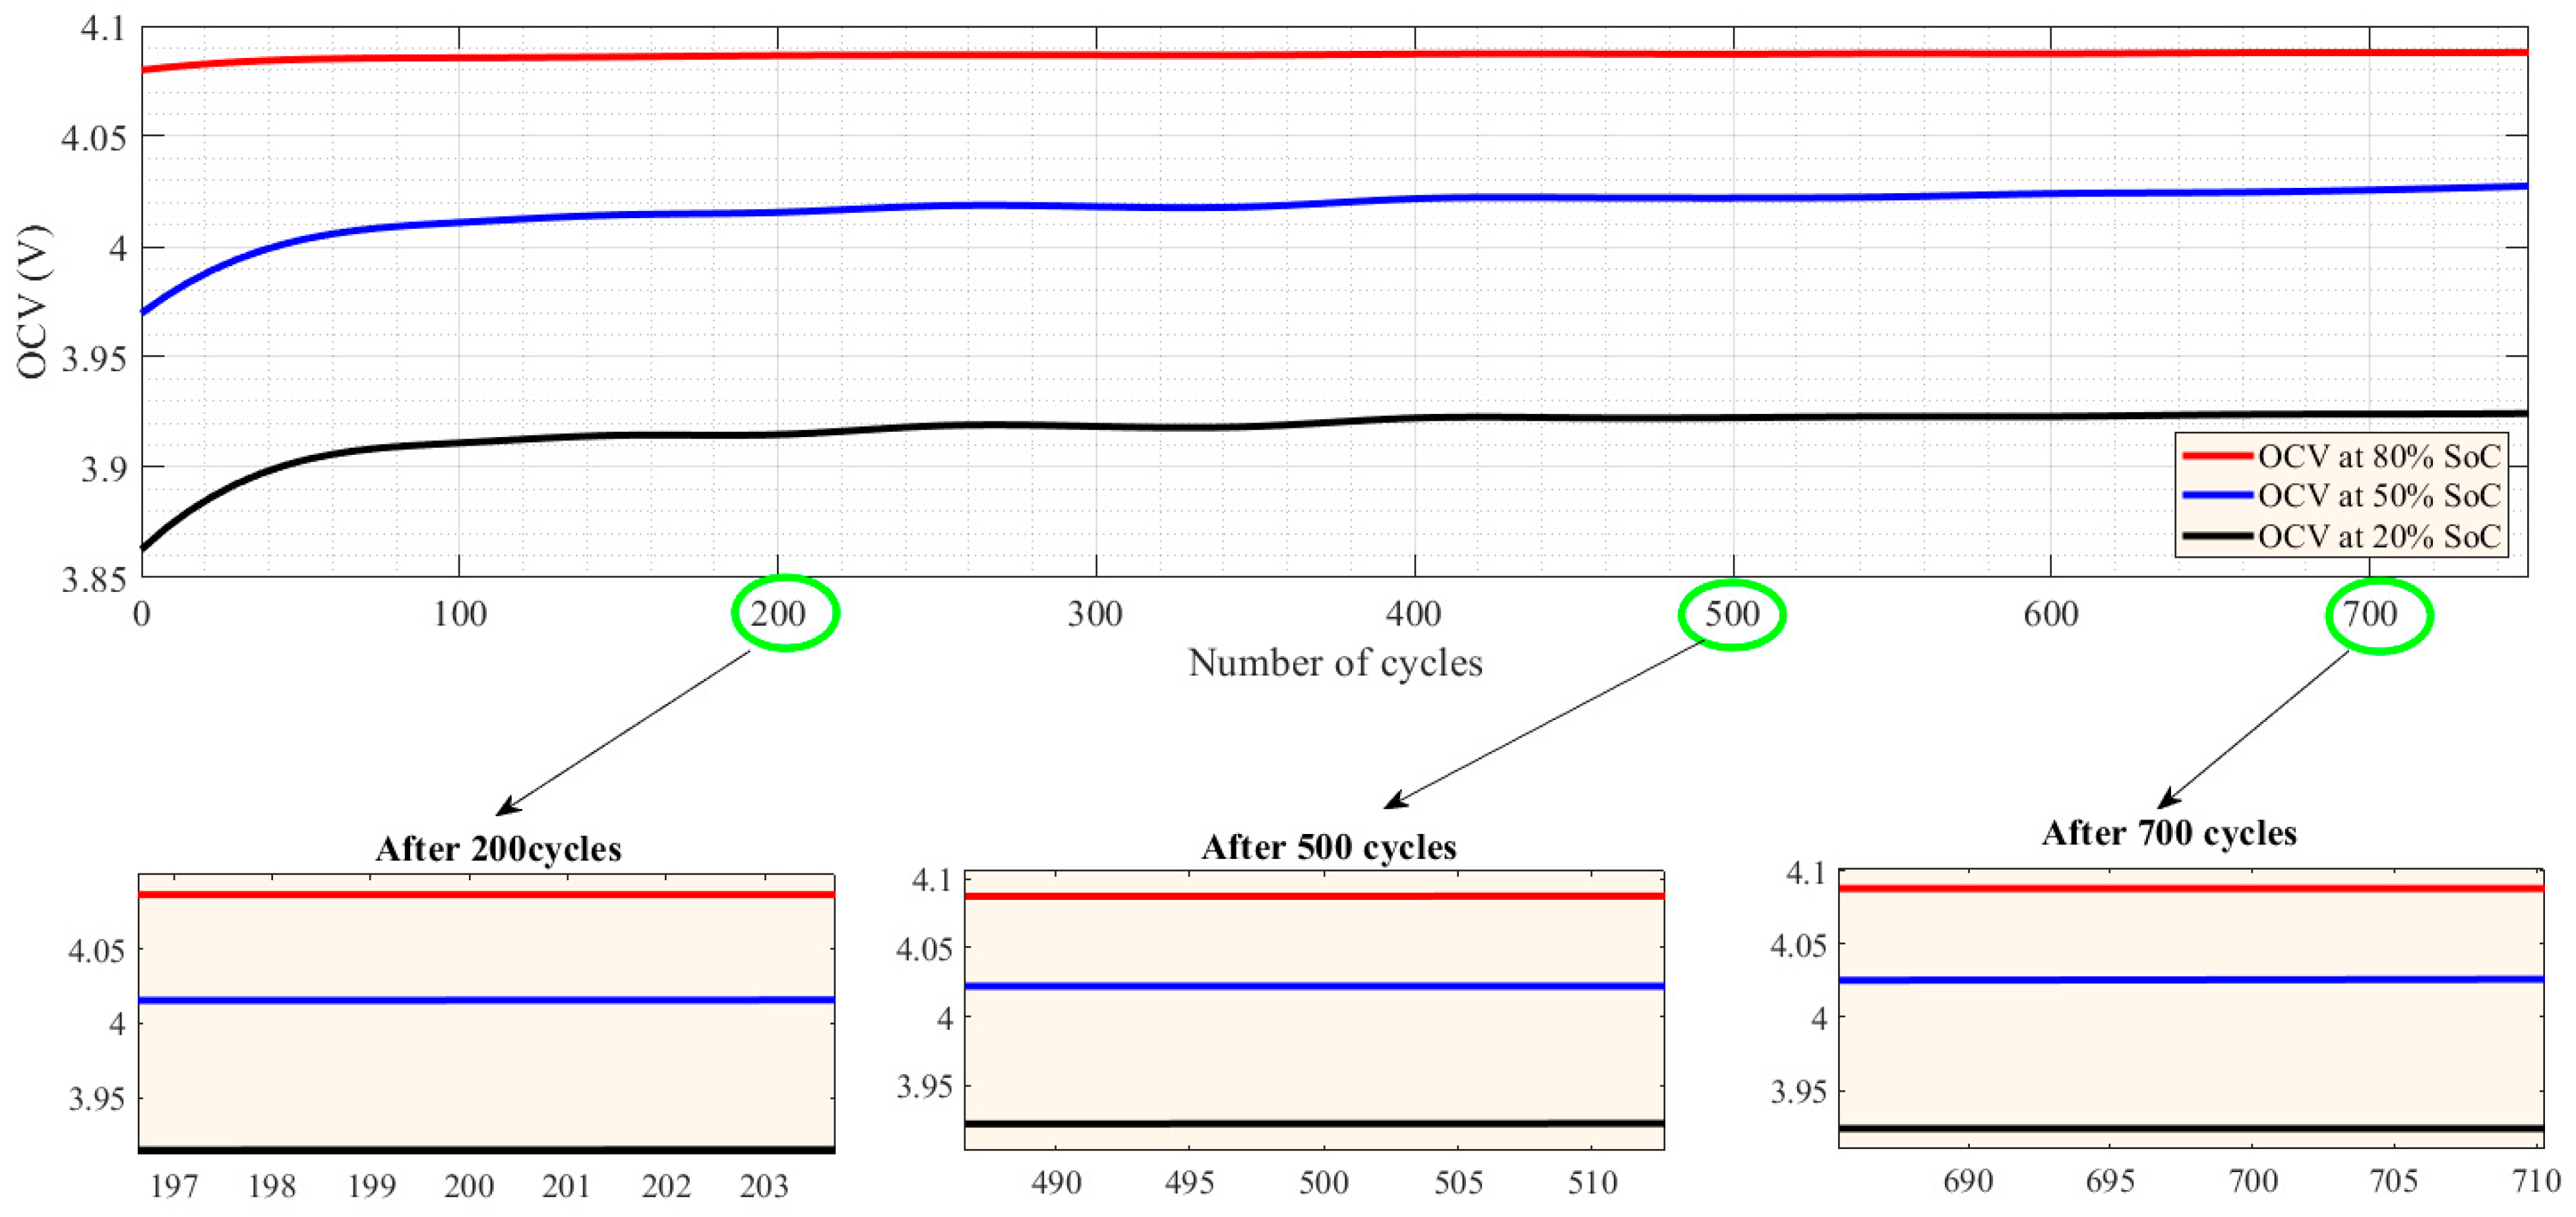
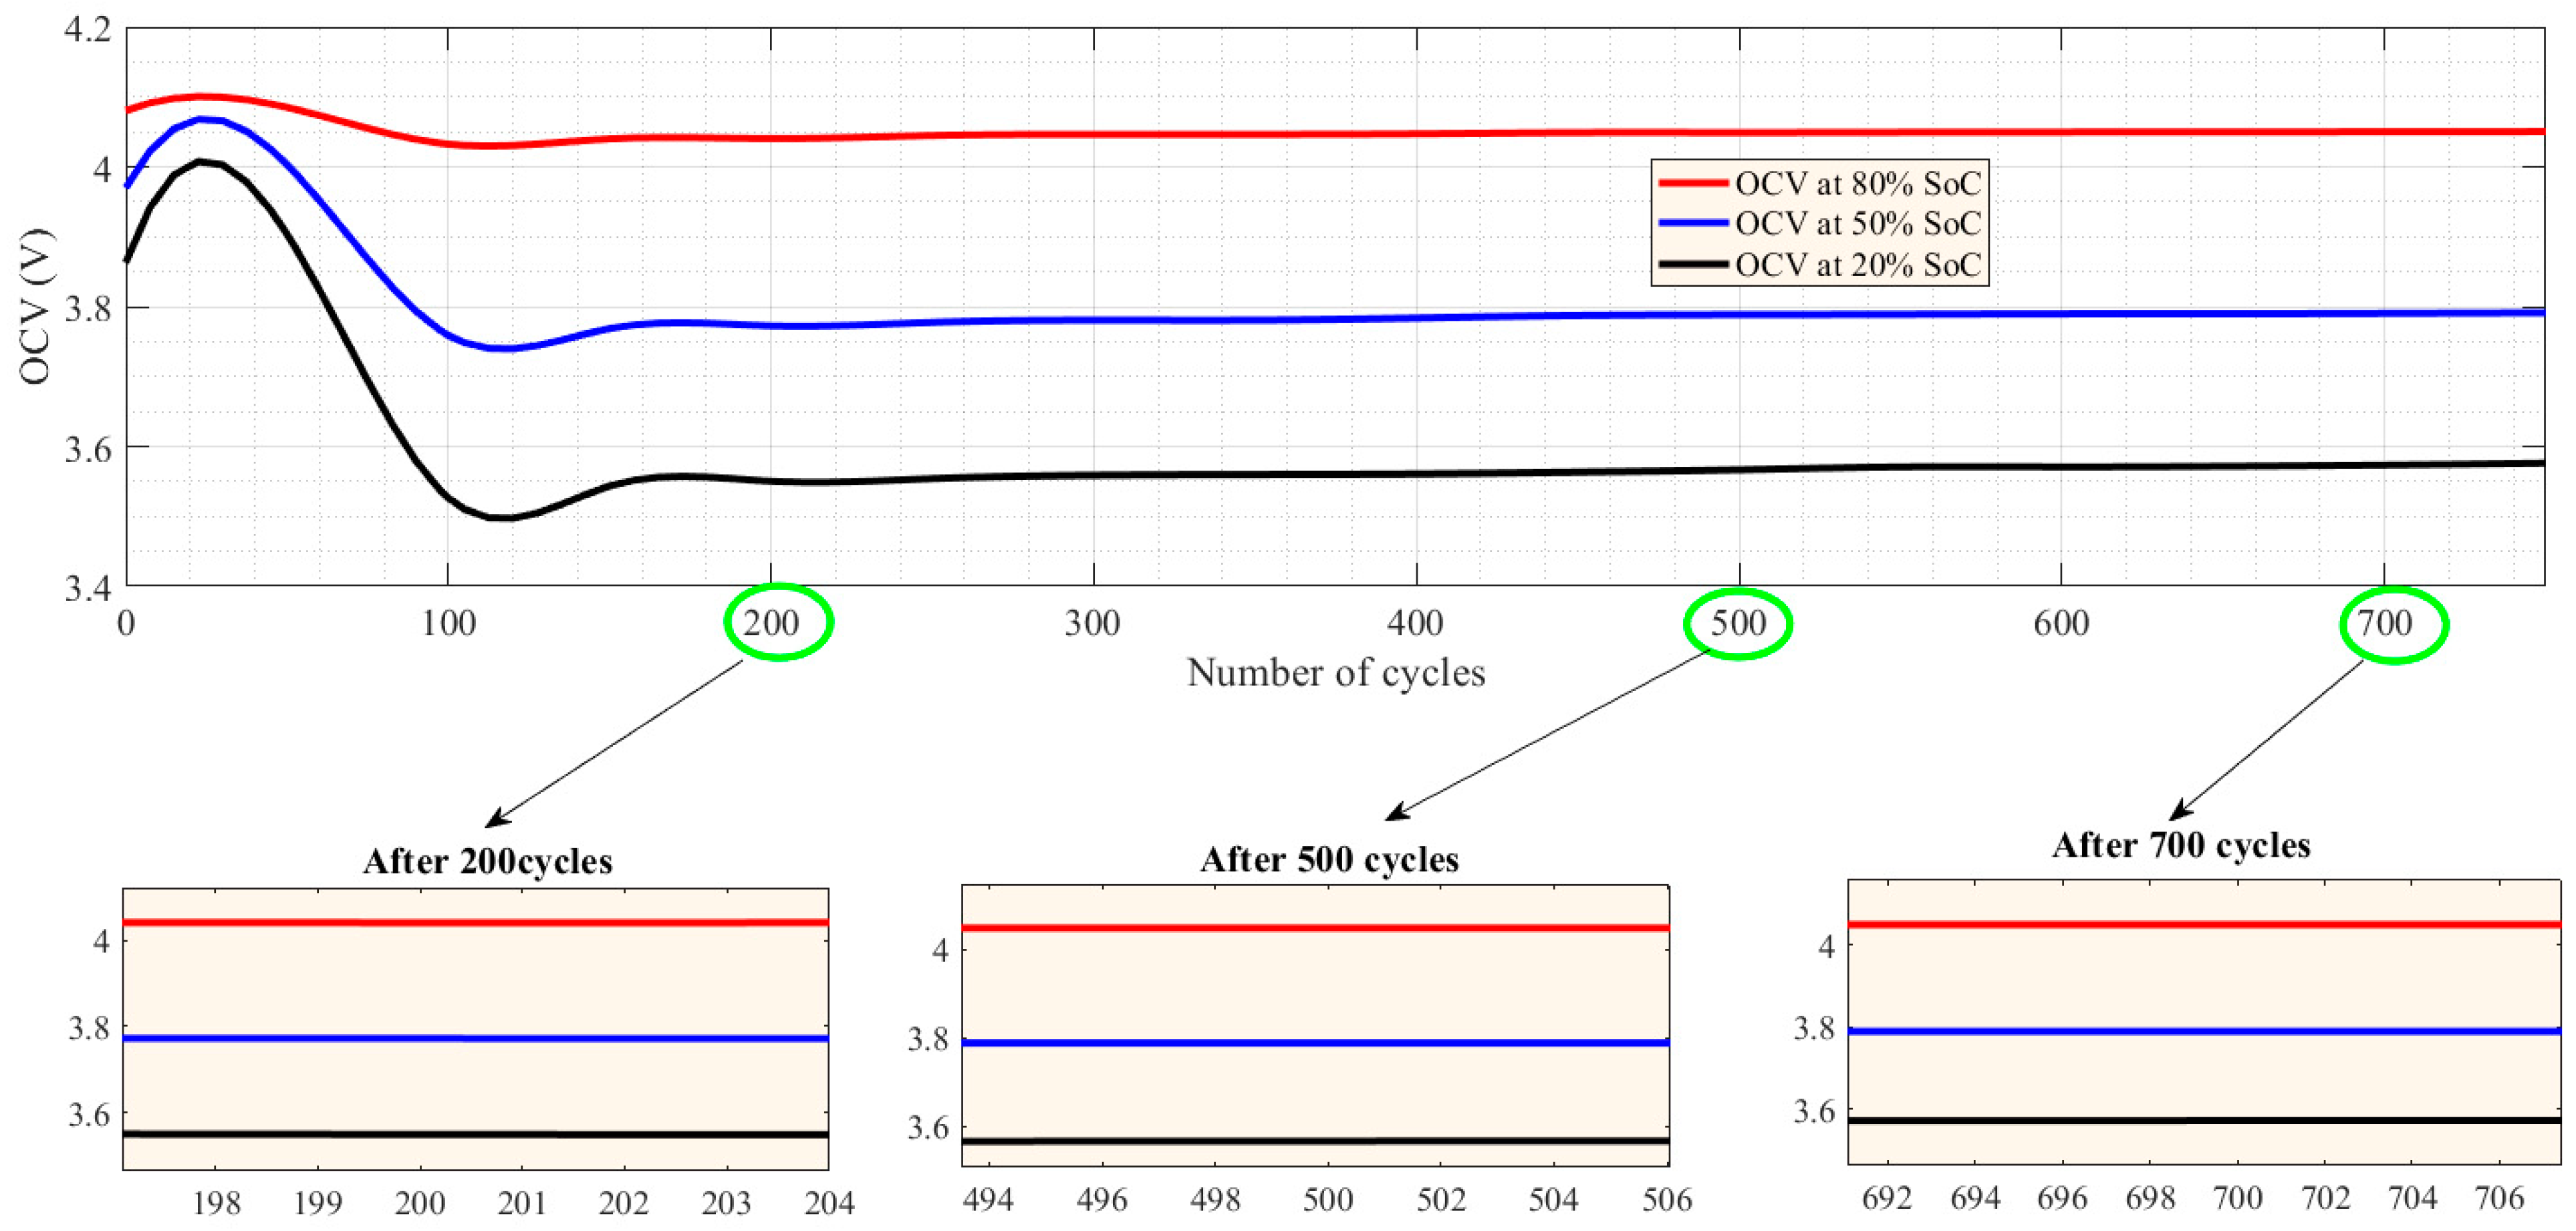
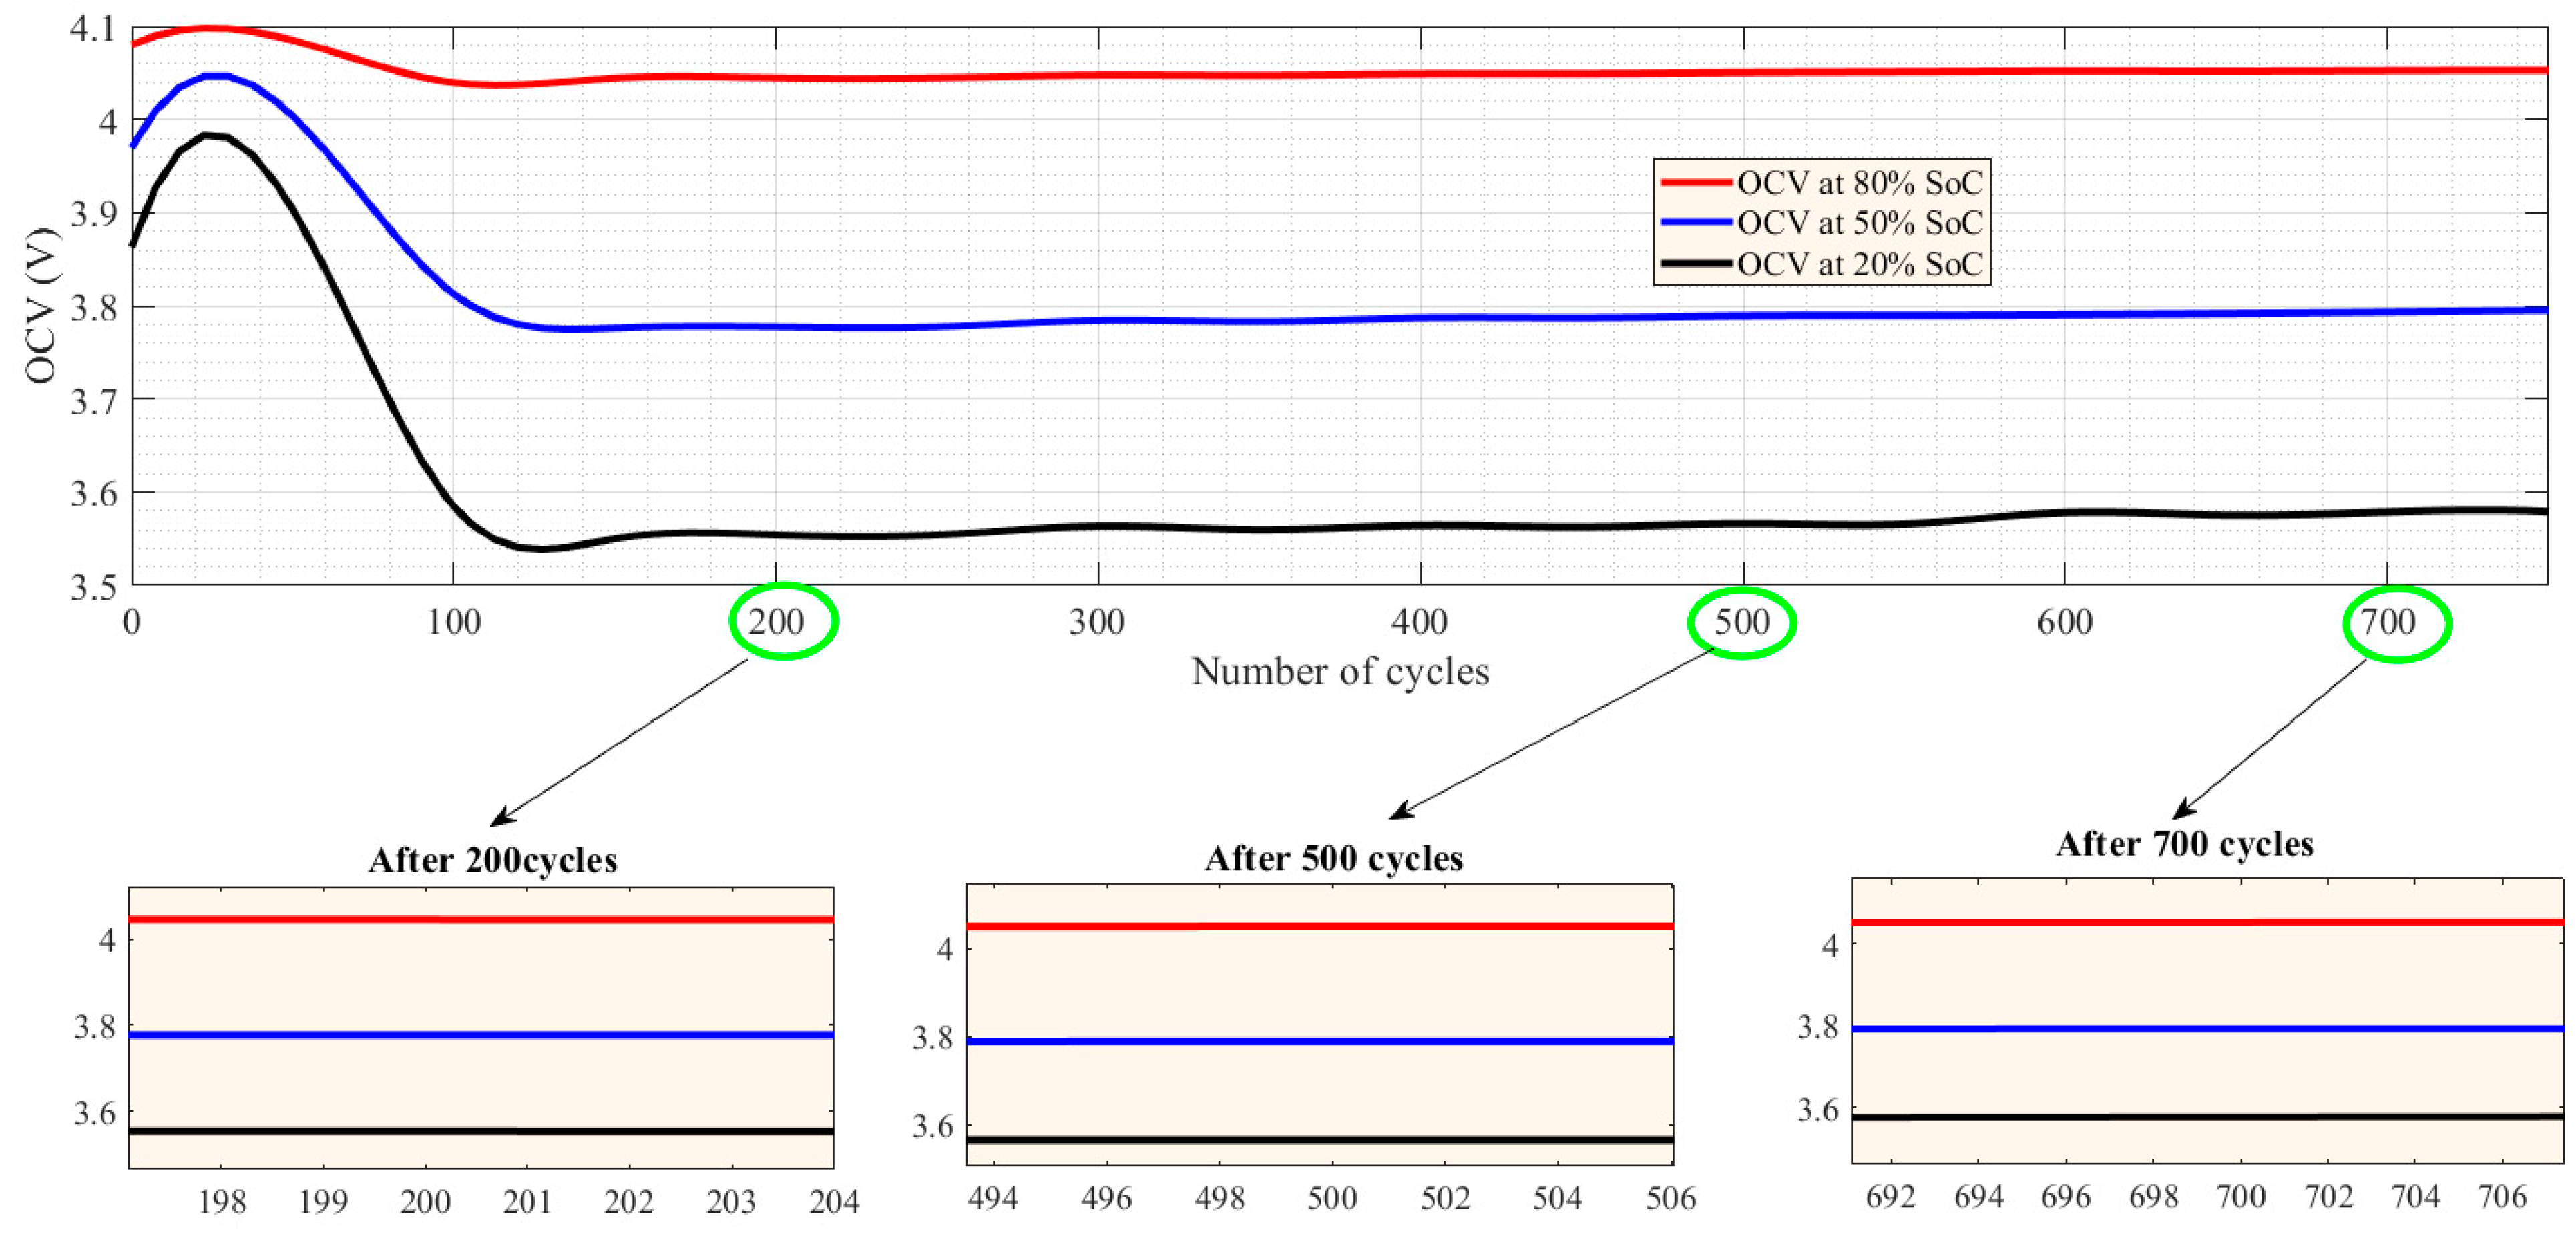
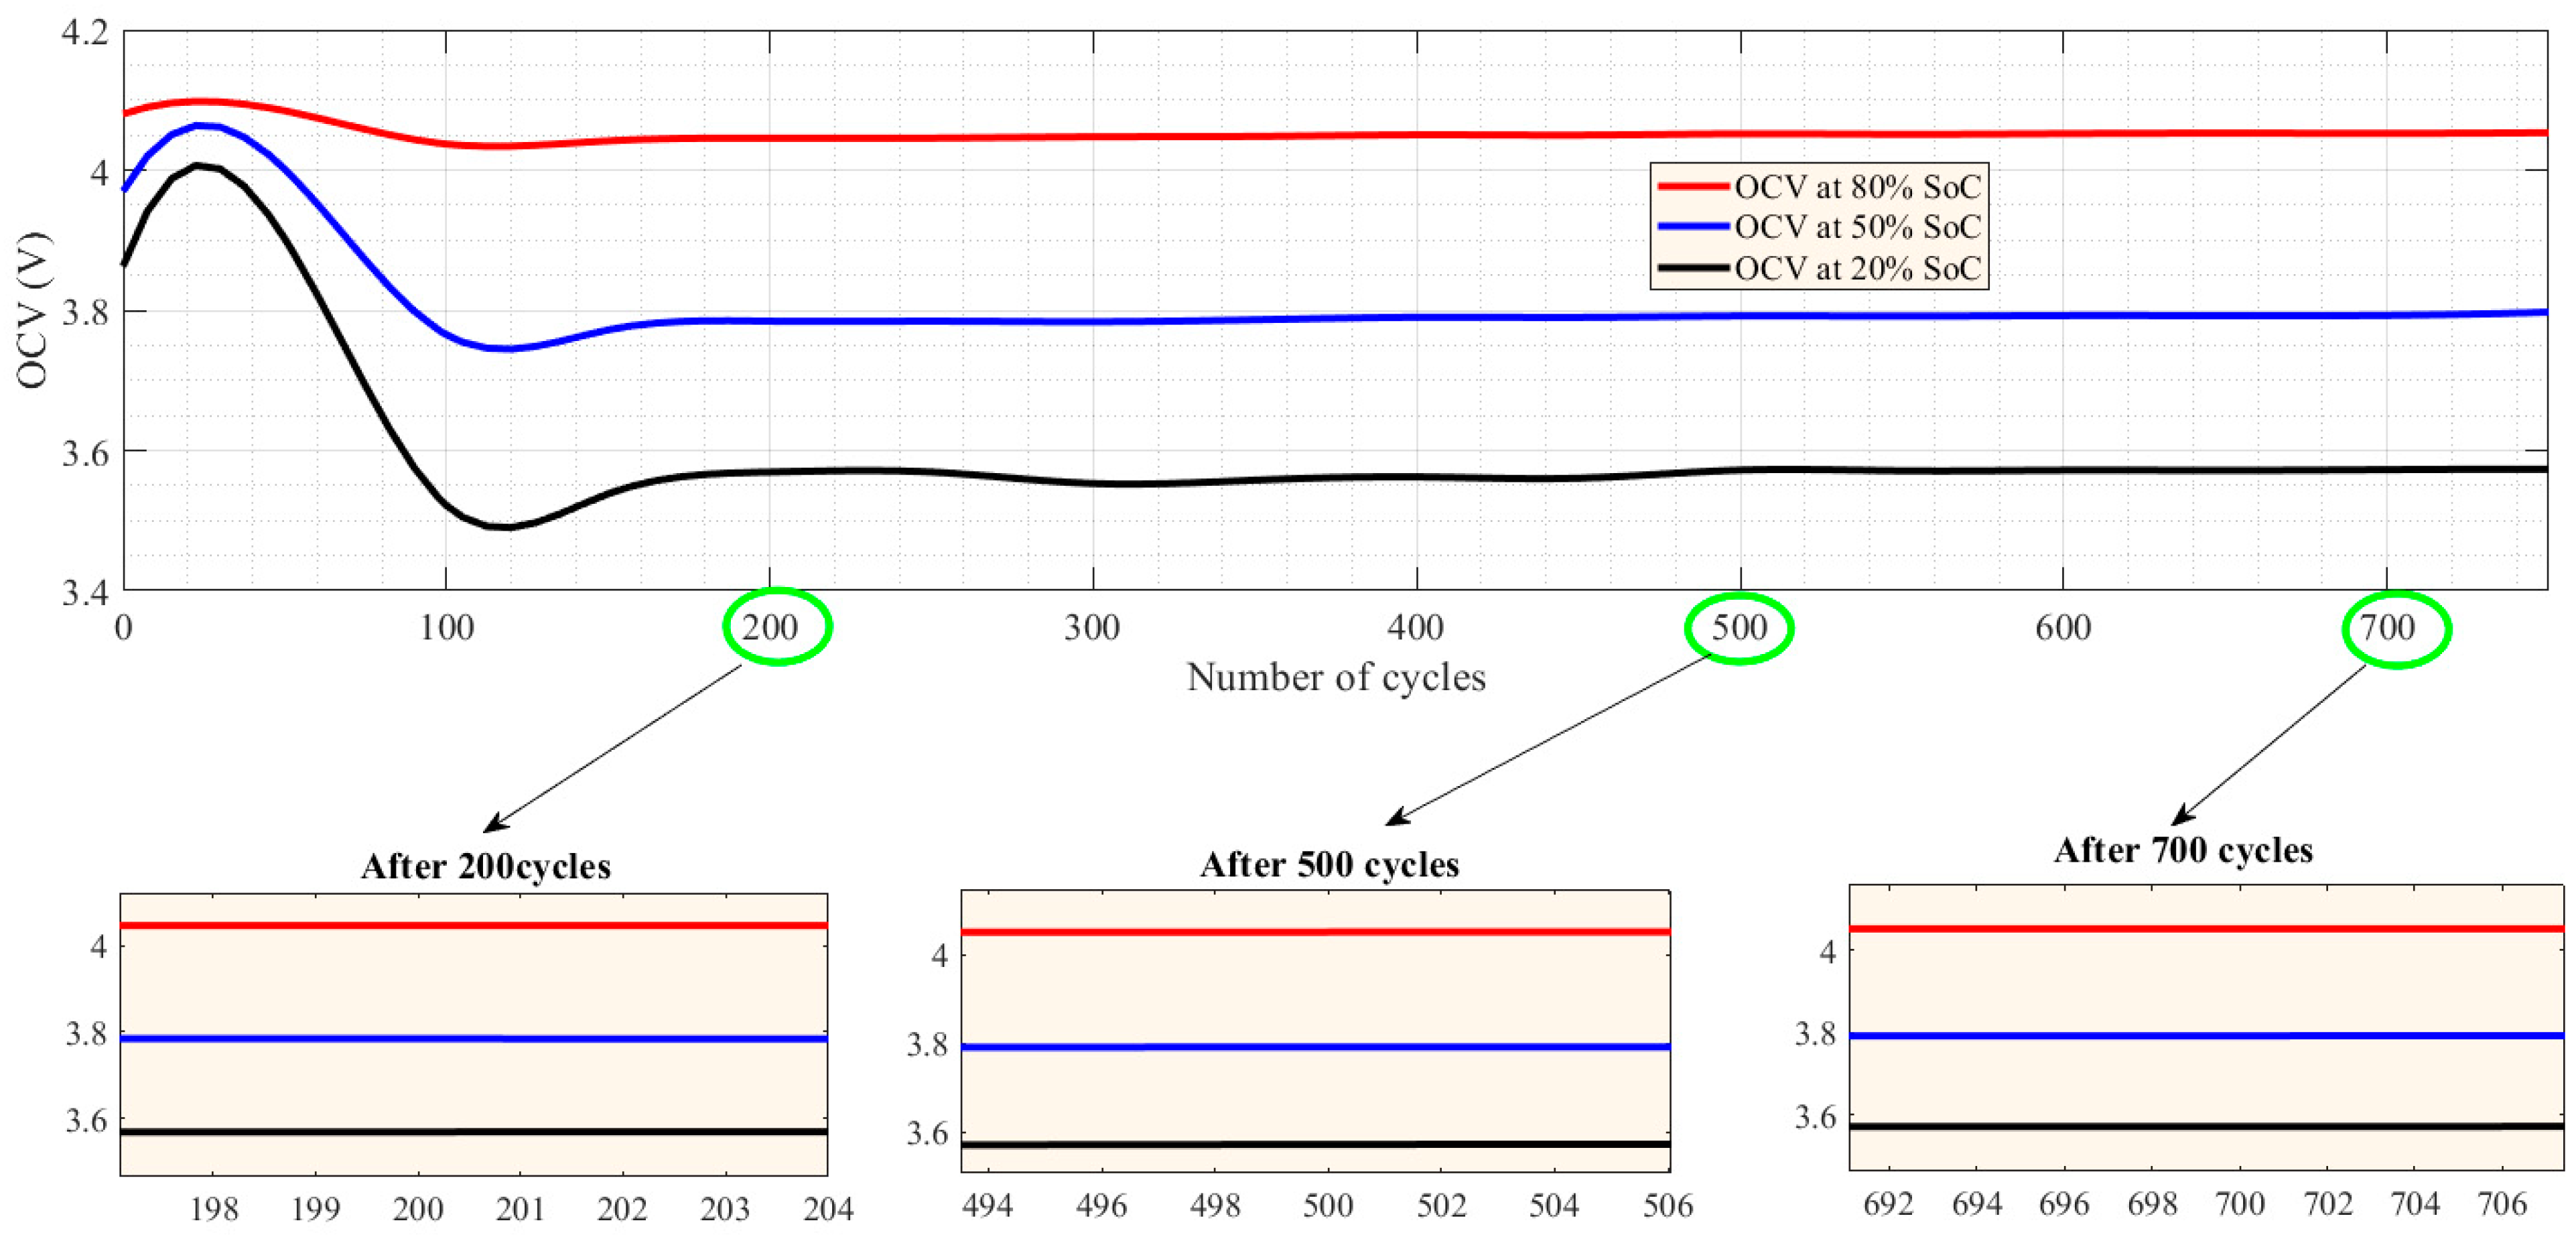
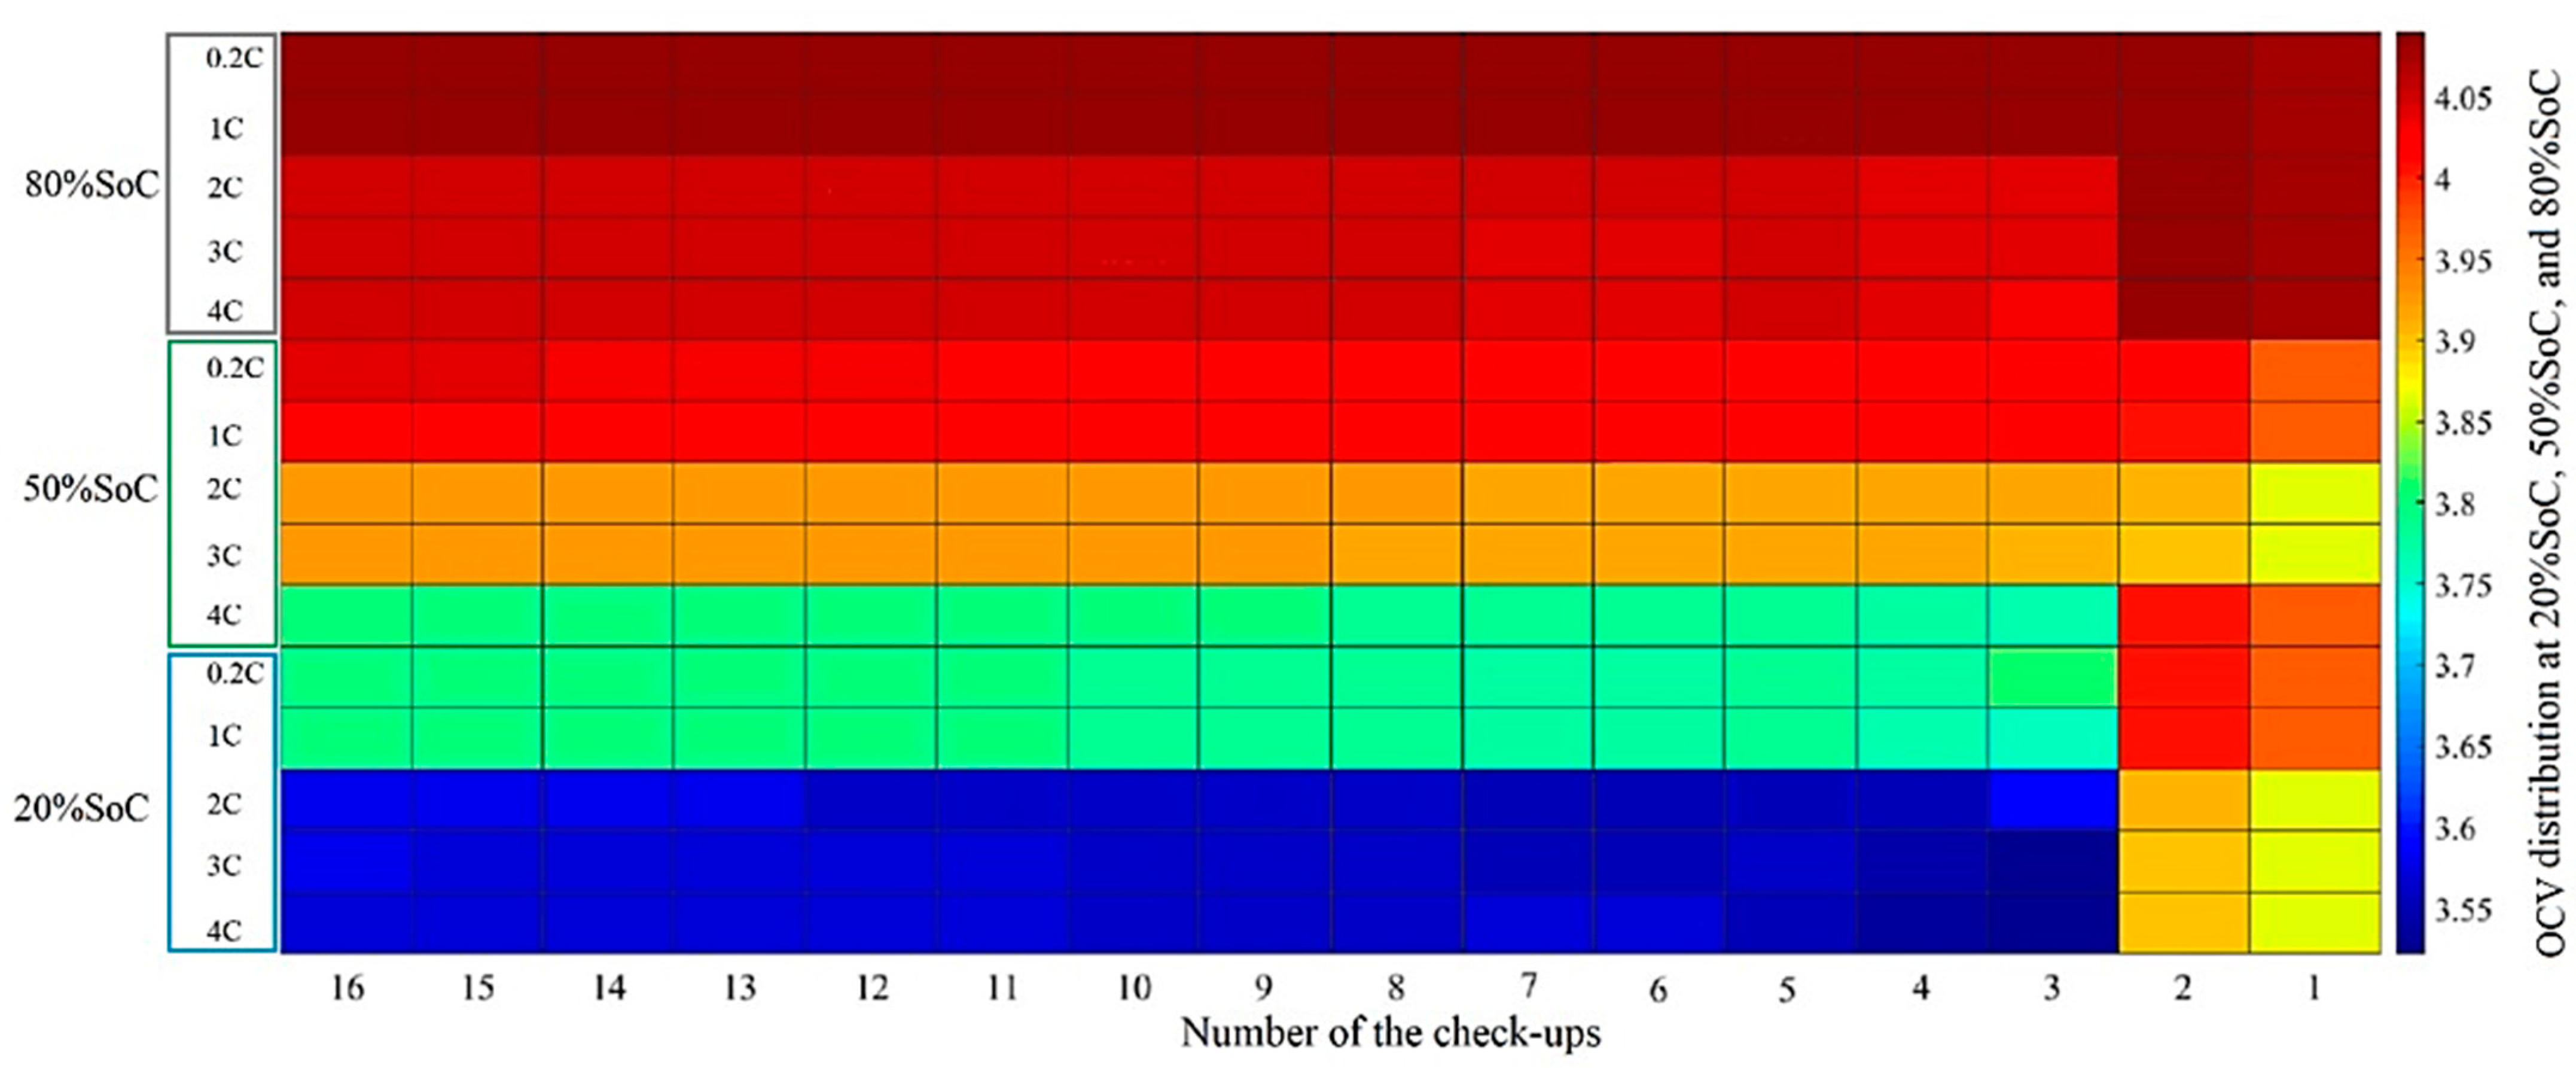
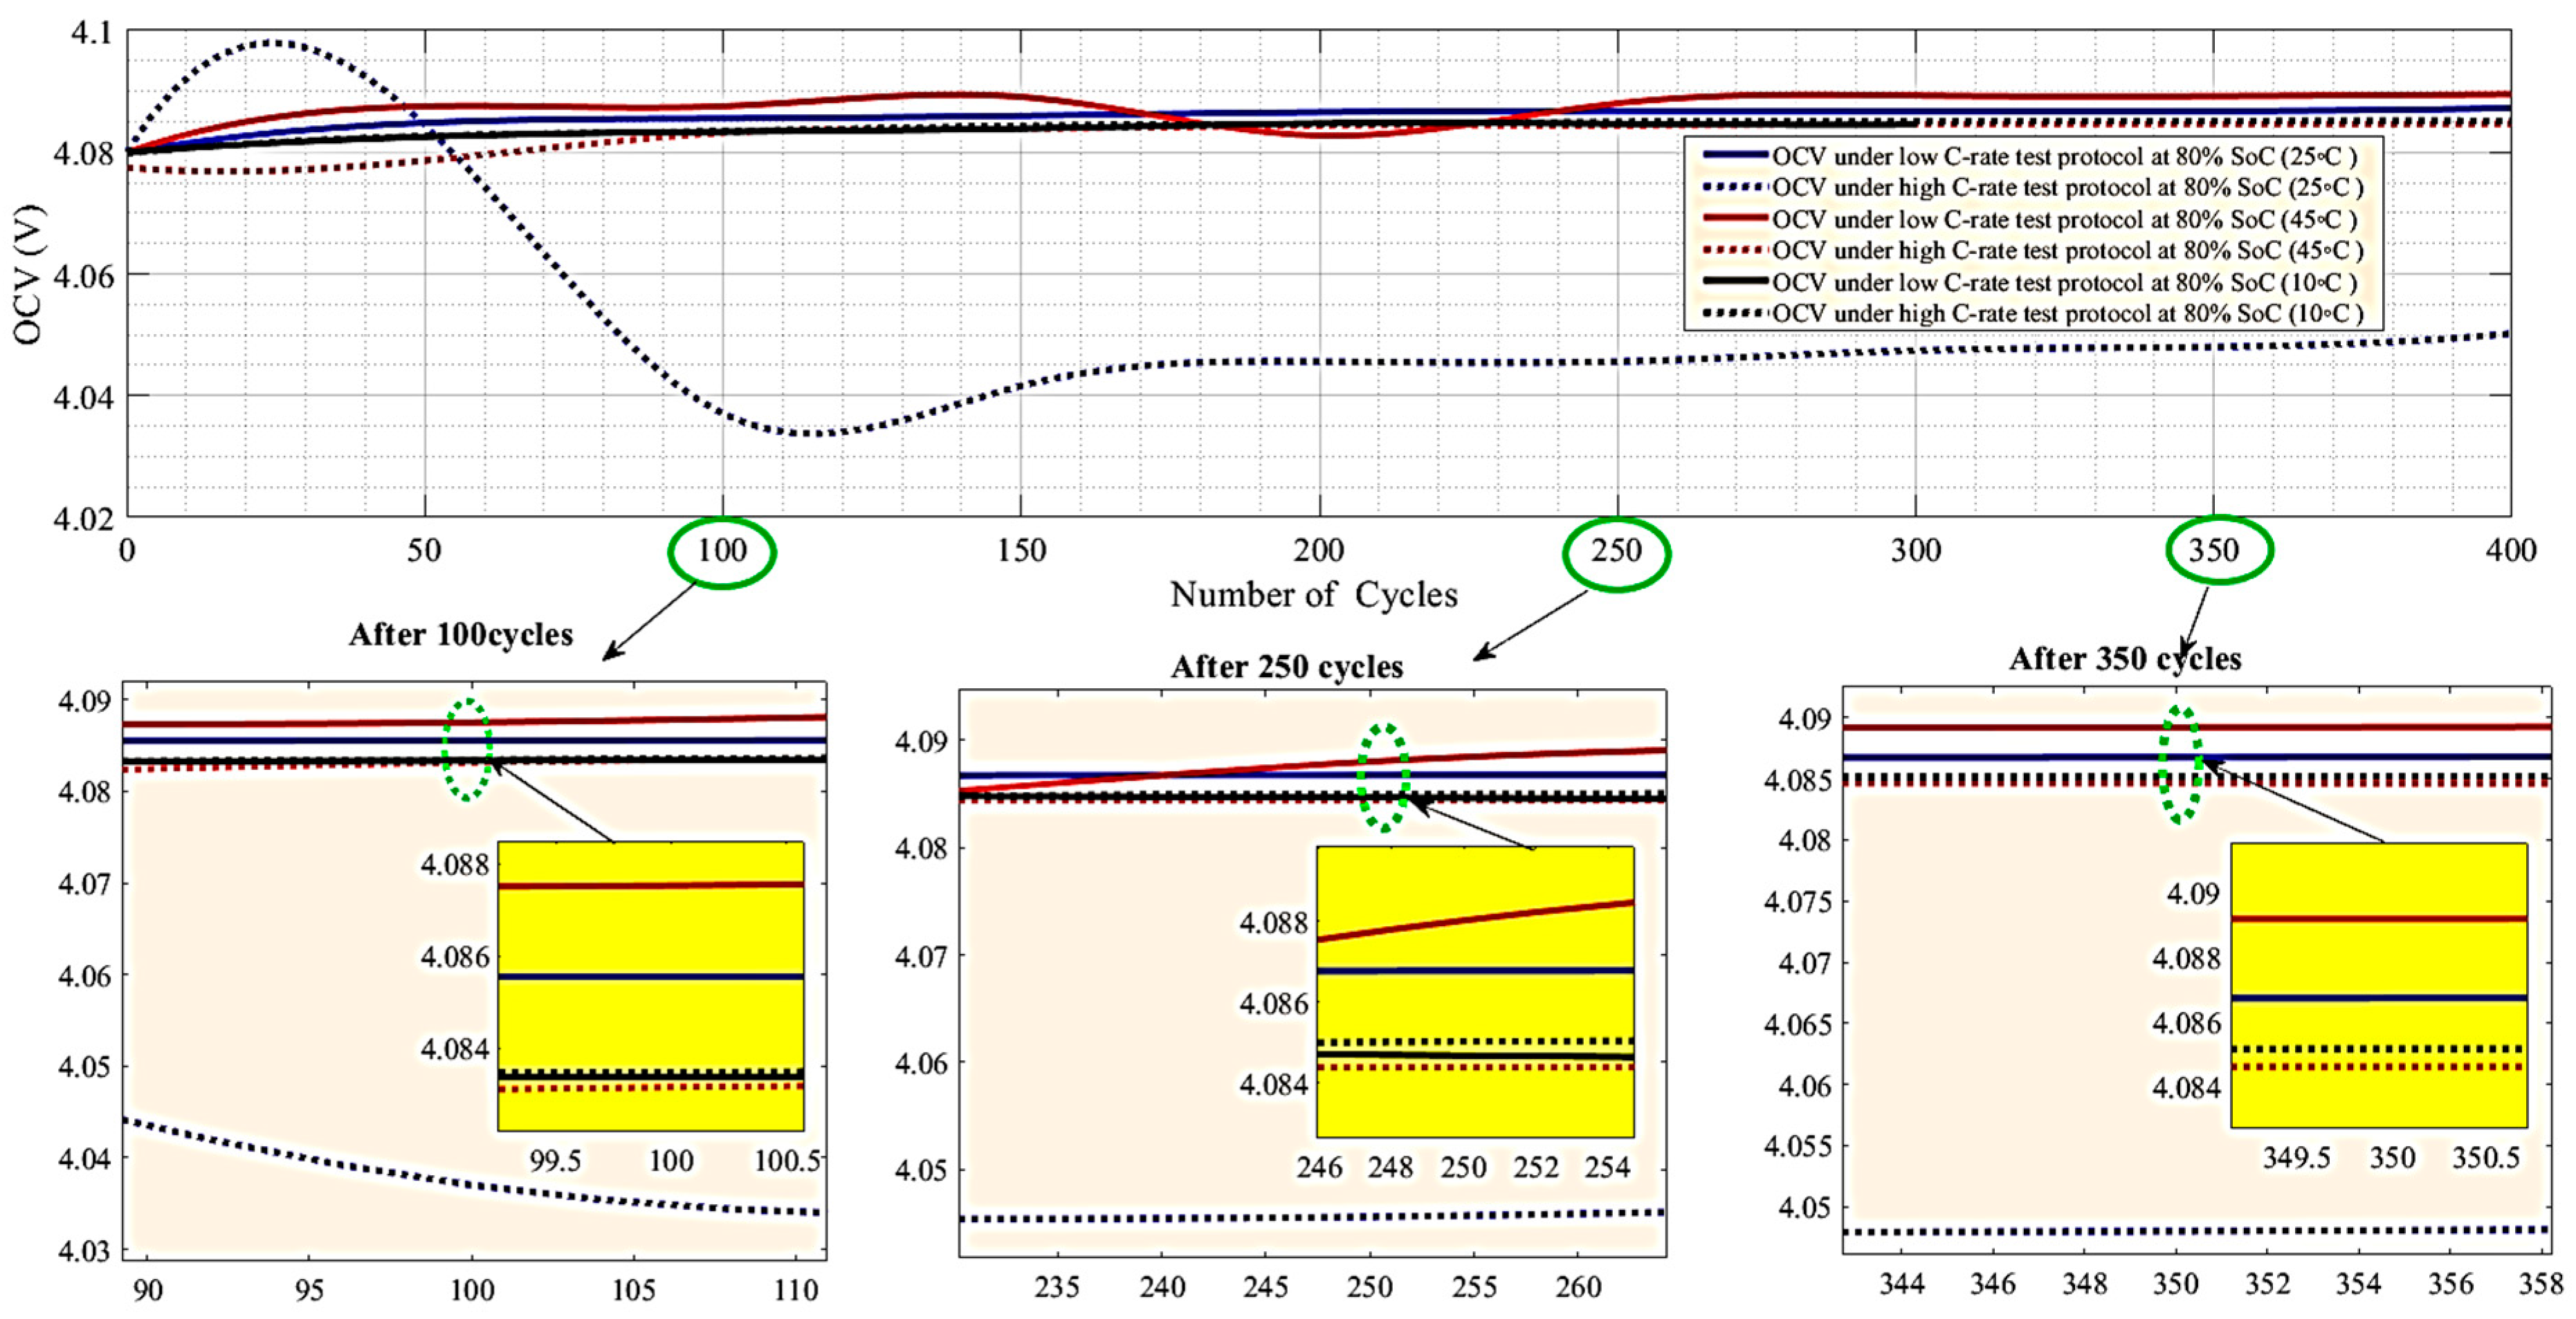
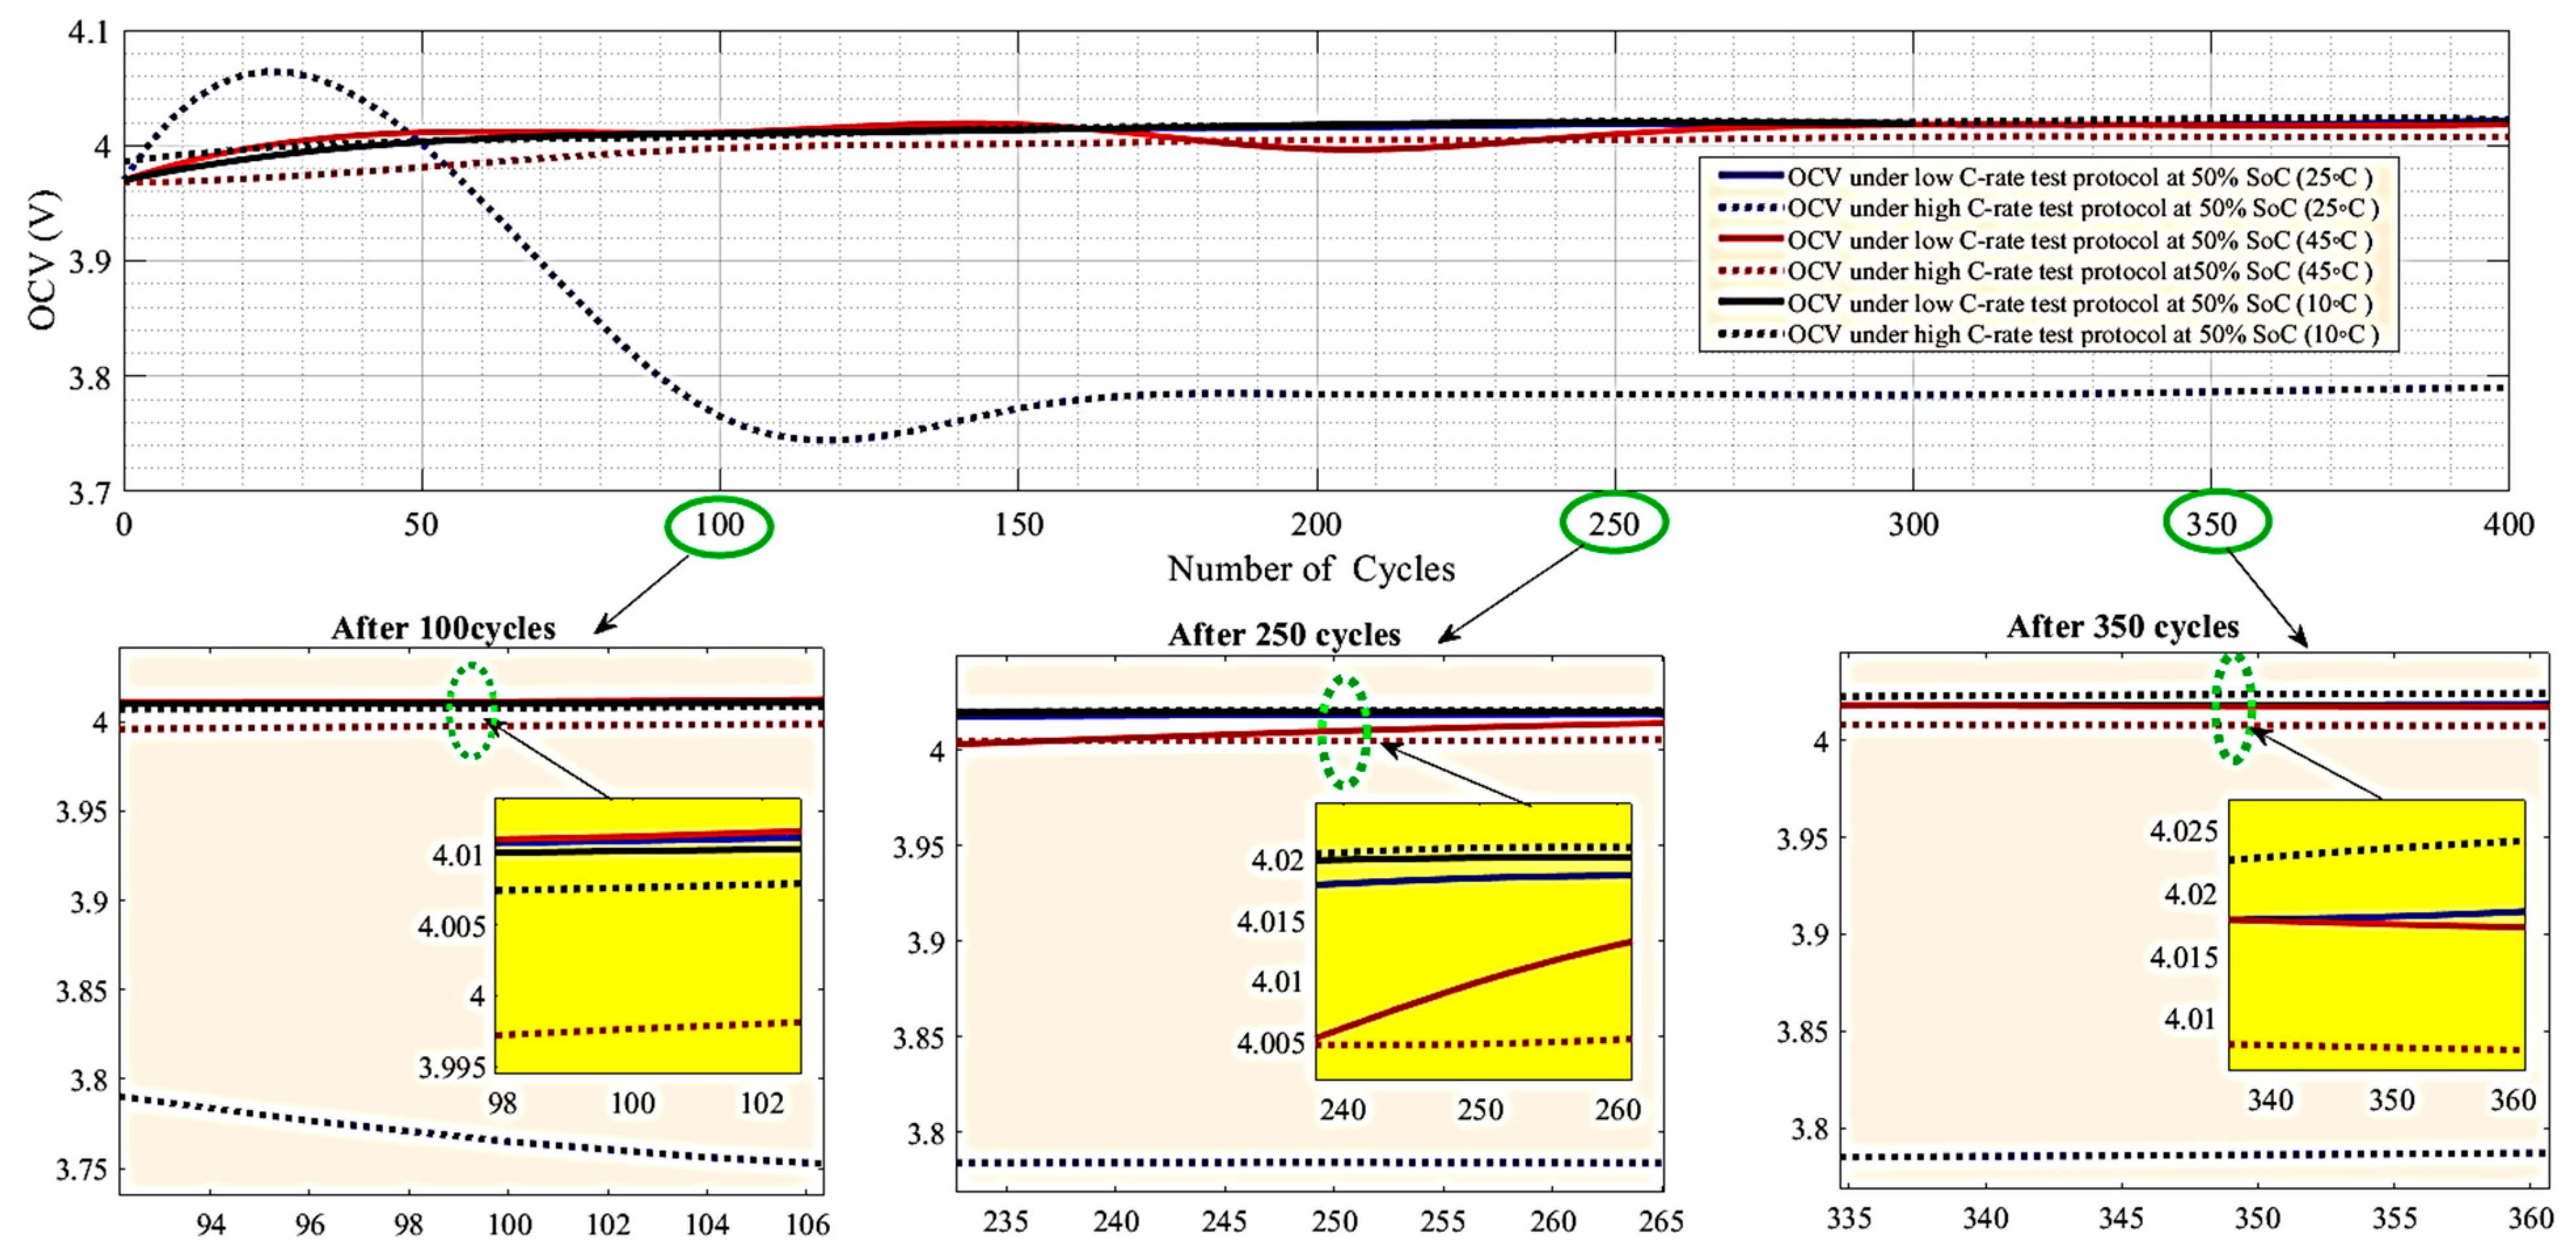
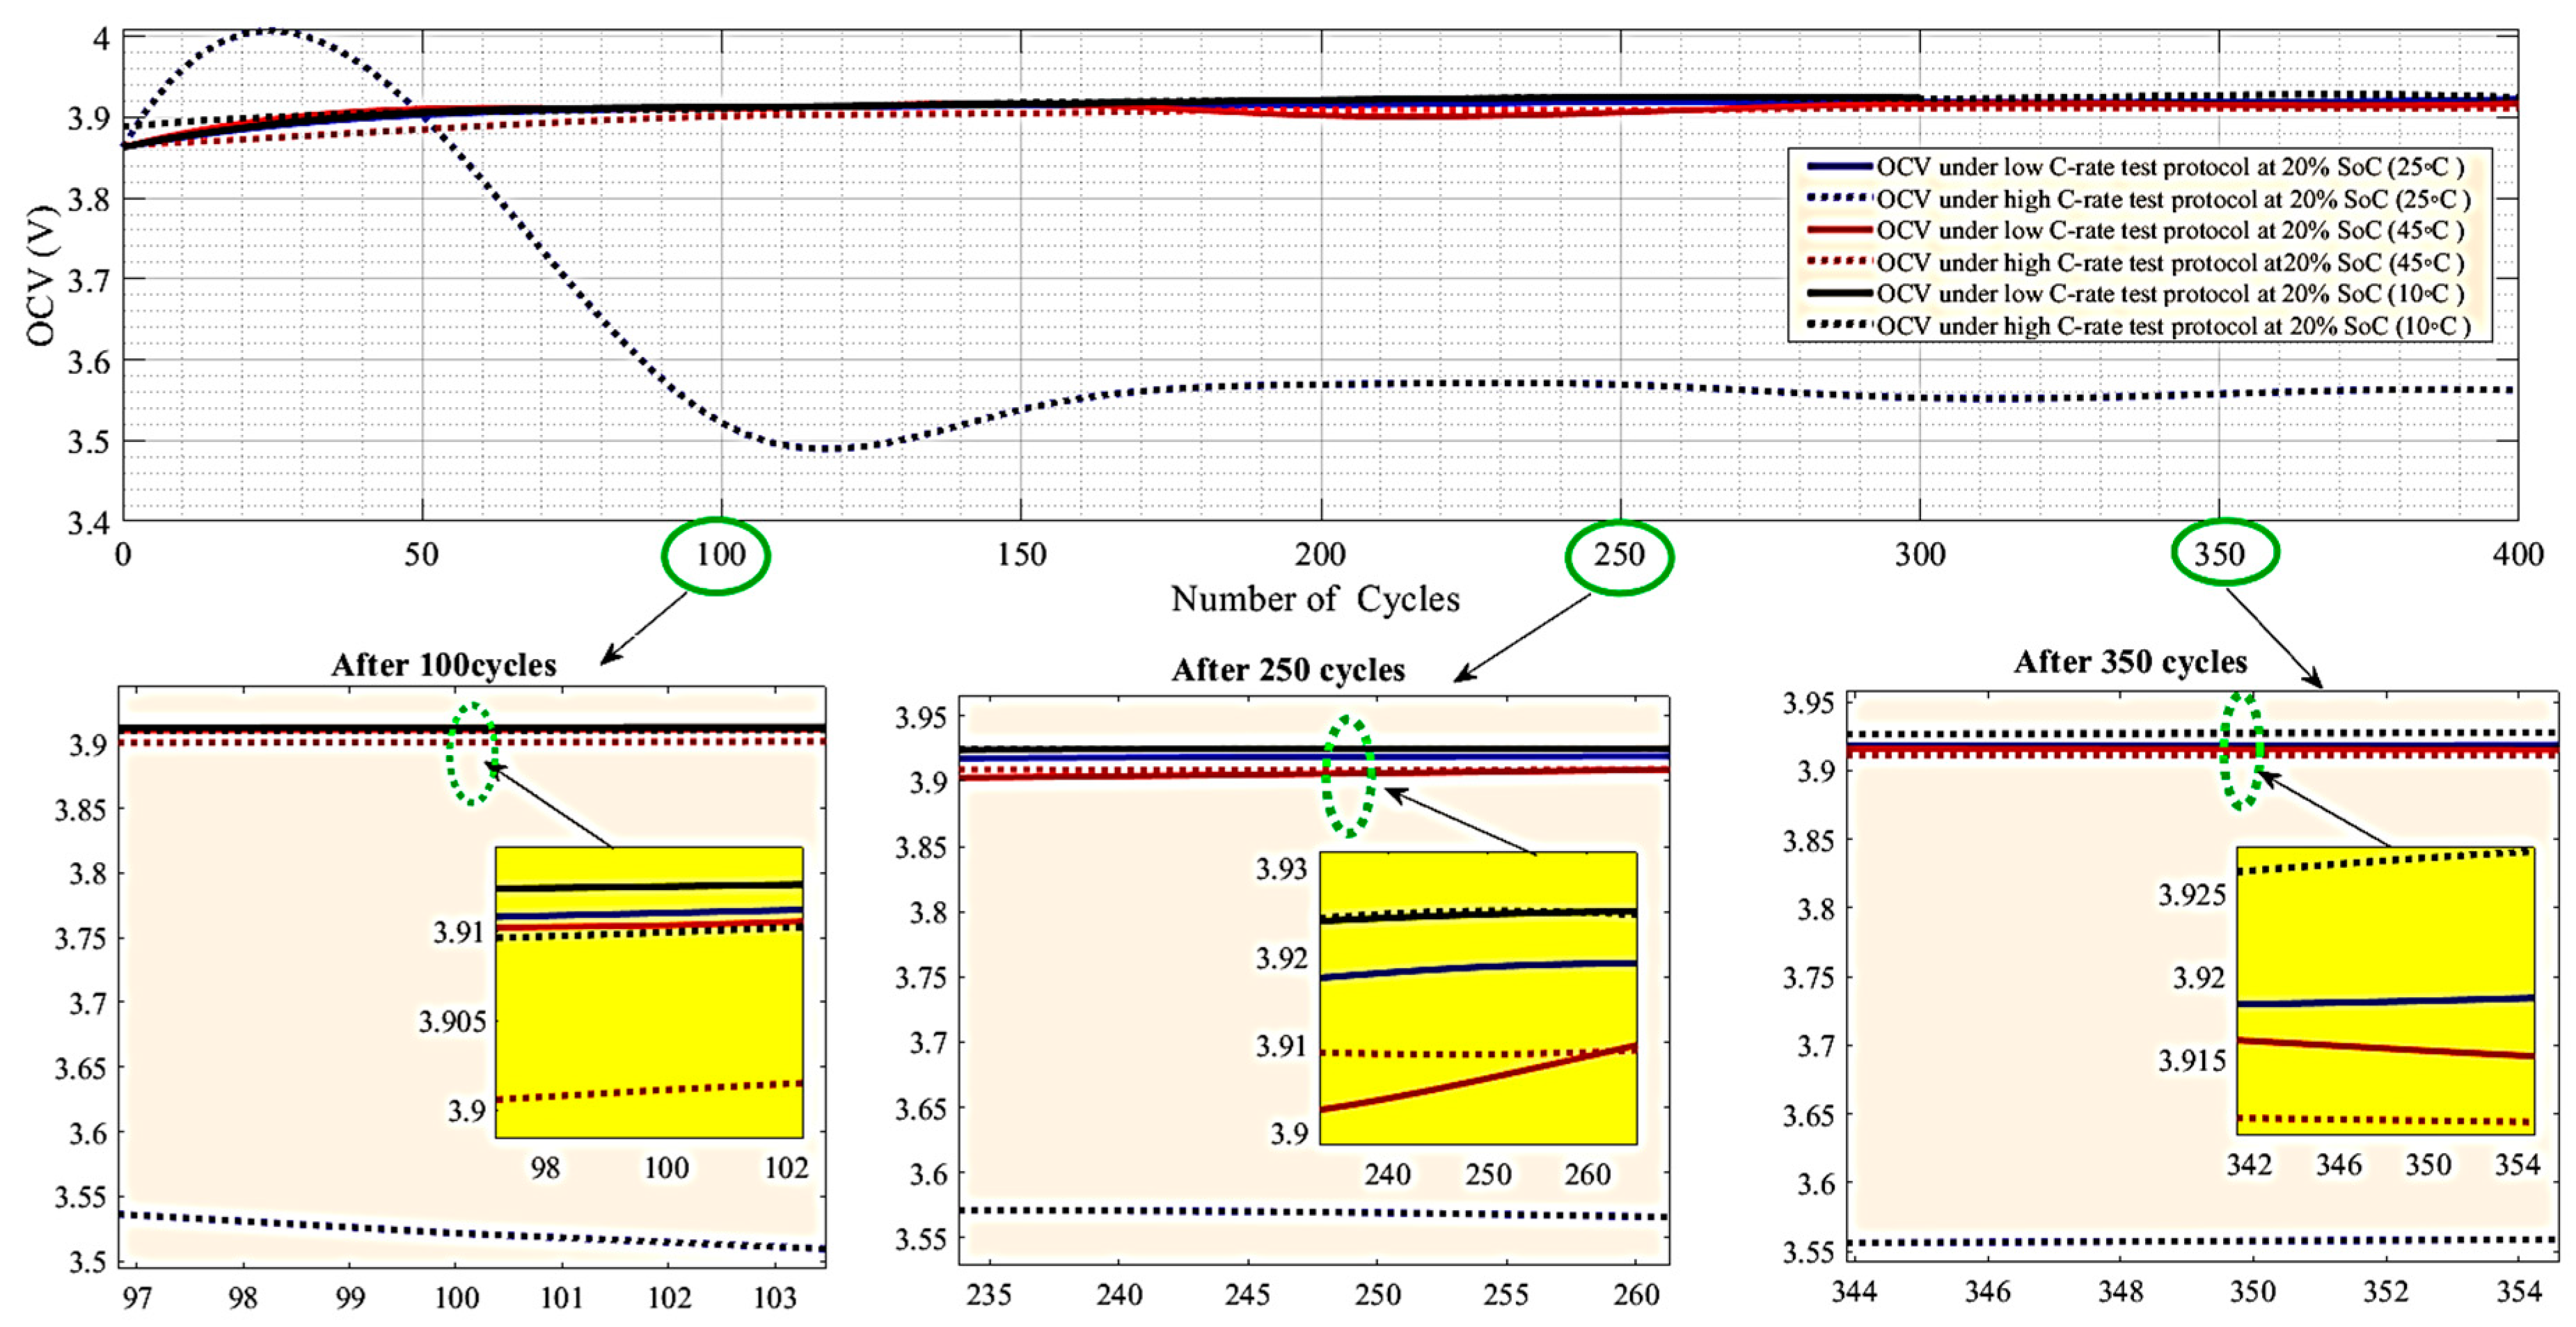
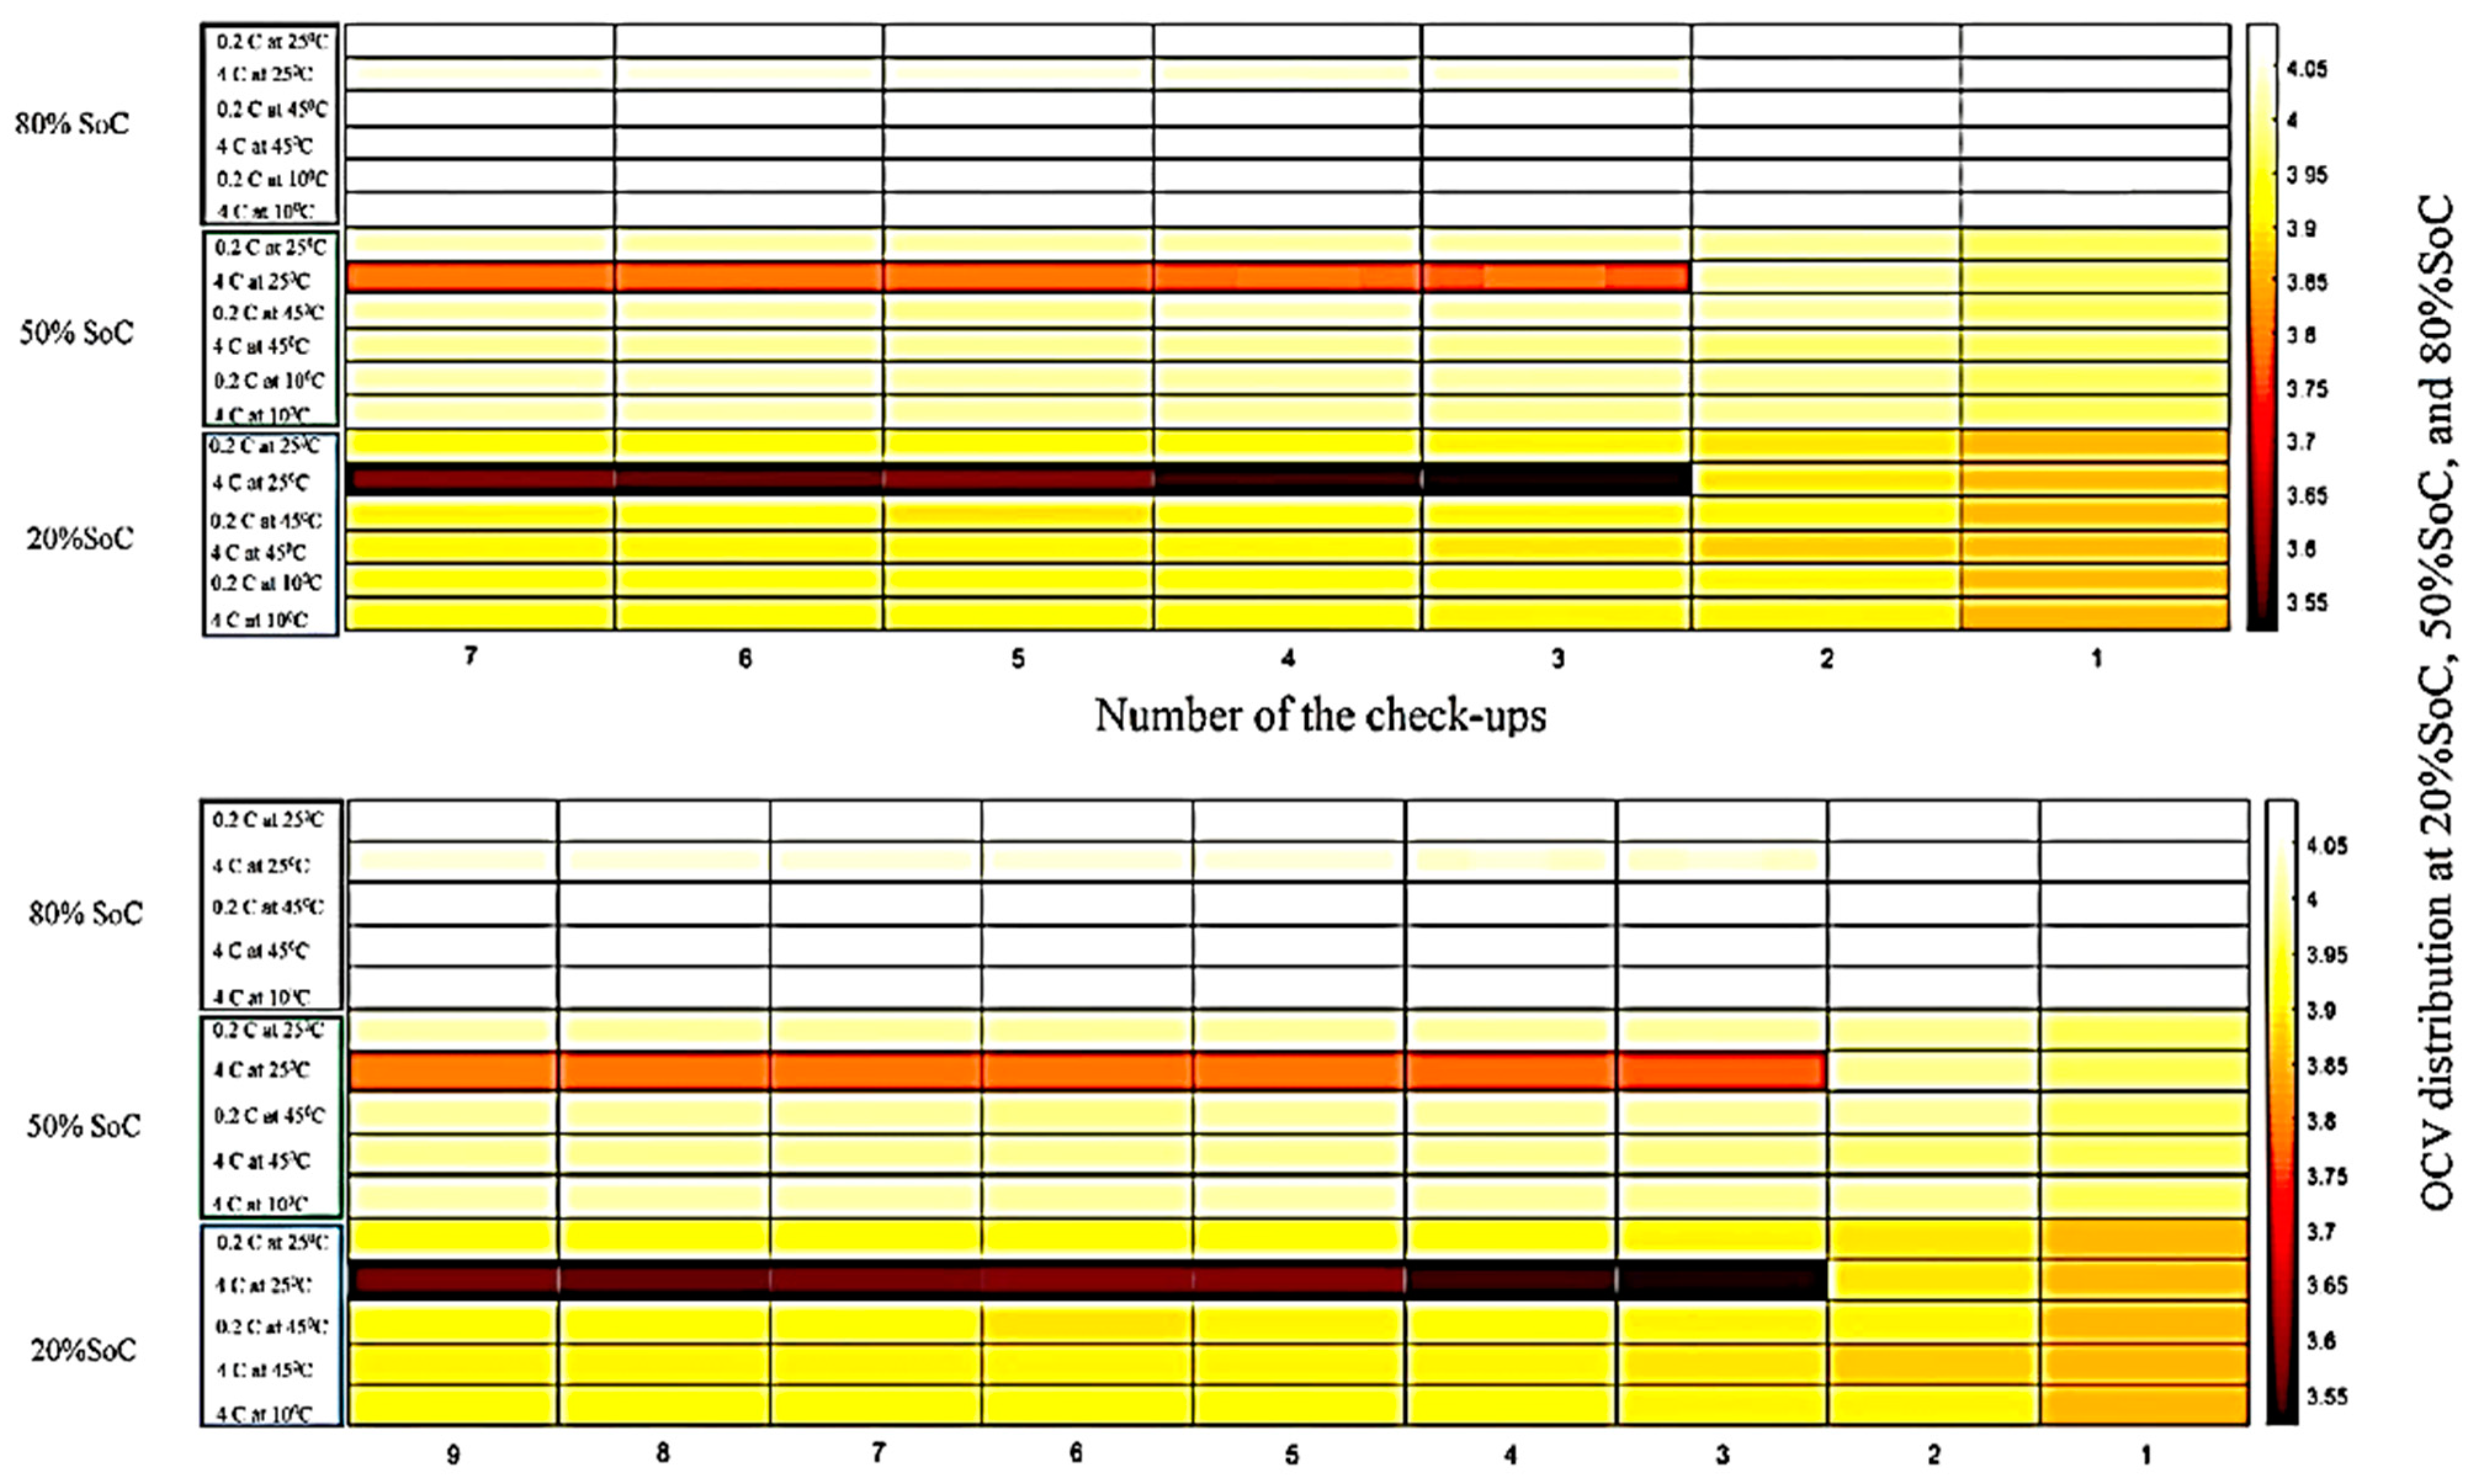
3. Investigation of Voltage Variations of a Li-Ion Battery under Different Temperatures (OCV Test)
4. Results and Discussion under Charge–Discharge Standard Test Protocols (STPs) at Different Temperatures
5. Conclusions
Author Contributions
Funding
Institutional Review Board Statement
Informed Consent Statement
Data Availability Statement
Acknowledgments
Conflicts of Interest
List of Abbreviations
| BMS | Battery management system |
| C | Carbon |
| C-rate = 1C | Nominal output/input current of battery in one hour |
| EV | Electric vehicle |
| OCV | Open-circuit voltage |
| SoC | State of charge |
| SoE | Safe operating envelope |
| SoH | State of health |
| SoP | State of power |
| STPs | Standard test protocols |
| KF | Kalman filter |
| LFP | Lithium-Ion-Phosphate |
| Li-ion | Lithium-ion |
| Li-S | Lithium-Sulfur |
| LMO | Lithium-Ion Manganese Oxide |
| LTO | Lithium Titanium Oxide |
| NCA | Nickel-Cobalt-Aluminum-Oxide |
| NMC | Nickel-Manganese-Cobalt |
| Vmin | Lower voltage safety limit |
| Vmax | Upper voltage safety limit |
References
- Ćalasan, M.; Zobaa, A.F.; Hasanien, H.M.; Abdel Aleem, S.H.E.; Ali, Z.M. Towards accurate calculation of supercapacitor electrical variables in constant power applications using new analytical closed-form expressions. J. Energy Storage 2021, 42, 102998. [Google Scholar] [CrossRef]
- Mostafa, M.H.; Abdel Aleem, S.H.E.; Ali, S.G.; Ali, Z.M.; Abdelaziz, A.Y. Techno-economic assessment of energy storage systems using annualized life cycle cost of storage (LCCOS) and levelized cost of energy (LCOE) metrics. J. Energy Storage 2020, 29, 101345. [Google Scholar] [CrossRef]
- Gandoman, F.H.; Ahmed, E.M.; Ali, Z.M.; Berecibar, M.; Zobaa, A.F.; Abdel Aleem, S.H.E. Reliability evaluation of lithium-ion batteries for e-mobility applications from practical and technical perspectives: A case study. Sustainability 2021, 13, 11688. [Google Scholar] [CrossRef]
- Ranieri, M.; Alberto, D.; Piret, H.; Cattin, V. Electronic module for the thermal monitoring of a Li-ion battery cell through the electrochemical impedance estimation. Microelectron. Reliab. 2017, 79, 410–415. [Google Scholar] [CrossRef]
- Zhou, X.; Stein, J.L.; Ersal, T. Battery state of health monitoring by estimation of the number of cyclable Li-ions. Control Eng. Pract. 2017, 66, 51–63. [Google Scholar] [CrossRef]
- Brunner, D.; Prasad, A.K.; Advani, S.G.; Peticolas, B.W. A robust cell voltage monitoring system for analysis and diagnosis of fuel cell or battery systems. J. Power Sources 2010, 195, 8006–8012. [Google Scholar] [CrossRef]
- Wang, S.L.; Fernandez, C.; Zou, C.Y.; Yu, C.M.; Li, X.X.; Pei, S.J.; Xie, W. Open circuit voltage and state of charge relationship functional optimization for the working state monitoring of the aerial lithium-ion battery pack. J. Clean. Prod. 2018, 198, 1090–1104. [Google Scholar] [CrossRef]
- Xie, S.; Ren, L.; Gong, Y.; Li, M.; Chen, X. Effect of Charging/Discharging Rate on the Thermal Runaway Characteristics of Lithium-Ion Batteries in Low Pressure. J. Electrochem. Soc. 2020, 167, 140503. [Google Scholar] [CrossRef]
- Lu, Z.; Yu, X.; Zhang, L.; Meng, X.; Wei, L.; Jin, L. Experimental investigation on the charge-discharge performance of the commercial lithium-ion batteries. Energy Procedia 2017, 143, 21–26. [Google Scholar] [CrossRef]
- Yu, Q.; Xiong, R.; Lin, C.; Shen, W.; Deng, J. Lithium-Ion Battery Parameters and State-of-Charge Joint Estimation Based on H-Infinity and Unscented Kalman Filters. IEEE Trans. Veh. Technol. 2017, 66, 8693–8701. [Google Scholar] [CrossRef]
- Xiong, R.; Sun, F.; Gong, X.; He, H. Adaptive state of charge estimator for lithium-ion cells series battery pack in electric vehicles. J. Power Sources 2013, 242, 699–713. [Google Scholar] [CrossRef]
- Xiong, R.; Sun, F.; He, H.; Nguyen, T.D. A data-driven adaptive state of charge and power capability joint estimator of lithium-ion polymer battery used in electric vehicles. Energy 2013, 63, 295–308. [Google Scholar] [CrossRef]
- Lu, L.; Han, X.; Li, J.; Hua, J.; Ouyang, M. A review on the key issues for lithium-ion battery management in electric vehicles. J. Power Sources 2013, 226, 272–288. [Google Scholar] [CrossRef]
- Hoque, M.M.; Hannan, M.A.; Mohamed, A.; Ayob, A. Battery charge equalization controller in electric vehicle applications: A review. Renew. Sustain. Energy Rev. 2017, 75, 1363–1385. [Google Scholar] [CrossRef]
- Hannan, M.A.; Hoque, M.M.; Ker, P.J.; Begum, R.A.; Mohamed, A. Charge equalization controller algorithm for series-connected lithium-ion battery storage systems: Modeling and applications. Energies 2017, 10, 1390. [Google Scholar] [CrossRef]
- Ju, F.; Deng, W.; Li, J. Performance Evaluation of Modularized Global Equalization System for Lithium-Ion Battery Packs. IEEE Trans. Autom. Sci. Eng. 2016, 13, 986–996. [Google Scholar] [CrossRef]
- Wu, C.; Zhu, C.; Ge, Y. A New Fault Diagnosis and Prognosis Technology for High-Power Lithium-Ion Battery. IEEE Trans. Plasma Sci. 2017, 45, 1533–1538. [Google Scholar] [CrossRef]
- Savari, G.F.; Krishnasamy, V.; Sathik, J.; Ali, Z.M.; Abdel Aleem, S.H.E. Internet of Things based real-time electric vehicle load forecasting and charging station recommendation. ISA Trans. 2020, 97, 431–447. [Google Scholar] [CrossRef]
- Rawa, M.; Abusorrah, A.; Bassi, H.; Mekhilef, S.; Ali, Z.M.; Abdel Aleem, S.H.E.; Hasanien, H.M.; Omar, A.I. Economical-technical-environmental operation of power networks with wind-solar-hydropower generation using analytic hierarchy process and improved grey wolf algorithm. Ain Shams Eng. J. 2021, 12, 2717–2734. [Google Scholar] [CrossRef]
- Mohamed, N.; Aymen, F.; Ali, Z.M.; Zobaa, A.F.; Abdel Aleem, S.H.E. Efficient power management strategy of electric vehicles based hybrid renewable energy. Sustainability 2021, 13, 7351. [Google Scholar] [CrossRef]
- Lyu, D.; Ren, B.; Li, S. Failure modes and mechanisms for rechargeable Lithium-based batteries: A state-of-the-art review. Acta Mech. 2019, 230, 701–727. [Google Scholar] [CrossRef]
- Hu, X.; Zhang, K.; Liu, K.; Lin, X.; Dey, S.; Onori, S. Advanced Fault Diagnosis for Lithium-Ion Battery Systems: A Review of Fault Mechanisms, Fault Features, and Diagnosis Procedures. IEEE Ind. Electron. Mag. 2020, 14, 65–91. [Google Scholar] [CrossRef]
- Chaoui, H.; Mandalapu, S. Comparative study of online open circuit voltage estimation techniques for state of charge estimation of lithium-ion batteries. Batteries 2017, 3, 12. [Google Scholar] [CrossRef]
- Gandoman, F.H.; Jaguemont, J.; Goutam, S.; Gopalakrishnan, R.; Firouz, Y.; Kalogiannis, T.; Omar, N.; Van Mierlo, J. Concept of reliability and safety assessment of lithium-ion batteries in electric vehicles: Basics, progress, and challenges. Appl. Energy 2019, 251, 113343. [Google Scholar] [CrossRef]
- Gandoman, F.H.; Van Mierlo, J.; Ahmadi, A.; Abdel Aleem, S.H.E.; Chauhan, K. Safety and reliability evaluation for electric vehicles in modern power system networks. In Distributed Energy Resources in Microgrids: Integration, Challenges and Optimization; Elsevier: Amsterdam, The Netherlands, 2019; pp. 389–404. ISBN 9780128177747. [Google Scholar]
- Cheng, K.W.E.; Divakar, B.P.; Wu, H.; Ding, K.; Ho, H.F. Battery-management system (BMS) and SOC development for electrical vehicles. IEEE Trans. Veh. Technol. 2011, 60, 76–88. [Google Scholar] [CrossRef]
- Lin, Q.; Wang, J.; Xiong, R.; Shen, W.; He, H. Towards a smarter battery management system: A critical review on optimal charging methods of lithium ion batteries. Energy 2019, 183, 220–234. [Google Scholar] [CrossRef]
- Li, Y.; Chen, J.; Lan, F. Enhanced online model identification and state of charge estimation for lithium-ion battery under noise corrupted measurements by bias compensation recursive least squares. J. Power Sources 2020, 456, 227984. [Google Scholar] [CrossRef]
- Li, X.; Huang, Z.; Tian, J.; Tian, Y. State-of-charge estimation tolerant of battery aging based on a physics-based model and an adaptive cubature Kalman filter. Energy 2021, 220, 119767. [Google Scholar] [CrossRef]
- Li, S.; Li, Y.; Zhao, D.; Zhang, C. Adaptive state of charge estimation for lithium-ion batteries based on implementable fractional-order technology. J. Energy Storage 2020, 32, 101838. [Google Scholar] [CrossRef]
- Liu, Z.; Qiu, Y.; Yang, C.; Ji, J.; Zhao, Z. A State of Charge Estimation Method for Lithium-Ion Battery Using PID Compensator-Based Adaptive Extended Kalman Filter. Complexity 2021, 2021, 115880. [Google Scholar] [CrossRef]
- Omariba, Z.B.; Zhang, L.; Kang, H.; Sun, D. Parameter identification and state estimation of lithium-ion batteries for electric vehicles with vibration and temperature dynamics. World Electr. Veh. J. 2020, 11, 50. [Google Scholar] [CrossRef]
- Tong, S.; Lacap, J.H.; Park, J.W. Battery state of charge estimation using a load-classifying neural network. J. Energy Storage 2016, 7, 236–243. [Google Scholar] [CrossRef]
- Shen, P.; Ouyang, M.; Lu, L.; Li, J.; Feng, X. The co-estimation of state of charge, state of health, and state of function for lithium-ion batteries in electric vehicles. IEEE Trans. Veh. Technol. 2018, 67, 92–103. [Google Scholar] [CrossRef]
- Meng, H.; Li, Y.F. A review on prognostics and health management (PHM) methods of lithium-ion batteries. Renew. Sustain. Energy Rev. 2019, 116, 109405. [Google Scholar] [CrossRef]
- Khan, M.R.; Swierczynski, M.J.; Kær, S.K. Towards an ultimate battery thermal management system: A review. Batteries 2017, 3, 9. [Google Scholar] [CrossRef]
- Liu, K.; Li, K.; Peng, Q.; Zhang, C. A brief review on key technologies in the battery management system of electric vehicles. Front. Mech. Eng. 2019, 14, 47–64. [Google Scholar] [CrossRef] [Green Version]


| BMS Type | Definition | Merits | Demerits |
|---|---|---|---|
| Centralized | The battery pack has one central BMS, and all the battery packages are directly connected to the central BMS | Because there is just one BMS, it is more compact and tends to be the most cost-effective | The BMS requires many ports to connect with all battery packages because the batteries directly link to the BMS |
| Modular | The BMS is divided into numerous replicated modules, each with its dedicated bundle of wires and connects to a battery stack’s neighboring allocated section | Troubleshooting and maintenance are simplified because of the inherent flexibility, and expansion to bigger battery packs is simple | The disadvantage is that total expenses are somewhat more significant, and unnecessary functionality may be duplicated depending on the program |
| Subordinate | Similar to the modular architecture in concept, however, in this instance, the slaves are limited to just relaying measurement data, while the master is devoted to calculation, control, and external communication | Because the slaves’ functionality is often more straightforward, there is likely less overhead and fewer unwanted features, and the expenses may be cheaper than with a modular BMS | The disadvantage is as the modular BMS |
| Distributed | The electrical hardware and software are housed in modules that connect to the cells through bundles of wires. All the electrical gear for a distributed BMS is housed on a control board mounted directly on the monitored cell or module | Most wiring is reduced to a few sensor wires and communication cables between nearby BMS modules. In addition, each BMS is more self-contained, allowing it to conduct calculations and communications as needed | Troubleshooting and maintenance might be complex with this integrated form. Because there are more BMSs in the total battery pack system, costs are likewise higher |
Publisher’s Note: MDPI stays neutral with regard to jurisdictional claims in published maps and institutional affiliations. |
© 2022 by the authors. Licensee MDPI, Basel, Switzerland. This article is an open access article distributed under the terms and conditions of the Creative Commons Attribution (CC BY) license (https://creativecommons.org/licenses/by/4.0/).
Share and Cite
Gandoman, F.H.; El-Shahat, A.; Alaas, Z.M.; Ali, Z.M.; Berecibar, M.; Abdel Aleem, S.H.E. Understanding Voltage Behavior of Lithium-Ion Batteries in Electric Vehicles Applications. Batteries 2022, 8, 130. https://doi.org/10.3390/batteries8100130
Gandoman FH, El-Shahat A, Alaas ZM, Ali ZM, Berecibar M, Abdel Aleem SHE. Understanding Voltage Behavior of Lithium-Ion Batteries in Electric Vehicles Applications. Batteries. 2022; 8(10):130. https://doi.org/10.3390/batteries8100130
Chicago/Turabian StyleGandoman, Foad H., Adel El-Shahat, Zuhair M. Alaas, Ziad M. Ali, Maitane Berecibar, and Shady H. E. Abdel Aleem. 2022. "Understanding Voltage Behavior of Lithium-Ion Batteries in Electric Vehicles Applications" Batteries 8, no. 10: 130. https://doi.org/10.3390/batteries8100130