Article

Temperature-Induced Precipitation of V2O5 in Vanadium Flow Batteries—Revisited

Department of Engineering, Aarhus University, N Åbogade 40, 8200 Aarhus, Denmark
*
Author to whom correspondence should be addressed.
Batteries 2021, 7(4), 87; https://doi.org/10.3390/batteries7040087
Submission received: 18 August 2021 / Revised: 5 November 2021 / Accepted: 9 December 2021 / Published: 17 December 2021

Abstract

:
The maximum operation temperature of the vanadium solution in vanadium flow batteries is typically limited to 40 °C to prevent the damaging thermal precipitation of V2O5. Therefore, the operation of batteries at high ambient temperatures is an important aspect to tackle for stationary storage. In the present work, a comprehensive study of the high temperature stability of redox solutions for vanadium flow batteries was performed. In particular, focus was placed on a comparison between batch and in operando precipitation experiments. It was found that, despite being a widely used method in the literature, caution should be taken when assessing the precipitation through capacity fade due to the large influence of external oxidation and cycling parameters, plausibly leading to an incorrect interpretation of the results. The in operando experiments consistently show a precipitation temperature almost 10–20 °C higher than in the batch tests at a 100% state of charge for the same time lapse.

1. Introduction

Renewable power sources are fully competitive with fossil-based ones [1]. However, due to the intermittent nature of energy production by these type of sources, energy storage is emerging as the major challenge for completing the green transition. It is estimated that the total capacity of installed batteries worldwide will rise to 100–450 GWh by 2030 [2]. In the case of stationary storage, energy density is of minor importance, cost being the principal driver. End-user turn-key costs of 150–200 €/kWh and a lifetime of thousands of cycles are considered targets for energy storage in 2030, both by the EU Commission [3] and the US Department of Energy [4]. Here, vanadium flow batteries (VFBs) are recognized as a potential key storage technology, by virtue of their potential low-cost and long lifetime [2,5].
In VFBs, electricity is stored in liquid solutions composed of redox active vanadium ions. The electrolytes (anolyte and catholyte) for VFBs typically consist of 1.6–1.8 M vanadium dissolved in sulfuric/phosphoric acid. During operation, the solutions are pumped into a stack where the oxidation/reduction of vanadium ions takes place (see Figure 1). The key components of a single vanadium redox flow cell are the electrodes, normally made of carbonaceous materials, and the ion-exchange membrane (IEM), which separates the anolyte and catholyte, while allowing ion transport during the charge/discharge processes.
The same redox active vanadium solution, with an initial average vanadium oxidation state (Vstate) of +3.5, is used for both sides of a VFB. This constitutes a major advantage for VFBs: during operation of a flow battery, crossover across the IEM carries redox species from one side to the other, due to the difference in composition. If the two electrolytes have different chemical/elemental content, this process induces an irreversible loss in battery capacity, as a part of the original species are no longer available for redox processes. In VFBs, crossover only leads to a slow self-discharge of the battery, since the (pristine) vanadium solution on each side is the same [6]. Therefore, VFBs do not display irreversible chemical degradation.
Still, there are three dominant reversible mechanisms that can lead to the capacity loss of VFBs over time. (i) First is external oxidation, caused by O2 from air diffusing through tanks, pipes, and joints. It primarily affects the state of charge of the catholyte solution ( V 2 + O 2 V 3 + ) and generates a capacity imbalance between the electrolytes. Consequently, the capacity of the battery is reduced [5]. (ii) Second is vanadium/volumetric crossover through the membrane, primarily by electroosmotic and osmotic drag [7,8,9]. As a result, the total vanadium concentration and/or volume of the solution changes on each side. Programmed remixing of the two solutions can reverse this process and bring the solution back to its initial average Vstate +3.5 [10]. (iii) Last is the thermal instability of VO 2 + , where V2O5 precipitates with increasing temperatures and state of charge (SoC), typically around 40 °C for a 1.6 M vanadium solution at 100% SoC [11,12,13,14,15,16,17].
Li-ion batteries only have a long lifetime if operated below 35 °C [18,19]. Typically, VFBs are limited to temperatures below 40 °C. As many battery applications require operation at ambient temperatures approaching 50 °C, active (air-conditioned) temperature control is employed to ensure the long-term stability of the battery system. This increases the capital costs and lowers the efficiency of the system. Therefore, there is a large driver for the development of long-term stable batteries that can operate at ambient temperatures approaching 50 °C. A number of studies have explored the temperature stability of VFBs [12,16,20]. Typically, batch solutions (2–10 mL) are analyzed at different SoCs, with or without the addition of precipitation preventive additives. The samples are heated with increasing temperature in, e.g., 24 h intervals and inspected for precipitation. Vijayakumar et al. studied VO 2 + in the electrolyte solution containing sulfate and water at different temperatures using 17O and 51V nuclear magnetic resonance (NMR) spectroscopy. It was determined that VO 2 + exists as [ VO 2 ( H 2 O ) 3 ] +   in the electrolyte solution, and that the complex is not stable above 55 °C, where it deprotonates and forms V2O5 by condensation [21,22].
Overall, it is well established that lower vanadium concentrations and higher sulfuric acid concentrations increase the precipitation temperature, as well as the addition of phosphoric acid in low concentrations [13,14,23,24,25] The latter is commonly used as an additive in commercial vanadium solutions.
In the present work, a comprehensive study of the high temperature stability of vanadium solutions is performed. In particular, the aim is to make a comparative study between the standard batch procedures and an in operando battery test aimed at investigating the precipitation temperature of vanadium. In fact, in operando precipitation tests are scarcer and the results are more divergent [13,14,20,26].

2. Experimental

2.1. Titration

The titrations were carried out with an automatic titrator (Metrohm 916 Ti-Touch) using a dynamic equivalence point titration (DET) method. The potential of the titrated solution was measured with a platinum electrode. For the oxidative and reductive titrations, 0.1 M solutions of KMnO4 (Sigma-Aldrich (Burlington, NJ, USA), ≥99% purity) and (NH4)2Fe(SO4)2·(H2O)6 (Sigma-Aldrich (Burlington, NJ, USA), ≥99% purity) were employed, respectively. The solutions were prepared with Milli-Q water and used within 2 h of preparation. The total experimental uncertainty in the titration was estimated to be at maximum ±2%. For vanadium samples containing V2+, we attempted to keep air exposure to a minimum during titration to minimize oxidation. The SoC is defined as SoC = [ VO 2 + ]/[   V tot ] , where V tot = 1.6 M is the total vanadium concentration.

2.2. Vanadium Solutions for Batch Experiments

The starting point for all vanadium solutions was a standard solution of 0.8 M V 2 ( SO 4 ) 3 and 0.8 M VOSO 4 in 2.0 M H 2 SO 4 /0.05 M H 3 PO 4 . The datasheet of the vanadium electrolyte provided by Oxkem (Oxford, UK) is shown in Supporting Information S1.
The preparation of the solutions followed a four-step procedure:
  • 1 L of the pristine vanadium electrolyte solution was charged (experimental setup described in Section 2.4) to 100% SoC by constant current followed by constant voltage at 1.6 V for about 24 h. After 24 h, the current density was less than 1 mA/cm2 and the SoC was estimated to be >99%. The SoC was also verified by titration, considering the experimental resolution.
  • Three vanadium solutions at 84%, 93%, and 100% SoC were prepared. The first two were obtained by dilution of 300 mL of catholyte (100% SoC) with the corresponding amount of pristine vanadium solution. SoC was verified by reductive titration.
  • For each of the three above solutions, six master solutions, with different concentrations of additives H 3 PO 4 (Sigma-Aldrich (Burlington, NJ, USA), 85 wt.%) and ( NH 4 ) 2 SO 4 (Sigma-Aldrich (Burlington, NJ, USA), ≥99% purity) were prepared. They are indicated as A–F (Table 1). It was noted that a white precipitate appeared with the addition of phosphoric acid in master solution F (0.15 M H3PO4) (see Supporting Information S2). It was reported in previous studies that the precipitation of VOPO4 was observed whenever the concentration of phosphate exceeded 0.1 M in the presence of vanadium [23]. Hence, no further experiments were conducted with master solution F.
  • From the five different master solutions (at different SoCs) a dilution series following the scheme in Figure 2 was made. Sample 1 is the undiluted master solution, samples 2 and 3 are diluted with water, samples 4 and 5 with 2 M H 2 SO 4 , and samples 6 and 7 with 4 M H 2 SO 4 .
All experiments were performed in triplicate. Considering all the variables—the different SoCs (×3), additives (×5), and dilutions (×7)—the total number of examined samples was 315. In the following, specific samples are abbreviated according to their additive (A–E), dilution (1–7), and SoC. For example, sample B1-84% corresponds to the standard vanadium electrolyte with 0.1 M phosphoric acid at 84% SoC. A detailed overview of all samples and their compositions can be found in Supporting Information S3–S5.

2.3. Batch Experiments

The experimental methodology is similar to the one used by Wang et al. [16]. All the samples were sealed in 15 mL plastic centrifugal vials and immersed into a temperature-controlled bath, as shown in Supporting Information S6. The temperature was controlled by a Lauda ECO Gold immersion thermostat with water circulation. A uniform temperature distribution in the bath was verified by temperature measurements at different positions, and they all fell within ±0.5 °C. During the test, the solutions were kept unstirred and were visually inspected for precipitation every 24 h by reversing the vials. The temperature was increased by 2 °C every 24 h, from 30 to 64 °C. The recorded precipitation temperature is the average temperature at which the first precipitation was observed in each of the triplets. In general, the standard deviation of a triplet group was about ±1.0 °C, with the maximum value being ±2.3 °C.

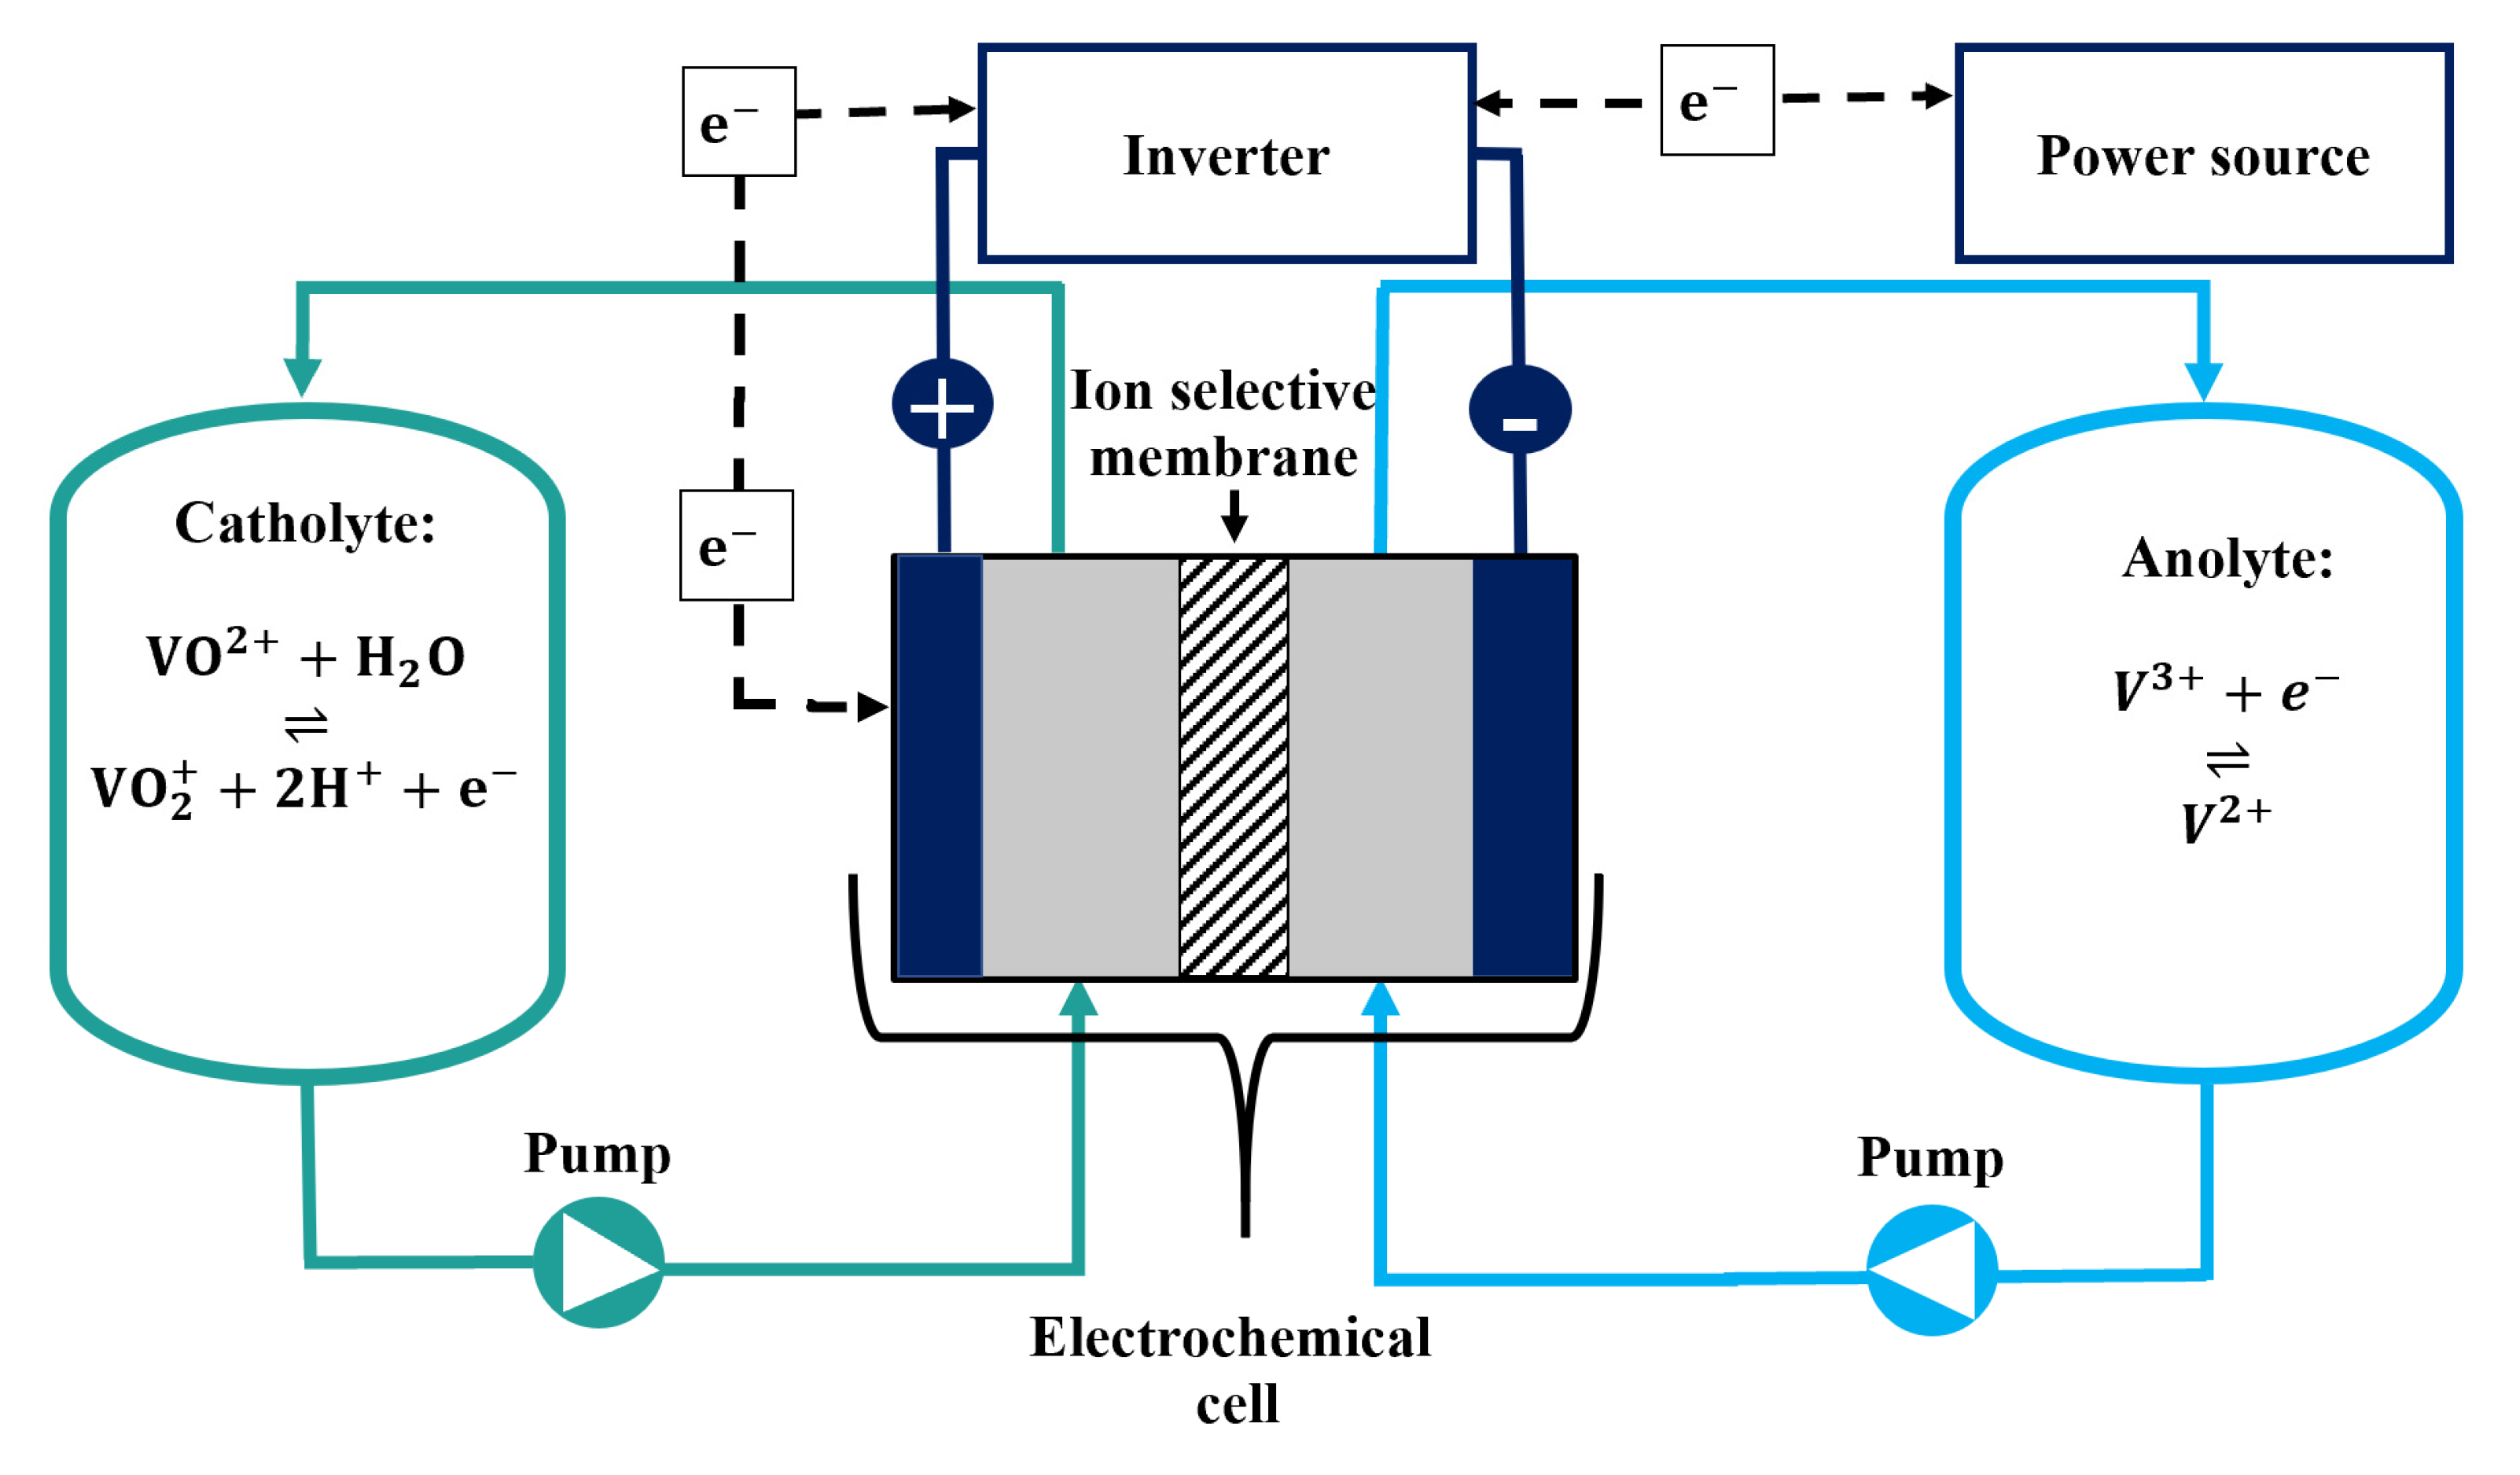
2.4. Electrochemical Cell

The electrochemical cell (Supporting Information S7) consisted of two graphite blocks, with a 3 mm deep carving to accommodate the 25 cm2 carbon felt electrodes. The two sides were separated by a Fumasep E-630(K) (Fumatech (Baden-Württemberg, Germany)) cation exchange membrane. Although the Fumatech E600 series membranes are not intended for long term use in VFBs, it was utilized in the current study because of its high selectivity and low electroosmosis. As a consequence, almost constant vanadium concentrations on both sides, very limited volumetric crossover, and extremely high coulomb efficiency (>99%) were observed.
Before being used, the electrodes (Sigracell GFA6 EA, SGL Carbon (Wiesbaden, Germany)) were treated in air at 500 °C for 7 h to increase hydrophilicity. This procedure decreased the thickness of the electrode from 6.5 mm to 6.2 mm. Two 1.0 mm Viton gaskets were placed between the graphite blocks and the membrane, whereby the electrodes were compressed about 30%. The cell was tightened with a 5 Nm torque.

2.5. Battery Test

Battery cycling was conducted using a Neware BTS 5V3A battery tester in a four-wire configuration with voltage measurements on the current collectors. Unless otherwise stated, the cycling of the battery was done galvanostatically at 1.5 A. For charge/discharge this was followed by potentiostatic charging/discharging at 1.6 V/0.5 V with a stop current of 0.1 A. The potentiostatic step was included to access as much of the capacity as possible. The volume of the positive and negative electrolytes was 50 mL. The electrolytes were pumped at 50 mL/min by a two-channel peristaltic pump (LeadFluid BT600L).

2.6. In Operando Temperature Control

To avoid external oxidation during cycling, the experimental setup was placed in an oxygen free chamber, where nitrogen was purged at a flow rate of 0.6–0.8 L/min. The oxygen level was below 1% throughout the experiment. To ensure a uniform temperature distribution, the chamber was insulated by placing EPS insulation plates on every side of the chamber, and two fans were included. The temperature was controlled by a Lauda ECO Gold immersion thermostat that was connected to the system by tubes surrounding the experimental setup inside the chamber. To verify the temperature uniformity throughout the experiment, a temperature sensor was placed on the inside of the lid of the electrolyte bottles, while a second sensor was attached to the graphite block of the electrochemical cell. During all the experiments, the temperature difference between the two sensors was less than 0.5 °C.

3. Results and Discussion

3.1. Batch Precipitation Experiments

The results of the batch precipitation experiment are displayed in a contour plot in Figure 3. As a general trend, when the vanadium concentration is reduced and the sulfuric acid concentration is increased, the precipitation temperature is increased (Figure 3A; 84%, 93%, 100%). These findings are in agreement with those of previous studies in the literature. A comprehensive study investigated the effect on the precipitation temperature in the range of 0.4–2.2 M vanadium in 1.5–3.0 M sulfuric acid [16], which together with other studies has shown that the stability of VO 2 + increases with increasing sulfuric acid concentration [15,22]. We observed precipitation at 40 °C for the sample A1-100%, in full agreement with the values reported in the literature [13,15,16].
Additionally, it appears that increased phosphoric acid concentration (Figure 3B,E) also increases the precipitation temperature. This can be explained by the interaction of phosphoric acid with [VO2(H2O)3]+ [23]. Oldenburg et al. studied the addition of H3PO4 during battery operation, suggesting that the addition of this compound positively affects the negative part of the battery, due to a reduction in the polarization resistance, which is associated with the reduction reaction of V3+ [24]. Kausar et al. showed that the stability of 2 M vanadium electrolyte was significantly increased when adding 1 wt.% of phosphoric acid. The time before any observed precipitation increased from 5 to 40 days for 80% SoC, 2 to 22 days for 90% SoC, and 1 to 18 days for 95% SoC [14]. Similarly, H 3 PO 4 concentration was shown to increase the precipitation temperature in several other studies [13,14,23,24,25].
Finally, ammonium sulfate appeared to have little influence on the precipitation temperature as seen from Figure 3C–E. Compared to the A samples, a slight increase in the precipitation temperature of about 1 °C can be observed, yet this value lies within the experimental uncertainty. The effect of the addition of ammonium salts has been debated. Kausar et al. investigated the influence of several inorganic additives [14]. The combination of 1 wt.% phosphoric acid plus 2 wt.% ammonium sulfate increased the stability of vanadium even more than the addition of phosphoric acid alone. Hence, the induction time was increased to 32, 125, and >150 days for 95%, 90%, and 80% SoC, respectively. Similarly, Wang et al. tested compounds containing amino- and ammonio-functional groups [27]. However, Roe et al. observed that the addition of ammonium sulfate gives similar induction times to those observed for the blank solution [13]. The study from Roe et al. agrees with the results from this study, as the addition of ammonium did not seem to have any measurable effect.

3.2. Influence of Air and Cycling Parameters on Battery Performance

In previous in operando VFB studies of the temperature-induced precipitation of V 2 O 5 , the capacity fade over numerous cycles at elevated temperatures has been used as an indicator/assessment of precipitation [13,16]. However, in VFBs, several factors can influence capacity fade: (i) membrane crossover/electroosmosis, (ii) external oxidation, and (iii) experimental conditions during cycling. Hence, if the experiment is not carefully designed and carried out, these factors can interfere and lead to incorrect conclusions about precipitation. Because of oxidation, the average Vstate increases above +3.5, which leads to an imbalance between electro-active species and an incomplete utilization of the catholyte ions. This induces an apparent loss of capacity. This imbalance leads to a significant step-like reduction of the OCV. If the battery is cycled with a lower cut-off voltage of, e.g., 1.0 V, a reduced capacity will be observed, which decreases linearly with increasing Vstate [28]. In the present study, the low discharge value of 0.5 V was chosen to allow access to all the available capacity (even if Vstate > 3.5), while not inducing V 3 + / VO 2 + oxidation/reduction on both sides, observed below approximately 0.3 V (see Supporting Information S8).
The experimental results of the charge and discharge cycles are shown in Figure 4.
For the first 27 cycles the battery was cycled in an oxygen-free environment, while from cycle 28 and onwards, the nitrogen purging was turned off, and the lid of the anolyte container opened. Figure 4a shows the voltage capacity plot up to cycle 27. Charge/discharge curves were very stable with a discharge capacity of 2050 mAh, consistent with the theoretical capacity of 2144 mAh (96% utilization). In all cycles, coulomb efficiencies close to 100% were obtained, demonstrating the very high selectivity of the Fumasep E-630 membrane. Nonetheless, a steep decrease in the potential around 1600 mAh shows that the vanadium solution had some degree of oxidation (Vstate > 3.5). Said oxidation arises from the oxygen dissolved in the solution, which was not removed prior to the beginning of the experiment, for example by bubbling the vanadium solution with N2. However, in the current study, some degree of oxidation of the vanadium solution is in fact desirable in order to ensure that the catholyte side can be charged to values that approach 100% SoC.
From cycle 28 and onwards, oxygen was allowed in the chamber and its strong impact on battery performance can be seen in the voltage–capacity plot in Figure 4b. The capacity at which the voltage decreases steeply was reduced from about 1600 mAh to about 800 mAh. The titration of an equal mixture of the two electrolytes at the end of the experiment revealed a Vstate of 3.72, compared to a Vstate of 3.52 of the pristine solution, indicating an overall oxidation of the electrolytes. It is noted that even when the tubes, lids, and glass bottles are completely sealed, oxygen will diffuse into the electrolyte (see Supporting Information S9). As these results suggest, it is of extreme importance to account for external oxidation. Moreover, the choice of cycling parameters should be done carefully: hereby, we propose that a discharge cut-off voltage value of 0.5 V followed by potentiostatic discharge should be employed when battery capacity alone is used for monitoring the onset of precipitation of V 2 O 5 . Figure 4c shows that even when the solution is oxidized, the capacity remains relatively stable upon cycling (note that capacity y-axis is zoomed in) and only decreases by about 2%. However, as can be seen from Figure 4d, if a discharge cut-off larger than 1 V had been chosen, the experimental available capacity would have decreased and could possibly have been interpreted as V2O5 precipitation.

3.3. In Operando Assessment of the Temperature Stability of Vanadium

The batch experiments showed V 2 O 5 precipitation temperature at about 40 °C for standard vanadium electrolyte at 100% SoC (Sample A1-100%). Nonetheless, under battery operation the SoC will normally not be close to 100% for extended periods of time, as batteries for stationary storage are typically cycled in less than 24 h. For this reason, it is highly relevant to perform studies of V 2 O 5 precipitation during battery operation (in operando) at elevated temperatures. Such studies are scarce in the literature and often deficient. In particular, the interference of external parameters like oxidation of the vanadium solution, vanadium crossover, and battery cycling parameters are usually not addressed.
In operando battery experiments can be designed in a number of ways. In the present study, the battery was operated at temperatures between 35 °C and 50 °C. Potential holds at 1.6 V were included in order to ensure a SoC close to 100% for extended periods of time. The sequence of the experiments presented here is collected in Table 2. The results are shown in Figure 5, where the initial cycling at 35 °C shows a total discharge capacity of about 2100 mAh, with a clear voltage drop around 1700 mAh, indicating some oxidation of the vanadium solution. In the following cycles, at different temperatures, the discharge capacity remained almost constant. However, the capacity at which the steep voltage drop can be observed, increased. This is interpreted as chemical oxidation of the carbon felt, which will generate CO2 and at the same time reduce the vanadium [29,30]. This interpretation is supported by the fact that the reduction mainly took place during the 24 h of potential hold at 1.6 V, where the SoC was ~100% and the solution was highly oxidative.
Nonetheless, the main result is that V 2 O 5 precipitation was not observed during the cycling at 50 °C, even when resting with a 1.6 V potential hold at 24 h (~100% SoC). This is in direct contrast to the batch experiments, where precipitation for this formulation (Sample A1-100%) was observed at 40 °C within 24 h. For further investigation on this, a new series of experiments were conducted and are described in Supporting Information S10. Here, the battery was cycled at 30 °C and 60 °C. In these experiments, precipitation was clearly observed at 60 °C during 30 h of potential hold at 1.6 V. Furthermore, the V2O5 could be redissolved by discharging the electrolytes and lowering the temperature, as previously shown [11].
These diverging results between the batch and the in operando experiments (regarding precipitation temperature and induction times) triggered the hypothesis that the lack of circulation or presence of oxygen during the batch experiments could catalyze the precipitation of V 2 O 5 . Another set of batch experiments was carried out at 50 °C, with and without the presence of air and stirring. The results are collected in Supporting Information S11. Surprisingly, these experiments indicated that stirring promotes precipitation, while the influence of air has little importance. Further experimental investigations of this discrepancy were not followed. Nonetheless, as the materials in contact with the vanadium electrolyte in the batch experiments and in the in operando ones were different, it is speculated that a difference in the catalytic activity of the materials could explain the different precipitation rates/temperatures.
Finally, it is noted that the charging process changes the H+ concentration on each side compared to the concentration in the pristine solution. Depending on the charge carriers (anion/cation) and selectivity of the membrane, this can lead to different concentrations. In all cases, this will lead to increased H+ concentration on the positive side. In the present study, the vanadium solution for the batch experiment was produced electrochemically in the same electrochemical cell as in the in operando experiment. It is therefore reasonable to assume that the compositions and H+ concentration of the solutions for the batch and in operando experiments are the same for the same SoC and can therefore not be an explanation of the difference in the precipitation temperatures between the two.

4. Conclusions

The high temperature stability of the vanadium cathode electrolyte solution with several inhibitor additives was evaluated, at three different SoCs, in batch precipitation tests. As in previous studies, the general pattern was an increase in the precipitation temperature with lower vanadium concentration (1.6 M), higher sulfuric acid concentration (2.5 M), and higher phosphoric acid concentration (0.1 M). However, the addition of ammonium sulfate did not show any significant influence on the thermal stability.
The use of the capacity fade as an indicator of V2O5 precipitation for flow battery experiments has been found as a common methodology in the literature. However, experiments should be carefully designed to avoid other factors that may influence this capacity loss. It has been shown that external oxidation, leading to an increase of the Vstate, leads to an apparent loss of capacity. Even if all the parts (lids, tubes, and electrolyte containers) are sealed, oxygen diffuses inside the solution, and it is crucial that all tests are performed in an oxygen-free environment. Also, the battery cycling parameters have an influence. If the battery is potentiostatically discharged down to approximately 0.5 V, the effects of oxidation on the capacity fade can be minimized and the whole capacity can be accessed, being able to monitor V2O5 precipitation from the real capacity loss.
The in operando assessment was carried out for the sample A1 (1.6 M V, 2 M H2SO4, and 0.05 M H3PO4) at 100% SoC. In the batch experiments, the precipitation temperature was observed at 40 °C in this case, in accordance with other literature studies. However, for the in operando test carried out between 35 °C and 50 °C, with 24 h potential holds at 1.6 V, no apparent precipitation was observed. Another set of experiments was carried out at higher temperatures, where precipitation was observed around 60 °C during the period of potential holds. This precipitate could be redissolved during the discharge cycles of the battery. A hypothesis for the difference in the precipitation temperature between the batch and in operando experiments was that having no air circulation in the batch experiments could promote the precipitation. Nonetheless, a new set of batch experiments, with and without stirring and with and without air, showed the opposite. It is speculated that the contact of the electrolyte with the battery cell or tube materials has an inhibiting effect on the precipitation. Still, it cannot be ruled out that some precipitation takes place, but the induction time is longer than in the batch experiments and the particulates remain suspended in the solution. As a general conclusion, it appears feasible to operate vanadium flow batteries (1.6 M vanadium with phosphate additives) above 40 °C, in particular when considering that commercial vanadium flow batteries typically are restricted to SoCs below 80–90% and typically do not remain at high SoCs for extended periods of time.

Supplementary Materials

The following are available online at https://www.mdpi.com/article/10.3390/batteries7040087/s1, Supportive information (S1–S11).

Author Contributions

Conceptualization, A.B.; funding acquisition, A.B.; investigation, E.H.K. and F.F.; methodology, E.H.K., F.F., S.N.O. and A.B.; project administration, E.H.K. and A.B.; supervision, F.F. and A.B.; validation, E.H.K.; visualization, E.H.K., F.F. and S.N.O.; writing—initial draft, E.H.K., F.F. and S.N.O.; writing—review and editing, F.F., S.N.O. and A.B. All authors have read and agreed to the published version of the manuscript.

Funding

The Innovation Foundation Denmark is acknowledged for its partial funding of the project DanFlow (Grant # 9090-00059B) and funding of the PhD project (Grant # 0153-00190B) together with VisBlue.

Data Availability Statement

The data presented in this study are available on request from the corresponding author.

Conflicts of Interest

Emil Holm Kirk has partially been employed by VisBlue during the completion of this study. Sara Noriega Oreiro is employed in an industrial PhD position at VisBlue and Aarhus University. Anders Bentien is a co-founder and member of the board of VisBlue.

References

  1. IRENA. Renewable Power Generation Costs in 2017; International Renewable Energy Agency: Abu Dhabi, United Arab Emirates, 2018; p. 160. [Google Scholar]
  2. Ralon, P.; Taylor, M.; Ilas, A.; Diaz-Bone, H.; Kairies, K. Electricity Storage and Renewables: Costs and Markets to 2030; International Renewable Energy Agency: Abu Dhabi, United Arab Emirates, 2017. [Google Scholar]
  3. EU SET Plan. Available online: https://setis.ec.europa.eu/system/files/integrated_set-plan/action7_declaration_of_intent_0.pdf) (accessed on 10 November 2020).
  4. Department of Energy, USA, Grid Energy Storage, December 2013. Available online: https://www.energy.gov/sites/default/files/2014/09/f18/Grid%20Energy%20Storage%20December%202013.pdf (accessed on 10 November 2020).
  5. Akhil, A.A.; Huff, G.; Currier, A.B.; Kaun, B.C.; Rastler, D.M.; Chen, S.B.; Cotter, A.L.; Bradshaw, D.T.; Gauntlett, W.D. Electricity Storage Handbook in Collaboration with NRECA; DOE/EPRI 2013; Sandia National Laboratories: Albuquerque, NM, USA, 2013; p. 340.
  6. Sun, C.; Negro, E.; Nale, A.; Pagot, G.; Vezzù, K.; Zawodzinski, T.A.; Meda, L.; Gambaro, C.; Di Noto, V. An efficient barrier toward vanadium crossover in redox flow batteries: The bilayer [Nafion/(WO3) x] hybrid inorganic-organic membrane. Electrochim. Acta 2021, 378, 138133. [Google Scholar] [CrossRef]
  7. Schafner, K.; Becker, M.; Turek, T. Capacity balancing for vanadium redox flow batteries through electrolyte overflow. J. Appl. Electrochem. 2018, 48, 639–649. [Google Scholar] [CrossRef]
  8. Catalano, J.; Bentien, A.; Østedgaard-Munck, D.N.; Kjelstrup, S. Efficiency of electrochemical gas compression, pumping and power generation in membranes. J. Membr. Sci. 2015, 478, 37–48. [Google Scholar] [CrossRef]
  9. Knehr, K.; Kumbur, E. Role of convection and related effects on species crossover and capacity loss in vanadium redox flow batteries. Electrochem. Commun. 2012, 23, 76–79. [Google Scholar] [CrossRef]
  10. Wang, K.; Liu, L.; Xi, J.; Wu, Z.; Qiu, X. Reduction of capacity decay in vanadium flow batteries by an electrolyte-reflow method. J. Power Sources 2017, 338, 17–25. [Google Scholar] [CrossRef]
  11. Skyllas-Kazacos, M.; Cao, L.; Kazacos, M.; Kausar, N.; Mousa, A. Vanadium electrolyte studies for the vanadium redox battery—a review. ChemSusChem 2016, 9, 1521–1543. [Google Scholar] [CrossRef] [PubMed]
  12. Xiao, S.; Yu, L.; Wu, L.; Liu, L.; Qiu, X.; Xi, J. Broad temperature adaptability of vanadium redox flow battery—Part 1: Electrolyte research. Electrochim. Acta 2016, 187, 525–534. [Google Scholar] [CrossRef]
  13. Roe, S.; Menictas, C.; Skyllas-Kazacos, M. A high energy density vanadium redox flow battery with 3 M vanadium electrolyte. J. Electrochem. Soc. 2015, 163, A5023. [Google Scholar] [CrossRef]
  14. Kausar, N.; Mousa, A.; Skyllas-Kazacos, M. The effect of additives on the high-temperature stability of the vanadium redox flow battery positive electrolytes. ChemElectroChem 2016, 3, 276–282. [Google Scholar] [CrossRef]
  15. Rahman, F.; Skyllas-Kazacos, M. Vanadium redox battery: Positive half-cell electrolyte studies. J. Power Sources 2009, 189, 1212–1219. [Google Scholar] [CrossRef]
  16. Wang, K.; Zhang, Y.; Liu, L.; Xi, J.; Wu, Z.; Qiu, X. Broad temperature adaptability of vanadium redox flow battery-Part 3: The effects of total vanadium concentration and sulfuric acid concentration. Electrochim. Acta 2018, 259, 11–19. [Google Scholar] [CrossRef]
  17. Carvalho Jr, W.M.; Cassayre, L.; Quaranta, D.; Chauvet, F.; El-Hage, R.; Tzedakis, T.; Biscans, B. Stability of highly supersaturated vanadium electrolyte solution and characterization of precipitated phases for Vanadium Redox Flow Battery. J. Energy Chem. 2021, 61, 436–445. [Google Scholar] [CrossRef]
  18. Ma, S.; Jiang, M.; Tao, P.; Song, C.; Wu, J.; Wang, J.; Deng, T.; Shang, W. Temperature effect and thermal impact in lithium-ion batteries: A review. Prog. Nat. Sci. Mater. Int. 2018, 28, 653–666. [Google Scholar] [CrossRef]
  19. Leng, F.; Tan, C.M.; Pecht, M. Effect of temperature on the aging rate of Li ion battery operating above room temperature. Sci. Rep. 2015, 5, 1–12. [Google Scholar]
  20. Xi, J.; Xiao, S.; Yu, L.; Wu, L.; Liu, L.; Qiu, X. Broad temperature adaptability of vanadium redox flow battery—Part 2: Cell research. Electrochim. Acta 2016, 191, 695–704. [Google Scholar] [CrossRef]
  21. Vijayakumar, M.; Li, L.; Graff, G.; Liu, J.; Zhang, H.; Yang, Z.; Hu, J.Z. Towards understanding the poor thermal stability of V5+ electrolyte solution in vanadium redox flow batteries. J. Power Sources 2011, 196, 3669–3672. [Google Scholar] [CrossRef]
  22. Yuan, X.Z.; Song, C.; Platt, A.; Zhao, N.; Wang, H.; Li, H.; Fatih, K.; Jang, D. A review of all-vanadium redox flow battery durability: Degradation mechanisms and mitigation strategies. Int. J. Energy Res. 2019, 43, 6599–6638. [Google Scholar] [CrossRef]
  23. Roznyatovskaya, N.V.; Roznyatovsky, V.A.; Höhne, C.-C.; Fühl, M.; Gerber, T.; Küttinger, M.; Noack, J.; Fischer, P.; Pinkwart, K.; Tübke, J. The role of phosphate additive in stabilization of sulphuric-acid-based vanadium (V) electrolyte for all-vanadium redox-flow batteries. J. Power Sources 2017, 363, 234–243. [Google Scholar] [CrossRef]
  24. Oldenburg, F.J.; Bon, M.; Perego, D.; Polino, D.; Laino, T.; Gubler, L.; Schmidt, T.J. Revealing the role of phosphoric acid in all-vanadium redox flow batteries with DFT calculations and in situ analysis. Phys. Chem. Chem. Phys. 2018, 20, 23664–23673. [Google Scholar] [CrossRef] [PubMed]
  25. Rahman, F.; Skyllas-Kazacos, M. Evaluation of additive formulations to inhibit precipitation of positive electrolyte in vanadium battery. J. Power Sources 2017, 340, 139–149. [Google Scholar] [CrossRef]
  26. Li, L.; Kim, S.; Wang, W.; Vijayakumar, M.; Nie, Z.; Chen, B.; Zhang, J.; Xia, G.; Hu, J.; Graff, G. A stable vanadium redox-flow battery with high energy density for large-scale energy storage. Adv. Energy Mater. 2011, 1, 394–400. [Google Scholar] [CrossRef]
  27. Wang, G.; Zhang, J.; Zhang, J.; Chen, J.; Zhu, S.; Liu, X.; Wang, R. Effect of different additives with–NH2 or–NH4+ functional groups on V (V) electrolytes for a vanadium redox flow battery. J. Electroanal. Chem. 2016, 768, 62–71. [Google Scholar] [CrossRef] [Green Version]
  28. Ngamsai, K.; Arpornwichanop, A. Analysis and measurement of the electrolyte imbalance in a vanadium redox flow battery. J. Power Sources 2015, 282, 534–543. [Google Scholar] [CrossRef]
  29. Liu, H.; Xu, Q.; Yan, C.; Qiao, Y. Corrosion behavior of a positive graphite electrode in vanadium redox flow battery. Electrochim. Acta 2011, 56, 8783–8790. [Google Scholar] [CrossRef]
  30. Liu, H.; Xu, Q.; Yan, C. On-line mass spectrometry study of electrochemical corrosion of the graphite electrode for vanadium redox flow battery. Electrochem. Commun. 2013, 28, 58–62. [Google Scholar] [CrossRef]
Figure 1. Schematic view of a VFB.
Batteries 07 00087 g001
Figure 2. Schematic view of dilution series.
Batteries 07 00087 g002
Figure 3. Results of batch precipitation experiments for different SoCs and additives. The concentration of the additives at the top are the ones in the master solution.
Batteries 07 00087 g003
Figure 4. (a) Voltage–capacity plots for cycle numbers #5, #15, and #25 in N2 atmosphere. (b) Voltage–capacity plots for cycle numbers #30, #40, and #50 in air and opened bottle lids. (c) Charge/discharge capacity and coulomb efficiency as function of the cycle number (#). (d) Comparison of discharge capacities over and under 1 V. Total experiment lasted approximately 12 days.
Batteries 07 00087 g004
Figure 5. In operando experiments at different temperatures. (a) Voltage capacity plots of cycle numbers #5, #15, #25, and #45. (b) Charge/discharge capacities and coulomb efficiency as function of cycle numbers (#). The roman numerals refer to different temperatures and battery sequences (see details in Table 2). Total experiment lasted approximately 14 days.
Batteries 07 00087 g005
Table 1. Composition of the six different master solutions.
Content of Electrolyte Solution
Master solutionVanadium (M)H2SO4 (M)H3PO4 (M)(NH4)2SO4 (M)
A1.62.00.050
B1.62.00.100
C1.62.00.050.05
D1.62.00.050.10
E1.62.00.100.05
F1.62.00.150
Table 2. Battery cycling sequence.
PeriodTemperatureConditionsNotes
I35 °C
-
10 cycles
-
30 min pause between charge and discharge (no potential hold)
-
Finalized by a 24 h period of 1.6 V potential hold
No precipitation observed during cycling or potential hold.
II50 °C
-
10 cycles
-
30 min pause between charge and discharge (no potential hold)
-
Finalized by a 24 h period of 1.6 V potential hold
No precipitation observed during cycling or potential hold.
III35 °C
-
10 cycles
-
30 min pause between charge and discharge.
-
Finalized by a 24 h period of 1.6 V potential hold
No precipitation observed during cycling or potential hold.
IV50 °C
-
28 cycles
-
30 min pause in between charge and discharge (no potential hold)
-
Finalized by a 24 h period of 1.6 V potential hold
No precipitation observed during cycling. However, the capacity was observed to decrease. Voltage–capacity plot suggests the carbon felt was oxidized.
V50 °C
-
20 cycles
-
30 min pause in between charge and discharge (no potential hold)
-
Finalized by a 24 h period of 1.6 V potential hold
No precipitation observed during cycling. However, the capacity was observed to decrease. Voltage–capacity plot suggests oxidation/corrosion of the carbon felt electrodes. The selectivity of the membrane started to deteriorate.
Publisher’s Note: MDPI stays neutral with regard to jurisdictional claims in published maps and institutional affiliations.

