3.1. Rate Capability
The current density dependence of the discharge capacity is known to be particularly pronounced in Li-O
2 batteries, because the current directly affects the growth of the discharge products [
3,
19,
20]. Here, we alter the discharge current in order to investigate how it affects the discharge capacity of our GNS-based electrodes, which previously showed an unusual two-step discharge behavior [
18]. The rate performance of GNS-based batteries is tested up to one order of magnitude above and below the standard current density of 150 µA/cm
2 (
Figure 1).
Experiments performed at the standard rate of 150 µA/cm
2 give a reproducible discharge capacity of 7.2 mAh/cm
2 ± 0.4 mAh/cm
2. Increasing or decreasing the rate by one order of magnitude has a significant effect on the discharge capacity: the slowest rate of 15 µA/cm
2 results in more than double the capacity (15.3 mAh/cm
2 ± 0.1 mAh/cm
2) compared to the standard rate and a greatly decreased overpotential. However, these positive effects need to be carefully weighed against the low power density and the extended test duration of 42 days. The highest rate of 1.5 mA/cm
2 results in a negligible discharge capacity of only 0.016 mAh/cm
2 ± 0.012 mAh/cm
2 and a test duration of only a few minutes. The current density dependence of the capacity is illustrated in
Figure 1b. At low current densities, the capacity falls exponentially with increasing current density. In the range between 300 µA/cm
2 and 500 µA/cm
2, it falls even more rapidly.
The most distinct feature of the discharge curves of GNS-electrodes is the two-stage profile with a slope change at about 2.4 V ± 0.1 V. Based on our in-depth study on this discharge profile [
18], the deep discharge of GNS-foam electrodes can be divided into stage I and stage II: the first stage represents the “typical” Li-O
2 behavior, in which discharge products are being deposited on the surface of the cathode particles. The second stage is related to the layered structure of the graphite particles, which undergoes severe volume expansion and allows for further faradaic reactions [
18]. In this rate capability test, the anomalous behavior shows up for all cells that are discharged at current densities between 15 µA/cm
2 and 500 µA/cm
2, which can be seen more clearly in the logarithmic representation of the discharge profile plot in
Figure S1a. The normalized discharge profiles in
Figure S1b show the voltage curve in dependence of the depth of discharge (DoD). When lowering the current density, the onset of the stage II is delayed from about 25% DoD at 150 µA/cm
2 to 60% DoD at 15 µA/cm
2. The share of desired discharge behavior (stage I) can thus effectively be increased by lowering the discharge rate. In some cases, the transition between the two discharge stages is accompanied by a voltage dip, which is best seen in the test at 30 µA/cm
2. This phenomenon (also known as coup de fouet) is likely caused by the super-saturation of the electrolyte with reaction intermediates (e.g., LiO
2) and their subsequent nucleation after overcoming a nucleation overpotential [
21,
22,
23]. Stage II discharge is not initiated for current densities ≥750 µA/cm
2 and the discharge capacity drastically drops to values below 0.08 mAh/cm
2. Increasing the current directly increases the IR polarization of the cell, which shifts the onset potential of stage II below the cut-off at 2.0 V and thus ends the test after stage I. The two-stage mechanism is strongly current-density-dependent, which may be the reason that it has not been observed in other graphite-based electrodes, simply because the discharge currents were too high (or the amount of graphite was too small).
In addition to the electrochemical data, the electrode samples are analyzed post mortem via SEM to investigate the GNS surface after discharge. Prior experimental studies have already investigated the growth mechanisms of the discharge products [
19,
20,
24]. However, we want to check whether the models are also applicable to GNS electrodes and gain more detailed insights into what may cause the end of discharge.
The SEM images in
Figure 2 illustrate how the discharge product morphology changes, from rather thin film-like deposits on the GNS surface at 1.5 mA/cm
2 (b), to micrometer-sized toroidal particles at 15 µA/cm
2 (f). The formation of Li
2O
2 toroids is caused by heterogeneous nucleation and growth as a function of current density, state of discharge, electrolyte properties and possibly by impurities such as H
2O [
4]. Higher rates induce more nucleation that results in smaller particles resembling a thin film deposit. Low rates support the precipitation of Li
2O
2 from the solution on existing Li
2O
2 particles, and the deposits can thus grow in size without covering the carbon surface [
19,
20,
24]. Grown onto GNS, the Li
2O
2 particle diameter decreases from the largest structures of up to 1.3 µm to less than 150 nm with increasing current density, following the measured capacity trend. Increasing the rate not only decreases the particle size, but also increases the particle number due to a higher nucleation rate [
20]. The GNS surface after full discharge at 1.5 mA/cm
2 shows no particulate discharge products. GNS are covered in a thin layer, which is not necessarily Li
2O
2, but could also be residual electrolyte or a solid electrolyte interphase (SEI) layer.
The transition from particulate to thin film discharge products could be explained by transport limitations, which can cause a sharp capacity drop in the
Q(
j) profile [
25]. For the given system, this is observed in
Figure 1b between 300 µA/cm
2 and 500 µA/cm
2. The loss of capacity can have several causes, which depend on the electrode–electrolyte system and is matter of discussion: (i) rate-limiting reaction steps like the ORR, (ii) O
2 transport or (iii) Li
+ transport limitation, (iv) high cell impedance and dielectric passivation can end the discharge [
24,
26,
27,
28]. Current densities of 500 µA/cm
2 and higher result in fairly low amounts of deposited discharge products, which makes an end of discharge due to high cell impedance unlikely. [
18]. The overpotential can be of kinetic origin, but the contribution of ohmic polarization plays a major role as well. Therefore, in order to increase the rate capability of the GNS electrodes, the cell impedance should be lowered.
Generally, a low discharge current density appears as the most effective parameter to both increase the capacity and lower the overpotential, but it may not be suitable when it comes to practical applications. The strong current-dependency of the discharge capacity will render it difficult for Li-O2 cells to achieve their theoretical energy density even at moderate power demands. Generally, C-rates are rarely reported in Li-O2 literature due to the limited reproducibility of cells. However, our system allows us to give an estimation: discharge at 150 µA/cm2 corresponds to C/45, which is a fairly small rate compared to Li-ion batteries that can handle 1C or more. For practical applications that demand more than 1 mA/cm2, the Li-O2 cell performance must be improved significantly. A higher power density (on the cell stack level) could be realized by using thinner electrodes with low tortuosity and shorter mass transport distances. The electrode porosity shall also be optimized by making it as small as necessary to host the discharge products, but avoid pore clogging at the same time. However, downscaled cathodes also imply that there will be more discharge product (mass) on less active material, which will cause a high cell impedances that in turn limits the discharge capacity. While the properties of the lithium anode are fixed and the electrolyte conductivity is physically limited, only cathode upscaling allows for more parallel reaction sites and, eventually, a better rate capability. In the following sections the current density is kept constant at 150 µA/cm2 in order to keep the test times in a reasonable duration of a few days.
3.2. Oxygen Pressure
The O
2 pressure is a parameter that is often overlooked, but should definitely be considered for high-performance Li-O
2 cells due to its known beneficial effects on the discharge capacity and rate capability, and also the O
2 solubility and diffusivity [
29,
30]. In most studies it is typically kept at (only) 1 atm over atmosphere, and higher values are rarely made use of and investigated, despite the fact that insufficient pressure can kinetically restrict the electrochemical reactions [
31]. Therefore, we operate the Li-O
2 batteries at an elevated pressure of 4 atm. The effects of a varied oxygen pressure on the discharge behavior of GNS electrodes are depicted in
Figure 3.
At ambient oxygen pressure (1 atm), a discharge capacity of only 0.8 mAh/cm
2 ± 0.1 mAh/cm
2 is reached and the cell does not exhibit the characteristic two-step profile of the GNS electrode. At 2 atm, the capacity reaches 5.9 mAh/cm
2 ± 0.7 mAh/cm
2, which is already close to the values for the cells at 4 atm (7.2 mAh/cm
2 ± 0.4 mAh/cm
2). The largest capacity of 7.9 mAh/cm
2 ± 0.9 mAh/cm
2 is obtained at 5 atm. Increasing O
2 pressure even further does not result in higher capacities, as cells discharged at 6 atm reach 7.5 mAh/cm
2 ± 0.6 mAh/cm
2.
Supplementary Information Figure S2 shows the discharge profile of an additional test that was carried out at 11 atm (cell-hardware limit) and does not show an improved performance. In contrast to the positive effects caused by a decrease in current density, the discharge voltages and overpotentials of the cells are not significantly affected by O
2 pressure. The observed differences in voltage levels for the tests with 3 atm or higher are within the standard deviation range for GNS electrodes [
18].
The poor discharge capacity obtained at 1 atm demonstrates the performance-limiting effect of an O
2 pressure that is too low. It may be explained mechanistically by the O
2 availability for the ORR during discharge. The perpetual depletion of O
2 at the electrolyte–electrode interface is counteracted by a near-infinite O
2 supply from the gaseous phase, which is transported to the cathode surface through the electrolyte. The rate of O
2 replenishment by diffusion is determined by the overall O
2 concentration in the electrolyte and the rate of O
2 dissolution from the gas phase. Both are factors that strongly depend on the O
2 pressure [
32]. If the O
2 availability at the electrolyte–electrode interface is not sufficient, higher overpotentials and lower discharge capacities are the consequences [
29,
30,
31]. Furthermore, a lack of O
2 adsorption on the cathode surface may also lead to an early end of discharge or diminished reaction rates [
31,
33]. Higher pressures generally promote O
2 adsorption on the electrode surface (according to the Langmuir adsorption model), to the point where the surface becomes saturated and higher O
2 pressure does not further enhance the cell performance [
27]. As the discharge reactions take place in solution at the electrolyte–electrode interface, both oxygen and lithium ions can be mass-transport-limiting. A combination of sufficiently high Li
+ concentration and elevated oxygen pressure, can help to reduce mass transport limitations [
22].
For the given system, a cation concentration of 0.5 M Li
+ in combination with 4 atm O
2 pressure is sufficient to not be limiting at a current density of 150 µA/cm
2. An even higher oxygen pressure could potentially be more beneficial at higher current densities again [
29]. From the investigations it is clear that for GNS electrodes and a current density of 150 µA/cm
2, an O
2 pressure above atmosphere level is necessary to facilitate the discharge reactions.
The O2 pressure will have detrimental impact especially on Li–air batteries that operate at ambient O2 pressure (0.21 atm). From a technological point of view, this makes battery cell or pack designs with on-board O2 storage more desirable than open systems. Increasing pressure beyond 4 atm does not seem useful to further boost the discharge capacity of the lithium oxygen cells, but it could be a step towards closed cell systems, in which the amount of oxygen that is necessary to convert a desired amount of lithium into Li2O2 is stored inside the cell. This would remove the need for an external oxygen supply and thus reduce the weight of peripheral battery cell or pack components, which in turn increases the energy density of the battery. However, conversely, if high O2 pressure is beneficial for the discharge process, it may have adverse effects while charging the battery. To our knowledge, there have been no reports that actively varied oxygen pressure to assist the Li-O2 cell reactions. Furthermore, a systematic study that relates discharge products size and oxygen pressure remains due.
3.3. Electrolyte Salt
Even in the context of the design of high-capacity electrodes, the electrolyte salt plays a major role, because it strongly interferes with the discharge behavior of the Li-O
2 battery. Considering that Li
+ and O
2 transport can also be possible limitations, the electrode interface must not only be considered from the cathode perspective, but from the electrolyte side as well. The electrolyte salt, or more specifically, the anion, can easily be exchanged to manipulate the discharge process. For the two TEGDME-based solutions used in this work, the cation concentrations are set to 0.5 M for LiNO
3 and 1.0 M for LiTFSI, which is in accordance with most literature reports. A recent study on the salt anions suggests that the beneficial (capacity-enhancing) effects of LiNO
3 disappear for concentrations of 0.75 M or higher, mainly due to the passivation of the carbon electrode [
6]. Note that this cathode-focused study is not meant for direct comparison of the salt anion effects, but rather looks at the electrolyte salt as a parameter to tune the cell performance. Its tremendous effect on the discharge behavior of GNS-foam electrodes is seen in
Figure 4, which shows the discharge capacity and the morphology of discharge products as obtained in experiments using LiNO
3 or LiTFSI as electrolyte salt.
When directly comparing the discharge performance of both electrolytes, the discharge capacity of GNS-cells more than doubles from 6.9 mAh/cm
2 for 0.5 M LiNO
3 to 17.8 mAh/cm
2 for 1.0 M LiTFSI. The LiTFSI cell does not display the expected pronounced two-step discharge profile. At about 2 mAh/cm
2, there is a minor voltage dip. Then the voltage enters a plateau around 2.55 V, which is followed by a sudden death at the end of discharge. SEM images (b, c) from the electrode top (close to the O
2 supply) show the expected layer growth of discharge products for LiTFSI in comparison to discharge product particles obtained via LiNO
3. However, this observation does not explain or support the capacity advantage of LiTFSI cells, because discharge product thin films should produce less discharge product per cathode surface area than rotund particles. According to similar experimental studies performed on different electrodes, bigger deposits of discharge products and therefore higher capacities are expected when using LiNO
3 (by enabling the solution-based discharge mechanism) [
5,
6,
7]. Nonetheless, a majority of publications that reported outstanding capacities used LiTFSI as electrolyte salt [
10,
14,
15,
16,
17,
34,
35,
36]. To investigate the reasons behind the measured capacity differences, samples of both electrolyte solutions are analyzed:
First, the water contents of both used electrolytes are determined by Karl Fischer titration for LiTFSI-TEGDME (25 ppm) and LiNO
3-TEGDME (164 ppm). Pure TEGDME contained only 12 ppm H
2O. Besides the reactions with the lithium anode, trace amounts of water support the growth of particulate Li
2O
2 and can therefore increase the discharge capacity [
4,
37,
38,
39]. In our experiments, no discolorations (black, grey or white) of the lithium discs were observed after the discharge duration of several days, which indicates that there is negligible water intrusion into the cell setup. The water introduced via LiNO
3, probably as residual water of crystallization, likely supports the formation of the discharge product particles. Since the LiTFSI-electrolyte is practically dry, possible water contamination is not a reasonable explanation for the superior discharge performance.
Second, the conductivity of both electrolytes is measured to be 2.14 mS/cm for 1.0 M LiTFSI and 0.16 mS/cm for 0.5 M LiNO
3 in TEGDME. The ratio of the conductivities matches literature data using similar electrolyte solutions [
7]. This is further supported by cyclic voltammetry (CV) experiments (
Figure S3), in which the LiTFSI-based electrode shows a much larger peak current than LiNO
3. If the Li
+ transport is the current-density-limiting factor (when using thick electrodes), then LiTFSI-based electrolytes have a clear advantage due to their high ionic conductivity [
5,
7].
A more detailed analysis of discharged electrodes on the microscale is carried out in the electron microscope with EDS.
Figure 5 shows SEM images from the bottom and the top of a GNS electrode discharged with LiTFSI.
The visible discharge products are not similar in shape to the regularly shaped particles that are obtained with the LiNO
3 electrolyte. Instead, there are either subtle thin films or decomposed GNS particles with highly irregular shapes. Thin film coatings and intact GNS are found at the electrode top (
Figure 5a,b), whereas strongly deteriorated areas make up a major part of the electrode bottom (separator side,
Figure 5c,d). The distribution of degraded GNS is therefore similar to LiNO
3 cells, where damage is mainly observed on the lithium-rich side of the electrode that is facing the separator [
18]. The amount of exfoliated GNS can hardly be quantified, but considering the large discharge capacity, it is expected that there is a larger share of exfoliated GNS in LiTFSI cells than in LiNO
3 cells.
Considering the known instability of the electrode–electrolyte interface and reactive oxygen species that are formed during discharge, it should be kept in mind that Li-F (and also Li-S and Li-N) chemistry may compete with the desired Li-O
2 reactions. EDS spot measurements on GNS from the bottom and top of a discharge electrode (
Figure 5e), show fluorine and sulfur signatures in addition to the expected carbon and oxygen signals, even though all samples were washed thoroughly with DME. Decomposition products of LiTFSI could have been incorporated into the discharge product layer. Not containing any fluorine (provided that no fluorine-containing binders or solvents are used) is a clear benefit of LiNO
3-based cells.
For GNS electrodes, there is a possibility that the LiTFSI cells draw most of their capacity from the stage II discharge mechanism. The combination of graphite, as a layered material and a well-known intercalation host, and LiTFSI, as a promotor of thin film discharge products, may facilitate the carbon expansion and exfoliation process at even higher discharge voltages. A key property of the LiTFSI electrolyte, which could promote this behavior, is its high degree of ionic dissociation, which enables Li
+ to intercalate into the graphite layers and allows for reactions in-between them [
22,
40]. In that case, the combination of GNS and LiTFSI turns out to be a highly synergistic combination in which properties like the ionic conductivity outweigh the benefits of alternative discharge pathways. The bias between the discharge model and the achieved discharge capacities with LiNO
3/LiTFSI should be investigated in a systematic study, in which rate capability tests (and also cyclability tests) are carried out for both electrolytes in direct comparison.
3.4. Capacity Optimization
The previous sections demonstrated the impact of three cell parameters on the discharge capacity of GNS electrodes. There is another, although rather more technical parameter that needs to be optimized in order to increase the capacity: the electrolyte volume. By employing 200 µL of electrolyte, the electrode has not been fully utilized as tradeoff for more consistent discharge capacities and reasonable test times. Going up to the maximum filling (400 µL) allows us to linearly scale up the capacities to 13.0 mAh/cm
2 for LiNO
3 and 47.5 mAh/cm
2 for LiTFSI (see
Figure S4). Improving the cathode utilization allows us to get closer to the upper limit of the lithium anode conversion, which is the main challenge for high-capacity Li-O
2 batteries. We emphasize that it is important to always report the amount of electrolyte used, because it can account for a large share of the overall weight of the cell stack. Without detailed electrode and electrolyte data, the energy content of a Li-O
2 cell cannot be assessed on the stack or cell level.
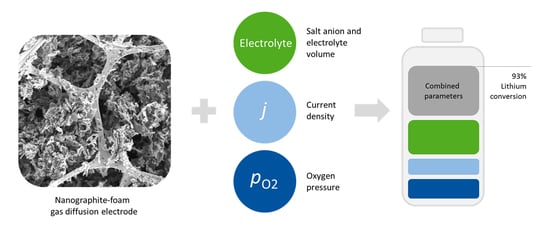
Now, the discussed cell parameters are brought together and combined with a scaled-up electrode. So far, all batteries featured in this work have been limited by processes that are related to cathode–electrolyte interface. Aiming for full conversion of the lithium anode (40 mg, equal to 154.4 mAh or 60.7 mAh/cm
2), a cell is assembled using three stacked GNS-loaded foam electrodes and it is discharged at 150 µA/cm
2 at high O
2 pressure of 11 atm with the 1.0 M LiTFSI electrolyte. In this cell, the total cathode mass (40.9 mg) and electrolyte volume (1.2 mL) are deliberately oversized to get close to the lithium limit. While the beneficial effects of increased O
2 pressure on capacity are reached when applying about 4 atm, this experiment was run at the limit provided by the cell hardware. The current density is not decreased in order to keep the test time reasonably short. The discharge profile is shown in
Figure 6.
The stacking of GNS-foam cathodes proves to be an effective strategy to produce large amounts of discharge products and generate an outstanding discharge capacity. After several hours of discharge operation, at around 2.8 mAh/cm2, the battery shows a pronounced voltage drop to 2.44 V, which likely marks the onset of stage II discharge and the beginning of GNS exfoliation. The discharge of this cell ends with a sudden death after a capacity of 56.3 mAh/cm2 (143.1 mAh). This equals 93% of the theoretical capacity of the lithium anode. Referred to as the GNS weight of 24.4 mg, this means a carbon-specific capacity of 5860 mAh/gcarbon. The corresponding mass of deposited Li2O2 is five times higher than the mass of the GNS as active material.
The discharge products of this cell are analyzed post mortem and
Figure 7 shows the resulting XRD diffractogram and the Raman spectrum of the bottom electrode (closest to the separator).
Qualitative post mortem analysis indicates the occurrence of undesired side reactions: XRD (
Figure 7a) confirms the formation of mainly Li
2O
2, but the diffractogram does not show any side reaction products such as (crystalline) Li
2CO
3. However, Raman spectroscopy that was carried out on the electrode bottom (
Figure 7b) captures more signal intensity for Li
2CO
3 than Li
2O
2. This is in agreement with prior observations from a fully discharged GNS electrode with the LiNO
3-electrolyte [
18]. A noticeable feature in the Raman spectrum of the discharged GNS electrode is a higher carbon peak intensity ratio (
ID/
IG, with the graphic G-band at 1582 cm
−1 and the defect-related D-band at 1350 cm
−1), which may be caused by the narrowing and decrease in G-band signal due to a loss of graphite crystallinity [
41]. Another observation is the appearance of a signal at 1615 cm
−1, which could be a shifted D’-band (1620 cm
−1) or a split G-band (1608 cm
−1), which may be related to intercalation or carbon decomposition processes [
42].
The exact role of Li
+ intercalation during the second stage of discharge, remains unclear. It could be elucidated by operando XRD and Raman spectroscopy. SEM images (
Figure S5) were taken at the top, middle and bottom foam discs, respectively. Notably, the bottom side of the electrode closest to the lithium anode shows the most structurally damaged GNS and irregularly shaped discharge products, similar to the SEM images in
Figure 5. Looking at the overall level of GNS decomposition, only a small share of GNS has undergone deterioration in order to reach this high capacity.
In this experiment, the discharge is limited by the availability of lithium, which has been almost fully removed from the cell bottom. Even close to the end of discharge, this battery stably operates at 2.55 V, and its state of discharge still leaves room for further discharge product deposition. In cathode-limited cells, the discharge will stop, once all electrochemically active GNS is passivated, which is also linked to the state of decomposition of GNS. We estimate that a single GNS-foam electrode is suitable for the conversion of approximately 15 mg of lithium. Using a recently proposed performance metric, which takes both the electrode mass and the discharge products mass into account [
12], the specific capacity is 876 mAh/g(
electrode + Li2O2). This is about 75% of the theoretical capacity of pure Li
2O
2, which is used to calculate the theoretical specific energy of Li-O
2 batteries. Note that this estimation assumes that there is only Li
2O
2 (M = 45.88 g/mol) formed as discharge product and no side reactions occur. The energy released by the discharge of this battery equates to 364 mWh and the cell has a total mass of 1.65 g. On the level of the cell, the specific energy is 225 Wh/kg. Due to the significant electrolyte mass, which is necessary to increase the cathode utilization, the specific energy is far from the desired theoretical levels and closer to Li-ion batteries.
This study points out the dilemma of air electrode design: most cathodes reported in literature, especially those with (carbon) mass loadings <0.1 mg, are greatly undersized and unsuited to convert practically relevant amounts of lithium. If highly porous electrodes are scaled up to host the desired amount of discharge products at a given current density, then this architecture requires a large amount of electrolyte to be fully utilized. This in return counteracts the benefits of the lightweight design. The goal of Li-O
2 batteries with specific energies larger than 500 Wh/kg can only be reached with air electrodes that reach the maximum capacity with the minimum amount both of mass and volume. Besides the correct dimensioning of the electrodes, the cell reactions require further understanding to develop strategies that can prevent side reactions, intrinsic passivation and large microstructural volume changes. The system presented here can surely serve as an effective low-power primary battery, but it has to be questioned whether this can be recharged or cycled hundreds of times at a maximum depth of discharge. Once dissolved, the lithium anode will be hard to restore without loss of electrochemically active material in an O
2-rich environment. Considering the condition of the lithium, separate electrode compartments and anode protection measures are advisable [
43].


