Article

Life Cycle Analysis of Lithium-Ion Batteries for Automotive Applications

Systems Assessment Group, Energy Systems Division, Argonne National Laboratory, DuPage County, Argonne, IL 60439, USA
*
Author to whom correspondence should be addressed.
Batteries 2019, 5(2), 48; https://doi.org/10.3390/batteries5020048
Submission received: 28 March 2019 / Revised: 30 April 2019 / Accepted: 8 May 2019 / Published: 1 June 2019
(This article belongs to the Special Issue Sustainable Lithium Ion Batteries: From Production to Recycling)

Abstract

:
In light of the increasing penetration of electric vehicles (EVs) in the global vehicle market, understanding the environmental impacts of lithium-ion batteries (LIBs) that characterize the EVs is key to sustainable EV deployment. This study analyzes the cradle-to-gate total energy use, greenhouse gas emissions, SOx, NOx, PM10 emissions, and water consumption associated with current industrial production of lithium nickel manganese cobalt oxide (NMC) batteries, with the battery life cycle analysis (LCA) module in the Greenhouse Gases, Regulated Emissions, and Energy Use in Transportation (GREET) model, which was recently updated with primary data collected from large-scale commercial battery material producers and automotive LIB manufacturers. The results show that active cathode material, aluminum, and energy use for cell production are the major contributors to the energy and environmental impacts of NMC batteries. However, this study also notes that the impacts could change significantly, depending on where in the world the battery is produced, and where the materials are sourced. In an effort to harmonize existing LCAs of automotive LIBs and guide future research, this study also lays out differences in life cycle inventories (LCIs) for key battery materials among existing LIB LCA studies, and identifies knowledge gaps.

1. Introduction

In 2016, the global transportation sector consumed 2748 million tons of oil equivalent (Mtoe) energy, accounting for 29% of the world’s total energy consumption. Within the transportation sector, road transportation alone consumed 1927 Mtoe of oil [1]. The enormous energy requirements of the transportation sector and its heavy reliance on petroleum pose serious challenges, as the world strives to meet increasing transportation needs, while aiming to achieve energy security and ensure environmental sustainability. In recent years, electric vehicles (EVs) have been touted as a solution to this problem. Comparative analyses of EVs and internal combustion engine vehicles (ICEVs) have shown that, compared with their fossil fuel-burning counterparts, EVs can substantially reduce energy use and environmental impacts for the same transportation service provided, especially when powered by electricity that is increasingly sourced from renewable sources [2,3,4,5]. Thanks to these potential benefits, EVs have garnered worldwide interest [6]. The global EV sales increased from 118000 in 2012, to 1.15 million in 2017 [7]. Between July 2017 and September 2018, 11 countries pledged to increase their annual EV sales to 30% of all vehicle sales by 2030 [8]. If this goal is achieved, the global EV fleet would further grow 70 fold over the next 12 years [7].
The energy and environmental benefits attainable from driving EVs instead of ICEVs arise from EVs’ higher energy efficiency, and the possibilities to decarbonize the electricity that powers the EVs. However, the production of the lithium-ion battery (LIB), which is a unique energy storage component of EVs, can induce considerable energy and environmental burdens [9,10,11,12]. The overall energy and environmental performances of EVs therefore largely depend on whether the impacts avoided during the use phase of EVs as opposed to ICEVs outweigh the additional impacts resulting from processes pertinent to LIB production. To answer such questions calls for life cycle analysis (LCA), which can transcend different stages over the lifetime of a product or service and provide a holistic picture of its benefits and trade-offs.
LIBs and EVs have attracted avid interest from the LCA community. Peters et al. conducted a literature review on LCA of LIBs and EVs, and their meta-analysis search retrieved 113 studies published between 2000 and 2016 [13]. Despite these studies, the energy and environmental impacts of EVs, especially those associated with LIBs, remain to be fully understood. Peters et al. found that out of the 113 studies reviewed, only 36 provided sufficient information and detailed results for LIB production; out of the 36 studies, only 11 contributed original life cycle inventory (LCI) data [13], which are the collection of materials and energy flows through unit processes that comprise the life cycle and serve as input to the LCA. In fact, most of the existing LCA studies on automotive LIBs are based on LCI data from four studies: Notter et al. (2010) [2], Majeau-Bettez et al. (2011) [9], Dunn et al. (2012) [14], and Ellingsen et al. (2014) [10], owing to their comprehensiveness and transparency. However, these studies were carried out when automotive LIBs were at their early commercialization stage, during which industry data were carefully guarded and, even if accessible, might not reflect current practices. In fact, the LCI data for battery materials in these studies were primarily based on engineering calculations, approximations, and secondary data, which led to large uncertainties and raised questions about how representative these data were of industrial production. Ellingsen et al. obtained industry data for the material compositions of the battery pack and a few components, as well as the energy consumption for cell production and pack assembly [10]. Though an important contribution, these data might not be representative of current commercial-scale automotive LIB production. Dunn et al. pointed out that these “pioneer” battery production facilities might have not fully explored energy conservation opportunities, and could be operating well below design capacity [11]. Energy intensities derived from these facilities, are therefore likely to be overestimates.
To enhance the understanding of the energy and environmental performances of automotive LIBs, this study presents LCA results based on new LCI data that are representative of current practices within the LIB industry, and identifies major contributors to the energy and environmental impacts of LIBs. To harmonize LCA studies of LIBs, this study also reviews LCI data of key battery materials in existing studies, identifies knowledge gaps, and provides recommendations for future research.

2. Methods

The LCA is conducted using the 2018 release of Argonne National Laboratory (Argonne)’s Greenhouse Gases, Regulated Emissions, and Energy Use in Transportation (GREET®) Model [15], with one modification as described in Appendix A. Dunn et al. built the battery LCA module into GREET in 2012 [14]. Since then, the module has been updated regularly to incorporate new industry data as they become available. Specifically, in 2015, we updated the LCIs for the production of synthetic graphite, metallic lithium, and refined nickel, based on secondary industry data [16,17]; in 2017, we updated the LCI for cell manufacturing and pack assembly, based on primary industry data [18]; in 2018, we updated the LCIs for the production of cathode materials, based on primary industry data [19], and the LCIs for the production of battery-grade cobalt salts, based on secondary industry data [20]. Although GREET 2018 covers automotive LIBs based on lithium manganese oxide (LMO), lithium iron phosphate (LFP), lithium nickel cobalt aluminum oxide (NCA), and various lithium nickel manganese cobalt oxide (NMC) chemistries, this study focuses on LIBs based on one NMC, LiNi1/3Mn1/3Co1/3O2 (NMC111), since it is the predominant cathode chemistry used in EVs that are currently sold in the United States, Japan, and Europe [21,22].
The EV LIB pack investigated in this study has a gross pack energy of 23.5 kWh, weighs 165 kg, and contains 140 46-Ah prismatic cells [19]. The energy density of the battery is 197 Wh/kg at the cell level and 143 Wh/kg at the pack level. Each cell uses NMC111 as the active cathode material and graphite as the active anode material. Polyvinylidene difluoride (PVDF) is assumed to be the binder material for both cathode and anode. For other components of the cell, it is assumed that the electrolyte is 1M/L LiFP6 dissolved in 1:1 ethylene carbonate (EC) and dimethyl carbonate (DMC), and the separator is 80 wt% of polypropylene (PP) and 20 wt% of polyethylene (PE). For the production of LIB cells, N-Methyl-2-pyrrolidone (NMP) is assumed to be the solvent for cathode slurry preparation, and water for anode. Produced cells are then assembled into modules, which consist of cells connected in parallel or series, heat conductors, state-of-charge regulator, spacers, and module terminals and enclosure. Modules are further assembled into battery packs, which consist of modules connected in parallel or series, module compression plates and straps, module inter-connect, battery cooling system, battery management system (BMS), pack terminals and heaters, and battery jacket. The bill-of-material (BOM) of the LIB pack is based on Argonne’s Battery Performance and Cost (BatPaC) Model [23]. Detailed material compositions at the cell-, module-, and pack-level are presented in Table S1 in the Supplementary Materials. It should be noted that in GREET, the LIB packs for different EVs scale up or down linearly from this reference battery pack, so we present here the LCA results for 1 kWh of LIB. However, we acknowledge that in reality, the LIB pack BOM and specific energy, both of which are deterministic factors for the LCA results of LIBs, can vary considerably with cell type, pack configuration, battery size, and desired EV performance metrics. We therefore caution against direct application of our per-kWh results to EV LIB packs with notably different characteristics from our reference pack, and also present LCA results for 1 kg of battery materials to facilitate analyses of such LIB packs. Module and pack assembly is assumed to be manual, and therefore not associated with any energy and environmental impacts. For module and pack assembly that is not 100% manual, Ellingsen et al. [10] and Kim et al. [12] found the energy use and environmental impacts to be minimal.
The system boundary of the study is from cradle to gate, which starts with extraction of raw materials (e.g., ores, brine, crude oil) from the ground, and ends with production of the battery pack before it leaves the gate of the factory. Figure 1 depicts the system boundary. The colored boxes represent unit processes, which are individual or aggregated operations that can produce an intermediate or final product, whereas the gray boxes represent the collection of unit processes associated with the production of materials and components in the battery pack (that is, a cradle-to-gate LCA exists in GREET for each of the gray boxes). These processes usually include raw material acquisition, raw material refining to desired grade, and sometimes shape forming of the refined material. For instance, wrought aluminum production consists of bauxite mining, bauxite refining to produce alumina, alumina reduction to produce aluminum, ingot casting, and hot and cold rolling to produce aluminum sheet.
The functional unit of the study is 1 kWh. Examined energy and environmental performance metrics include total energy use, greenhouse gas (GHG) emissions, NOx emissions, SOx emissions, PM emissions, and water consumption. Total energy is the cumulative energy use associated with the processes, including fossil energy and renewable energy. The GHG emissions are calculated based on 100-year global warming potentials for different GHGs (i.e., CO2, CH4, and N2O) as listed in the fifth assessment report of the Intergovernmental Panel on Climate Change [24], and are reported in kg CO2 equivalent (CO2e).

3. Results and Discussion

3.1. LCA Results

Figure 2 presents the cradle-to-gate energy and environmental impacts of 1 kWh NMC111 battery and the contributions of different materials and the cell production process, along with the BOM (i.e., weights of different materials/components). PVDF, steel, insulation material, and coolant are grouped into “Others”, because each of them contributes less than 1% of any impact category. Figure 2 shows that the NMC111 powder is the most significant contributor to the cradle-to-gate energy and environmental burden of NMC111 batteries, accounting for 36.4% of the total energy use, 39.1% of the GHG emissions, 63.5% of the SOx emissions, 47.6% of the NOx emissions, 66.3% of the PM10 emissions, and 31.7% of the water consumption. Aluminum and the cell production process are also substantial contributors. Evidently, 50.8% of the water consumption, 18.1% of the total energy use, 17.0% of the GHG emissions, 15.3% of the PM10 emissions, and 9.2% of the NOx emissions can be ascribed to the aluminum content of the battery, whereas the cell production process represents 19.2% of the total energy use, 19.0% of the GHG emissions, 13.2% of the NOx emissions, and 7.4% of the water consumption. Aside from these three contributors, synthetic graphite is a notable source of NOx, SOx, and PM10 emissions, due to sulfur, nitrogen, and ash impurities in the coal tar pitch and pet coke, which burn off during the carbonation process for graphite production; copper accounts for sizable SOx emissions, because of the processing and refining of copper sulfide ores; and electronic parts result in considerable total energy use and GHG emissions, due to the high energy demand for BMS production. Detailed impact breakdowns are given in Table S2 in the Supplementary Materials.
As mentioned earlier, the material composition of an LIB pack can vary substantially with its configuration and design. To facilitate broader application of our results, we also present here the impact intensities of each material in the LIB pack, as summarized in Table S3 in the Supplementary Materials. On a per-kg basis, electronic parts, NMC111 powder, and LiPF6 are the three biggest contributors to total energy use and GHG emissions; NMC111 powder, copper, and LiPF6 give off the highest amounts of SOx emissions; NMC111 powder, electronic parts, and synthetic graphite are the top three NOx emitters; NMC111 powder, synthetic graphite, and aluminum give off the most amounts of PM10 emissions; and aluminum, NMC111 powder, and electronic parts are the most water-intensive to produce.

3.2. Key Factors Affecting the LCA Results

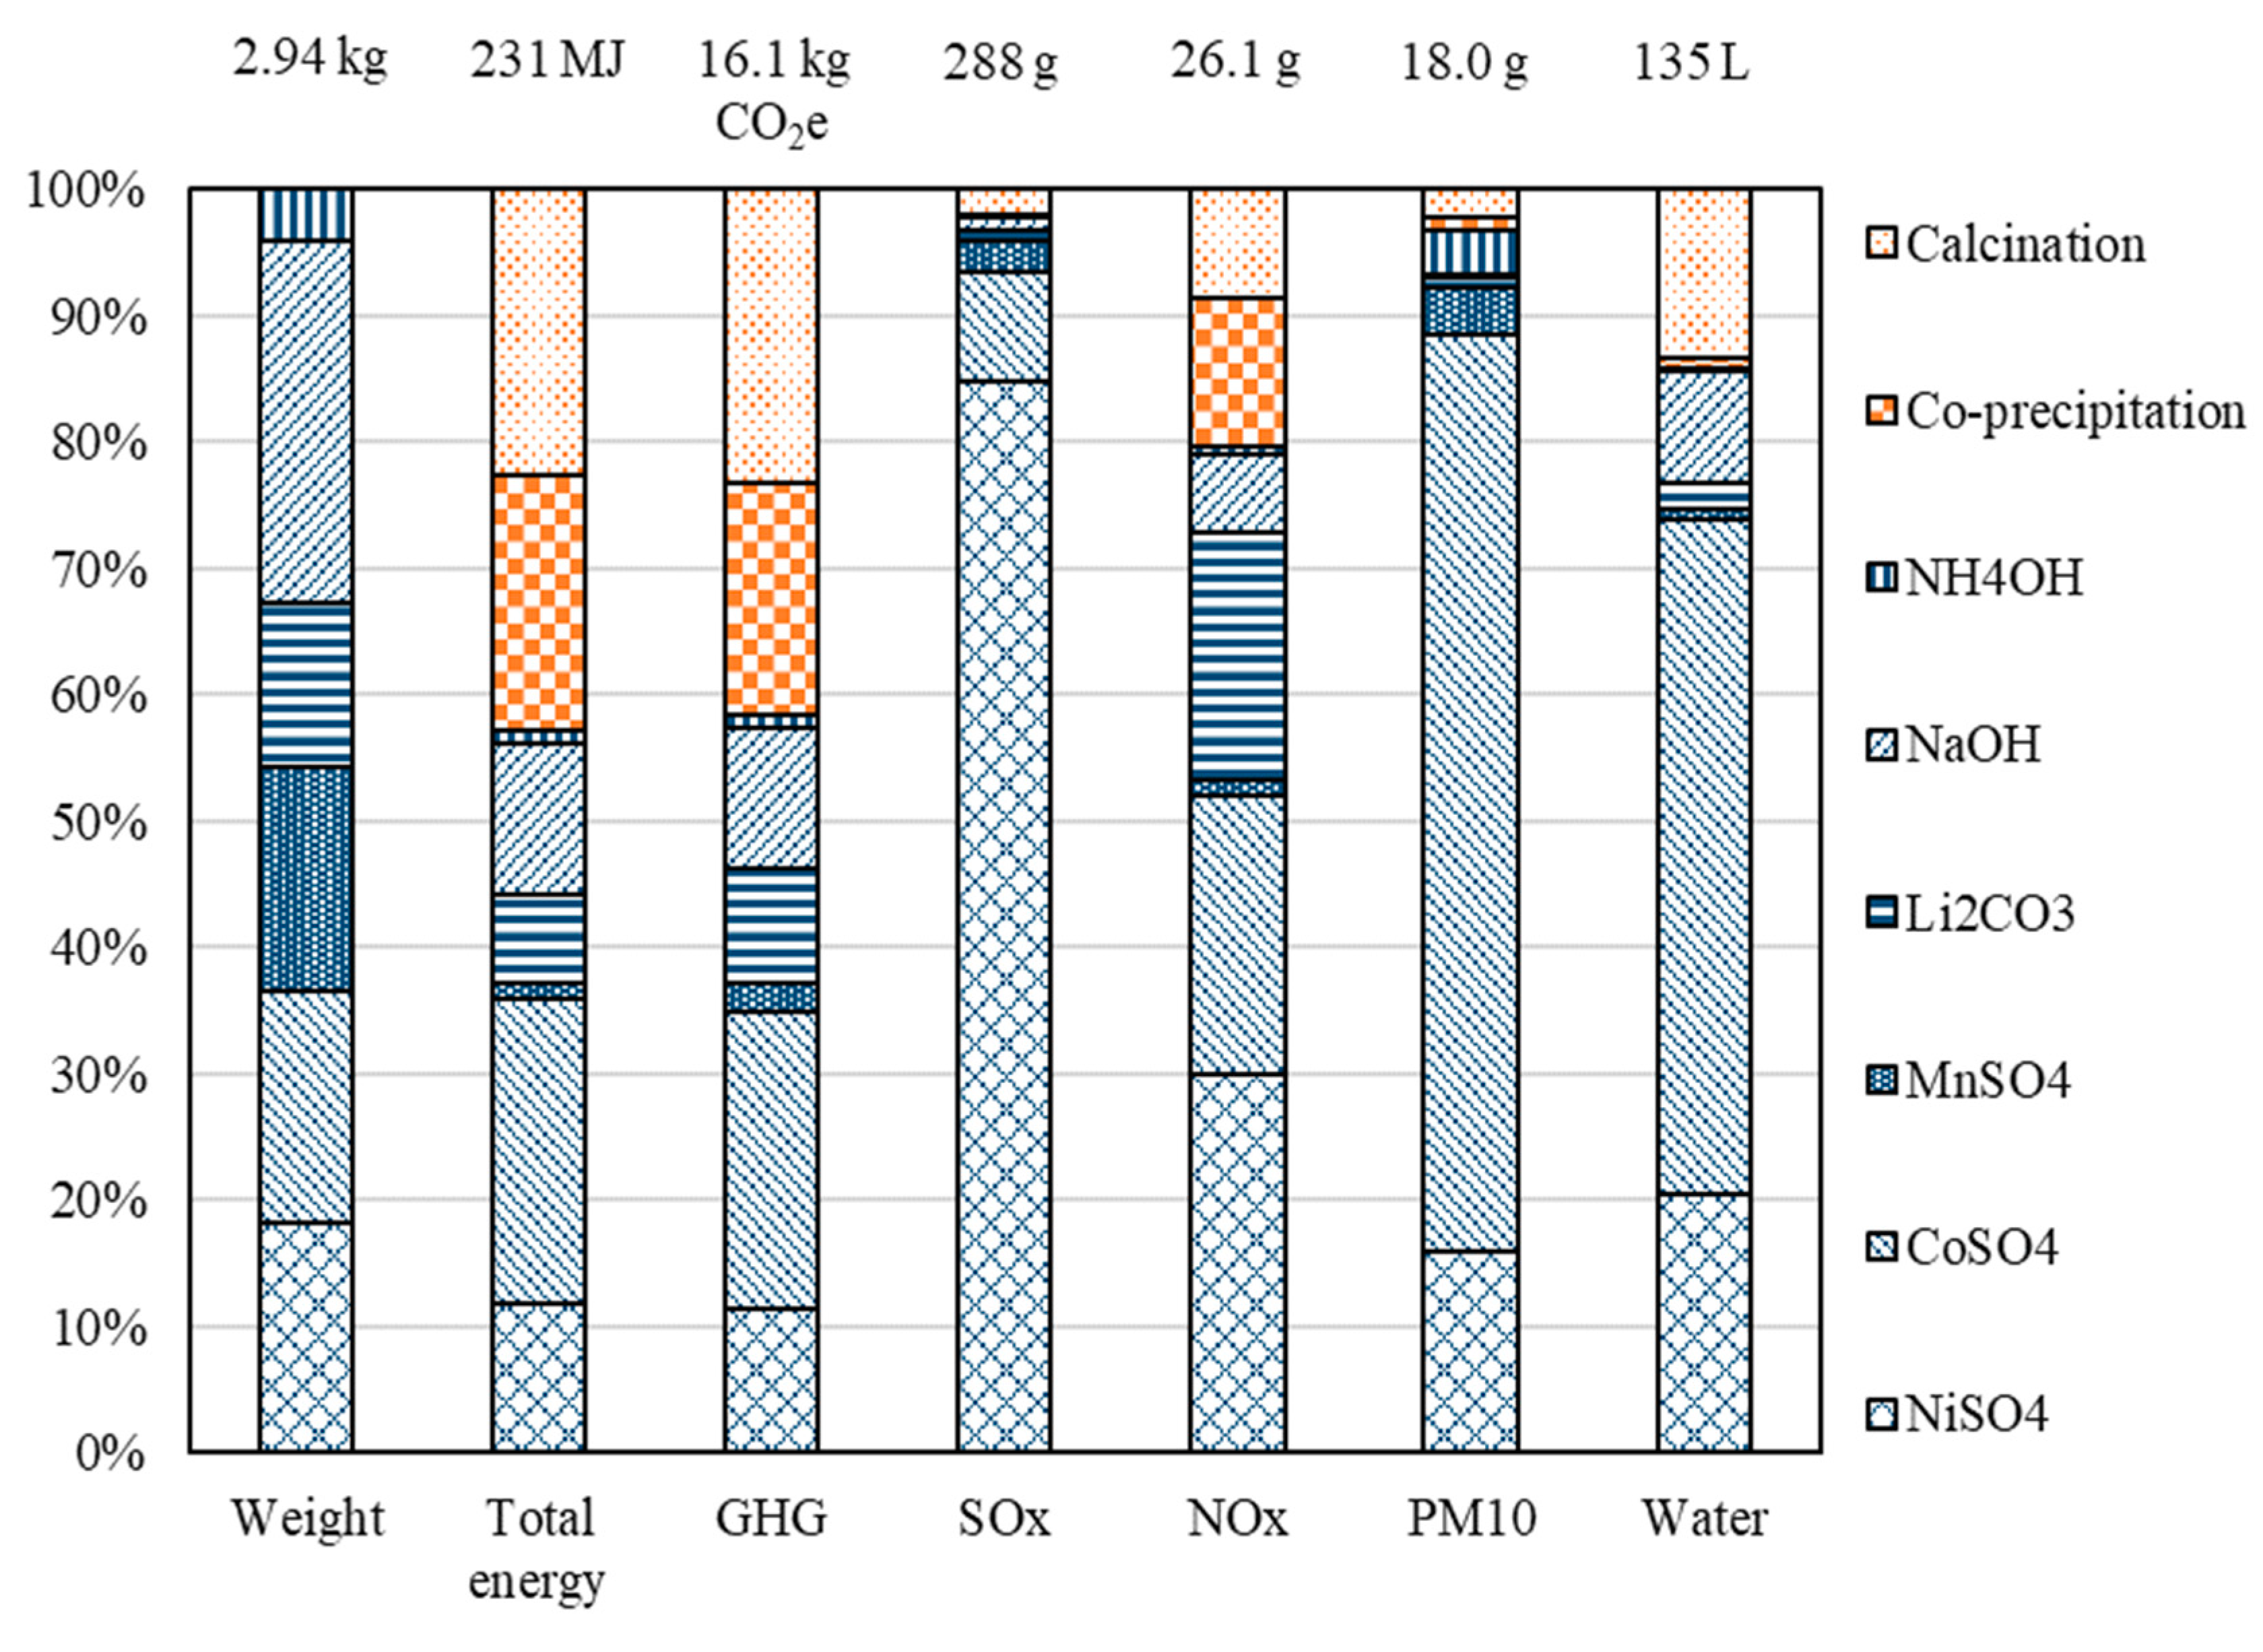
3.2.1. NMC111 Powder Production

The industrial production of NMC111 powder involves reacting NiSO4, MnSO4, and CoSO4 with NaOH and NH4OH to produce Ni1/3Mn1/3Co1/3(OH)2 via co-precipitation, and subsequent calcination of Ni1/3Mn1/3Co1/3(OH)2 and Li2CO3 to produce the cathode powder. The majority of existing LIB LCA studies adopt the LCI for lab-scale NMC powder production reported in Majeau-Bettez et al., which based material inputs on stoichiometric calculation, and energy inputs on engineering calculation [9]. We obtained, through on-site visit and investigation, the material and energy flows associated with NMC111 powder production from a leading cathode material producer in China [19], which is one of the world’s top five NMC suppliers. Our LCI is listed in Table S4 in the Supplementary Materials, together with those reported in Majeau-Bettez et al. [9] and Ellingsen et al. [10].
The primary industry data we obtained show that the NMC111 powder production process is energy-intensive: The co-precipitation step consumes 42.6 MJ of heat to produce 1 kg of Ni1/3Mn1/3Co1/3(OH)2, and the calcination step consumes 25.2 MJ of electricity to produce 1 kg of NMC111 powder [19]. In contrast, Majeau-Bettez et al. estimated that the co-precipitation process did not require any energy inputs, and the calcination process consumed 0.55 MJ of heat per kg of NMC111 powder produced [9]. There are a few reasons for such a striking difference. First, bench-scale and pilot-scale processes reported in literature may not be representative of the actual process used by the industry. For instance, onsite waste treatment is generally not required in lab synthesis processes, but can be mandatory for industrial production. For the co-precipitation step, wastewater treatment at the production facility can account for 45% of the heat demand, because ammonia is removed from the wastewater in an ammonia stripping tower, and sodium sulfate is removed in a four-effect evaporator [19]. We have also learned from the producer that cathode materials for automotive LIB applications need multiple stages of calcination, as opposed to single-stage calcination reported in literature, and therefore result in higher electricity consumption [19]. Second, in the engineering calculation for calcination, Majeau-Bettez et al. assumed a chamber furnace and a utilization coefficient of 33% [9], both of which are reasonable for general industrial operations, but do not apply to cathode powder production. For cathode powder production, raw materials account for over 50% of the production cost, whereas utilities account for less than 5% [25]. The priority of the producer is therefore to maximize material yield and ensure product quality, rather than to improve energy efficiency. As a result, the roller hearth kiln used for calcination is designed with considerable excess capacity for uniform temperature distribution and rapid firing, and thus very energy-intensive to operate. Even if the producer wants to improve the process’s energy efficiency for reasons other than cost, opportunities may be limited, because the kiln is a specialty equipment and may not come with many options.
As for material inputs, estimates based on stoichiometric calculation align well with the industry data, because the producer can achieve a material yield close to 100%. However, we find that in addition to the metal salts and sodium hydroxide, ammonium hydroxide is also required for the co-precipitation step. Furthermore, the lithium salt used in the industrial production of NMC111 for the plant we characterized is lithium carbonate, not lithium hydroxide as reported in literature.
Figure 3 shows the energy and environmental impacts associated with the industrial production of 1 kg NMC111 powder, together with the BOM. Detailed numerical results are presented in Table S5 in the Supplementary Materials. As can be observed from Figure 3, energy demands for co-precipitation and calcination are the major contributor to the total energy use and GHG emissions of the cathode powder production, whereas the production of upstream materials, especially those containing cobalt and nickel, dominates the rest of the impact categories.

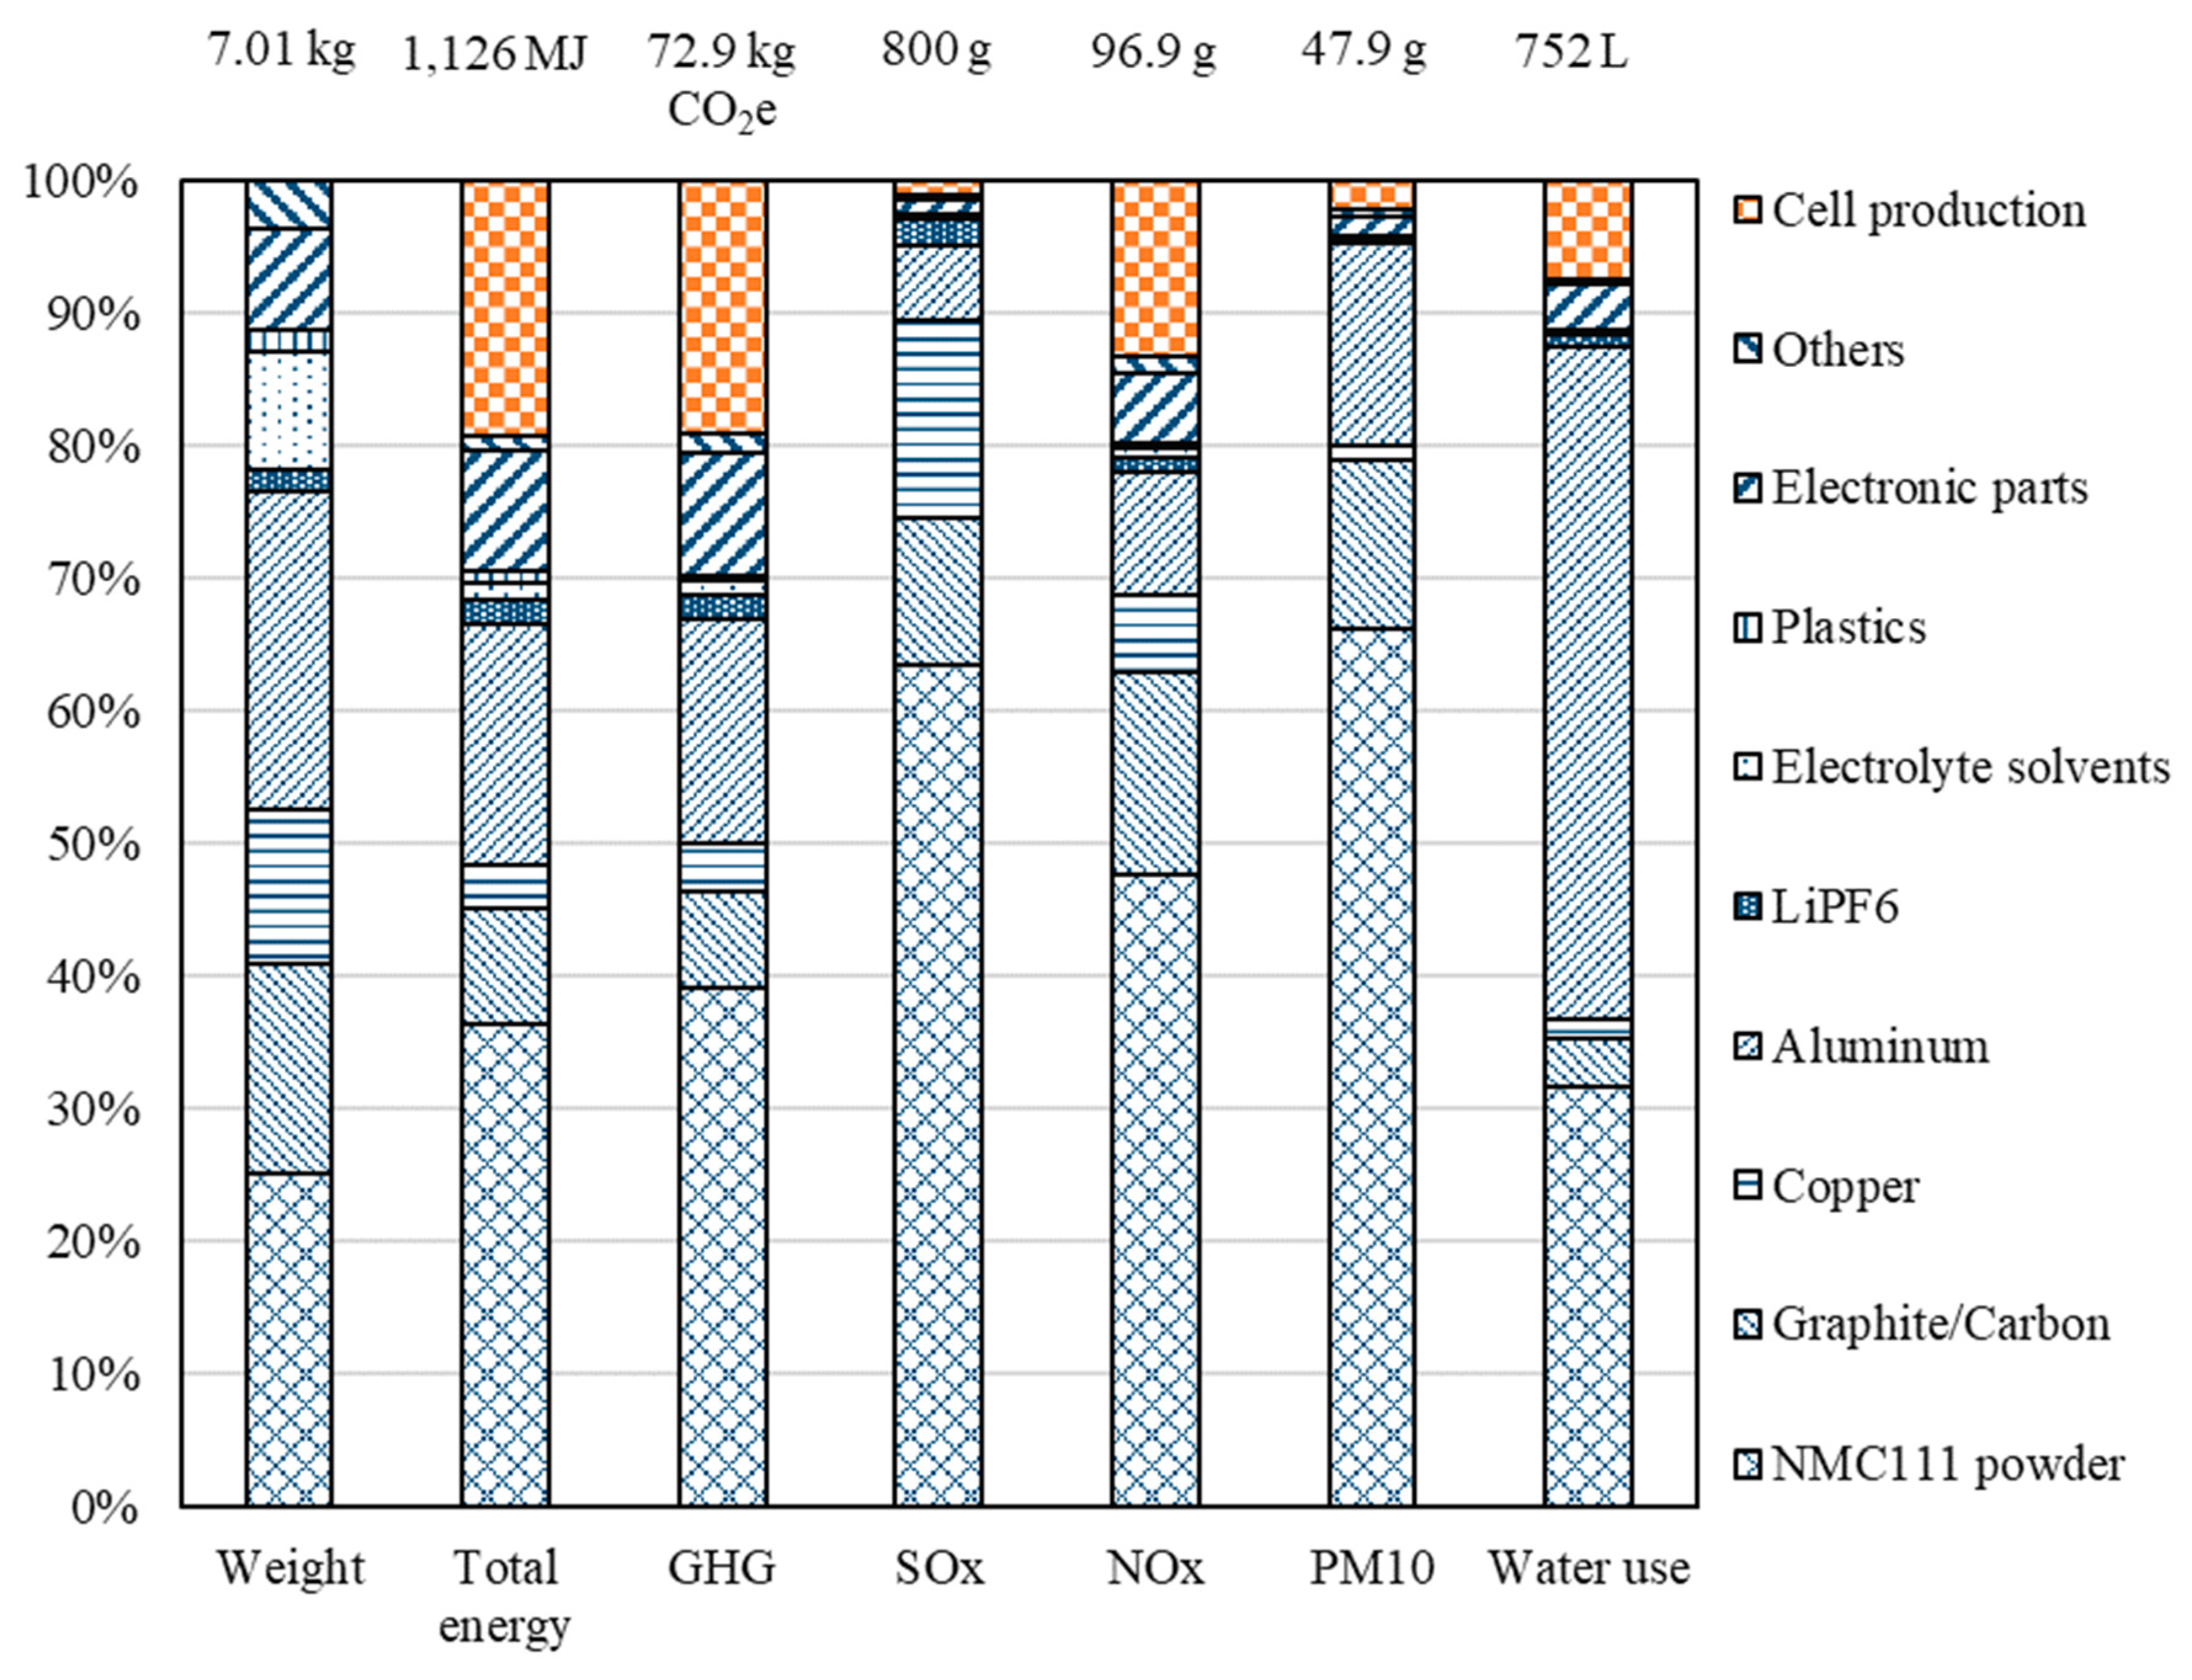
3.2.2. Cell Production

The cell production process consists of slurry preparation, electrode production, cell assembly, and cell conditioning. Electrode production further consists of coating the slurry onto the current collector(s), drying, calendaring, and slitting [26]. Because moisture is detrimental to the electrochemical performance of LIBs, the cell assembly process needs to occur in a dry room, in which the humidity is strictly controlled [26]. Dry room operation has been identified as a predominant driver of energy use for cell production [10,11,27]. Electrode drying can also be a significant contributor, if NMP is used as the solvent for slurry preparation, in which case a large quantity of heated air will be needed for the electrode drying process to keep the NMP vapor concentration well below its flammability limit [28].
Existing studies have found industrial production of LIB cells to be extremely energy-intensive. Ellingsen et al. obtained a cell manufacturer’s monthly electricity use data over an eighteen-month period and reported the electricity intensity for cell production, which had a lower bound value of 586 MJ/kWh cell produced, and an average value of 2318 MJ/kWh cell produced [10]. Similarly, Kim et al. obtained from their (Ford Motor Company’s) cell supplier energy use data for cell manufacturing during January to December, 2014 [12]. Although the original energy use data were not disclosed, Kim et al. estimated the primary energy use for cell production and pack manufacturing to be 1500 MJ/kWh battery produced [12], which could correspond to an electricity intensity of 525 MJ/kWh, assuming a primary energy-to-electricity conversion factor of 0.35. Based on the environmental impact breakdown reported by Kim et al., we estimate that over 90% of the energy intensity can be attributed to cell production.
The industry data we obtained in 2017 from a leading Chinese LIB manufacturer, who is one of the world’s top 10 automotive LIB suppliers, suggest much lower energy intensity for cell production, however. During our on-site visit, the manufacturer disclosed that the production line, which came online in 2016, consumes electricity and steam. Electricity is predominantly used to power 11 dehumidifiers and four industrial chillers, and steam is predominantly used for dehumidification and drying, while the electricity and steam consumptions by other equipment and processes are negligible. The manufacturer also estimated that when operating at 75% capacity, the dry room consumes 7–26 MJ of electricity and 56–71 MJ of steam to produce 1 kWh of cell, depending on the climatic conditions, and the electrode drying process consumes 56–71 MJ of steam per kWh of cell produced. Adding in the electricity requirement to fully charge the battery, which is calculated to be 4 MJ/kWh, we estimate that the energy intensity for cell production is 170 MJ/kWh cell produced, of which 30 MJ is electricity, and 140 MJ is steam [18].
Admittedly, many factors can affect the energy intensity for cell production. For instance, a cell production plant in a hot and humid region would use more energy for dry room operation than one in a temperate climate. A plant that uses NMP for both cathode and anode slurry preparation, as assumed in Ellingsen et al. [10], would have higher energy demand for electrode drying than one that uses water. However, we believe the deterministic factor is the production capacity of the plant and its throughput.
Ellingsen et al. did not provide any information about the cell manufacturer who supplied the energy use data, except that it was based in East Asia [10]. Nonetheless, we estimate that its production capacity was well below 1 GWh per year at the time when the data were collected, because the global automotive LIB sales totaled less than 5 GWh in 2012, and less than 10 GWh in 2013 [22]. In contrast, the energy use data we obtained represent energy use of a production line with a capacity of 40,000 43-Ah 3.7-V prismatic NMC cells per day, which amount to 2 GWh per year. Ellingsen et al. acknowledged that the substantial variation in the energy intensities they derived indicated that the energy efficiency of the plant could be improved [10], while the plant from which we obtained our data has adopted energy efficiency measures in an effort to reduce cell production cost.
Kim et al. disclosed that the energy use data were measured at the Ochang plant of LG Chem in South Korea [12]. The Ochang plant was capable of producing 200,000 EV batteries in 2014 [29], which translate into a capacity of approximately 3–4 GWh per year. However, all battery producers in South Korea collectively produced approximately 70,000 EV batteries in 2014 [30], suggesting severe underutilization of the Ochang plant. Although, when the demands are low, the battery manufacturer can choose to idle some of the production lines to reduce operating cost, we doubt that the severe underutilization experienced at the Ochang plant in 2014 could be fully mitigated in this manner, because at least one production line needs to remain operating for each cell design on order. As the volume of a dry room dictates its energy use regardless of the throughput [27], underutilization would lead to overestimation of energy intensity for cell production.

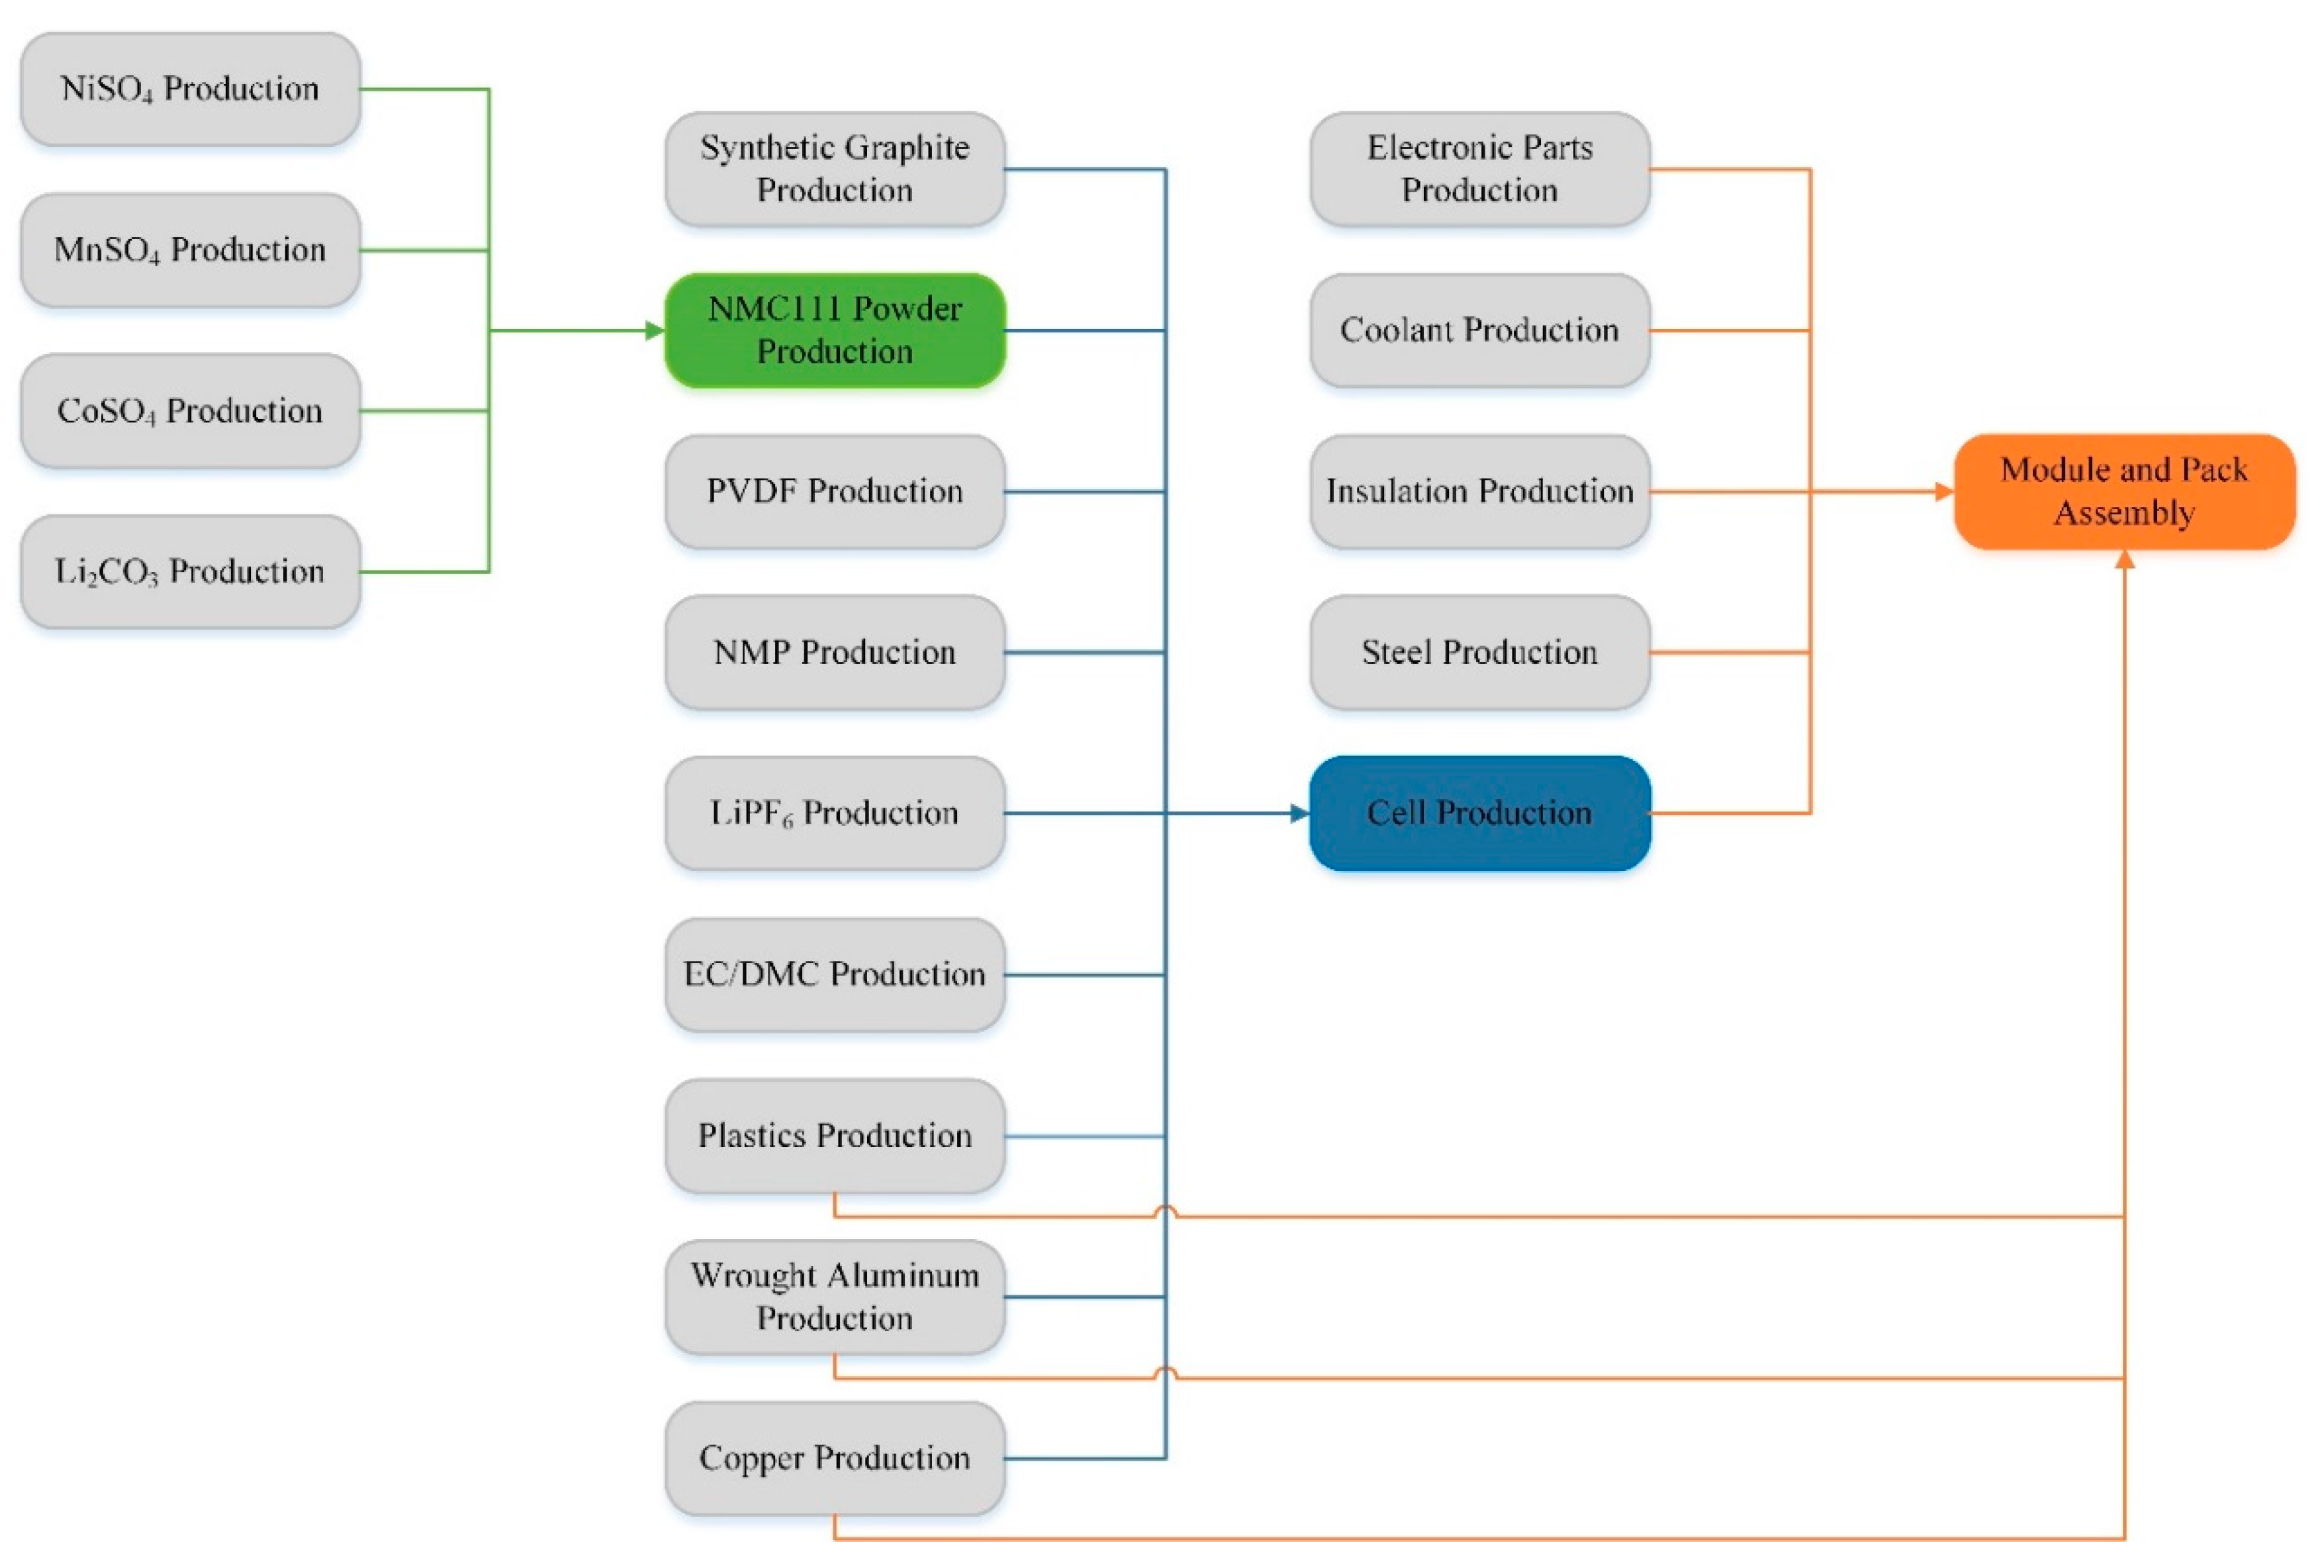
3.2.3. The LIB Supply Chain

The locations of the production facilities, and the origins of the battery materials, can also significantly affect the cradle-to-gate energy and environmental impacts of LIBs. Figure 4 presents the process energy use pertaining to the production of each material contained in 1 kWh of NMC111 battery, and the energy demand for cell production, broken down by electricity and fuel. Fuel includes natural gas, coal, residual oil, diesel, and gasoline. The process energy use is the sum of all purchased energy consumed for virgin material production, including that used for raw material extraction, processing, and refining, but excluding that used as material feedstock, such as the portion of natural gas and petroleum used in the production of plastics that are converted into ethylene. Figure 4 shows that the collective upstream production of battery materials is much more energy-intensive than the cell production process. Figure 4 also shows that some of the materials embodied in 1 kWh of NMC battery, especially aluminum, NMC111 powder, and the electronic parts, require large amounts of electricity to produce. The cell production process also uses a considerable amount of electricity. Since the electricity mix for materials and cell production can vary substantially across geographic regions, the energy and environmental impacts of battery production need to be discussed in tandem with the battery supply chain.
GREET 2018 assumes that battery production is based in the United States, with materials available in the U.S. market. The assumed geographical distribution of the activities pertaining to NMC111 battery production is depicted in Figure S1 in the Supplementary Materials. The results shown in Figure 2 and Figure 3 are reflective of these assumptions. Specifically, it is assumed in GREET that aluminum is sourced from North America, and 81% of the electricity used for primary aluminum smelting in North America is hydroelectric [31]. This explains the significant water footprint of aluminum as shown in Figure 2 (since evaporation from the reservoir surface is included in the life-cycle water consumption in GREET), and the relatively small contributions of aluminum to other impact categories that at first glance do not seem to match up with its process energy use. Should the aluminum come from a region that powers its aluminum smelters with electricity generated from fossil fuels, the resultant cradle-to-gate water use of the NMC battery will be notably reduced, whereas the rest of the impacts will be markedly higher. Similarly, the substantial water consumption by CoSO4 can also be traced back to the hydroelectricity use in Congo for cobalt ore mining and processing [20].
It is also assumed in GREET that the NMC111 powder and the battery are produced in the United States, with electricity from the national grid. The orange bars in Figure 2 and Figure 3 are calculated based on 2017 U.S. national grid mix, which is 32.7% coal, 29.8% natural gas, 20.6% nuclear, 7.7% hydroelectric, 6.4% wind, and 2.7% others [32]. If the production of NMC111 powder and/or the battery occurs in a region that relies predominantly on renewables for electricity generation, the associated total energy use and the emissions would be considerably lower.
In addition to the electricity mix, the industrial practices in one region can also differ from those in another. For example, the production of cobalt from sulfide ores generates large amounts of SO2 emissions from the ore roasting step, as does nickel production from sulfides. However, in Congo, the SO2 emissions generated from copper–cobalt ores roasting are captured to produce sulfuric acid. Because Congo does not have a chemical industry, the ore processing plants there produce sulfuric acid on-site from imported sulfur. The facility that converts SO2 from sulfur roasting into sulfuric acid also converts SO2 from ore roasting that would otherwise be emitted, to partially meet the sulfuric acid demand of the hydrometallurgical ore processing plant, thereby reducing operating cost [20]. SO2 emissions generated from nickel production at the plants of Norilsk Nickel in Russia, on the contrary, have been emitted into the atmosphere and raised serious environmental concerns, while other nickel smelters all over the world have adopted emission control measures to curtail their SO2 emissions [33,34]. Battery-grade nickel salts production in GREET is based on global class 1 nickel (99% nickel content or more) production, including that in Russia [17], which significantly drives up the SOx emissions from NiSO4 and ultimately NMC111 powder production. This explains the stark difference between SOx emissions from CoSO4 and those from NiSO4, as shown in Figure 3. The high PM10 emissions from CoSO4 production can also be explained by practices specific to cobalt ore mining in Congo, where excavated low-grade ores typically remain stockpiled until all high-grade ores in the deposit are mined and processed, which can take 20–30 years. Wind erosion of the stockpile over such a long time leads to large amounts of PM10 emissions [35]. Moreover, diesel and reagents used for copper–cobalt ore mining and processing in Congo have to be imported and transported by trucks over long distances, mostly on dirt roads, which also results in substantial PM10 emissions [20,35].

3.3. Knowledge Gaps

As a case in point, the production of NMC111 powder has demonstrated the value of industry data to battery LCA. Unfortunately, industry data for the rest of the battery materials remain meager to nonexistent, forcing LCA researchers to resort to engineering calculations or approximations to fill the data gaps. The assumptions made in existing LCA studies for key battery materials are summarized in Table 1.
Romare and Dahllof reviewed existing LCA studies on automotive LIBs, and proposed that the LCI for the electronic parts should be improved [37]. We hold the same opinion, given the complexity of the electronic parts and their high impact intensities, as shown in Table S3 in the Supplementary Materials. In addition, we believe the LCIs for graphite, LiPF6, and the separator should also be improved in future studies, preferably with primary industry data. Graphite is the third most abundant material found in an NMC111 battery. However, its production energy demand may have been considerably underestimated in existing LCA studies. Notter et al. modeled graphite production by natural graphite mining and processing followed by calcination, and the energy requirement for the calcination step was based on thermodynamic calculations [2]. In GREET 2018, graphite is assumed to be produced from pet coke and coal tar pitch by carbonation followed by graphitization, and the energy demand was estimated based on secondary industry data and thermodynamic calculations [16]. In both cases, the materials and energy requirements for particle refinement, the final step to producing battery-grade graphite [38], are not accounted for. For the production of LiPF6, existing LCIs in Notter et al. and GREET were based on laboratory synthesis processes, which may not be representative of industrial production. Moreover, the energy consumptions were estimated from thermodynamic calculations, which could be serious underestimates. For the separator, existing studies modeled it as a mixture of common plastics, without considering the manufacturing processes involved. The separator could be the second largest contributor to the materials’ cost for cell production [26], and sell for $160/kg [23]. Modeling it simply by its material composition, therefore runs the risk of leaving out potentially consequential value-added processes, which may be associated with significant materials and energy requirements.

3.4. LIB LCA Harmonization

There have been some efforts to harmonize the results from existing LCA studies on LIBs [39,40,41]. Here, we discuss two harmonization opportunities at the LCI level: Solvent use for slurry preparation in cell production, and the recycled content of aluminum used in the battery. The assumed solvent types and quantities in existing LCA studies are summarized in Table 2.
Table 2 shows a marked difference in the assumed solvent consumption between GREET and other studies. We believe the assumptions made in the other studies may not represent the current industrial practice, where NMP is typically used as the solvent for cathode slurry preparation, and water for anode [26,42]. Furthermore, due to its high cost and associated safety and environmental concerns, NMP is recovered from electrode drying and recycled [28,42], resulting in minimal loss from the process. Although NMP is not a significant contributor to any of the impact and emission categories examined in this study, the LCA results reported by Ellingsen et al. [10] indicate that the assumed NMP consumption could have a profound impact on the marine eutrophication potential of the battery.
For aluminum components in the battery, existing studies [2,9,10] used the aluminum production mix in the ecoinvent database. Ellingsen et al. clarified that the aluminum production mix in ecoinvent 2.2 assumed 32% recycled content, of which 10% came from old scrap and 22% from new scrap [10]. In GREET 2018, a recycled content of 11% is assumed for aluminum used in battery production. It should be noted, however, that the aluminum used for battery production could be 100% virgin, because, except for aluminum cans, post-consumer (old) wrought aluminum scraps are typically down-cycled as cast aluminum [43], whereas the differences in alloy grades and specifications for the aluminum components in LIBs may pose challenges to closed-loop recycling of manufacturing (new) aluminum scraps. As primary aluminum production and secondary aluminum production have very different energy and environmental profiles, the assumed recycled content of aluminum could considerably affect the LCA results of LIBs.
Since many of the existing battery LCA studies rely on background data in ecoinvent, we also compare the GHG emission intensities of select battery materials and components evaluated with GREET 2018 with those evaluated with ecoinvent 2.2 [10,44] and ecoinvent 3.1 [37], and summarize the results in Table 3. Table 3 shows significant differences in GHG emission intensities between GREET and ecoinvent for cobalt and LiPF6, most likely due to different assumed production pathways and data coverages for these materials. The differences in GHG emission intensities for battery components shown in Table 3 are the combined result of different LCIs assumed for the component and different material GHG emission intensities from the background database. For instance, when evaluated with GREET 2018, the LCI for cathode paste assumed in this study results in a GHG emission intensity of 14.8 kg CO2e/kg, while the LCI for cathode paste assumed by Ellingsen et al. results in a GHG emission intensity of 17.5 kg CO2e/kg. In contrast, when evaluated with ecoinvent 2.2, the same LCI assumed by Ellingsen et al. results in a GHG emission intensity of 7.1 kg CO2e/kg.

4. Conclusions

Based on data representative of current large-scale industrial production of LIBs, we conclude that the upstream production of battery materials as a whole incurs more energy and environmental burdens than the cell production and pack assembly process. We also find that the active cathode material, aluminum, and energy use for cell production are the three most notable contributors to the cradle-to-gate energy and environmental impacts associated with NMC111 batteries. However, we also acknowledge that the LCA results depend to a large extent on battery BOM and the battery supply chain. Since the battery BOM can vary considerably with battery design and configuration, and the battery supply chain can differ substantially across geographic locations, we forgo comparison of our LCA results with those reported in other studies. To make such a comparison meaningful would require that the LCIs reported in different studies are harmonized and then evaluated with the same background LCA database, as done by Peters et al. [41], which is beyond the scope of this study. Instead, we lay out major differences between the LCIs of this study and those reported by others, to facilitate interpretation of our results. In light of the dynamic and diverse nature of the LIB industry, future battery LCA studies should be as transparent as possible about the assumptions made and the data used, so as to put the results into context and enable comparison between different studies. Future battery LCA studies could also explore the temporal and spatial variations of the production processes of battery materials and cells to provide a more comprehensive picture of the sustainability of the global LIB industry.
We also find that data representative of large-scale industrial production is key to battery LCA. The LCI data we present in this study represent cell production and pack assembly in 2017 at one of the world’s top ten automotive LIB producers, and NMC powder production in 2018 at one of the world’s top five NMC producers. However, other producers may use different production processes, and the technologies and process designs can evolve over time. As the world ramps up LIB production, nine battery production plants, each with a production capacity greater than 20 GWh per year, had been announced by 2018 [30]. Once completed and put into operation, these plants could substantially change the LIB supply chain as we know it, and have profound impacts on the sustainability of LIBs. Future studies should continue to solicit information from the battery industry, especially those on battery-grade materials production and cell production from large-scale commercial plants, to enhance our understanding of the energy and environmental performances of LIB, and identify opportunities of improvement.

Supplementary Materials

The following are available online at https://www.mdpi.com/2313-0105/5/2/48/s1, Figure S1: Geographical distribution of NMC111 battery production activities, Table S1: BOM of the reference 23.5 kWh NMC111 battery pack, Table S2: Cradle-to-gate LCA results for 1 kWh of NMC111 battery, Table S3: Impact intensities per-kg materials in the NMC battery, Table S4: Comparison of reported LCIs for NMC powder production, Table S5: Cradle-to-gate LCA results for 1 kg of NMC111 powder.

Author Contributions

Conceptualization, Q.D., J.C.K., L.G. and M.W.; Formal analysis, Q.D.; Writing—original draft preparation, Q.D.; writing—review and editing, Q.D., J.C.K., L.G. and M.W.

Funding

This research was funded by the U.S. Department of Energy under contract DE-AC02-06CH11357.

Acknowledgments

We would like to thank David Howell and Samuel Gillard from the Vehicle Technologies Office, Office of Energy Efficiency and Renewable Energy, the U.S. Department of Energy for their support.

Conflicts of Interest

The authors declare no conflict of interest.

Appendix A

Results presented in this study are evaluated with a revised version of GREET2 2018, in which 1 kg of nickel sulfate is assumed to be produced from reacting 0.379 kg of refined nickel (GREET2, “Other_Cathodes” tab, cell A6 and B6) with 0.634 kg of sulfuric acid, while the official version of GREET2 2018 assumes that 1 kg of nickel sulfate is produced from reacting 0.483 kg of nickel oxide (NiO) with 0.634 kg of sulfuric acid, and uses refined nickel as a proxy for NiO.

References

  1. International Energy Agency. Key World Energy Statistics. 2018. Available online: https://www.iea.org/statistics/kwes/ (accessed on 14 December 2018).
  2. Notter, D.A.; Gauch, M.; Widmer, R.; Wäger, P.; Stamp, A.; Zah, R.; Althaus, H.-J. Contribution of Li-Ion Batteries to the Environmental Impact of Electric Vehicles. Environ. Sci. Technol. 2010, 44, 6550–6556. [Google Scholar] [CrossRef]
  3. Faria, R.; Marques, P.; Moura, P.; Freire, F.; Delgado, J.; de Almeida, A.T. Impact of the electricity mix and use profile in the life-cycle assessment of electric vehicles. Renew. Sustain. Energy Rev. 2013, 24, 271–287. [Google Scholar] [CrossRef]
  4. Hawkins, T.R.; Singh, B.; Majeau-Bettez, G.; Strømman, A.H. Comparative Environmental Life Cycle Assessment of Conventional and Electric Vehicles. J. Ind. Ecol. 2013, 17, 53–64. [Google Scholar] [CrossRef]
  5. Bauer, C.; Hofer, J.; Althaus, H.-J.; Del Duce, A.; Simons, A. The environmental performance of current and future passenger vehicles: Life cycle assessment based on a novel scenario analysis framework. Appl. Energy 2015, 157, 871–883. [Google Scholar] [CrossRef]
  6. Stephens, T.; Zhou, Y.; Burnham, A.; Wang, M. Incentivizing Adoption of Plug-in Electric Vehicles: A Review of Global Policies and Markets. ANL/ESD-18/7; 2018. Available online: https://greet.es.anl.gov/publication-incentivizing_pev (accessed on 21 January 2019).
  7. International Energy Agency. Global EV Outlook 2018. 2018. Available online: https://www.iea.org/gevo2018/ (accessed on 14 December 2018).
  8. International Energy Agency. EV30@30 Campaign. 2018. Available online: https://www.iea.org/media/topics/transport/3030CampaignDocumentFinal.pdf (accessed on 14 December 2018).
  9. Majeau-Bettez, G.; Hawkins, T.R.; Strømman, A.H. Life Cycle Environmental Assessment of Lithium-Ion and Nickel Metal Hydride Batteries for Plug-In Hybrid and Battery Electric Vehicles. Environ. Sci. Technol. 2011, 45, 4548–4554. [Google Scholar] [CrossRef]
  10. Ellingsen, L.A.-W.; Majeau-Bettez, G.; Singh, B.; Srivastava, A.K.; Valøen, L.O.; Strømman, A.H. Life Cycle Assessment of a Lithium-Ion Battery Vehicle Pack. J. Ind. Ecol. 2014, 18, 113–124. [Google Scholar] [CrossRef]
  11. Dunn, J.B.; Gaines, L.; Kelly, J.C.; James, C.; Gallagher, K.G. The significance of Li-ion batteries in electric vehicle life-cycle energy and emissions and recycling’s role in its reduction. Energy Environ. Sci. 2015, 8, 158–168. [Google Scholar] [CrossRef]
  12. Kim, H.C.; Wallington, T.J.; Arsenault, R.; Bae, C.; Ahn, S.; Lee, J. Cradle-to-Gate Emissions from a Commercial Electric Vehicle Li-Ion Battery: A Comparative Analysis. Environ. Sci. Technol. 2016, 50, 7715–7722. [Google Scholar] [CrossRef] [PubMed]
  13. Peters, J.F.; Baumann, M.; Zimmermann, B.; Braun, J.; Weil, M. The environmental impact of Li-Ion batteries and the role of key parameters—A review. Renew. Sustain. Energy Rev. 2017, 67, 491–506. [Google Scholar] [CrossRef]
  14. Dunn, J.; Gaines, L.; Barnes, M.; Sullivan, J.; Wang, M. Material and Energy Flows in the Materials Production, Assembly, and End-of-Life Stages of the Automotive Lithium-Ion Battery Life Cycle. ANL/ESD/12-3 Rev; 2012. Available online: https://greet.es.anl.gov/publication-li-ion (accessed on 14 December 2018).
  15. Argonne National Laboratory. GREET Model: The Greenhouse Gases, Regulated Emissions, and Energy Use in Transportation Model. 2018. Available online: https://greet.es.anl.gov/ (accessed on 14 December 2018).
  16. Dunn, J.; James, C.; Gaines, L.; Gallagher, K.; Dai, Q.; Kelly, J.C. Material and Energy Flows in the Production of Cathode and Anode Materials for Lithium-Ion Batteries. ANL/ESD-14/10 Rev; 2015. Available online: https://greet.es.anl.gov/publication-anode-cathode-liion (accessed on 14 December 2018).
  17. Benavides, P.T.; Dai, Q.; Sullivan, J.; Kelly, J.C.; Dunn, J. Material and Energy Flows Associated with Select Metals in GREET2: Molybdenum, Platinum, Zinc, Nickel, Silicon. ANL/ESD-15/11; 2015. Available online: https://greet.es.anl.gov/publication-mo-pt-zn-ni-si (accessed on 14 December 2018).
  18. Dai, Q.; Dunn, J.; Kelly, J.C.; Elgowainy, A. Update of Life Cycle Analysis of Lithium-Ion Batteries in the GREET Model. 2017. Available online: https://greet.es.anl.gov/publication-Li_battery_update_2017 (accessed on 14 December 2018).
  19. Dai, Q.; Kelly, J.C.; Dunn, J.; Benavides, P. Update of Bill-of-Materials and Cathode Materials Production for Lithium-Ion Batteries in the GREET Model. 2018. Available online: https://greet.es.anl.gov/publication-update_bom_cm (accessed on 14 December 2018).
  20. Dai, Q.; Kelly, J.C.; Elgowainy, A. Cobalt Life Cycle Analysis Update for the GREET Model. 2018. Available online: https://greet.es.anl.gov/publication-update_cobalt (accessed on 14 December 2018).
  21. Blomgren, G.E. The Development and Future of Lithium Ion Batteries. J. Electrochem. Soc. 2017, 164, A5019–A5025. [Google Scholar] [CrossRef]
  22. Pillot, C. The Rechargeable Battery Market and Main Trends 2017–2025. Presented at the 2018 International Battery Seminar & Exhibit, Fort Lauderdale, FL, USA, 26–29 March 2018. [Google Scholar]
  23. Argonne National Laboratory. BatPaC: A Lithium-Ion Battery Performance and Cost Model for Electric-Drive Vehicles. 2018. Available online: http://www.cse.anl.gov/batpac/ (accessed on 14 December 2018).
  24. IPCC. Climate Change 2014: Synthesis Report. Contribution of Working Groups I, II and III to the Fifth Assessment Report of the Intergovernmental Panel on Climate Change; Core Writing Team, Pachauri, R.K., Meyer, L.A., Eds.; IPCC: Geneva, Switzerland, 2014; 151 p. [Google Scholar]
  25. Ahmed, S.; Nelson, P.A.; Gallagher, K.G.; Susarla, N.; Dees, D.W. Cost and energy demand of producing nickel manganese cobalt cathode material for lithium ion batteries. J. Power Sources 2017, 342, 733–740. [Google Scholar] [CrossRef] [Green Version]
  26. Kwade, A.; Haselrieder, W.; Leithoff, R.; Modlinger, A.; Dietrich, F.; Droeder, K. Current status and challenges for automotive battery production technologies. Nat. Energy 2018, 3, 290–300. [Google Scholar] [CrossRef]
  27. Ahmed, S.; Nelson, P.A.; Dees, D.W. Study of a dry room in a battery manufacturing plant using a process model. J. Power Sources 2016, 326, 490–497. [Google Scholar] [CrossRef] [Green Version]
  28. Ahmed, S.; Nelson, P.A.; Gallagher, K.G.; Dees, D.W. Energy impact of cathode drying and solvent recovery during lithium-ion battery manufacturing. J. Power Sources 2016, 322, 169–178. [Google Scholar] [CrossRef] [Green Version]
  29. Business Korea. LG Chem to Bring Holland Battery Online This Year. 2015. Available online: http://www.businesskorea.co.kr/news/articleView.html?idxno=10499 (accessed on 17 December 2018).
  30. Lutsey, N.; Grant, M.; Wappelhorst, S.; Zhou, H. Power Play: How Governments are Spurring the Electric Vehicle Industry. 2018. Available online: https://www.theicct.org/sites/default/files/publications/EV_Government_WhitePaper_20180514.pdf (accessed on 17 December 2018).
  31. Dai, Q.; Kelly, J.C.; Burnham, A.; Elgowainy, A. Updated Life-Cycle Analysis of Aluminum Production and Semi-Fabrication for the GREET Model. ANL/ESD-15/12; 2015. Available online: https://greet.es.anl.gov/publication-2015-al-update (accessed on 17 December 2018).
  32. Wang, M.; Elgowainy, A.; Benavides, P.; Burnham, A.; Cai, H.; Dai, Q.; Hawkins, T.; Kelly, J.C.; Kwon, H.; Lee, D.-Y.; et al. Summary of Expansions and Updates in GREET 2018. ANL-18/38; 2018. Available online: https://greet.es.anl.gov/publication-greet-2018-summary (accessed on 17 December 2018).
  33. NASA Earth Observatory. A Manmade Volcano over Norilsk. 2017. Available online: https://earthobservatory.nasa.gov/images/92246/a-manmade-volcano-over-norilsk (accessed on 17 December 2018).
  34. Njaa, O. Nornickel and the Kola Peninsula: Environmental Responsibility in the Year of Ecology. 2018. Available online: https://www.nornickel.com/files/en/investors/cmd/Nornickel-on-The-Kola-Peninsula.pdf (accessed on 25 January 2019).
  35. Golder Associates. Environmental Impact Assessment Tenke Fungurume Project—Volume A: ESIA Introduction and Project Description. 2007. Available online: https://www3.opic.gov/environment/eia/tenke/Volume%20A%20ESIA%20Introduction%20and%20Project%20Description.pdf (accessed on 25 January 2019).
  36. Zackrisson, M.; Avellán, L.; Orlenius, J. Life cycle assessment of lithium-ion batteries for plug-in hybrid electric vehicles—Critical issues. J. Clean. Prod. 2010, 18, 1519–1529. [Google Scholar] [CrossRef]
  37. Romare, M.; Dahllof, L. The Life Cycle Energy Consumption and Greenhouse Gas Emissions from Lithium-ion Batteries. 2017. Available online: https://www.ivl.se/download/18.5922281715bdaebede9559/1496046218976/C243+The+life+cycle+energy+consumption+and+CO2+emissions+from+lithium+ion+batteries+.pdf (accessed on 20 December 2018).
  38. Schmuch, R.; Wagner, R.; Hörpel, G.; Placke, T.; Winter, M. Performance and cost of materials for lithium-based rechargeable automotive batteries. Nat. Energy 2018, 3, 267–278. [Google Scholar] [CrossRef]
  39. Ambrose, H.; Kendall, A. Effects of battery chemistry and performance on the life cycle greenhouse gas intensity of electric mobility. Transp. Res. Part D Transp. Environ. 2016, 47, 182–194. [Google Scholar] [CrossRef] [Green Version]
  40. Ellingsen, L.A.-W.; Hung, C.R.; Strømman, A.H. Identifying key assumptions and differences in life cycle assessment studies of lithium-ion traction batteries with focus on greenhouse gas emissions. Transp. Res. Part D Transp. Environ. 2017, 55, 82–90. [Google Scholar] [CrossRef]
  41. Peters, J.F.; Weil, M. Providing a common base for life cycle assessments of Li-Ion batteries. J. Clean. Prod. 2018, 171, 704–713. [Google Scholar] [CrossRef]
  42. Wood, D.L., III; Li, J.; Daniel, C. Prospects for reducing the processing cost of lithium ion batteries. J. Power Sources 2015, 275, 234–242. [Google Scholar] [CrossRef] [Green Version]
  43. Cullen, J.M.; Allwood, J.M. Mapping the Global Flow of Aluminum: From Liquid Aluminum to End-Use Goods. Environ. Sci. Technol. 2013, 47, 3057–3064. [Google Scholar] [CrossRef] [PubMed] [Green Version]
  44. Nuss, P.; Eckelman, M.J. Life Cycle Assessment of Metals: A Scientific Synthesis. PLoS ONE 2014, 9, e101298. [Google Scholar] [CrossRef] [PubMed]
Figure 1. Cradle-to-gate system boundary of LiNi1/3Mn1/3Co1/3O2 (NMC111) battery production.
Batteries 05 00048 g001
Figure 2. Cradle-to-gate impact breakdowns and bill of materials (BOM) of 1 kWh NMC111 battery. Blue denotes material inputs; orange denotes energy inputs for cell production.
Batteries 05 00048 g002
Figure 3. Energy and environmental impact breakdowns of 1 kg NMC111 powder. Blue denotes material inputs; orange denotes energy inputs and non-combustion emissions for NMC111 powder production.
Batteries 05 00048 g003
Figure 4. Process energy use for the production of 1 kWh NMC111 battery and its material constituents, assuming all materials are virgin.
Batteries 05 00048 g004
Table 1. Summary of assumptions made for key battery materials in existing lithium-ion battery (LIB) life cycle analysis (LCA) studies.
Battery Material/ComponentZackrisson et al. [36]Notter et al. [2] Majeau-Bettez et al. [9] Ellingsen et al. [10]GREET 2018
GraphiteN/ANatural graphite *Based on Notter et al., added graphite baking energyBased on Notter et al.Synthetic graphite
Separator50 wt % PP, 50 wt % PEPE coated with a slurry of PVDF, C3F6, dibutyl phthalate, and silica dissolved in acetone50 wt % PP, 50 wt % PE100% PP80 wt % PP, 20 wt % PE
Cathode binder50 wt % tetrafluoro-ethylene, 50 wt % PEStyrene butadienePolytetra-fluoroethylene (PTFE)PVDFPVDF
Anode binderAcrylo-nitrile butadiene styreneStyrene butadienePTFE50 wt % caboxymethyl cellulose, 50 wt % acrylic acidPVDF
Electrolyte saltUse LiCl as a proxyLiPF6*Use inorganic chemicals as a proxyLiPF6, based on Notter et al.LiPF6 *
Electrolyte solventEthylene glycol dimethyl etherECUse organic chemicals as a proxyEC1:1 EC DMC
Electronic parts1 semi-conductor and 1 resistorPrinted wiring board and data cable10 wt % integrated circuit, 50 wt % Cu, 40 wt % chromium steelBattery module boards, integrated battery interface system, fasteners, high voltage system, and low voltage systemCircuit board and semi-conductor
* Production energy demand estimated from thermodynamic calculation.
Table 2. Solvent use for slurry preparation in existing LCA studies.
Studies CathodeAnode
TypeQuantity (kg/kg Cathode)TypeQuantity (kg/kg Anode)
Zackrisson et al. [37]NMP/waterN/ANMP/WaterN/A
Notter et al. [2]Water0.2Water0.424
Majeau-Bettez et al. [9]NMP0.28NMP0.28
Ellingsen et al. [10]NMP0.41NMP0.94
GREET 2018NMP0.002Water0 *
* Aggregated in battery production plant water consumption.
Table 3. Greenhouse Gases, Regulated Emissions, and Energy Use in Transportation (GREET) model vs. ecoinvent greenhouse gas (GHG) emission intensities for select battery materials and components.
Battery Material/ComponentGREET 2018Ecoinvent 2.2Ecoinvent 3.1
kg CO2e/kg battery material
 Cobalt, primary *27.08.3 [44]9–10 [37]
 Nickel, primary *8.17.8–10.9 [44]10 [37]
 Graphite4.9 1–2 [37]
 Aluminum, primary8.412.2 [44]
 Copper, primary3.12.3–5.0 [44]3–5 [37]
 LiPF612.2 27 [37]
 NMP5.1 5–6 [37]
kg CO2e/kg battery component
 BMS26.523.3 [10]
 Cathode paste14.87.1 [10]
 Anode paste4.76.0 [10]
* Included as a proxy for NMC cathode powder raw materials.

