Exploring the Economic Potential of Sodium-Ion Batteries


Abstract
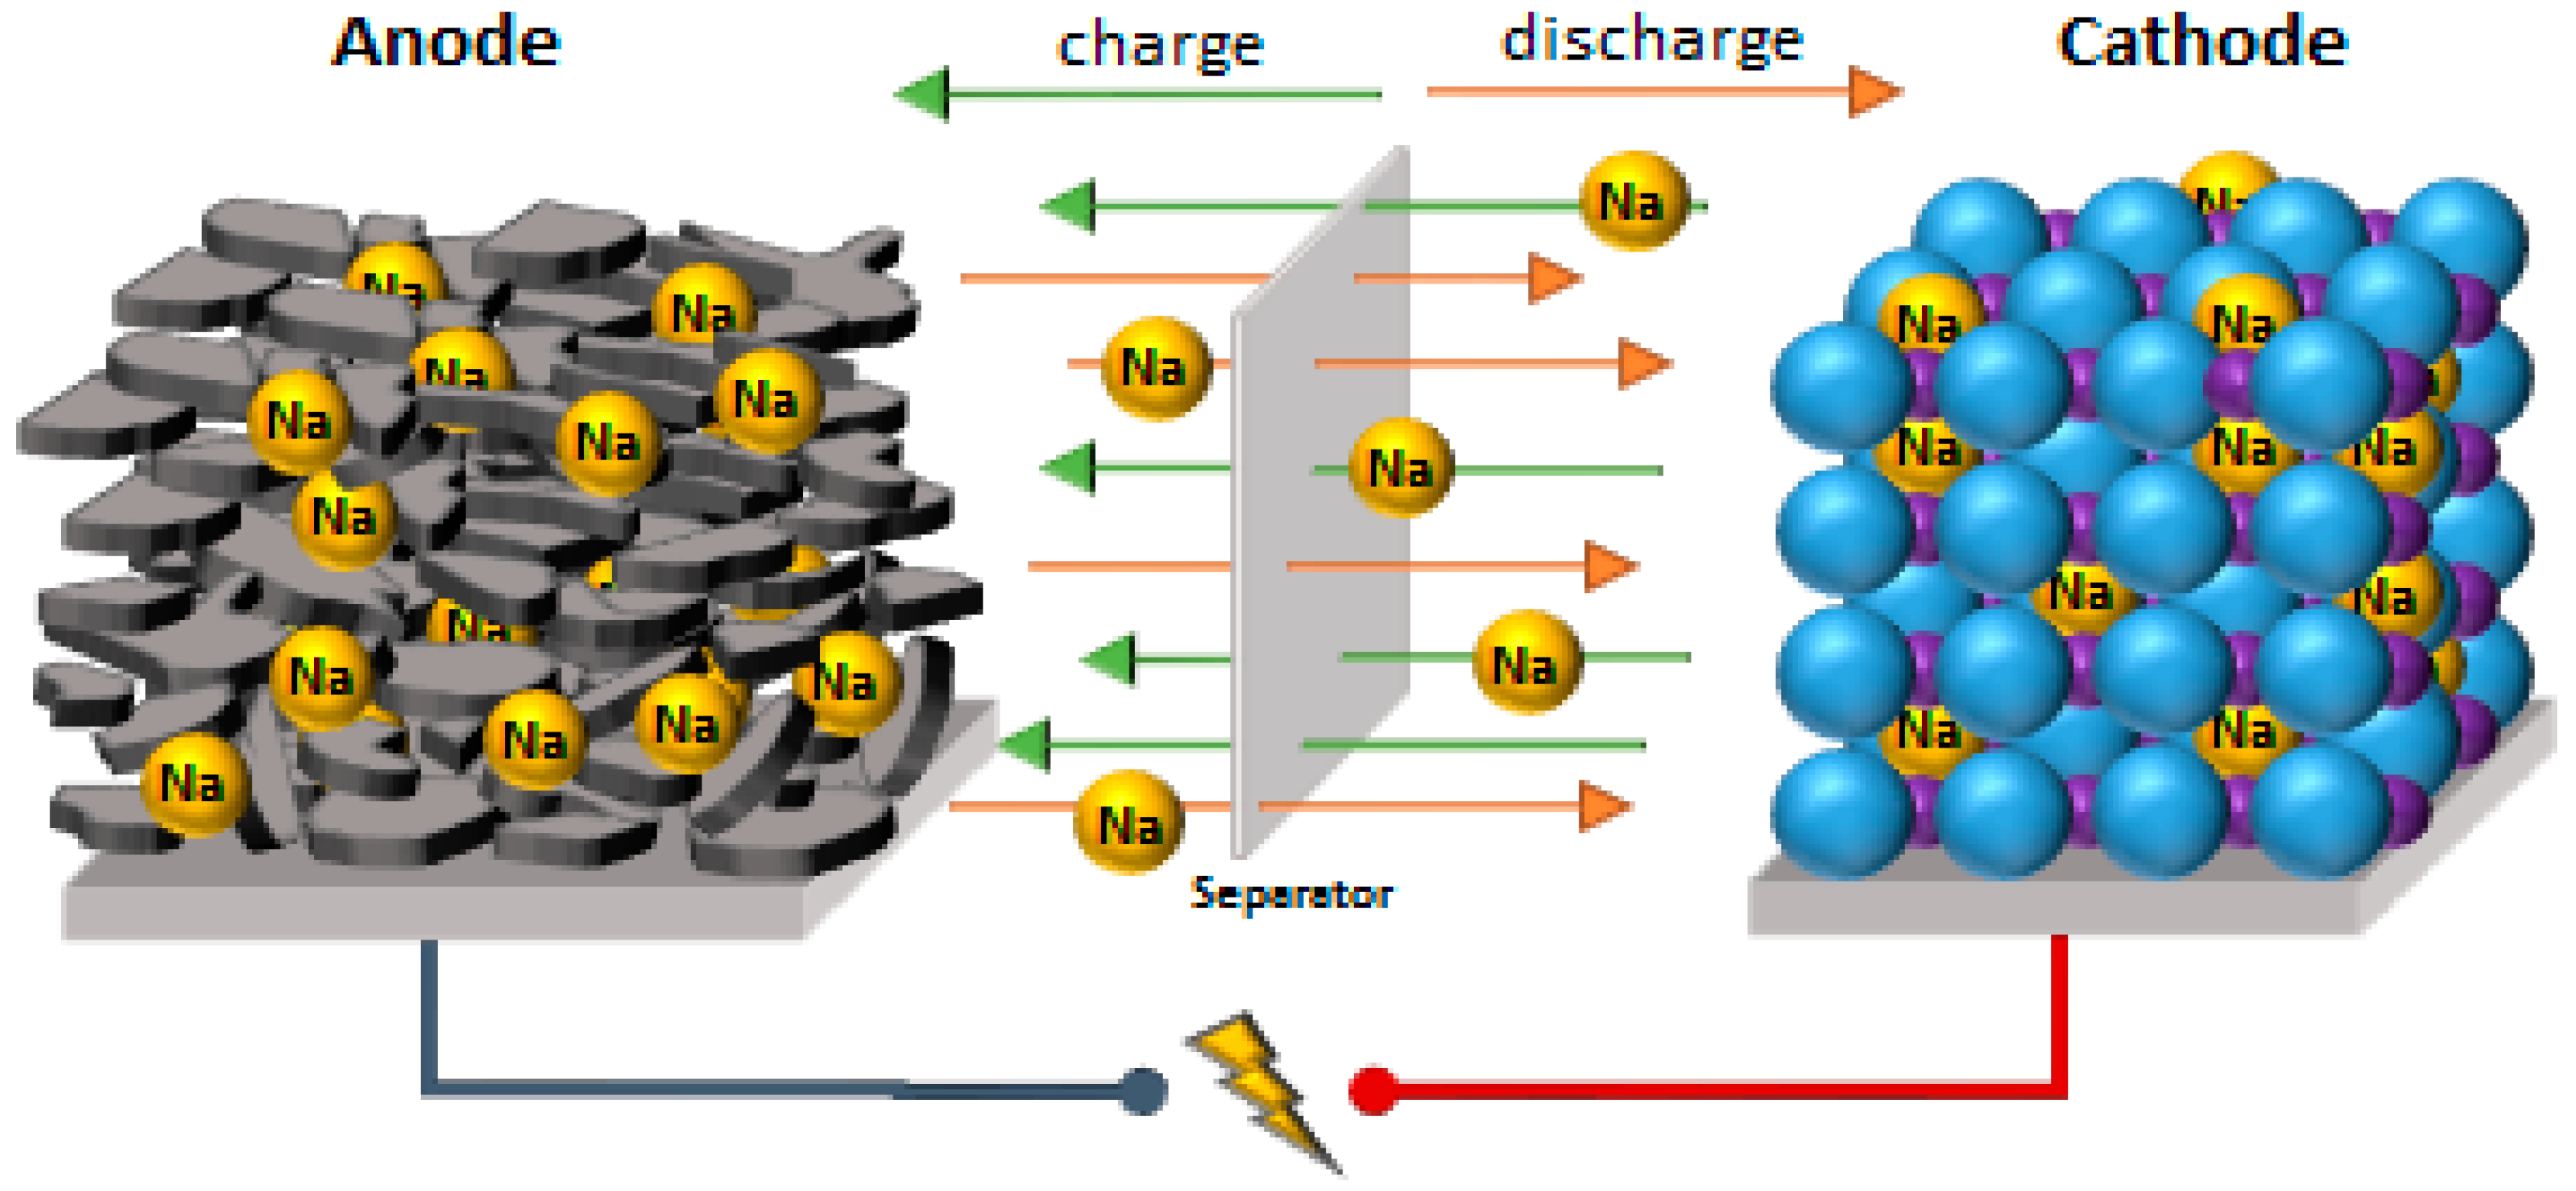
:1. Introduction
2. Methodology
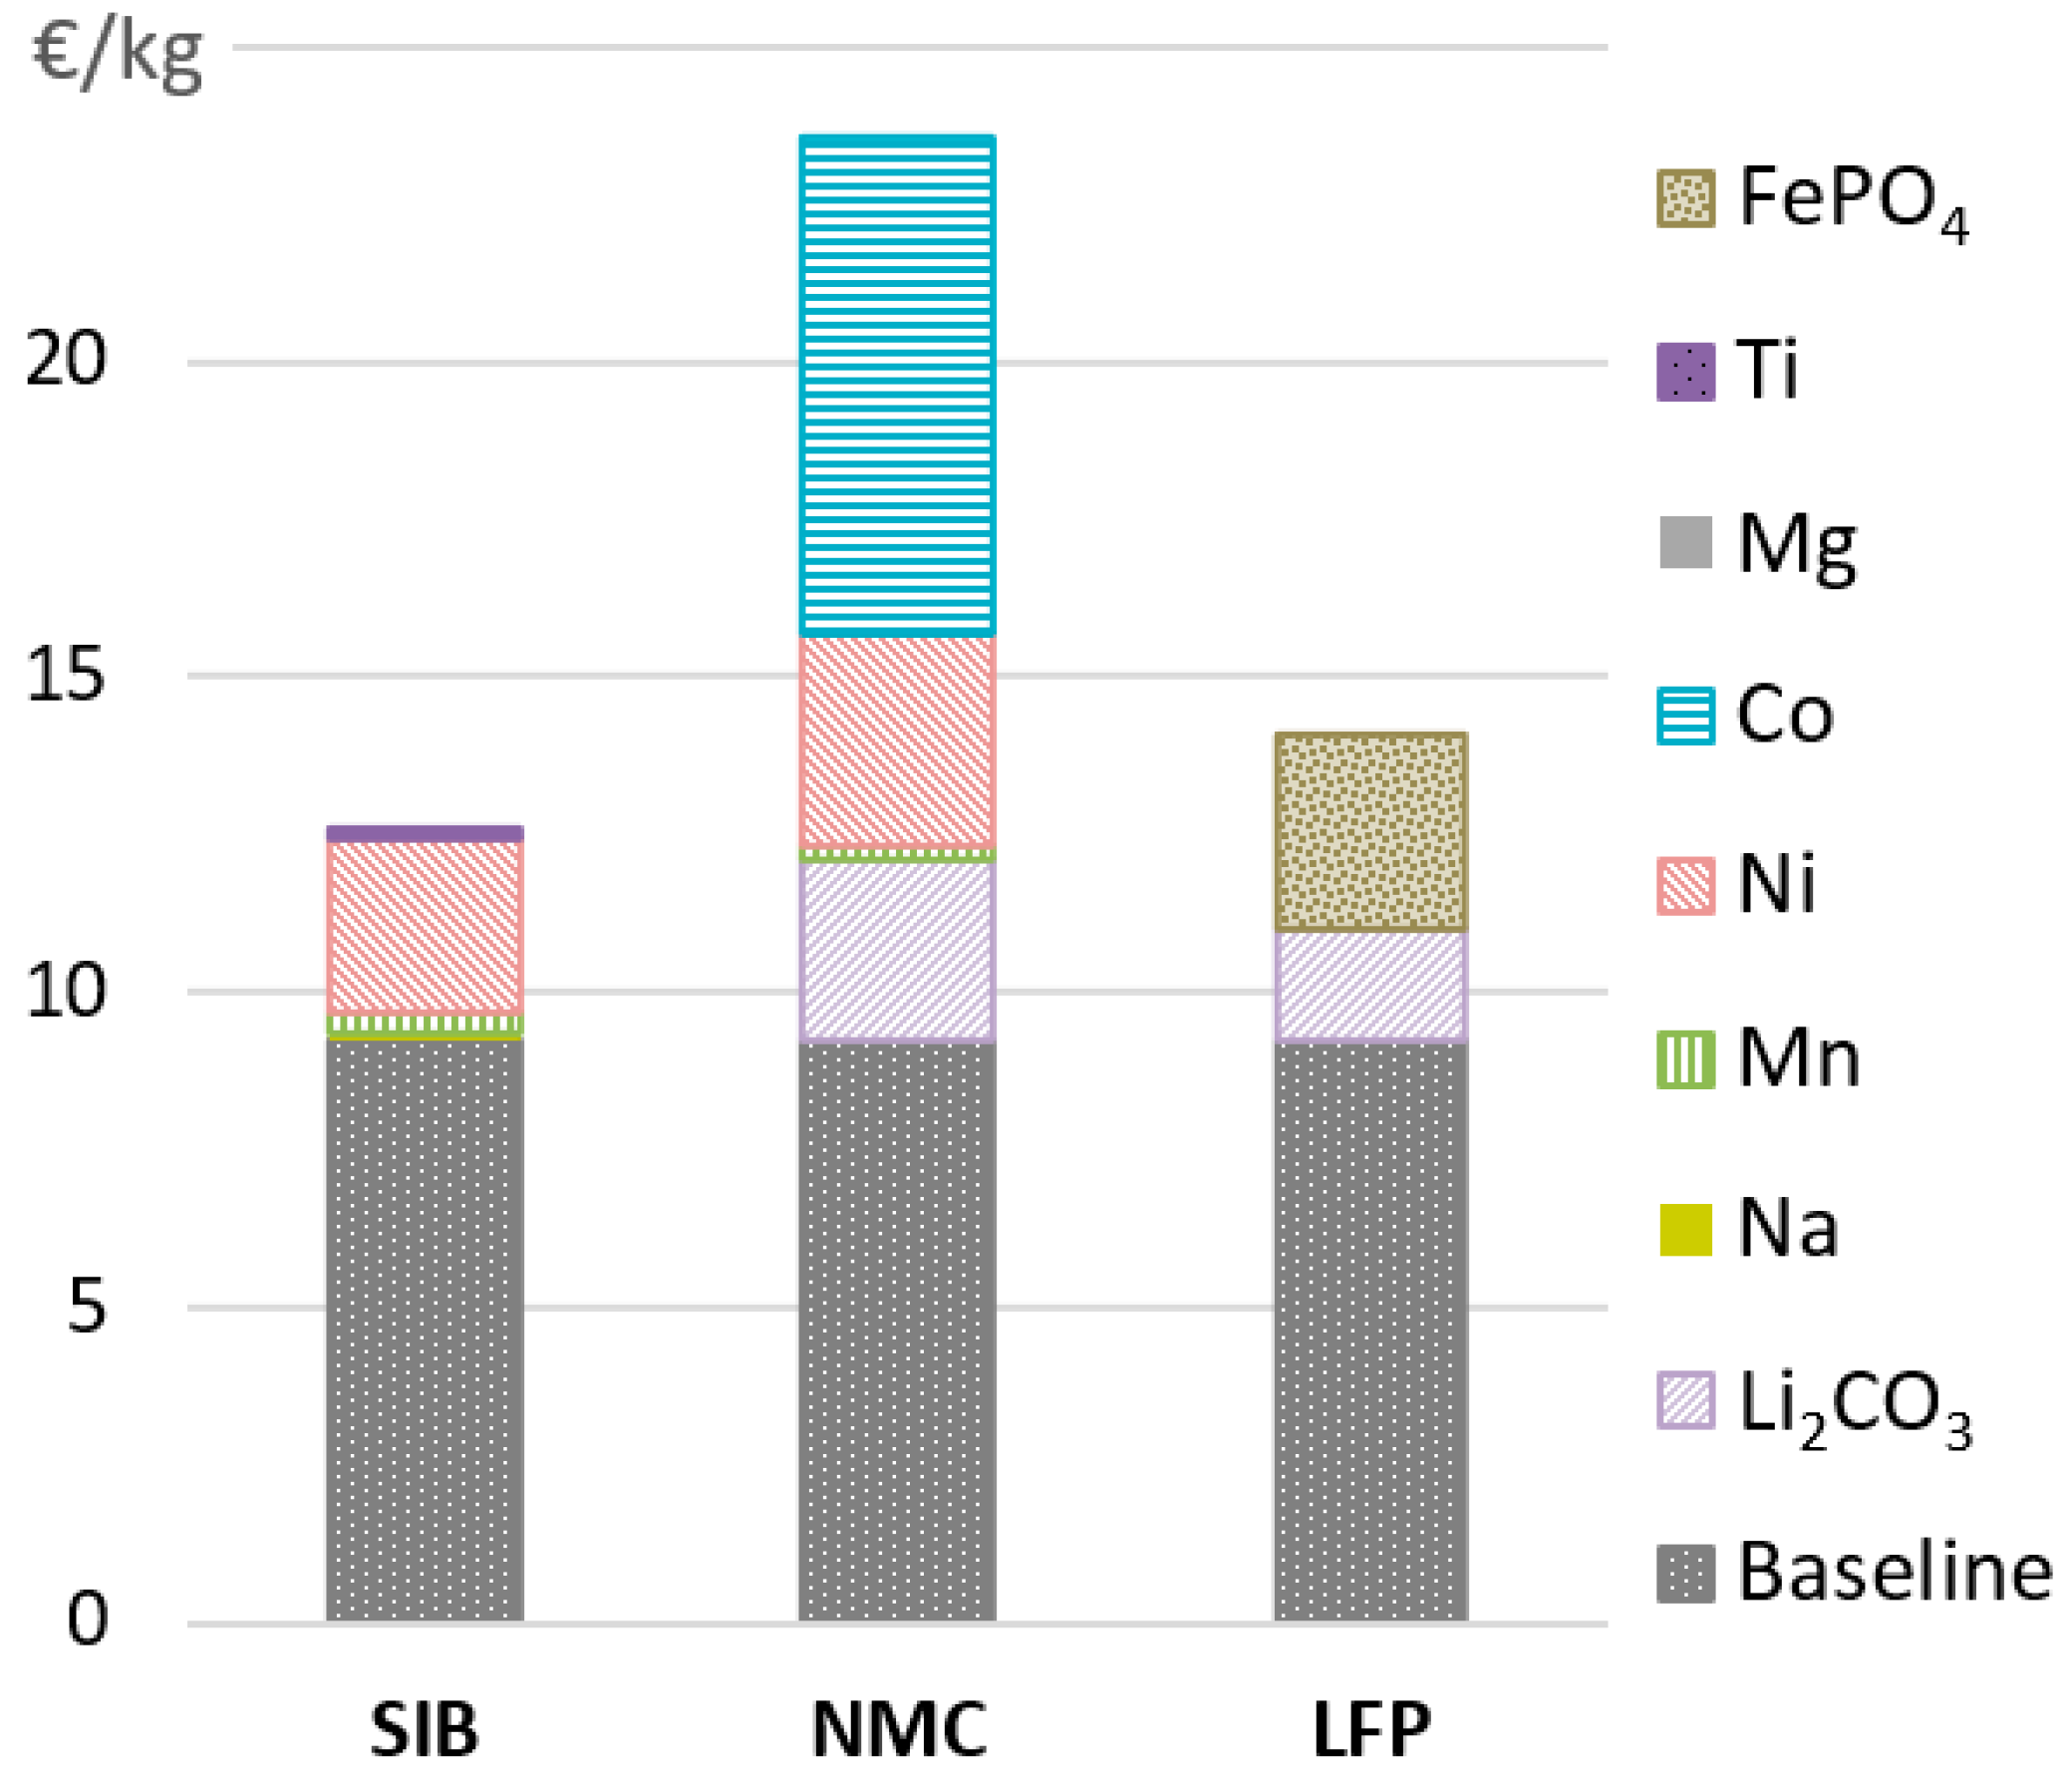
2.1. Cost of Cathode Active Material
2.2. Cost of Anode Active Material
2.3. Cost of Electrolyte
2.4. Cost of Other Materials
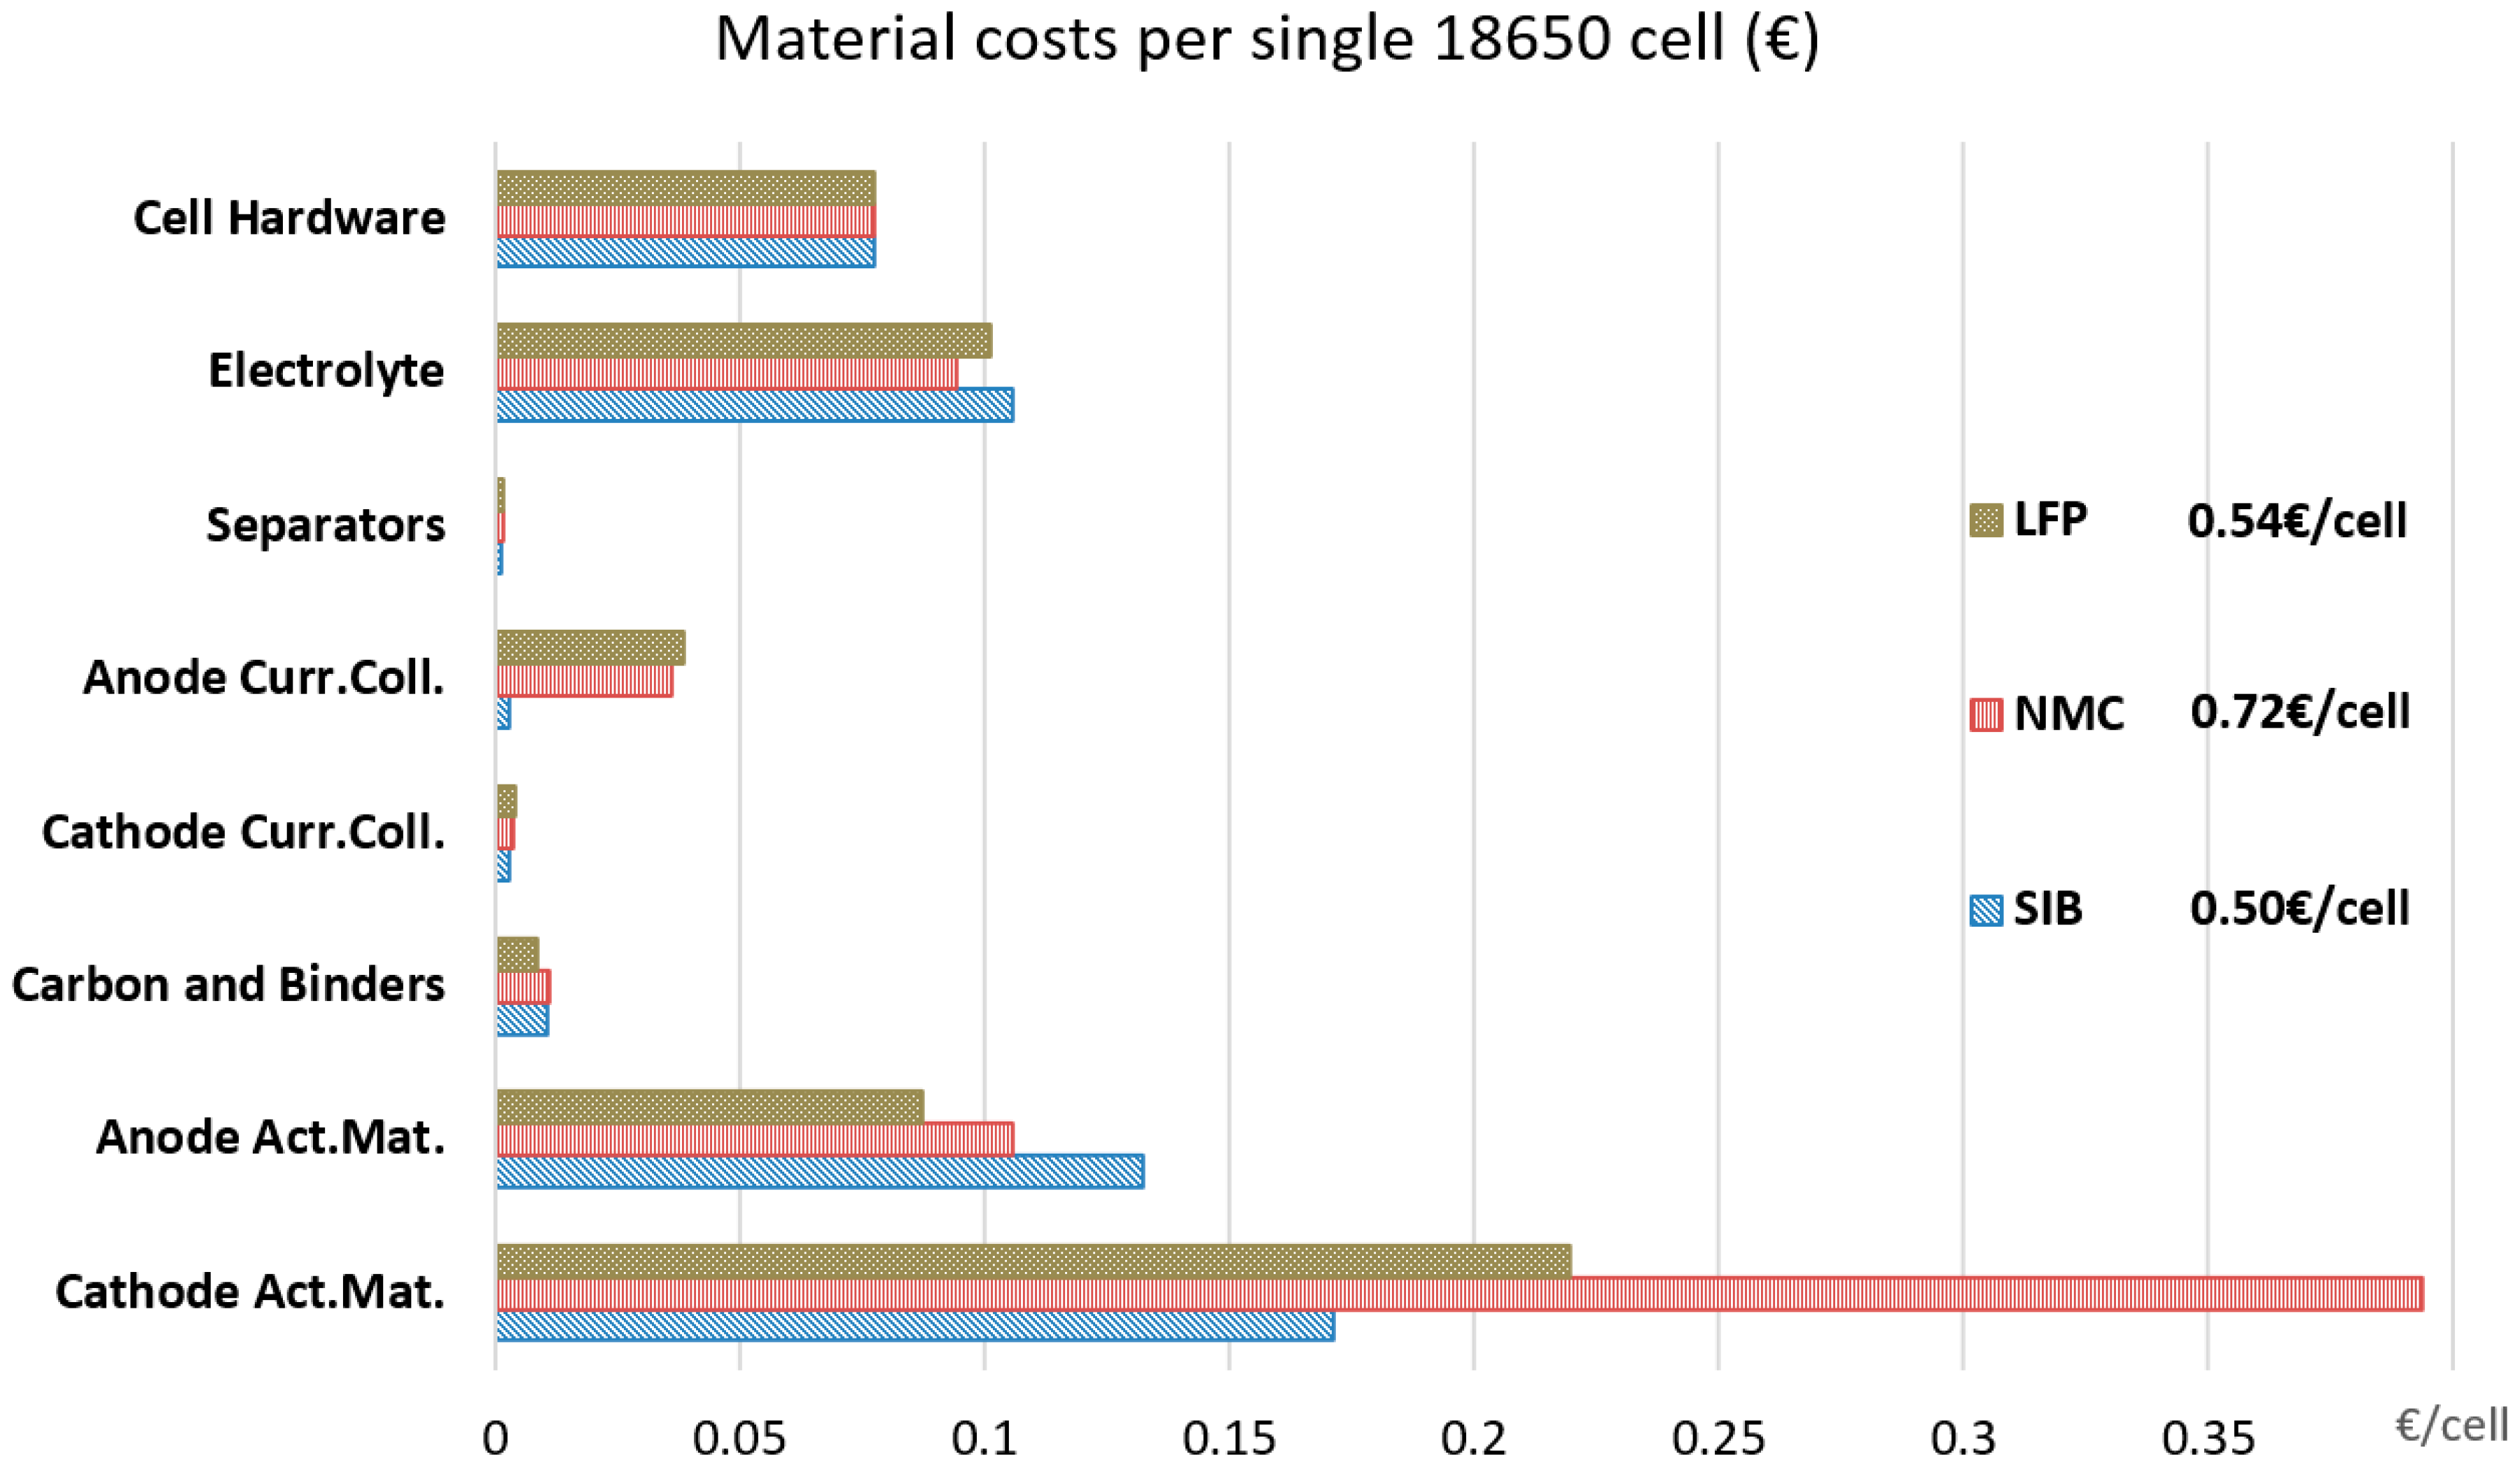
2.5. 18650 Cell Composition and Performance
2.6. Price of Final Battery Cell
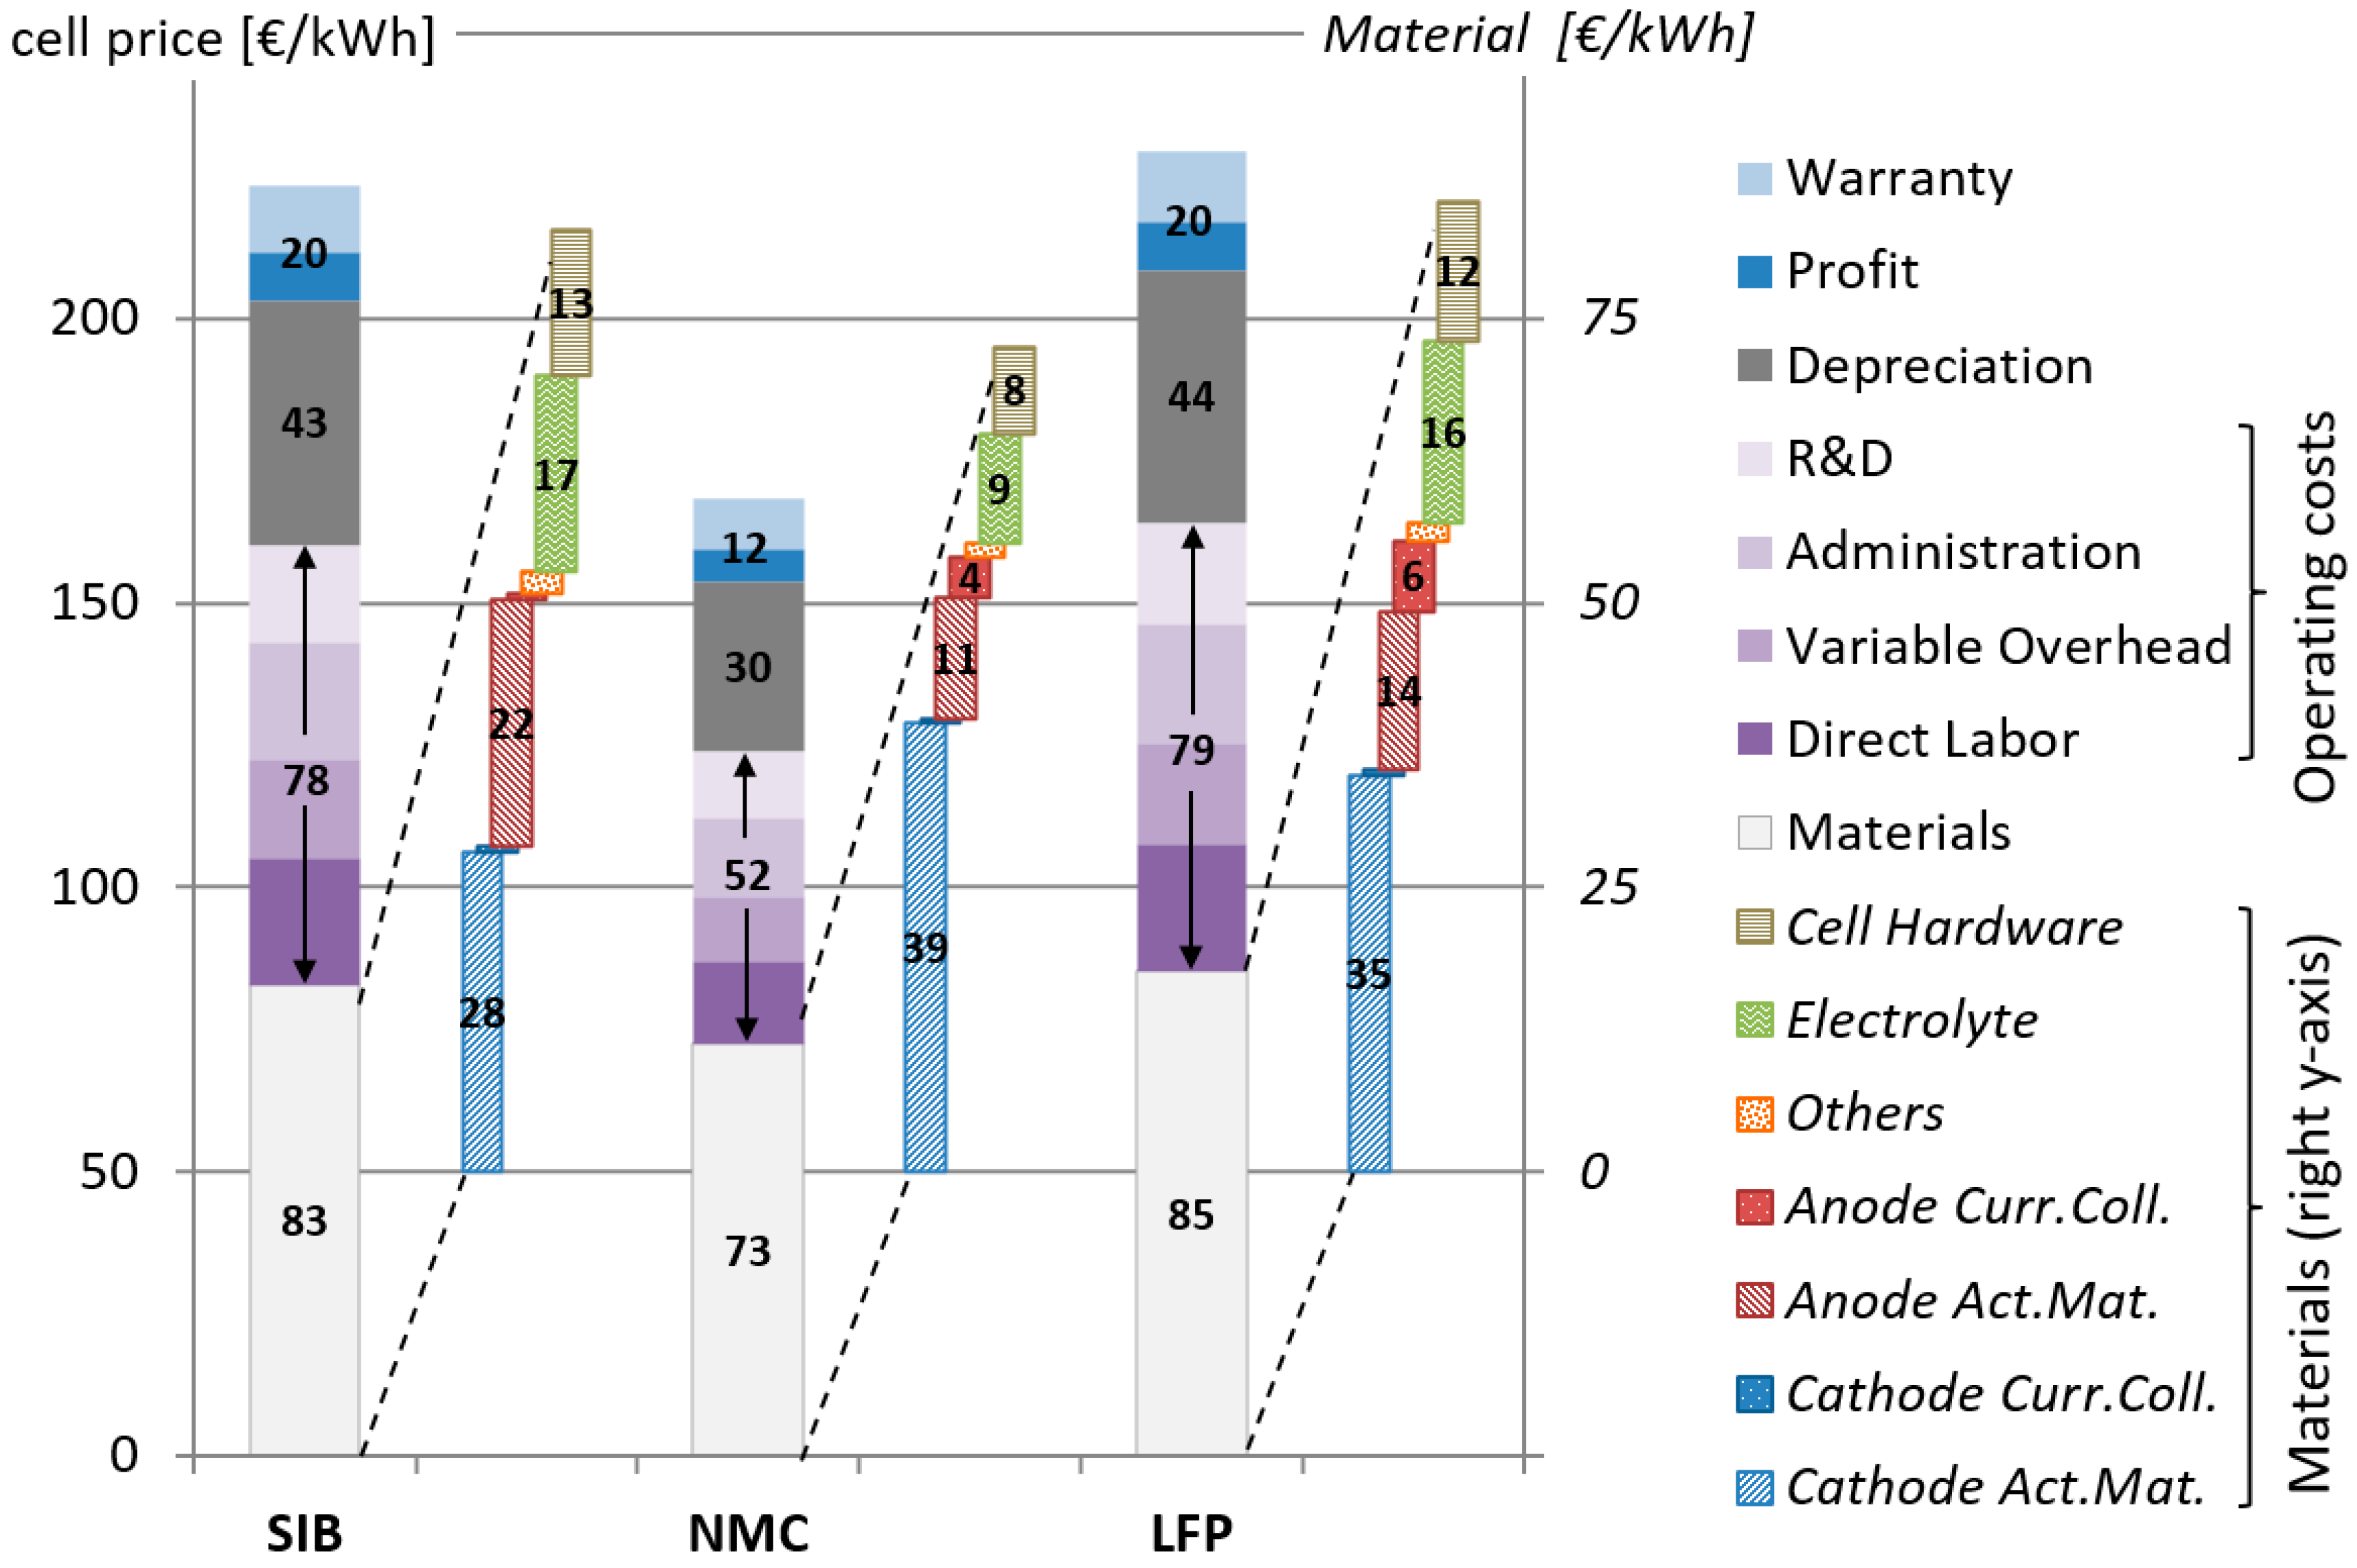
3. Results
4. Discussion and Sensitivity Analysis
4.1. Active Material Prices
4.2. Variations in Raw Material Prices
4.3. Variation of Region
5. Conclusions
Supplementary Materials
Author Contributions
Funding
Acknowledgments
Conflicts of Interest
Abbreviations
| CMC | Carboxymethyl cellulose (aqueous binder for electrode active material) |
| DMC | Dimethyl carbonate (electrolyte solvent) |
| EC | Ethylene carbonate (electrolyte solvent) |
| IPP | Industrial Producer Price Index |
| LFP | Lithium-iron-phosphate (cathode active material) |
| LIB | Lithium-ion battery |
| NMC | Lithium-nickel-manganese-cobalt-oxide (cathode active material) |
| NMMT | Sodium-nickel-manganese-magnesium-titanium-oxide (cathode active material) |
| NMP | N-Methyl-2-pyrrolidone (organic solvent for active material processing) |
| PVdF | Polyvinylidene fluoride (organic binder for electrode active material) |
| SIB | Sodium-ion battery |
References
- Kim, H.; Kim, H.; Ding, Z.; Lee, M.H.; Lim, K.; Yoon, G.; Kang, K. Recent Progress in Electrode Materials for Sodium-Ion Batteries. Adv. Energy Mater. 2016, 6, 1600943. [Google Scholar] [CrossRef] [Green Version]
- Baumann, M.; Peters, J.F.; Weil, M.; Grunwald, A. CO2 Footprint and Life-Cycle Costs of Electrochemical Energy Storage for Stationary Grid Applications. Energy Technol. 2017, 5, 1071–1083. [Google Scholar] [CrossRef]
- Battke, B.; Schmidt, T.S.; Grosspietsch, D.; Hoffmann, V.H. A review and probabilistic model of lifecycle costs of stationary batteries in multiple applications. Renew. Sustain. Energy Rev. 2013, 25, 240–250. [Google Scholar] [CrossRef]
- CARMEN eV. Marktübersicht Batteriespeicher; Centrales Agrar-Rohstoff Marketing- und Energie-Netzwerk: Straubing, Germany, 2017. [Google Scholar]
- Weil, M.; Peters, J.F.; Baumann, M.J.; Dura, H.; Zimmermann, B.M. Elektrochemische Energiespeicher für mobile Anwendungen im Fokus der Systemanalyse. Tech. Theor. Prax. 2015, 24, 20–29. [Google Scholar]
- Weil, M.; Tübke, J. Energiespeicher für Energiewende und Elektromobilität. Entwicklungen, Herausforderungen und systemische Analysen. Tech. Theor. Prax. 2015, 24, 4–9. [Google Scholar]
- Peters, J.F.; Weil, M. A Critical Assessment of the Resource Depletion Potential of Current and Future Lithium-Ion Batteries. Resources 2016, 5, 46. [Google Scholar] [CrossRef]
- Vaalma, C.; Buchholz, D.; Weil, M.; Passerini, S. A cost and resource analysis of sodium-ion batteries. Nat. Rev. Mater. 2018, 3, 18013. [Google Scholar] [CrossRef]
- Pan, H.; Hu, Y.-S.; Chen, L. Room-temperature stationary sodium-ion batteries for large-scale electric energy storage. Energy Environ. Sci. 2013, 6, 2338–2360. [Google Scholar] [CrossRef]
- Palomares, V.; Serras, P.; Villaluenga, I.; Hueso, K.B.; Carretero-González, J.; Rojo, T. Na-ion batteries, recent advances and present challenges to become low cost energy storage systems. Energy Environ. Sci. 2012, 5, 5884–5901. [Google Scholar] [CrossRef]
- Barker, J.; Heap, R.; Roche, N.; Tan, C.; Sayers, R.; Liu, Y. Low Cost Na-ion Battery Technology. In Proceedings of the 224th ECS Meeting, San Francisco, CA, USA, 27 October–1 November 2013. [Google Scholar]
- BCC Research. Global Market for Sodium-Ion Batteries to Nearly Triple in Value by 2022; BCC Market Research Reports; BCC Research LLC: Wellesley, MA, USA, 18 January 2018. [Google Scholar]
- Barker, J.; Heap, R.; Roche, N.; Tan, C.; Sayers, R.; Liu, Y. Low Cost Na-Ion Battery Technology; Faradion Limited: Sheffield, UK, 2014. [Google Scholar]
- Hwang, J.-Y.; Myung, S.-T.; Sun, Y.-K. Sodium-ion batteries: Present and future. Chem. Soc. Rev. 2017, 46, 3529–3614. [Google Scholar] [CrossRef]
- Peters, J.; Buchholz, D.; Passerini, S.; Weil, M. Life cycle assessment of sodium-ion batteries. Energy Environ. Sci. 2016, 9, 1744–1751. [Google Scholar] [CrossRef] [Green Version]
- Daniel, C.; Besenhard, J.O. Handbook of Battery Materials; John Wiley & Sons: Weinheim, Germany, 2012. [Google Scholar]
- Nelson, P.A.; Gallagher, K.G.; Bloom, I.; Dees, D.W. Modeling the Performance and Cost of Lithium-Ion Batteries for Electric-Drive Vehicles; Argonne National Laboratories (ANL), Chemical Sciences and Engineering Division: Lemont, IL, USA, 2012. [Google Scholar]
- Eurostat. Producer Prices in Industry, Non Domestic Market-Annual Data; Statistical Office of the European Union, European Commission: Brussels, Belgium, 2017. [Google Scholar]
- Eurostat. EUR Exchange Rates Versus National Currencies; Statistical Office of the European Union, European Commission: Brussels, Belgium, 2017. [Google Scholar]
- Barker, J.; Heap, R. Doped nickelate compounds. International Patent Application No. WO2014/009710 A1, 16 January 2014. [Google Scholar]
- Patry, G.; Romagny, A.; Martinet, S.; Froelich, D. Cost modeling of lithium-ion battery cells for automotive applications. Energy Sci. Eng. 2015, 3, 71–82. [Google Scholar] [CrossRef]
- Petri, R.; Giebel, T.; Zhang, B.; Schünemann, J.-H.; Herrmann, C. Material cost model for innovative li-ion battery cells in electric vehicle applications. Int. J. Precis. Eng. Manuf.-Green Technol. 2015, 2, 263–268. [Google Scholar] [CrossRef] [Green Version]
- Ciez, R.E.; Whitacre, J.F. Comparison between cylindrical and prismatic lithium-ion cell costs using a process based cost model. J. Power Sources 2017, 340, 273–281. [Google Scholar] [CrossRef]
- Renard, F. 2020 cathode materials cost competition for large scale applications and promising LFP best-in-class performer in term of price per kWh. In Proceedings of the International Conference on Olivines for Rechargeable Batteries, Montreal, QC, Canada, 25–28 May 2014. [Google Scholar]
- Rempel, J.; Barnett, B.; Hyung, Y. PHEV Battery Cost Assessment. In Proceedings of the TIAX LLC, Lexington, KY, USA, 14 May 2013. [Google Scholar]
- Wood, D.L., III; Li, J.; Daniel, C. Prospects for reducing the processing cost of lithium ion batteries. J. Power Sources 2015, 275, 234–242. [Google Scholar] [CrossRef] [Green Version]
- Slater, M.D.; Kim, D.; Lee, E.; Johnson, C.S. Sodium-ion batteries. Adv. Funct. Mater. 2013, 23, 947–958. [Google Scholar] [CrossRef]
- US Geological Survey. Mineral Commodity Summaries 2016; US Geological Survey: Reston, VA, USA, 2017; ISBN 978-1-4113-4011-4.
- Irisarri, E.; Ponrouch, A.; Palacin, M.R. Review—Hard Carbon Negative Electrode Materials for Sodium-Ion Batteries. J. Electrochem. Soc. 2015, 162, A2476–A2482. [Google Scholar] [CrossRef] [Green Version]
- Olontsev, V.F.; Borisova, I.A.; Sazonova, E.A. Pyrolysis of coconut shells for the manufacture of carbon sorbents. Solid Fuel Chem. 2011, 45, 44–49. [Google Scholar] [CrossRef]
- ECN-Biomass Phyllis 2, Database for Biomass and Waste. 2017. Available online: http://www.ecn.nl/phyllis2/ (accessed on 5 October 2017).
- Jungbluth, N. Ecoinvent report No. 4—Erdöl. In Sachbilanzen von Energiesystemen: Grundlagen für den ökologischen Vergleich von Energiesystemen und den Einbezug von Energiesystemen in Ökobilanzen für die Schweiz; Dones, R., Ed.; Swiss Centre for Life Cycle Inventories: Dübendorf, Switzerland, 2007. [Google Scholar]
- Index Mundi. Commodity Price Indices. 2017. Available online: http://www.indexmundi.com/commodities/ (accessed on 30 November 2018).
- CDA. Coconut Development Authority—Info Portal. Ministry of Plantation Industries from Sri Lanka. 2017. Available online: http://www.cda.lk/web/ (accessed on 15 October 2018).
- SCI. Sublime China Information. Chinese Commodity Market Statistics. 2017. Available online: http://intl.sci99.com/# (accessed on 10 May 2018).
- Eurostat. Energy Statistics; Statistical Office of the European Union, European Commission: Brussels, Belgium, 2017. [Google Scholar]
- Ross, D. Cryocoolers 11; Springer: Berlin, Germany, 2001. [Google Scholar]
- Fan, K. The Physics Factbook—Price of Liquid Nitrogen. 2007. Available online: http://hypertextbook.com/facts/2007/KarenFan.shtml (accessed on 10 April 2017).
- O’Brien, C.; Heravi, B. Irish water charges cheapest in Europe under revised package. The Irish Time, 19 November 2014. [Google Scholar]
- Ellingsen, L.A.-W.; Majeau-Bettez, G.; Singh, B.; Srivastava, A.K.; Valøen, L.O.; Strømman, A.H. Life Cycle Assessment of a Lithium-Ion Battery Vehicle Pack: LCA of a Li-Ion Battery Vehicle Pack. J. Ind. Ecol. 2014, 18, 113–124. [Google Scholar] [CrossRef]
- Warner, J.T. The Handbook of Lithium-Ion Battery Pack Design: Chemistry, Components, Types and Terminology; Elsevier: Amsterdam, The Netherlands, 2015; ISBN 978-0-12-801456-1. [Google Scholar]
- Pistoia, G. (Ed.) Lithium-Ion Batteries. Advances and Applications; Elsevier: Amsterdam, The Netherlands, 2014. [Google Scholar]
- Ponrouch, A.; Marchante, E.; Courty, M.; Tarascon, J.-M.; Palacín, M.R. In search of an optimized electrolyte for Na-ion batteries. Energy Environ. Sci. 2012, 5, 8572. [Google Scholar] [CrossRef]
- Ponrouch, A.; Monti, D.; Boschin, A.; Steen, B.; Johansson, P.; Palacín, M.R. Non-aqueous electrolytes for sodium-ion batteries. J. Mater. Chem. A 2014, 3, 22–42. [Google Scholar] [CrossRef]
- Alibaba Group. 18650, 26650, 32650 Cylinder Cell Case with PTC for Lithium Battery. Alibaba.com. 6 March 2018. Available online: https://www.alibaba.com/product-detail/18650-26650-32650-Cylinder-Cell-Case_60485442268.html?spm=a2700.7724857/B.main07.18.38f76528zEF7cY&s=p (accessed on 30 November 2018).
- Alibaba Group. 18650 Cylinder Cell Case with Anti-Explosive Cap and Insulation O-Ring—100 Pcs/package—EQ-Lib-18650. Alibaba.com. 6 March 2018. Available online: https://www.alibaba.com/product-detail/18650-Cylinder-Cell-Case-with-Anti_60342001362.html?spm=a2700.7724838.2017115.100.530523e2fcGCg1 (accessed on 30 November 2018).
- ICIS Chemical Commodities Prices, Markets & Analysis. 2017. Available online: https://www.icis.com/chemicals/ (accessed on 10 May 2018).
- Golubkov, A.W.; Fuchs, D.; Wagner, J.; Wiltsche, H.; Stangl, C.; Fauler, G.; Voitic, G.; Thaler, A.; Hacker, V. Thermal-runaway experiments on consumer Li-ion batteries with metal-oxide and olivin-type cathodes. RSC Adv. 2014, 4, 3633–3642. [Google Scholar] [CrossRef] [Green Version]
- Majeau-Bettez, G.; Hawkins, T.R.; Strømman, A.H. Life Cycle Environmental Assessment of Lithium-Ion and Nickel Metal Hydride Batteries for Plug-In Hybrid and Battery Electric Vehicles. Environ. Sci. Technol. 2011, 45, 4548–4554. [Google Scholar] [CrossRef] [PubMed]
- Nitta, N.; Wu, F.; Lee, J.T.; Yushin, G. Li-ion battery materials: Present and future. Mater. Today 2015, 18, 252–264. [Google Scholar] [CrossRef]
- Eurostat. Wages and Labour Costs; Statistical Office of the European Union, European Commission: Brussels, Belgium, 2017. [Google Scholar]
- Roberts, S.; Kendrick, E. The re-emergence of sodium ion batteries: Testing, processing, and manufacturability. Nanotechnol. Sci. Appl. 2018, 11, 23–33. [Google Scholar]
- Berckmans, G.; Messagie, M.; Smekens, J.; Omar, N.; Vanhaverbeke, L.; Van Mierlo, J.; Berckmans, G.; Messagie, M.; Smekens, J.; Omar, N.; et al. Cost Projection of State of the Art Lithium-Ion Batteries for Electric Vehicles Up to 2030. Energies 2017, 10, 1314. [Google Scholar] [CrossRef]
- Sripad, S.; Viswanathan, V. Evaluation of Current, Future, and Beyond Li-Ion Batteries for the Electrification of Light Commercial Vehicles: Challenges and Opportunities. J. Electrochem. Soc. 2017, 164, E3635–E3646. [Google Scholar] [CrossRef] [Green Version]
- Wu, L.; Buchholz, D.; Vaalma, C.; Giffin, G.A.; Passerini, S. Apple-Biowaste-Derived Hard Carbon as a Powerful Anode Material for Na-Ion Batteries. ChemElectroChem 2015, 292–298. [Google Scholar] [CrossRef]
- Chen, L.; Fiore, M.; Wang, J.E.; Ruffo, R.; Kim, D.-K.; Longoni, G. Readiness Level of Sodium-Ion Battery Technology: A Materials Review. Adv. Sustain. Syst. 2018, 2, 1700153. [Google Scholar] [CrossRef]


| Chemistry | Anode | Cathode | Separator | Electrolyte | Cell Housing |
|---|---|---|---|---|---|
| LIB | Graphite on copper foil, organic or aqueous binder | Layered oxide on aluminum foil, organic binder | Polymer film (mostly PE) | Li Salt (LiPF6, LiTFSI) in organic solvent (EC/DMC) | Pouch, prismatic, or round cells |
| SIB | Hard carbon on aluminum foil, organic or aqueous binder | Layered oxide on aluminum foil, organic binder | Polymer film (mostly PE) | Na Salt (NaPF6, NaClO4) in organic solvent (EC/DMC) | Pouch, prismatic, or round cells |
| Sugar | Coconut Shell | Petr. Coke | |||
|---|---|---|---|---|---|
| Item | Amount | Amount | Amount | Unit | Price (€/Unit) |
| Sugar | 11.00 | kg | 0.40 [33] | ||
| Coconut shells | 4.5 | kg | 0.01 [34] | ||
| Petroleum coke | 1.14 | kg | 0.17 [35] | ||
| Electricity | 0.06 | 0.03 | 0.01 | kWh | 28.86 [36] |
| Heat from natural gas | 5.23 | 2.36 | 1.89 | MJ | 0.80 [36] |
| Nitrogen | 3.84 | 1.73 | 0.90 | kg | 1.83 [37,38] |
| Water | 0.10 | 0.09 | 0.01 | L | 0.0045 [39] |
| figure | 17.28 | 6.30 | 3.65 | €/kg |
© 2019 by the authors. Licensee MDPI, Basel, Switzerland. This article is an open access article distributed under the terms and conditions of the Creative Commons Attribution (CC BY) license (http://creativecommons.org/licenses/by/4.0/).
Share and Cite
Peters, J.F.; Peña Cruz, A.; Weil, M. Exploring the Economic Potential of Sodium-Ion Batteries. Batteries 2019, 5, 10. https://doi.org/10.3390/batteries5010010
Peters JF, Peña Cruz A, Weil M. Exploring the Economic Potential of Sodium-Ion Batteries. Batteries. 2019; 5(1):10. https://doi.org/10.3390/batteries5010010
Chicago/Turabian StylePeters, Jens F., Alexandra Peña Cruz, and Marcel Weil. 2019. "Exploring the Economic Potential of Sodium-Ion Batteries" Batteries 5, no. 1: 10. https://doi.org/10.3390/batteries5010010