Article

Research on Inconsistency Evaluation of Retired Battery Systems in Real-World Vehicles

1
School of Mechanical Engineering, Beijing Institute of Technology, Beijing 100081, China
2
Wuhan Weilan New Energy Technology Co., Wuhan 430040, China
3
School of Mechanical Engineering, University of Science and Technology Beijing, Beijing 100083, China
*
Author to whom correspondence should be addressed.
Batteries 2024, 10(3), 82; https://doi.org/10.3390/batteries10030082
Submission received: 19 December 2023 / Revised: 29 January 2024 / Accepted: 5 February 2024 / Published: 1 March 2024

Abstract

:
Inconsistency is a key factor triggering safety problems in battery packs. The inconsistency evaluation of retired batteries is of great significance to ensure the safe and stable operation of batteries during subsequent gradual use. This paper summaries the commonly used diagnostic methods for battery inconsistency assessment. The local outlier factor (LOF) algorithm and the improved Shannon entropy (ImEn) algorithm are selected for validation based on the individual voltage data from real-world vehicles. Then, a comprehensive inconsistency evaluation strategy for retired batteries with many levels and indicators is established based on the three parameters of LOF, ImEn, and cell voltage range. Finally, the evaluation strategy is validated using two real-world vehicle samples of retired batteries. The results show that the proposed method can achieve the inconsistency evaluation of retired batteries quickly and effectively.

1. Introduction

With the characteristics of environmental protection and energy saving, electric vehicles play an increasingly important role in the field of transportation [1,2]. However, with the popularization of electric vehicles, safety accidents such as battery fires occur frequently, and safety has gradually become a shortcoming of electric vehicles [3]. The inconsistency of the batteries is one of the main causes of safety accidents, and the differences in retired batteries after many cycles of the cell are further amplified, the inconsistency is intensified, and safety is even more difficult to ensure [4,5]. Now that the first batch of electric vehicle batteries on the market will be retired soon, it is of great significance to carry out the inconsistency assessment of the retired batteries to ensure the safety and reliability of retired batteries in laddering utilization [6].

1.1. Literature Review

In order to meet the requirements of the electric vehicle battery capacity and voltage, multiple cells are often combined in series or parallel to form a battery module [7,8]. Each cell, due to the production process, inevitably incurs process and material differences, although the same batch of products can also have different cell parameters [9]. In addition, the operating conditions of each cell are also different during the operation of the vehicle, which further leads to the inconsistency of the self-discharge rate, voltage, capacity, internal resistance and other parameters between the cells [10]. The inconsistency of the cells further aggravates the aging of the battery, which is very harmful. An inconsistency in the battery capacity can lead to a “short board effect” during the charging and discharging process of the battery, where the smallest unit limits the capacity of the entire battery pack, resulting in the inability to fully utilize the capacity of some units [11,12]. In addition, the battery cells with the smallest capacity are charged and discharged to the maximum extent during each cycle of the battery pack, leading to the faster aging of these monomers and further affecting the lifespan of the entire battery pack [13]. The inconsistency of internal resistance can lead to different amounts of heat generated by each individual, resulting in an uneven temperature field around the battery pack. At the same time, the uneven temperature field will exacerbate the inconsistency of battery internal resistance, forming negative feedback and continuously increasing the inconsistency of the battery [14]. The inconsistent impact of the battery capacity can be eliminated through equalization circuits, but the existing battery equalization techniques are difficult to achieve rapid equalization in a short period of time due to the small equalization current, resulting in a poor equalization effect [15]. After a long period of charging and discharging cycles, the differences in the individual parameters of retired batteries are further amplified, and the use of equalization technology cannot eliminate the inconsistency between individual cells. Therefore, to reduce the inconsistency of the used batteries, it is of great importance to perform the inconsistency evaluation of used batteries and classify them based on the evaluation results.
The inconsistency evaluation can be divided into evaluation methods based on the capacity, internal resistance, SOC and voltage according to the evaluation index [16]. Zhao et al. [17] qualitatively evaluated the inconsistency of batteries in terms of their capacity utilization efficiency and energy utilization efficiency and found that the battery packs with significant inconsistency have faster capacity decay rates, but this method requires the measurement of the battery capacity as well as parameters such as the open-circuit voltage, which is currently difficult to achieve in real vehicles. Lin et al. [18] achieved the judgement of battery consistency state based on the SOC and resistance parameters, and combined with the change of correlation coefficient and voltage difference, this can achieve the identification of battery voltage sensor faults, connection faults and short circuit faults. In order to configure a stable battery pack, Kim et al. [19] used the capacity and internal resistance as evaluation and screening metrics to ultimately screen the cells with similar electrochemical characteristics. Wang et al. [20] investigated the inconsistency evolution of series and parallel battery modules based on capacity and internal resistance parameters, quantitatively analyzed the performance and inconsistency, and deduced the trend of battery inconsistency evolution and a way to judge it. Although many studies have been conducted on the inconsistency of batteries, most of them are based on experimental and simulation conditions, so there is an urgent need for inconsistency studies on real vehicles. The battery inconsistency assessment indicators are diverse, but it is difficult to use internal resistance and capacity as inconsistency assessment indicators in real vehicles because they are difficult to measure. In addition, the SOC is a parameter obtained by estimation, and there is a certain error in using it as an evaluation index. In summary, since the voltage is easy to obtain and the error is small, this paper selects the cell voltage data of two real-world vehicles as the research object and evaluates the inconsistency of the whole battery pack by analyzing the voltage distributions of different cells within the battery pack. Although there has been some research on the inconsistency evaluation of batteries, a perfect battery inconsistency evaluation system has not yet been established. Therefore, this paper combines the local outlier factor algorithm and the improved Shannon entropy algorithm to propose a new comprehensive evaluation method for determining the inconsistency of retired batteries, and the research framework is shown in Figure 1.

1.2. Contributions of This Work

This paper attempts to make several original contributions and improvements to the current research, as shown in the following:
(1)
Summary and classification of inconsistency diagnosis methods: The inconsistency diagnosis methods based on outlier detection and information entropy are summarized, including six algorithms commonly used for fault diagnosis.
(2)
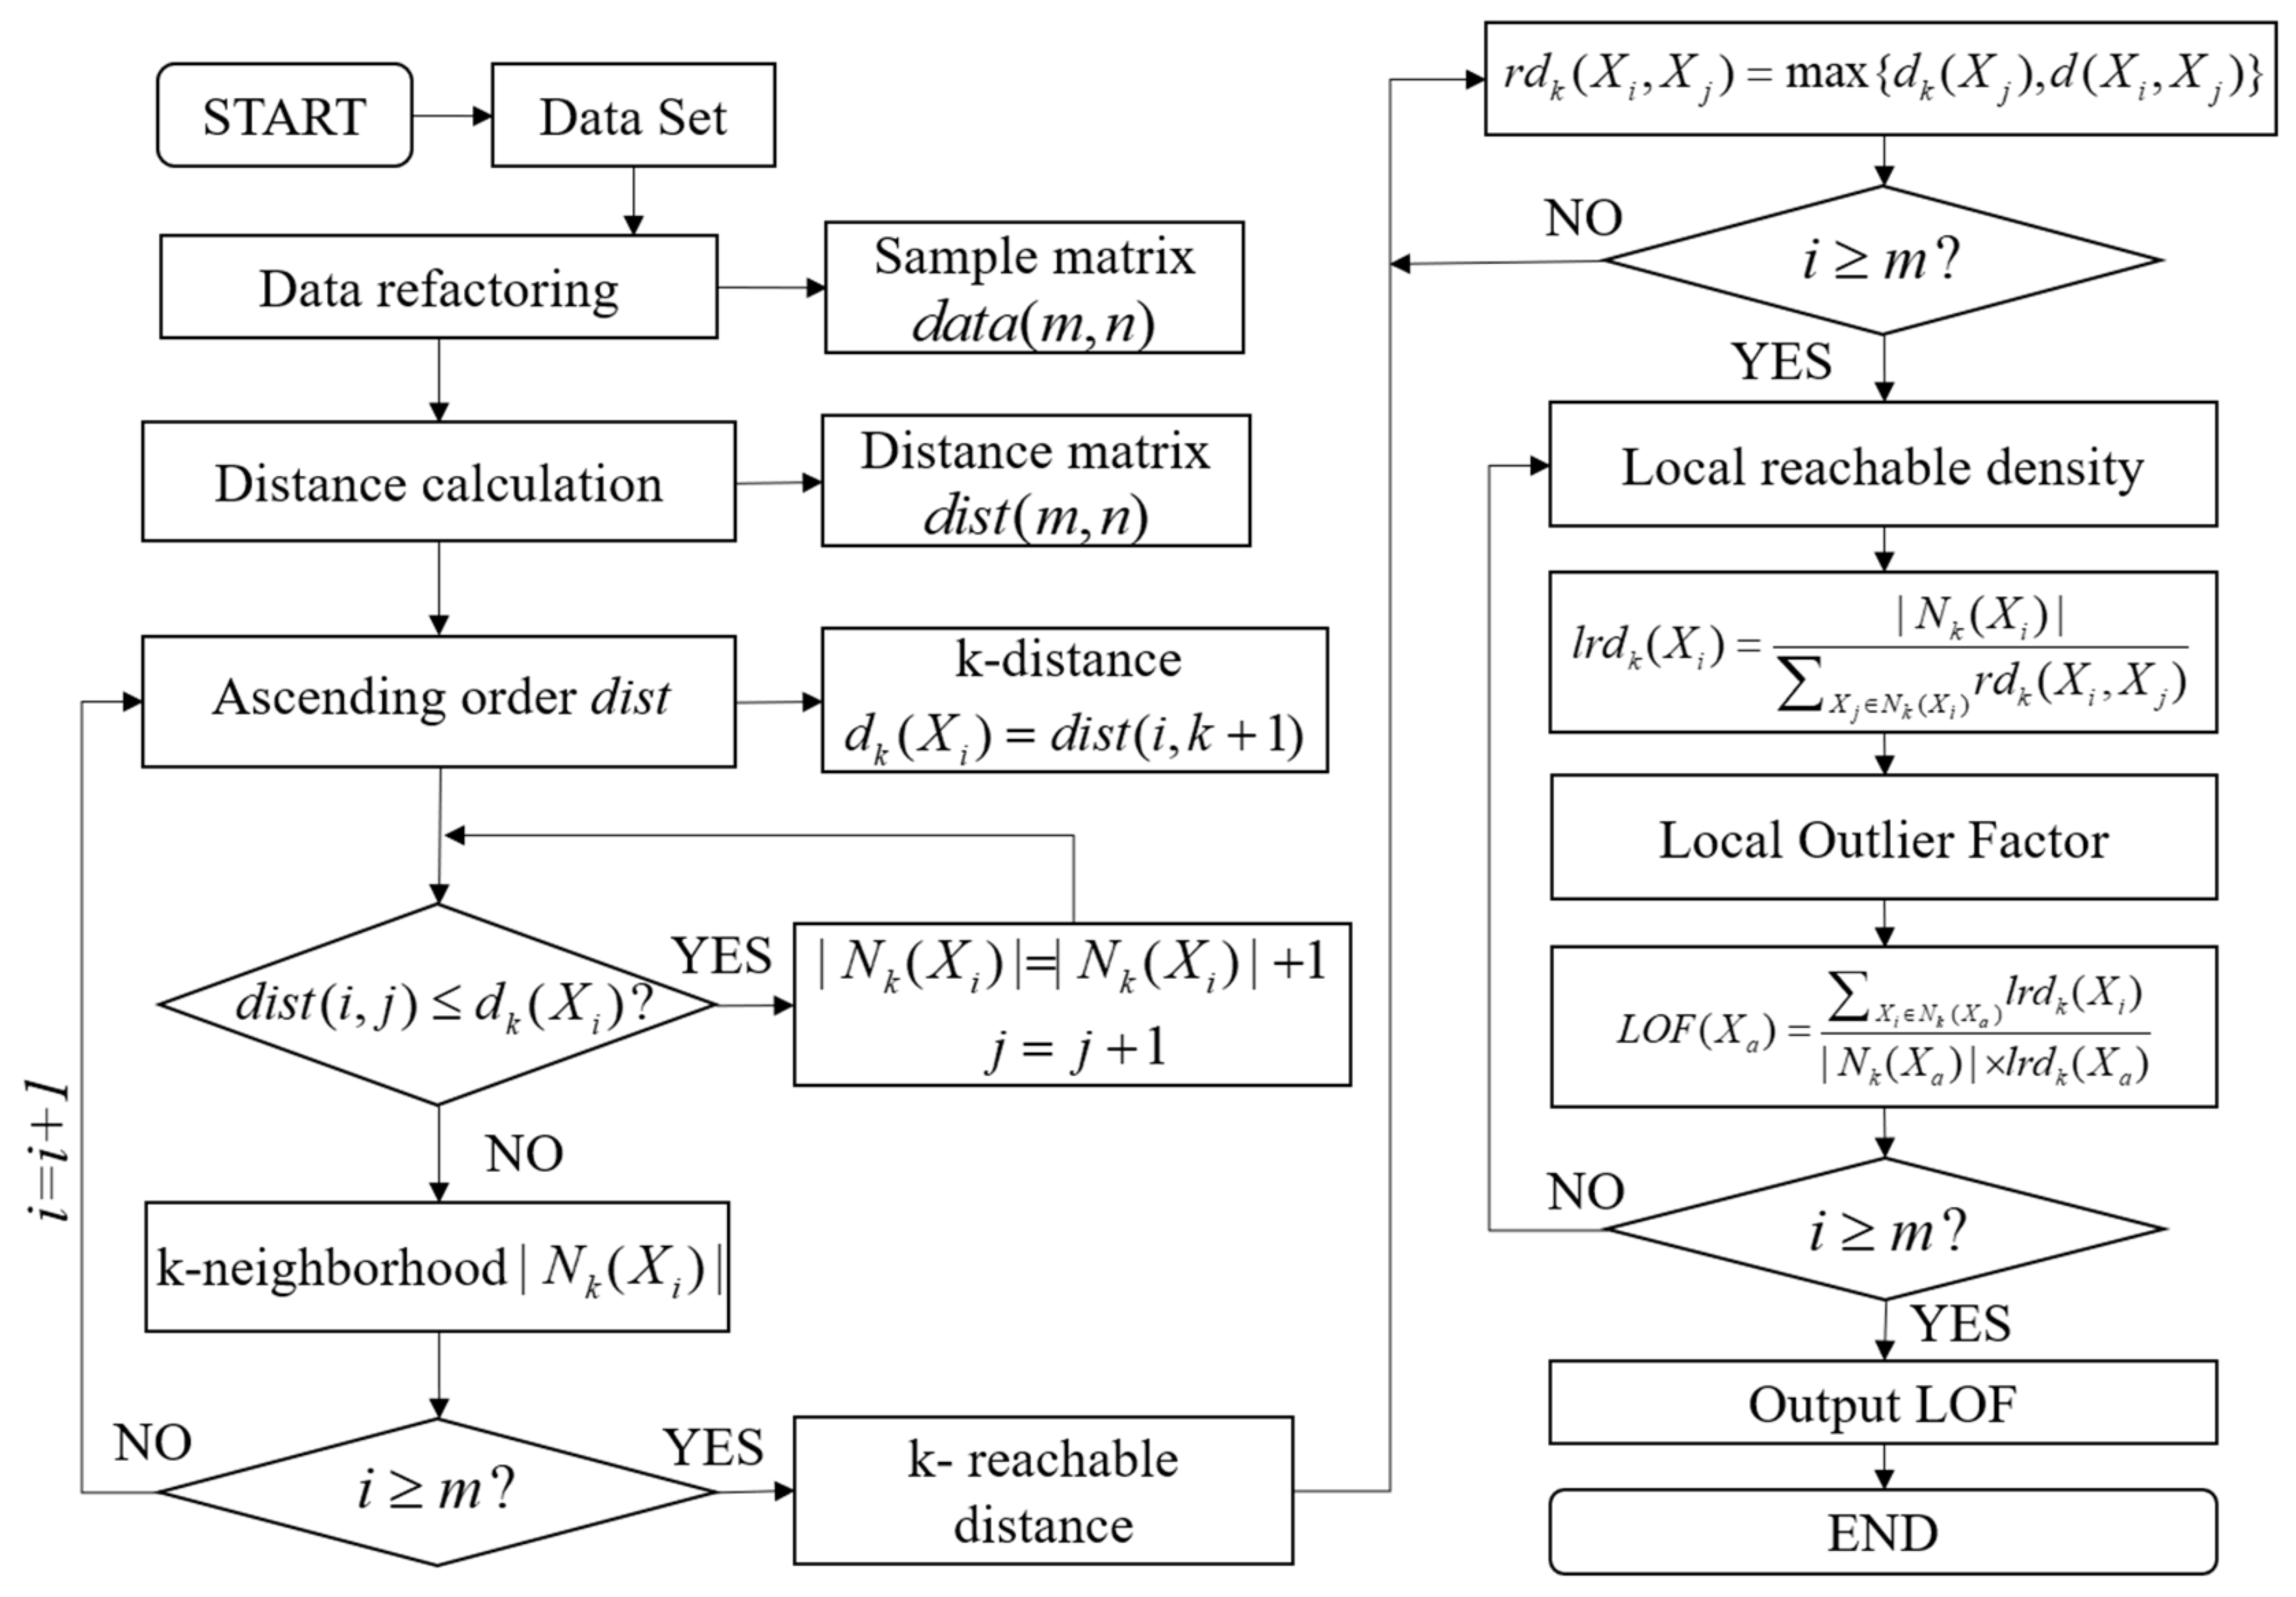
Verification and comparison of inconsistency diagnosis methods: The local outlier factor algorithm from outlier detection and the improved entropy algorithm from information entropy diagnosis are validated and compared.
(3)
Study on the inconsistency diagnosis strategy of retired batteries: A comprehensive inconsistency evaluation system for retired battery is established based on the battery cell voltage range, local outlier factor and improved Shannon entropy.

1.3. Organization of the Paper

The remainder of this paper is structured as follows: Section 2 describes the data source and data processing. Section 3 presents the principle of battery inconsistency diagnosis methods and the establishment process of the evaluation system. Section 4 presents the results of the inconsistency evaluation for two real vehicle samples.

2. Data Description Processing

2.1. Data Description

The complexity and variability of battery operating conditions in real-world vehicle data are important to study the inconsistency of retired batteries in electric vehicles. The emergence of a big data platform for electric vehicles provides a convenient way to obtain real-world vehicle operating data. The data used in the study came from the new energy vehicle monitoring and management platform. The data acquisition process involves the vehicle sensors collecting the data of the whole vehicle and battery management system, and then the vehicle terminal acquires the sensor data through CAN communication. Finally, the data from the vehicle terminal are uploaded to the cloud-based big data platform through the data transmission network, and the data are decoded and stored. Two real-world vehicle samples are used in the study; the first sample is an electric taxi with a battery capacity of 126 Ah and 96 cells. The second sample is a small commercial van with a battery capacity of 117 Ah and 90 cells. The battery type for both samples is lithium iron phosphate. The data acquisition frequency is 0.1 Hz, and the types of data acquired include the vehicle speed, mileage, temperature, voltage, current and so on. Some data types are shown in Figure 2.

2.2. Data Processing

It is difficult to avoid that the real vehicle data will produce some abnormal data and useless data in the processes of acquisition, transmission and decoding. These data cannot be used directly and require data processing. The data processing process mainly includes data statute, data integration and data cleaning. Data statute is the process of reducing the dimensionality of data through various methods, with the aim of finding the smallest subset of attributes that best represent the valid features of the data without losing valid information. Data statute can significantly reduce the amount of data, thus reducing the pressure on data storage and computation. A total of 61 data types are included in the raw data. After screening and removing data, such as the motor and driver temperatures, that are not related to the battery, we selected seven data types that best characterize the thermal electrical safety status of the battery: the sampling time, total voltage, total current, SOC, cell voltage, cell temperature and total mileage.
The data may come from multiple sources or in multiple forms for reasons such as irregular data storage and cross-platform format conversions, and data from different sources need to be normalized. Data integration eliminates differences in the data format and avoids program failures due to inconsistent data formats. The data integration work carried out in the study included unifying the temporal forms, grooming the temporal order, unifying the SOC ranges and merging the data from the same vehicle.
Data cleansing is the most important step in data processing and is the key to ensuring the data have a high quality. Data cleansing focuses on the abnormal and missing data. The processing of abnormal data is mainly based on the physical meaning and the relevant thresholds. For example, in this study, it is necessary to reject the data with a speed of less than 0, a total voltage equal to 0 and a temperature greater than 225 °C, which are judged to be sensor sampling anomaly problems. The methods for dealing with missing data include both deleting and interpolating. For temporal data loss and the loss of multiple data types at the same moment in time, these segments are processed for deletion. For the data types that are partially lost at some point, interpolation can be used to selectively retain and fill in the data segments. Some of the data processing results are shown in Figure 3.

3. Methodology

The battery inconsistency diagnosis methods are mainly classified into two categories: methods based on outlier detection and information entropy. The specific classifications are shown in Figure 4.

3.1. Inconsistency Diagnosis Based on Outlier Detection

The principle of the outlier detection-based inconsistency diagnosis method is to obtain the error boundaries by calculating the centers, densities or distances of all the sample data and to identify the samples that exceed the error boundaries as error points. The outlier detection-based inconsistency diagnosis methods mainly include a 3σ multi-level screening strategy (3σ MSS) [21], clustering outlier factor (COF) algorithm [22] and local outlier factor (LOF) algorithm [23]. The core principle of 3σ MSS is to exclude the outliers that have a large impact on the numerical properties of the sample, and then obtain a more desirable centroid. The 3σ MSS algorithm is based on the Gaussian model and employs a multi-level screening strategy that is able to find more reasonable centroids, while tolerating errors of different magnitudes. The computational process of the 3σ MSS is to eliminate the data in the original data that exceed the threshold 3σ, and then iteratively screen the data s times until the convergence condition is satisfied. The data a s at this point satisfy the following equation:
a s = { a i s | ( a i s < μ s 1 + 3 σ s 1 ) ( a i s > μ s 1 3 σ s 1 ) } | μ s μ s 1 | < F
where as is the new dataset after screening s times, and a i s is the element in the sample after screening s times, μ s 1 and σ s 1 are the sample mean and standard deviation after screening s − 1 times, μ s is the sample mean after screening s times, and F is the similarity tolerance limit. The basis for determining the presence of faulty points in the sample after filtering the outliers is to compare the Euclidean distance of each element from μ s . An element is considered to be an outlier when the following condition is met:
| a i s μ s | < r σ s
where σ s is standard deviation after screening s times, and r is the empirical factor.
The core of the COF algorithm is clustering, which assumes that points in large clusters with a large number of samples or densely populated samples are normal points, while points in clusters with a small number of samples or sparse samples are outliers. The computational procedure of COF is to first classify the sample A into k clusters, A = { C 1 , C 2 , , C k } , and then calculate the clustering outlier C O F ( a i ) for each element a i in A.
C O F ( a i ) = j = 1 k | C j | | A | × d ( a i , C j )
where | C j | and | A | represent the number of points in cluster C j and sample A, and d ( a i , C j ) is the Euclidean distance from point a i to the cluster center of C j . All clustered outliers form a new sample set B. The mean of B is μ , the standard deviation is σ , the fault point a i satisfies C O F ( a i ) > μ + β σ , and β is an empirical coefficient.
The core of the LOF algorithm is to determine the outlier condition based on the relative density of points. Outliers are surrounded by fewer points and are located in neighborhoods with a lower density distribution of points [24]. The calculation process of LOF is shown in Figure 5. Consider the sample set as an m ∗ n matrix A. Each row in A can be viewed as an n-dimensional vector X i .
A = ( X 1 , X 2 , , X m ) T X i = ( x 1 i , x 2 i , , x n i )
where x n i is the element in the i-th row and n-th column of matrix A. Then, calculate the distance d ( X i , X j ) between any two rows in A to obtain the distance matrix D i j .
d ( X i , X j ) = ( x 1 i x 1 j ) 2 + ( x 2 i x 2 j ) 2 + + ( x n i x n j ) 2 D i j = { x | x = d ( X i , X j ) , X i , X j A , i , j [ 1 , m ] }
Then, calculate the kth distance for each row. k is usually taken as 5–10% of the sample size, and the kth distance d k ( X a ) = d ( X a , X b ) for X a satisfies the following condition:
X i = { X i | X i A , X i X a , d ( X a , X i ) d ( X a , X b ) } , N ( X i ) k X i = { X i | X i A , X i X a , d ( X a , X i ) < d ( X a , X b ) } , N ( X i ) k 1
where N ( X i ) is the number of X i that satisfies the condition, and the kth distance from X a is the distance to the kth nearest point to X a . The kth distance neighborhood is then calculated for each point; this neighborhood contains all the points whose distance from point x is less than or equal to the kth distance. The neighborhood contains all the points whose distance from point X i is less than or equal to the kth distance. This is denoted by | N k ( X i ) | , or the number of points in the kth neighborhood, where the condition | N k ( X i ) | k is satisfied; a value greater than k satisfies the condition that there is more than one point that satisfies the d k ( X a ) = d ( X a , X b ) condition. The kth reachable distance r d k ( X i , X a ) of point X i is defined as the greater of the kth distance d k ( X i ) between the point and d ( X i , X a ) . The next step is to calculate the local attainable density l r d k ( X a ) ; this is defined as the ratio of the number of points in the kth neighborhood of point X a to the kth reachable distance from all points to point X a , and the formula is as follows:
r d k ( X i , X a ) = max { d k ( X i ) , d ( X i , X a ) } l r d k ( X a ) = | N k ( X a ) | X i N k ( X a ) r d k ( X i , X a )
Finally, the local outlier factor l r d k ( X a ) can be calculated, and the formula is as follows:
L O F ( X a ) = X i N k ( X a ) l r d k ( X i ) | N k ( X a ) | × l r d k ( X a )
The final judgement of the abnormal status of a cell is based on the size of the LOF value, and when the LOF value is much larger than 1, it is concluded that there is an abnormality at that point. In this study, the anomaly threshold of LOF is set as in Figure 5.

3.2. Inconsistency Diagnosis Based on Information Entropy

The main principle of the battery cell inconsistency diagnosis method based on information entropy analysis is to calculate the entropy value of the sample, use the statistics indicating the change in entropy value to determine the fault boundaries, and determine the points exceeding the boundaries as the fault points. The diagnosis methods based on information entropy include approximate entropy (ApEn) [25], sample entropy (SampEn) [26] and improved entropy (ImEn) [27]. ApEn can be used to quantify the regularity of time series fluctuations and unpredictable nonlinear dynamical parameters. Its main principle is that when a system is in a normal state, each parameter change tends to be consistent, and the difference between the ApEn values of each time period is small. When an inconsistent battery failure occurs, the parameter variance increases, the data complexity of the samples rises, and the ApEn value fluctuates more in the corresponding time period. The computational procedure of ApEn is to first compute the Chebyshev distances of all the elements in the sample matrix to obtain the distance matrix dist. Then, after excluding the main diagonal elements of the dist matrix, the ratio C i m of the number of elements in the dist below the similarity tolerance limit F to the number k of all the elements in that row is counted by row.
C i m = 1 k n u m { d i < F , F = r × s t d , i [ 1 , 2 , , k ] }
where m is the dimension of the comparison vector constructed based on the sample matrix, d i is all the elements of row i in dist, r is the empirical coefficient, and std is the standard deviation of the sample. The C i m of each row forms a new matrix C m , and then the logarithmic mean P m = 1 k i = 1 k ln C i m of C m is computed, and finally the approximate entropy A p E n = P m P m + 1 of the matrix is obtained.
SampEn can be used as a parameter to describe the complexity of a time series, and the magnitude of the probability that the series will generate a new pattern when the metric dimensions change [28]. The higher the probability of generating a new pattern is, the higher the complexity of the sequence is, and the higher the entropy value is. The calculation process of SampEn is basically the same as that of the ApEn algorithm. After constructing the new matrix C m , the arithmetic mean P m = 1 k i = 1 k C i m of C m is calculated, and finally the matrix S a m p E n = ln ( P m + 1 P m ) is obtained.
ImEn is an improved algorithm based on Shannon entropy, and the main principle of inconsistency evaluation between battery cells is to calculate the inconsistency situation of the sample relative to the overall distribution characteristics. The ImEn algorithm introduces the inter-correlation of analyzed cells with respect to the other cells based on Shannon entropy. The computational procedure of ImEn is to represent an n-dimensional set of time series samples using matrix B; b i , j denotes the elements in B, and m is the number of samples. The extremely large value b max and the extremely small value b min in matrix B are counted, and then matrix C is obtained by binning matrix B with group distance l.
B = b 1 , 1 b 1 , n b k , 1 b k , n , C = c 1 , 1 c 1 , n c l , 1 c l , n , P = p 1 , 1 p 1 , n p l , 1 p l , n
Denoted by c i , j , any element of C, c i , j is calculated as follows:
c i , j = { x | n u m [ x ( b min + ( i 1 ) b max b min l , b min + i b max b min l ) , i [ 1 , l ] , j [ 1 , n ] ] }
The frequency of each group time interval of C is then computed to obtain the frequency matrix P, with p i , j denoting any element of P.
p i , j = c i , j i = 1 l c i , j
Finally, the improved Shannon entropy ImEn of B at moment k is calculated.
Im E n = [ H 1 , H 2 , , H j , , H n ] H j = i = 1 l p i , j log b p i , j
where b is a natural constant, and the inconsistency of the cell is assessed based on the output ImEn value at each moment.
The 3σ MSS method requires the sample data to have a normal distribution, but the cell voltage data used for inconsistency evaluation do not usually meet the requirements. The detection results of the COF algorithm are very dependent on the sample clustering situation, and when the clustering situation is poor, the detection results are hardly informative [29]. The LOF algorithm is stable and cannot only diagnose outliers, but also reflect the degree of outliers, which can provide more data support for the inconsistency evaluation of retired batteries [30]. The LOF algorithm is chosen in this study for validation under this broad category of evaluation methods.
The ApEn algorithm can be implemented with fewer local data samples, which is convenient for identifying low-dimensional deterministic systems, periodic systems, random systems and hybrid systems, and this is easy and fast to apply. However, ApEn needs to ensure that the system is in a broadly smooth state and that the mean and standard deviation do not change much with the system, and the computation time is longer, which limits the application of ApEn to some extent [31]. The SampEn algorithm has the advantages of short data requirements, high-level noise, interference immunity and good consistency over a wide range of parameter values and is widely used in the mechanical field for bearing fault diagnosis. However, SampEn does not perform the self-matching of comparison vectors, which also leads to the reduced reliability of sample entropy in distinguishing time series generated by different systems. The ImEn algorithm can be used to measure cell voltage inconsistency faults, diagnose the location and duration of cell faults and predict possible future faults. The ImEn algorithm is selected in the study for validation under this broad category of evaluation methods.

3.3. Inconsistency Evaluation Strategy

At present, there are fewer inconsistency studies on retired battery packs, and a comprehensive inconsistency evaluation system has not yet been established. In view of the above problems, this paper establishes a comprehensive inconsistency evaluation system for retired batteries based on the LOF, ImEn and voltage range of the cell. Firstly, the inconsistency of the battery pack is classified into three categories, which are normally, slightly and seriously, and the grading is shown in Table 1 [27]. The threshold data in Table 1 are all based on the existing research, while a large number of experiments was conducted in the study to confirm the thresholds.
Secondly, the distribution frequency of the three evaluation indicators for the three grades is calculated, and the inconsistency fuzzy relationship matrix R is established according to the grading results of each indicator, and the calculation formula is as follows:
R = P 1 , 1 P 1 , 2 P 1 , 3 P 2 , 1 P 2 , 2 P 2 , 3 P 3 , 1 P 3 , 2 P 3 , 3
where P i , j is the frequency of distribution of the ith indicator at level j, the first row is the frequency of distribution of LOF at three levels, the second row is ImEn, and the third row is voltage range. Then, the weight matrix W is calculated for each assessment indicator.
A i = 1 ln b i = 1 b r i j ln r i j W i = 1 A i a k = 1 a A k
where A i is the entropy value of the ith indicator, r i j is the distribution frequency of indicator i at level j, b is the number of inconsistency levels, a is the number of evaluation indicators, and it is stipulated that ln r i j = 0 when r i j = 0. In this paper, a = b = 3. Finally, the evaluation matrix B is calculated based on R.
B = W × R = ( b 1 , b 2 , b 3 )
where b 1 , b 2 , b 3 are the probabilities that the inconsistency is of normal, slight, and severe levels.
Finally, the calculated R and B matrices are used as the basis for the inconsistency evaluation of retired battery packs. Firstly, the last column of the fuzzy relationship matrix R is checked, which is the severity level column of all the evaluation indicators. If any result is greater than zero, the inconsistency of the battery pack is judged as serious. If there is no result greater than 0 in the last column of R, the inconsistency of the whole battery pack is judged according to the results of the matrix B, and the level corresponding to the largest value in b 1 , b 2 , b 3 is used as the inconsistency level of the whole battery pack according to the principle of maximum affiliation.

4. Results and Discussion

The inconsistency analysis in this study is mainly based on the cell voltage data. The first real-world vehicle sample set used is from a vehicle equipped with a lithium iron phosphate battery pack, the number of cells is 96, the data collection date is 30 June 2022, 4000 data points were selected for analysis, and the voltage variation curve of the battery cells in the selected segments is shown in Figure 6.

4.1. Voltage Range, LOF and ImEn Results

Firstly, the voltage polarities of all the cells at different moments were calculated, and Figure 7 shows the distribution of the voltage range at all the moments. From this figure, 4000 moments in the sample were selected, in which the voltage difference does not exceed 0.1 V, and there are no serious fault cells. In addition, there are only a few cells that exceed the threshold of the voltage range for slight faults, and the voltage ranges are lower than 0.05 V in most cases. The consistency of the selected battery packs is relatively good in terms of the distribution of the voltage ranges.
Then, the LOF value of each cell was obtained, and all the cell voltages were extracted in the calculation, which is regarded as an m × n matrix V, where m is the number of cells, and n is the number of time point, and the LOF value of all the cells was output after inputting the matrix V. After obtaining the LOF value, based on the thresholds of the three states using the LOF index in Table 1, the distribution frequency of each cell in the three states was counted to finally obtain the failure frequency distribution of the cell. The results of the frequency distributions of slight and serious faults for each cell at all the moments are shown in Figure 8. From this figure, cell 61 has the highest frequency of slight faults, followed by cell 29. Only the first 16 cells have a frequency of failures close to 0 among the serious faults, while the remaining cells have more frequent serious faults. The one to most frequently experience a serious fault is cell 65, with a fault frequency of 0.13.
Finally, the ImEn value of each cell at all the moments was obtained, and the frequency of each cell’s ImEn value exceeding the thresholds of a slight fault and a serious fault was counted. Figure 9 illustrates the distribution of the fault frequency of all the cells. From Figure 9, it can be seen that there are differences in the results between ImEn and LOF. Among the slight faults, the frequency of cell 29 is the highest, reaching 0.445, followed by cells 69 and 77. Other than this, the rest of the cells have a fault frequency of less than 0.16, which is not enough for the faults to manifest themselves. Among the serious faults, only the frequency of cell 29 stands out at 0.207, which is much higher than the frequency of the other cell faults. It is surmised that the inconsistency of cell 29 in the battery pack is the most severe and may lead to the highest probability of battery pack failure.

4.2. Results of the Integrated Evaluation of Inconsistency

A comprehensive evaluation of battery pack inconsistency was carried out after obtaining the results of each indicator. Firstly, the fuzzy matrix R was calculated. The LOF and ImEn obtained reflect the degree of inconsistency of all the cells at different moments, but we could not obtain the inconsistency state of the whole battery pack, which is quite different from the result of outputting one battery pack voltage difference at each moment. In order to harmonize the form of the three indicators and to facilitate the calculation of the fuzzy matrix, changes were made to the form of the results for LOF and ImEn. The frequency of LOF and ImEn values exceeding the corresponding level at all the moments was counted as a new indicator of the inconsistency of the whole battery at all the moments. The calculated fuzzy matrix R is as follows:
R = 0.8229 0.1771 0 0.9687 0.0323 0 0.9912 0.0088 0
The last column of the matrix R is not zero in any of them, indicating that there is no serious inconsistency for any of the three indicators. It was necessary to further calculate the evaluation matrix B. The level corresponding to the maximum value in B was used as the basis for determining the inconsistency status of the whole battery pack. The entropy value A, the weight matrix W and the evaluation matrix B were calculated for each indicator.
A = [ 0.4251 , 0.1266 , 0.0457 ] W i = [ 0.2393 , 0.3635 , 0.3972 ] B = [ 0.9428 , 0.0572 , 0 ]
The first number of the evaluation matrix B is the largest, which corresponds to the normal class; thus, it is known that the inconsistency of this sample cell is normal.

4.3. Analysis of Severely Inconsistent Battery Sample

The second real-world vehicle sample set used in study is from a commercial vehicle equipped with a lithium iron phosphate battery, the number of cells is 90, the data collection date is 7 June 2022, 2800 data points were selected for analysis, and the voltage variation curve of the battery cells of the selected segments is shown in Figure 10.
Figure 11 shows the voltage range for all the moments of the second battery pack sample. Compared to sample number one, the voltage range has increased significantly, exceeding 0.05 V at most moments and 0.15 V at a few moments, showing that the inconsistency of the battery pack is much more serious from the perspective of the voltage range.
Figure 12 shows the LOF-based fault frequency distribution of all the cells of the battery pack two sample. From this figure, it can be seen that several abnormal cells appeared, some with a much higher frequency of faults, especially slight faults. The frequency of slight faults for cells such as cell 16 and cell 30 is close to one, meaning that the LOF values for these cells are above the slight fault threshold at most moments. The frequency of serious faults is relatively low for each cell, with the highest being for cell 31 at 0.419, and the rest of the cell faults are basically spread around 0.2. From the LOF results, the inconsistency between the cells of the second sample is very serious, and several cells exceed the failure threshold, so it was initially judged that the inconsistency of the battery is caused by several abnormal cells.
Figure 13 shows the ImEn-based defect frequency distribution for all the cells of the battery pack two sample. From the overall distribution level of fault frequency, the consistency of the battery pack is poor, and the frequency of multiple individual faults is high. Moreover, the abnormal cells are mostly distributed among cells 16–30, with a relatively dense distribution. Among the major defects, cells 16, 23, 26, 28, 29, and 30 have the highest fault frequency, all exceeding 0.15. Among the serious faults, cell 43 has the highest fault frequency at 0.226, which is even higher than its frequency of slight faults. The fuzzy matrix R of sample two was calculated based on the analysis results of the above three indicators.
R = 0.6444 0.1112 0.2444 0.9556 0.0444 0 0.8442 0.1518 0.004
The last column of the matrix R has two rows of non-zero values, indicating that there are serious inconsistency moments in the LOF and voltage range among the three indicators, from which it can be directly concluded that the inconsistency of the sample two battery is serious.

5. Conclusions

Retired batteries have already experienced many charge/discharge cycles, so the internal differences are further amplified, and the inconsistency of the internal cells becomes a major factor threatening the safe and stable operation of battery packs. Therefore, it is essential to assess the inconsistency of retired batteries. In this paper, the inconsistency diagnosis methods for batteries are summarized, including the methods based on outlier detection and the methods based on information entropy, from which two algorithms, LOF and ImEn, are selected for validation. Then, based on the voltage data of retired batteries in real-world vehicles, the inconsistency diagnosis of two samples is carried out using the three indicators of voltage range, LOF and ImEn, and the diagnostic results indicate that the severity of inconsistency among the three indicators in sample two is higher than that in sample one. Finally, by combining the three indicators and setting three inconsistency levels of normal, slight and serious for each indicator, a comprehensive multi-level and multi-indicator inconsistency evaluation strategy for retired batteries is established. Based on the evaluation strategy, two samples are evaluated for inconsistency, and the evaluation results of the two samples are normal and serious, which proves that the proposed evaluation strategy can quickly and accurately diagnose the battery packs with poor inconsistency, and this can provide a reliable basis for the safe and stable operation of retired batteries in secondary use. The battery pack samples used in the study were randomly selected, and it is not clear whether there are real faults with poor inconsistency, so the proposed method still lacks the effective validation of actual fault samples. Based on the above problems, the quality of the samples will be further optimized in subsequent studies to select fault samples and effectively verify the accuracy of the inconsistency evaluation strategy.

Author Contributions

Conceptualization, J.W.; methodology, K.L.; software, K.L.; validation, K.L.; formal analysis, Z.W.; investigation, J.W.; resources, Y.Z.; data curation, C.Z.; writing—original draft preparation, J.W. and K.L.; writing—review and editing, J.W. and C.Z.; visualization, Y.Z.; supervision, P.L.; project administration, Z.W.; funding acquisition, P.L. All authors have read and agreed to the published version of the manuscript.

Funding

The project is supported partly by the Jilin Scientific and Technological Development Program (No. 20220301019GX), the National Natural Science Foundation of China (No. 52107220), Beijing Nova Program (No. 20230484272), the Opening Foundation of Key Laboratory of Advanced Manufacture Technology for Automobile Parts, Ministry of Education (No. 2022 KLMT03), and Fundamental Research Funds for the Central Universities (No. FRF-BD-20-08A, No. FRF-IDRY-21-013).

Data Availability Statement

The data presented in this study are available on request from the corresponding author. Due to corporate sensitivity and confidentiality, the data in this study cannot be made public for the time being. It will be shared upon request after the data is desensitized in the future.

Conflicts of Interest

Author Jiegang Wang, Zhenpo Wang, Yangjie Zhou and Peng Liu are employed by the Wuhan Weilan New Energy Technology Co. The remaining authors declare that the research was conducted in the absence of any commercial or financial relationships that could be construed as a potential conflict of interest.

References

  1. Tie, S.F.; Tan, C.W. A review of energy sources and energy management system in electric vehicles. Renew. Sustain. Energy Rev. 2013, 20, 82–102. [Google Scholar] [CrossRef]
  2. Andwari, A.M.; Pesiridis, A.; Rajoo, S.; Martinez-Botas, R.; Esfahanian, V. A review of Battery Electric Vehicle technology and readiness levels. Renew. Sustain. Energy Rev. 2017, 78, 414–430. [Google Scholar] [CrossRef]
  3. Feng, X.; Ouyang, M.; Liu, X.; Lu, L.; Xia, Y.; He, X. Thermal runaway mechanism of lithium ion battery for electric vehicles: A review. Energy Storage Mater. 2018, 10, 246–267. [Google Scholar] [CrossRef]
  4. Chen, Y.; Kang, Y.; Zhao, Y.; Wang, L.; Liu, J.; Li, Y.; Liang, Z.; He, X.; Li, X.; Tavajohi, N.; et al. A review of lithium-ion battery safety concerns: The issues, strategies, and testing standards. J. Energy Chem. 2021, 59, 83–99. [Google Scholar] [CrossRef]
  5. Chirumalla, K.; Kulkov, I.; Vu, F.; Rahic, M. Second life use of Li-ion batteries in the heavy-duty vehicle industry: Feasibilities of remanufacturing, repurposing, and reusing approaches. Sustain. Prod. Consum. 2023, 42, 351–366. [Google Scholar] [CrossRef]
  6. Fan, E.; Li, L.; Wang, Z.; Lin, J.; Huang, Y.; Yao, Y.; Chen, R.; Wu, F. Sustainable recycling technology for Li-ion batteries and beyond: Challenges and future prospects. Chem. Rev. 2020, 120, 7020–7063. [Google Scholar] [CrossRef]
  7. Dubarry, M.; Vuillaume, N.; Liaw, B.Y. Origins and accommodation of cell variations in Li-ion battery pack modeling. Int. J. Energy Res. 2010, 34, 216–231. [Google Scholar] [CrossRef]
  8. Hong, J.; Wang, Z.; Yao, Y. Fault prognosis of battery system based on accurate voltage abnormity prognosis using long short-term memory neural networks. Appl. Energy 2019, 251, 113381. [Google Scholar] [CrossRef]
  9. Xie, X.; Lai, G.; You, M.; Liang, J.; Leng, B. Effective transfer learning of defect detection for photovoltaic module cells in electroluminescence images. Sol. Energy 2023, 250, 312–323. [Google Scholar] [CrossRef]
  10. Omariba, Z.B.; Zhang, L.; Sun, D. Review of battery cell balancing methodologies for optimizing battery pack performance in electric vehicles. IEEE Access 2019, 7, 129335–129352. [Google Scholar] [CrossRef]
  11. Liu, M.; Cao, X.; Cao, C.; Wang, P.; Wang, C.; Pei, J.; Lei, H.; Jiang, X.; Li, R.; Li, J. A review of power conversion systems and design schemes of high-capacity battery energy storage systems. IEEE Access 2022, 10, 52030–52042. [Google Scholar] [CrossRef]
  12. Li, N.; Zhang, Y.; He, F.; Zhu, L.; Zhang, X.; Ma, Y.; Wang, S. Review of lithium-ion battery state of charge estimation. Glob. Energy Interconnect. 2021, 4, 12. [Google Scholar] [CrossRef]
  13. Zheng, Y.; Lu, L.; Han, X.; Li, J.; Ouyang, M. LiFePO4 battery pack capacity estimation for electric vehicles based on charging cell voltage curve transformation. J. Power Sources 2013, 226, 33–41. [Google Scholar] [CrossRef]
  14. Lv, S.; Wang, X.; Lu, W.; Zhang, J.; Ni, H. The influence of temperature on the capacity of lithium ion batteries with different anodes. Energies 2021, 15, 60. [Google Scholar] [CrossRef]
  15. Hoque, M.M.; Hannan, M.A.; Mohamed, A.; Ayob, A. Battery charge equalization controller in electric vehicle applications: A review. Renew. Sustain. Energy Rev. 2017, 75, 1363–1385. [Google Scholar] [CrossRef]
  16. Feng, F.; Hu, X.; Hu, L.; Hu, F.; Li, Y.; Zhang, L. Propagation mechanisms and diagnosis of parameter inconsistency within Li-Ion battery packs. Renew. Sustain. Energy Rev. 2019, 112, 102–113. [Google Scholar] [CrossRef]
  17. Zhao, Y.; Zhang, W.; Jiang, J.; Zhao, T.; Wen, F. Analysis on inconsistency of electric bicycle battery pack. In Proceedings of the 2014 IEEE Conference and Expo Transportation Electrification Asia-Pacific (ITEC Asia-Pacific), Beijing, China, 31 August–3 September 2014; pp. 1–5. [Google Scholar]
  18. Lin, T.; Chen, Z.; Zhou, S. Voltage-correlation based multi-fault diagnosis of lithium-ion battery packs considering inconsistency. J. Clean. Prod. 2022, 336, 130358. [Google Scholar] [CrossRef]
  19. Kim, J.; Shin, J.; Chun, C.; Cho, B.H. Stable configuration of a Li-ion series battery pack based on a screening process for improved voltage/SOC balancing. IEEE Trans. Power Electron. 2011, 27, 411–424. [Google Scholar] [CrossRef]
  20. Wang, X.; Fang, Q.; Dai, H.; Chen, Q.; Wei, X. Investigation on Cell Performance and Inconsistency Evolution of Series and Parallel Lithium-Ion Battery Modules. Energy Technol. 2021, 9, 2100072. [Google Scholar] [CrossRef]
  21. Zhao, Y.; Liu, P.; Wang, Z.; Zhang, L.; Hong, J. Fault and defect diagnosis of battery for electric vehicles based on big data analysis methods. Appl. Energy 2017, 207, 354–362. [Google Scholar] [CrossRef]
  22. Jiang, S.; An, Q. Clustering-based outlier detection method. In Proceedings of the 2008 Fifth International Conference on Fuzzy Systems and Knowledge Discovery, Jinan, China, 18–20 October 2008; Volume 2, pp. 429–433. [Google Scholar]
  23. Breunig, M.M.; Kriegel, H.P.; Ng, R.T.; Sander, J. LOF: Identifying density-based local outliers. In Proceedings of the 2000 ACM SIGMOD International Conference on Management of Data, Dallas, TX, USA, 16–18 May 2000; pp. 93–104. [Google Scholar]
  24. Nowak-Brzezińska, A.; Horyń, C. Outliers in rules-the comparision of LOF, COF and KMEANS algorithms. Procedia Comput. Sci. 2020, 176, 1420–1429. [Google Scholar] [CrossRef]
  25. Pincus, S.M. Approximate entropy as a measure of system complexity. Proc. Natl. Acad. Sci. USA 1991, 88, 2297–2301. [Google Scholar] [CrossRef] [PubMed]
  26. Richman, J.S.; Moorman, J.R. Physiological time-series analysis using approximate entropy and sample entropy. Am. J. Physiol. Heart Circ. Physiol. 2000, 278, H2039–H2049. [Google Scholar] [CrossRef]
  27. Wang, Z.; Hong, J.; Liu, P.; Zhang, L. Voltage fault diagnosis and prognosis of battery systems based on entropy and Z-score for electric vehicles. Appl. Energy 2017, 196, 289–302. [Google Scholar] [CrossRef]
  28. Kaffashi, F.; Foglyano, R.; Wilson, C.G.; Loparo, K.A. The effect of time delay on approximate & sample entropy calculations. Phys. D Nonlinear Phenom. 2008, 237, 3069–3074. [Google Scholar]
  29. Goldstein, M.; Uchida, S. A comparative evaluation of unsupervised anomaly detection algorithms for multivariate data. PLoS ONE 2016, 11, e0152173. [Google Scholar] [CrossRef] [PubMed]
  30. Cheng, Z.; Zou, C.; Dong, J. Outlier detection using isolation forest and local outlier factor. In Proceedings of the Conference on Research in Adaptive and Convergent Systems, Chongqing, China, 24–27 September 2019; pp. 161–168. [Google Scholar]
  31. Spilka, J.; Chudáček, V.; Koucký, M.; Lhotská, L.; Huptych, M.; Janků, P.; Georgoulas, G.; Stylios, C. Using nonlinear features for fetal heart rate classification. Biomed. Signal Process. Control. 2012, 7, 350–357. [Google Scholar] [CrossRef]
Figure 1. Route to comprehensive evaluation of inconsistency.
Batteries 10 00082 g001
Figure 2. Presentation of some sample data types.
Batteries 10 00082 g002
Figure 3. Data processing results.
Batteries 10 00082 g003
Figure 4. Classifications of inconsistent diagnostic methods.
Batteries 10 00082 g004
Figure 5. Process of LOF algorithm.
Batteries 10 00082 g005
Figure 6. Cells voltage of the first sample dataset.
Batteries 10 00082 g006
Figure 7. Voltage range distribution of the first sample.
Batteries 10 00082 g007
Figure 8. Cell fault frequency distribution of the first sample based on LOF.
Batteries 10 00082 g008
Figure 9. Cell fault frequency distribution of the first sample based on ImEn.
Batteries 10 00082 g009
Figure 10. Cells voltage of the second sample dataset.
Batteries 10 00082 g010
Figure 11. Voltage range distribution of the second sample.
Batteries 10 00082 g011
Figure 12. Cell fault frequency distribution of the second sample based on LOF.
Batteries 10 00082 g012
Figure 13. Cell fault frequency distribution of the first sample based on ImEn.
Batteries 10 00082 g013
Table 1. Methodology for grading the evaluation indicators.
Indicators\LevelsNormallySlightlySeriously
LOF(0, 3](3, 5](5, +∞)
ImEn(0, 2](2, 3](3, +∞)
Voltage range/V(0, 0.05](0.05, 0.15](0.15, +∞)
Disclaimer/Publisher’s Note: The statements, opinions and data contained in all publications are solely those of the individual author(s) and contributor(s) and not of MDPI and/or the editor(s). MDPI and/or the editor(s) disclaim responsibility for any injury to people or property resulting from any ideas, methods, instructions or products referred to in the content.

