Article

Influence of the Particle Size on the Electrical, Magnetic and Biological Properties of the Bioglass® Containing Iron Oxide

by
Joana Soares Regadas
1,
Sílvia Rodrigues Gavinho
1,*,
Sílvia Soreto Teixeira
1,
Juliana Vieira de Jesus
1,
Ana Sofia Pádua
2,
Jorge Carvalho Silva
3,
Susana Devesa
4,* and
Manuel Pedro Fernandes Graça
1,*
1
i3N and Physics Department, Aveiro University, 3800-193 Aveiro, Portugal
2
i3N-CENIMAT and Materials Science Department, NOVA School of Science and Technology, Campus de Caparica, 2829-516 Caparica, Portugal
3
i3N-CENIMAT and Physics Department, NOVA School of Science and Technology, Campus de Caparica, 2829-516 Caparica, Portugal
4
Centre for Mechanical Engineering, Materials and Processes (CEMMPRE), Department of Mechanical Engineering, University of Coimbra, Rua Luís Reis Santos, 3030-788 Coimbra, Portugal
*
Authors to whom correspondence should be addressed.
Magnetochemistry 2023, 9(9), 209; https://doi.org/10.3390/magnetochemistry9090209
Submission received: 13 July 2023 / Revised: 8 August 2023 / Accepted: 6 September 2023 / Published: 12 September 2023
(This article belongs to the Special Issue Advances in Functional Materials with Tunable Magnetic Properties)

Abstract

:
Bioglasses have been used throughout the past century as a biomaterial in the bone regeneration field. However, recent studies have attempted to use them as a therapeutic material as well, mainly in the treatment of osteosarcomas. The most widely recognized bioglass is the 45S5 Bioglass, invented by Larry Hench et al., which presents higher bioactivity. A possible application of this bioglass in the treatment of osteosarcomas can be accomplished by adding specific ions, such as iron, that will allow the use of magnetic hyperthermia and Fenton reaction as therapeutic mechanisms. In this study, a 45S5 Bioglass containing 10%mol of Fe2O3 was produced using the melt-quenching method. A group of samples was prepared by changing the overall ball milling time, from 1 h up to 48 h, to analyze the effects of iron in the bioactive glass matrix and evaluate the influence of particle size on their physical and biological properties. The studied bioglasses showed no evidence of changes in the amorphous structural nature compared to the 45S5 Bioglass. The data of the impedance spectroscopy study revealed that the addition of Fe2O3 can increase the standard rate constant of the Electro-Fenton reaction, with the sample milled for 12 h showing the most promising results. The reduction in the particle size influenced the cytotoxicity and the bioactivity. The samples with lower particle sizes showed a higher level of cytotoxicity.

1. Introduction

For a long time, researchers have been trying to find ways to repair bone defects. In the tissue engineering field, biomaterials are an important approach to the promotion of regenerative processes, presenting biocompatibility, non-carcinogenic behavior and good mechanical properties. These biomaterials can be based on polymers, metals, composites, ceramics or bioactive glasses [1,2].
In 1969, Larry Hench developed the first bioactive glass, the 45S5 Bioglass, with 45% SiO2, 24.5% Na2O, 24.5% CaO and 6% P2O5, in weight. This bioactive material currently presents the highest bioactivity level compared with other biomaterials, and it is able to react and form bonds with the host bone. The 45S5 Bioglass shows osteoconductive and osteoinductive characteristics. Its osteoconductive property is related to the ability of the bioactive glass to act like a matrix for the attachment, migration, growth and division of the cells. The osteoinductive property is associated with the capability of the 45S5 Bioglass to stimulate the recruitment of immature cells and to promote their differentiation into osteoblasts cells, increasing their proliferation [3,4].
The 45S5 Bioglass, when in contact with the body fluid, promotes ionic exchange with the surrounding medium, which results in the deposition of an amorphous Ca/P rich-layer on the bioactive glass surface. The crystallization of this layer leads to the formation of the hydroxyapatite (HAp) layer. HAp has chemical and structural similarities to the mineral phase of human bone, stimulating the production of specific cells that are present in the process of forming new bone [5]. The strong bond created between the new bone and the host bone must also present good mechanical properties that can be controlled through the formation rate of the HAp layer [6].
The 45S5 Bioglass composition can be modified by adding specific ions to obtain better bioactivity, enhance antibacterial properties or confer some new features. The incorporation of iron (Fe) into the bioactive glass network can be used in cancer treatment through cell death by increasing the local temperature (magnetic hyperthermia) or by generating reactive oxygen species which promote ferroptosis (Electron-Fenton reaction). The magnetic hyperthermia treatment is based on the increase in the temperature due to exposure of the magnetic active material to an alternating magnetic field. This effect is due to the magnetic loss associated with hysteresis, Néelian relaxation or Brownian relaxation. The controlled increase in the temperature, between 42 °C and 46 °C, through this mechanism, will cause irreversible damage to the tumor cells, resulting in their necrosis [6,7,8,9].
Another way to target cancer cells with Fe-containing bioglass involves the Electron-Fenton reaction (EF). The EF mechanism is based on the redox reaction between reactive oxygen species (ROS), such as hydrogen peroxide (less reactive), and Fe2+/Fe3+, resulting in the formation of hydroxyl free radicals OH (more reactive). Tumor cells present a high level of concentration of ROS, specifically hydrogen peroxide (H2O2), which is responsible for the proliferation of the tumor cells. Therefore, these radicals, when in the presence of Fe will activate the Fenton reaction, producing the hydroxyl free radicals that act as an inflammatory agent, activating a series of apoptosis events in the tumor cells [10,11,12].
Besides conferring magnetic properties to the bioactive glass, the incorporation of Fe into the composition can also improve the calcification process and osteoblast proliferation [7,11].
Accordingly, this work aims to prepare a 45S5 Bioglass with the incorporation of iron, using the melt-quenching technique [13,14], and to conduct a preliminary investigation of the possible application of this Fe-containing 45S5 Bioglass in the treatment of cancer with two different approaches, magnetic hyperthermia and Electron-Fenton Reaction. This work highlights the impact of particle size on the biological characteristics of Fe-containing 45S5 Bioglass.

2. Materials and Methods

2.1. Synthesis

The synthesized bioactive glass has the base formulation of the 45S5 Bioglass (BG) which has the following weight composition 45% SiO2, 24.5% Na2O, 24.5% CaO and 6% P2O5 and the Fe2O3 was added to the BG network [2,15]. Initially, the high-purity starting chemicals, SiO2, CaCO3, Na2CO3, and P2O5 (all from Merck, Darmstadt, Germany, purity > 98%), were weighed in the proper amounts and then mixed for homogenization. To achieve this, a planetary ball milling system (Pulverisette 7—Fritsch, Pittsboro, NC, USA) was used for 1 h at 300 rpm, using 2 agate vessels and 50 agate balls of 10 mm in diameter in each agate vessel. The number of balls used was chosen following the norms of the used equipment. After this, a calcination process was undertaken at 800 °C, for 8 h, using a heating ramp of 10 °C/min.
Following the calcination, the BG powder and the amount of Fe2O3 (also from Merck, Darmstadt, Germany, purity > 98%) corresponding to 10%mol, were mixed and homogenized using the same planetary ball milling process. Afterwards, the Fe-containing 45S5 Bioglass (BGFe) was melted at 1400 °C for 30 min using a platinum crucible and then quenched to room temperature. The obtained transparent BGFe glass was ground manually using an agate mortar.
Since this study aims to evaluate the influence of the particle size on the magnetic and electric properties, the grounded BGFe was milled in the Pulverisette-7 planetary ball milling, at 500 rpm, using 2 agate vessels of 80 mL and 250 agate balls, with a diameter of 5 mm, in each vessel. Four samples were produced based on the amount of time that they were milled: 1, 12, 24, and 48 h (BGFe_1h, BGFe_12h, BGFe_24h and BGFe_48h, respectively). To guarantee that the samples did not overheat during the milling process, 30 min cycles were selected, with a 10 min break between each cycle.

2.2. Physical Characterization

The differential thermal analysis (DTA) allowed the assessment of the thermal stability range of BGFe while providing information about phase conversion. DTA data were complemented with thermogravimetric analyses (TG), which study the sample weight losses during the heating process. The equipment used was a Hitachi STA 7300 (Hitachi, Tokyo, Japan) and the measurements were carried out under a 200 mL/min Nitrogen N50 (99.999%) atmosphere and platinum crucibles were used. The analysis was performed from room temperature up to 1200 °C with a heating rate of 5 °C/min.
A structural analysis was conducted using X-ray powder diffraction (XRD) and Fourier-transform infrared spectroscopy (FTIR). The XRD diffractograms were acquired in an Aeris Panalytical equipment (Malvern Panalytical Ltd., Malvern, UK), running at 40 kV and 15 mA, using CuKα radiation (λ = 1.54056 Å). The 2θ range used was 10° to 60°, with a step of 0.002. FTIR spectroscopy provides information about the vibration between the bonds of the atoms or molecules. To perform this analysis, pellets containing a mixture of the BGFe powder and potassium bromide (KBr) were made for each milled sample, at a ratio of 200 mg of KBr to 1 mg of BGFe. A Bruker Tensor 27 FT-IR spectrometer was used, with a resolution of 4 cm−1, a total scan of 128, in the spectral range from 1300 cm−1 to 400 cm−1.
The morphological analyses were performed using the scanning electron microscope (SEM) Vega 3 TESCAN (TESCAN, Brno, Czech Republic). To improve the surface conductivity, all the samples were sputtered with carbon. Energy-dispersive X-ray spectroscopy (EDS) measurements were also performed to qualitatively analyze the relative elements of each sample. The Bruker EDS system coupled to the microscope was used to analyze several regions of the samples using a square scanning area of 100 μm × 100 μm.
To study the particle size and distribution, a HORIBA Scientific LA- 960V2 analyzer (HORIBA Ltd., Kyoto, Japan) was used. This method requires the use of 2 laser lights: a blue one with a wavelength of 405 nm, and a red one with a wavelength of 605 nm. Each sample was dispersed in distilled water and a quartz cell was used for the measurements.
Regarding the electrical analysis, the complex impedance ( Z * ) of the samples was measured in the frequency range from 0.01 Hz up to 1 MHz, using a Solartron Analytic Modulab Xm (AMETEK, Berwyn, IL, USA) connected to a Linkam stage model HFS91, where the temperature of the samples was kept constant at 37 °C.
The magnetic properties of the samples were evaluated using a Vibrating Sample Magnetometer (VSM) from Cryogenic (Cryogenic Ldt, London, UK). Using this method, it was possible to study the magnetic susceptibility and hysteresis as a function of the temperature (5 K up to 300 K) [16].

2.3. Biological Characterization

The cytotoxicity and bioactivity assays were performed to confirm if it is safe to use the BGFe produced in the organism. The cytotoxicity of the samples was studied, according to the standard “ISO10993-5 Biological evaluation of medical devices—Part 5: Test for in vitro cytotoxicity” [17] using the extract method and human osteosarcoma cell line (Saos-2). The incubation of the seeding was performed for 24 h at 37 °C with a 5% CO2 atmosphere, using a density of cells of 30 kcel/cm2. All the samples were sterilized (120 °C for 2 h) and each sample was incubated for 24 h at 37 °C in McCoy 5A medium to create the extract with a concentration of 100 mg/mL. All the extracts were filtered using a 0.22 μm millipore filter. For this study, extracts were produced at 100, 50, 25, and 12.5 mg/mL. Positive control was formed using cells in a cytotoxic environment created by adding 10% dimethyl sulphoxide (DMSO), and negative controls were viable cells. The cell viability was evaluated using the resazurin method and UV-Vis spectroscopy at wavelengths of 560 nm and 600 nm was performed.
The bioactivity test was assessed according to the standard “ISO 23317—Implants for surgery—In vitro evaluation for the apatite-forming ability of implant materials” [18]. The assay was performed on 7 mm diameter pellets and immersed in a simulated body fluid (SBF) for 12, 24, 48, 96 and 336 h at 37 °C, under stirring. The SBF solution was changed every 2 days. After SBF immersion, the pellets were evaluated by SEM-EDS.

3. Results

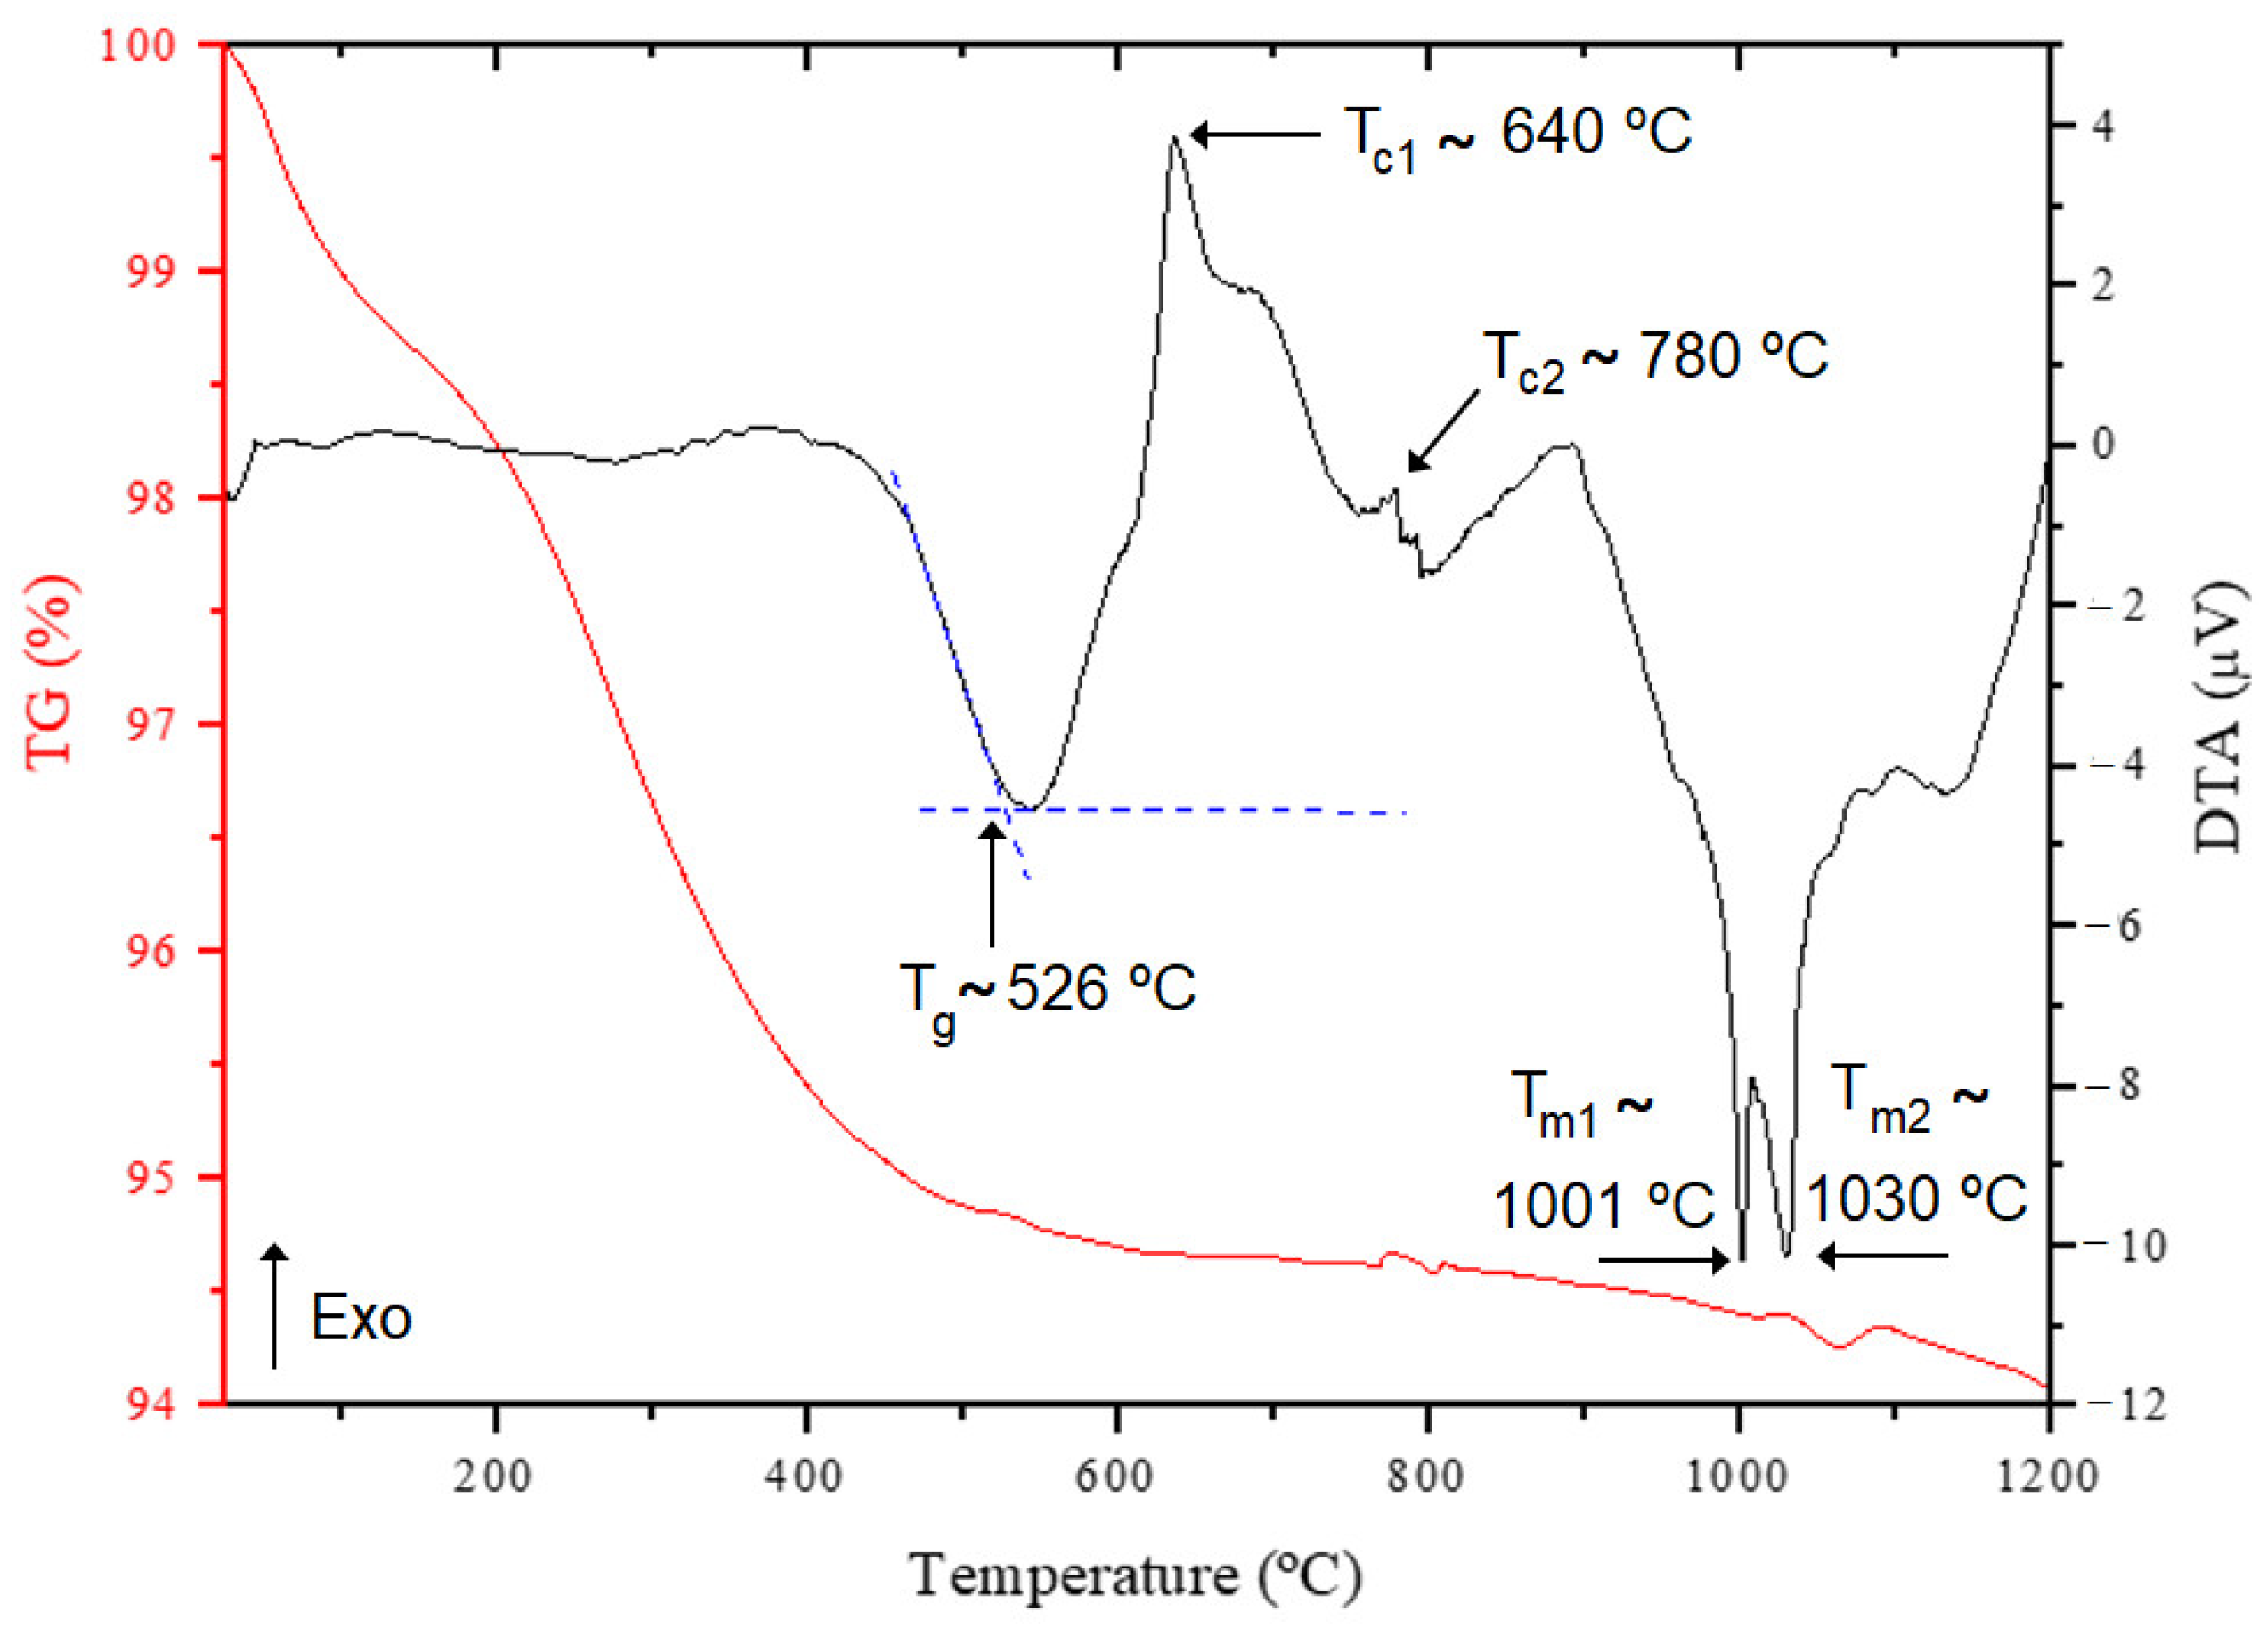
3.1. Thermal Analysis

Figure 1 shows both DTA and TG characteristic patterns of the BGFe Bioglass. The TG profile shows a total weight loss of 5.9%, and it is possible to identify two main loss events. The first mass reduction, ranging from 43 °C to 155 °C, and the second, ranging from 206 °C to 548 °C, can be associated with the release of free water and OH groups present in the sample, respectively [18]. The DTA spectrum shows an endothermic phenomenon centered at a temperature of 526 °C, which is related to the glass transition temperature (Tg). The endothermic peak associated with the Tg is followed by an exothermic peak at the temperature of 640 °C (Tc), which can be related to the formation of crystalline phase(s). Between the temperatures of 1001 °C and 1030 °C are notable two endothermic peaks. These peaks are related to the melting temperature (Tm) of the glass, and the fact that there are two of these phenomena can indicate the melting of two different phases [18]. These results allow us to verify that the addition of the Fe2O3 promotes a shift in the melting temperature (~175 °C) to lower temperatures compared to Bioglass 45S5 [19]. The addition of 10 mol% of Fe2O3, acting as a network modifier, promoted the interruption of the typical bonding between network formers and oxygen, creating non-bridging oxygens (NBO). As a result, glass network modifiers normally affect glass properties, promoting a decrease in the melting point [20,21,22,23,24].

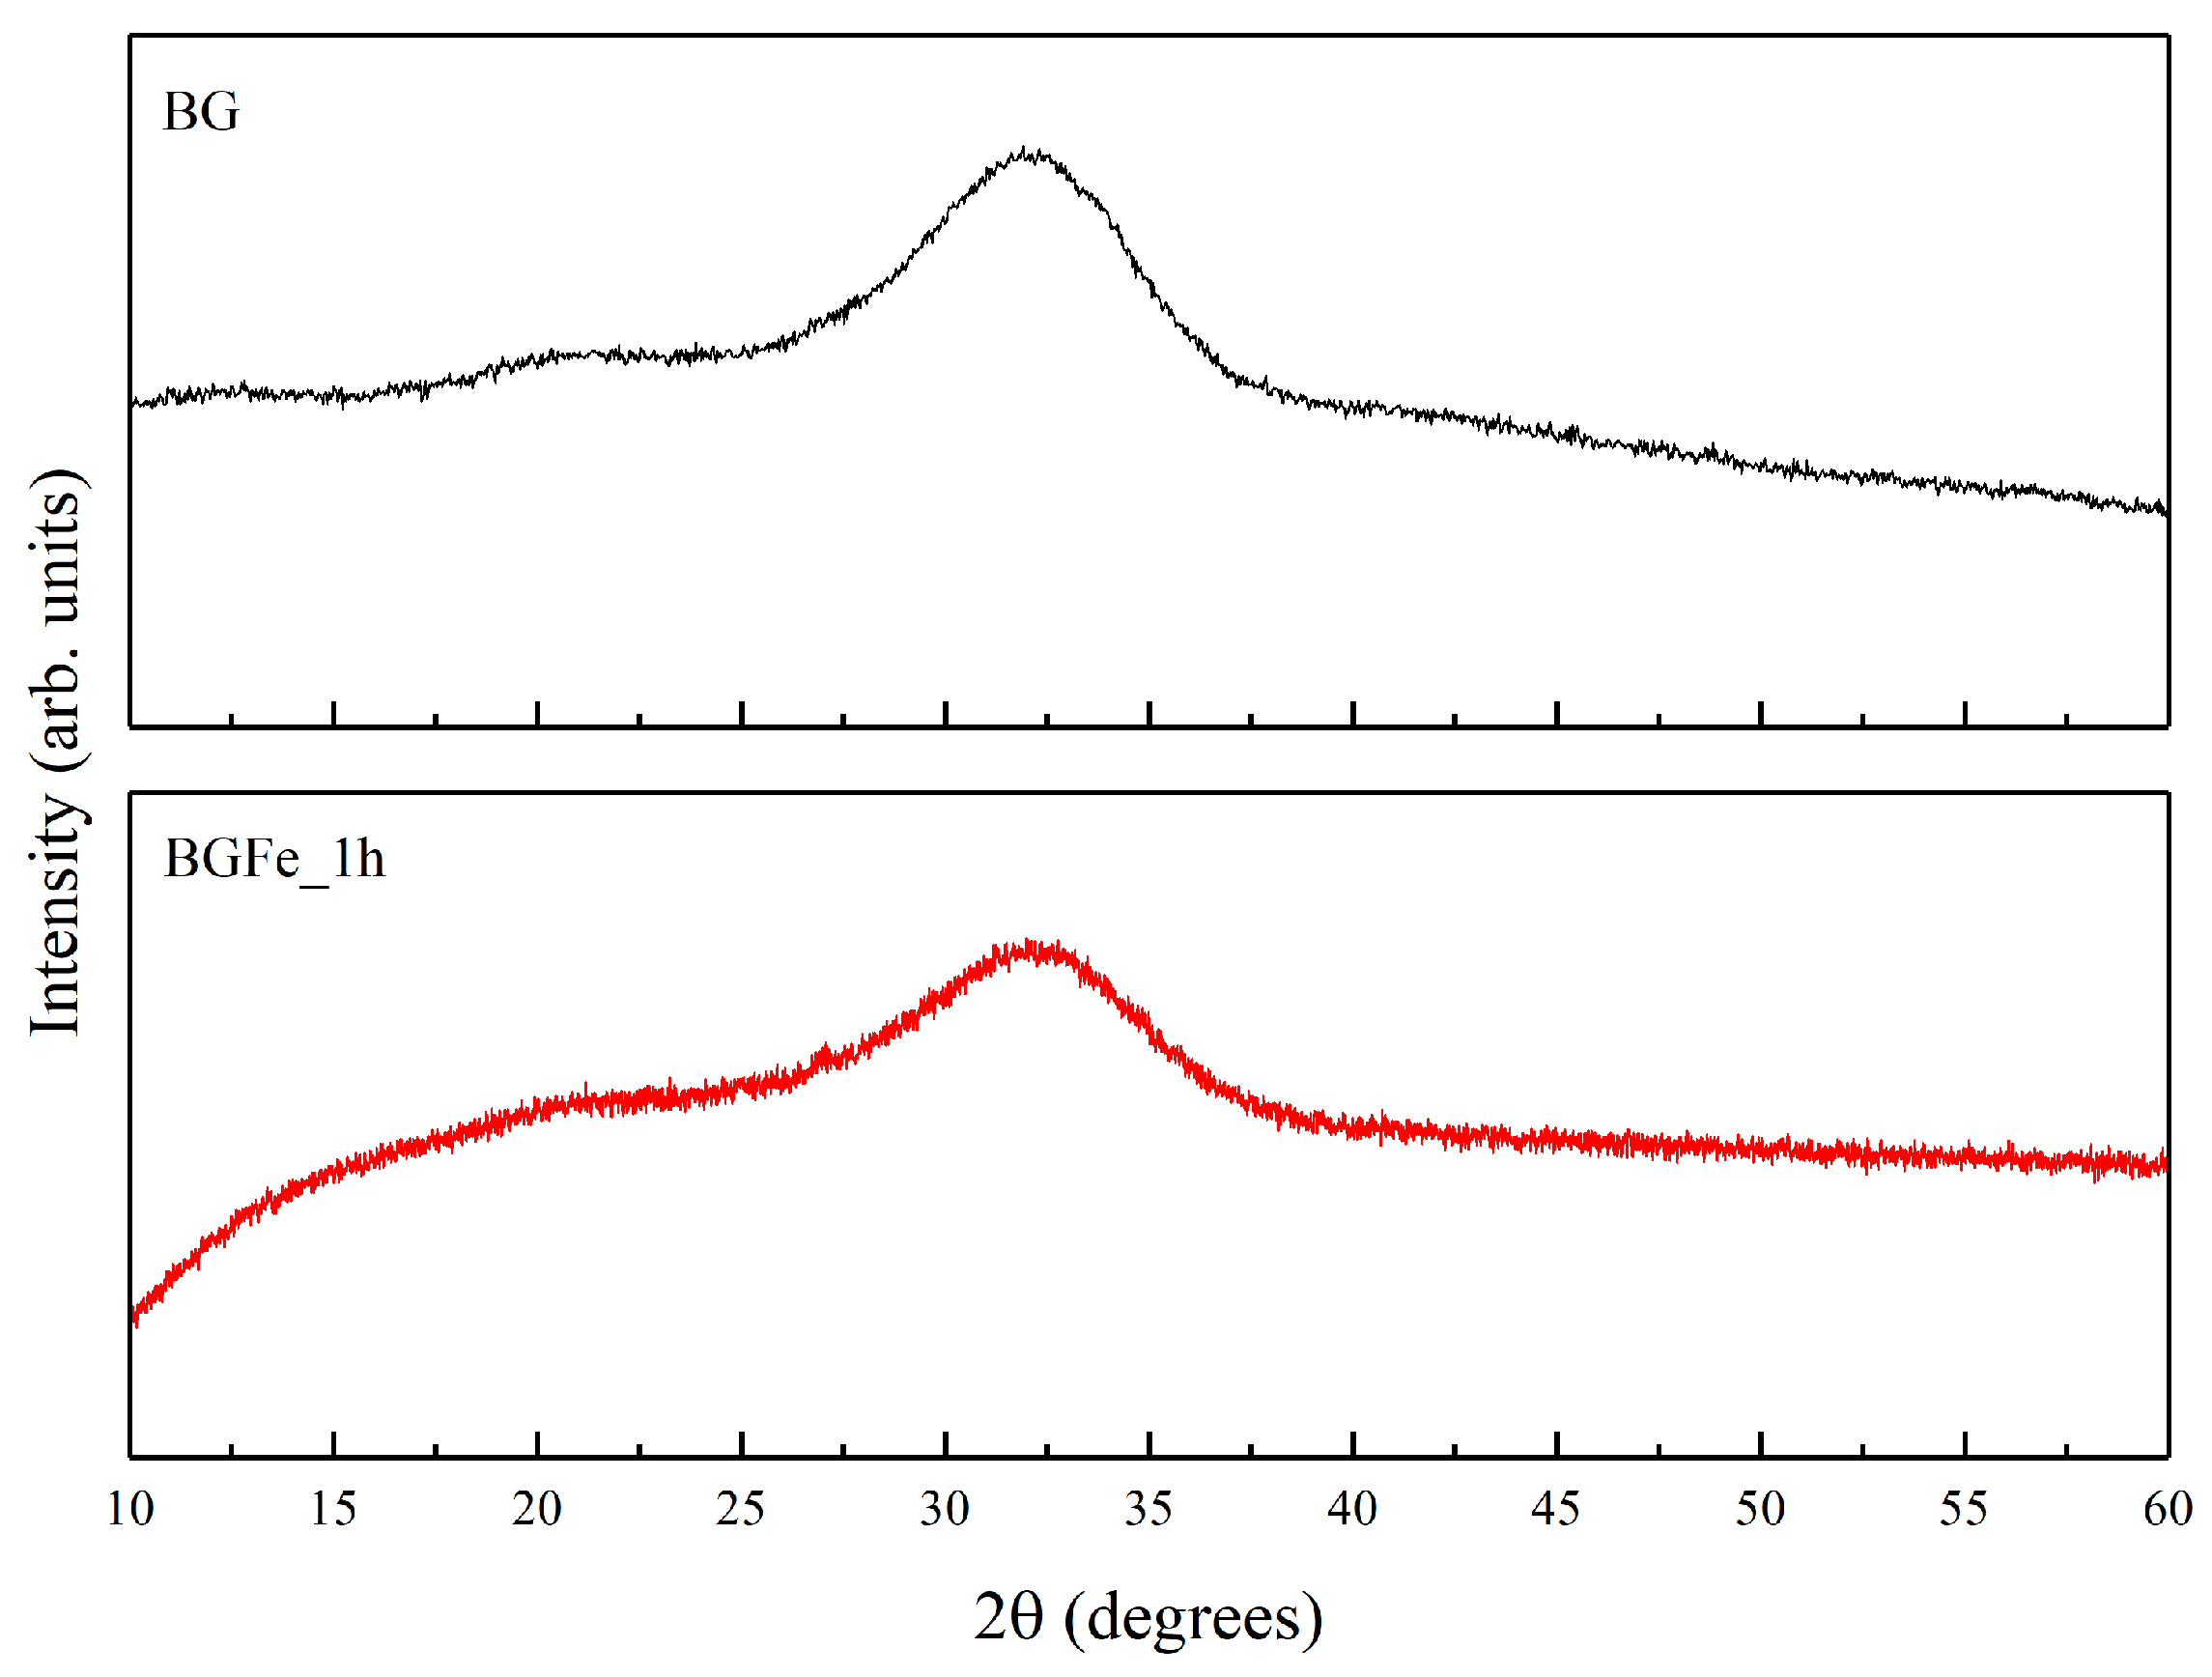
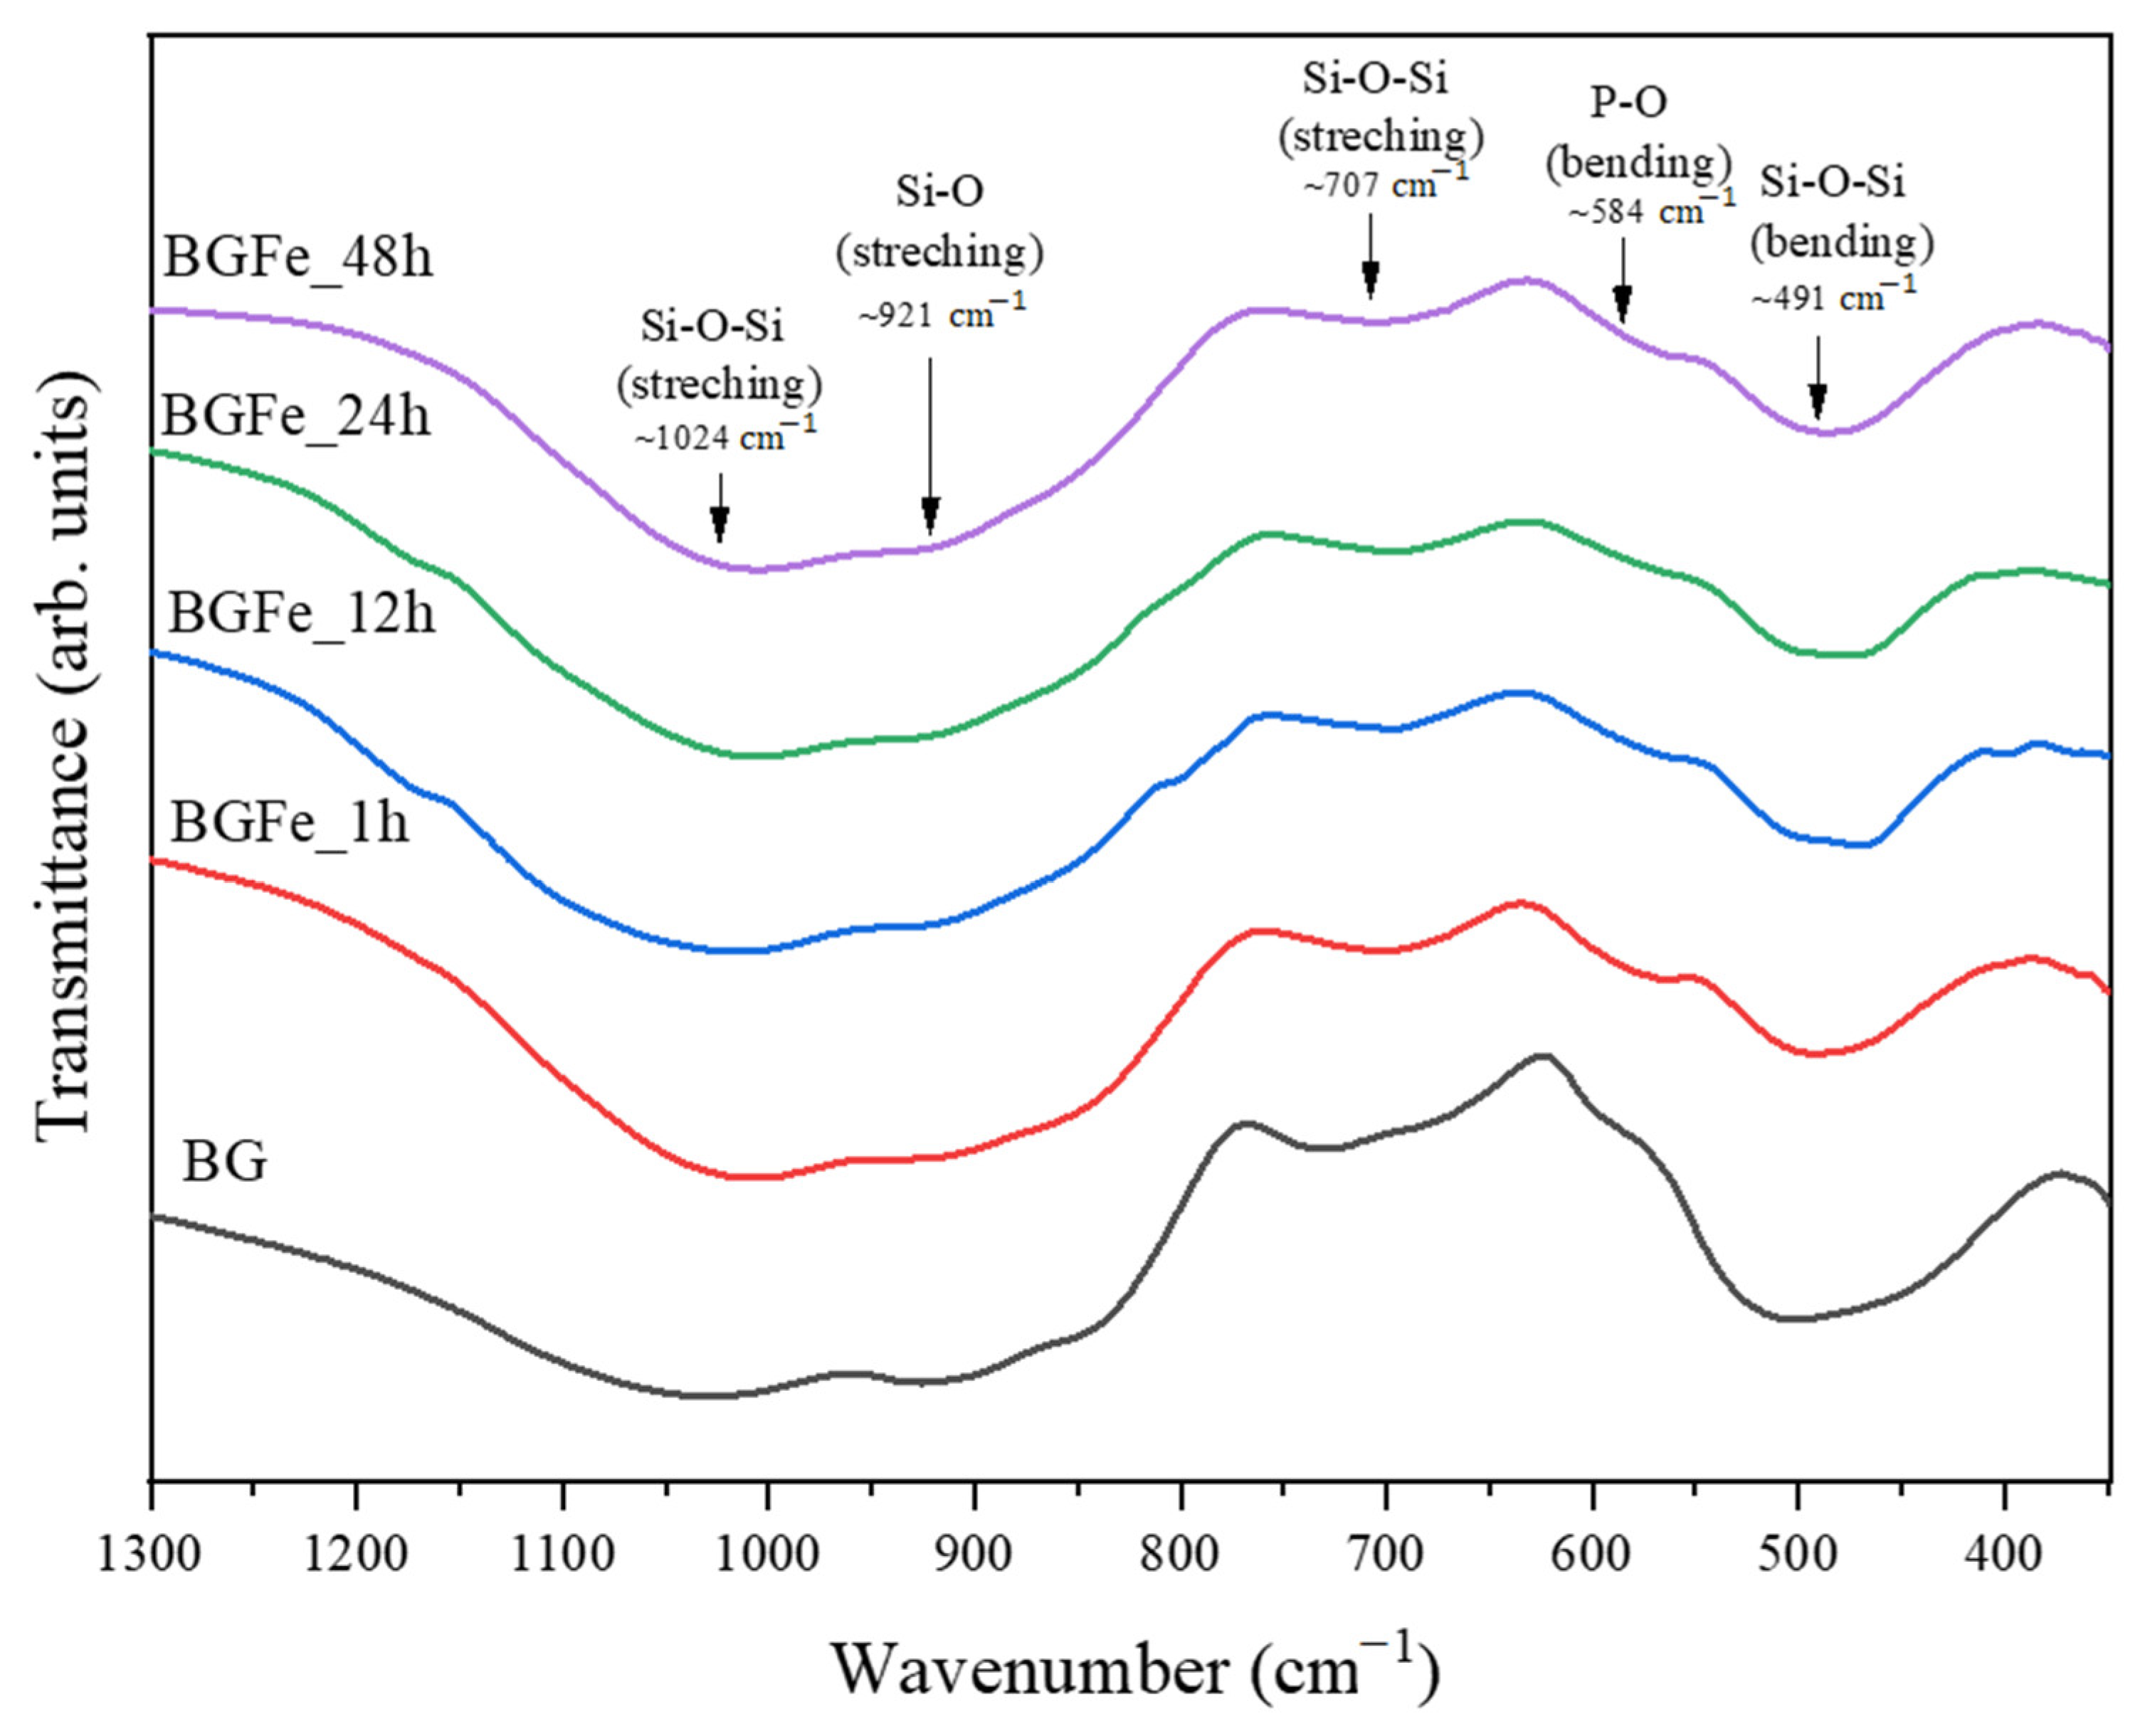
3.2. Structural Analysis

Figure 2 shows the XRD patterns of BG and BGFe_1h. Analyzing the two graphs, the characteristic band of the amorphous bioactive glass is visible, in this case with 2θ between 26° and 36° approximately, in both samples [20,21]. The insertion of 10 mol% of Fe2O3 into the BG network did not show any peak associated with a crystalline phase, showing identical structural properties to Bioglass 45S5. This means that the bioglass has an amorphous structure in which the ion iron is inserted, and also shows that the melt-quenching method allows homogeneous glasses to be obtained with the iron embedded in the amorphous glass network.
The FTIR spectra of the BG and BGFe samples are shown in Figure 3. The similarities to the characteristic absorption bands of the BG sample are observed. In agreement with XRD results, the addition of Fe2O3 did not promote any changes in the original structure of the 45S5 Bioglass. These bands can be observed at the following wavenumbers: 1024, 921, 707, 584 and 491 cm−1. The vibrational modes that occur at 1024, 921 and 707 cm−1 are, according to the literature, related to the stretching modes of Si-O-Si, the Si-O symmetric stretching mode of bridging oxygen atoms between tetrahedrons, Si-O-Si stretching of non-bridging oxygen atoms and Si-O-Si asymmetric stretching of bridging oxygen atoms within the tetrahedron, respectively. The peak at 584 cm−1 represents the chemical bond P-O and the peak at 491 cm−1 represents the bending of Si-O-Si [22,25,26,27].

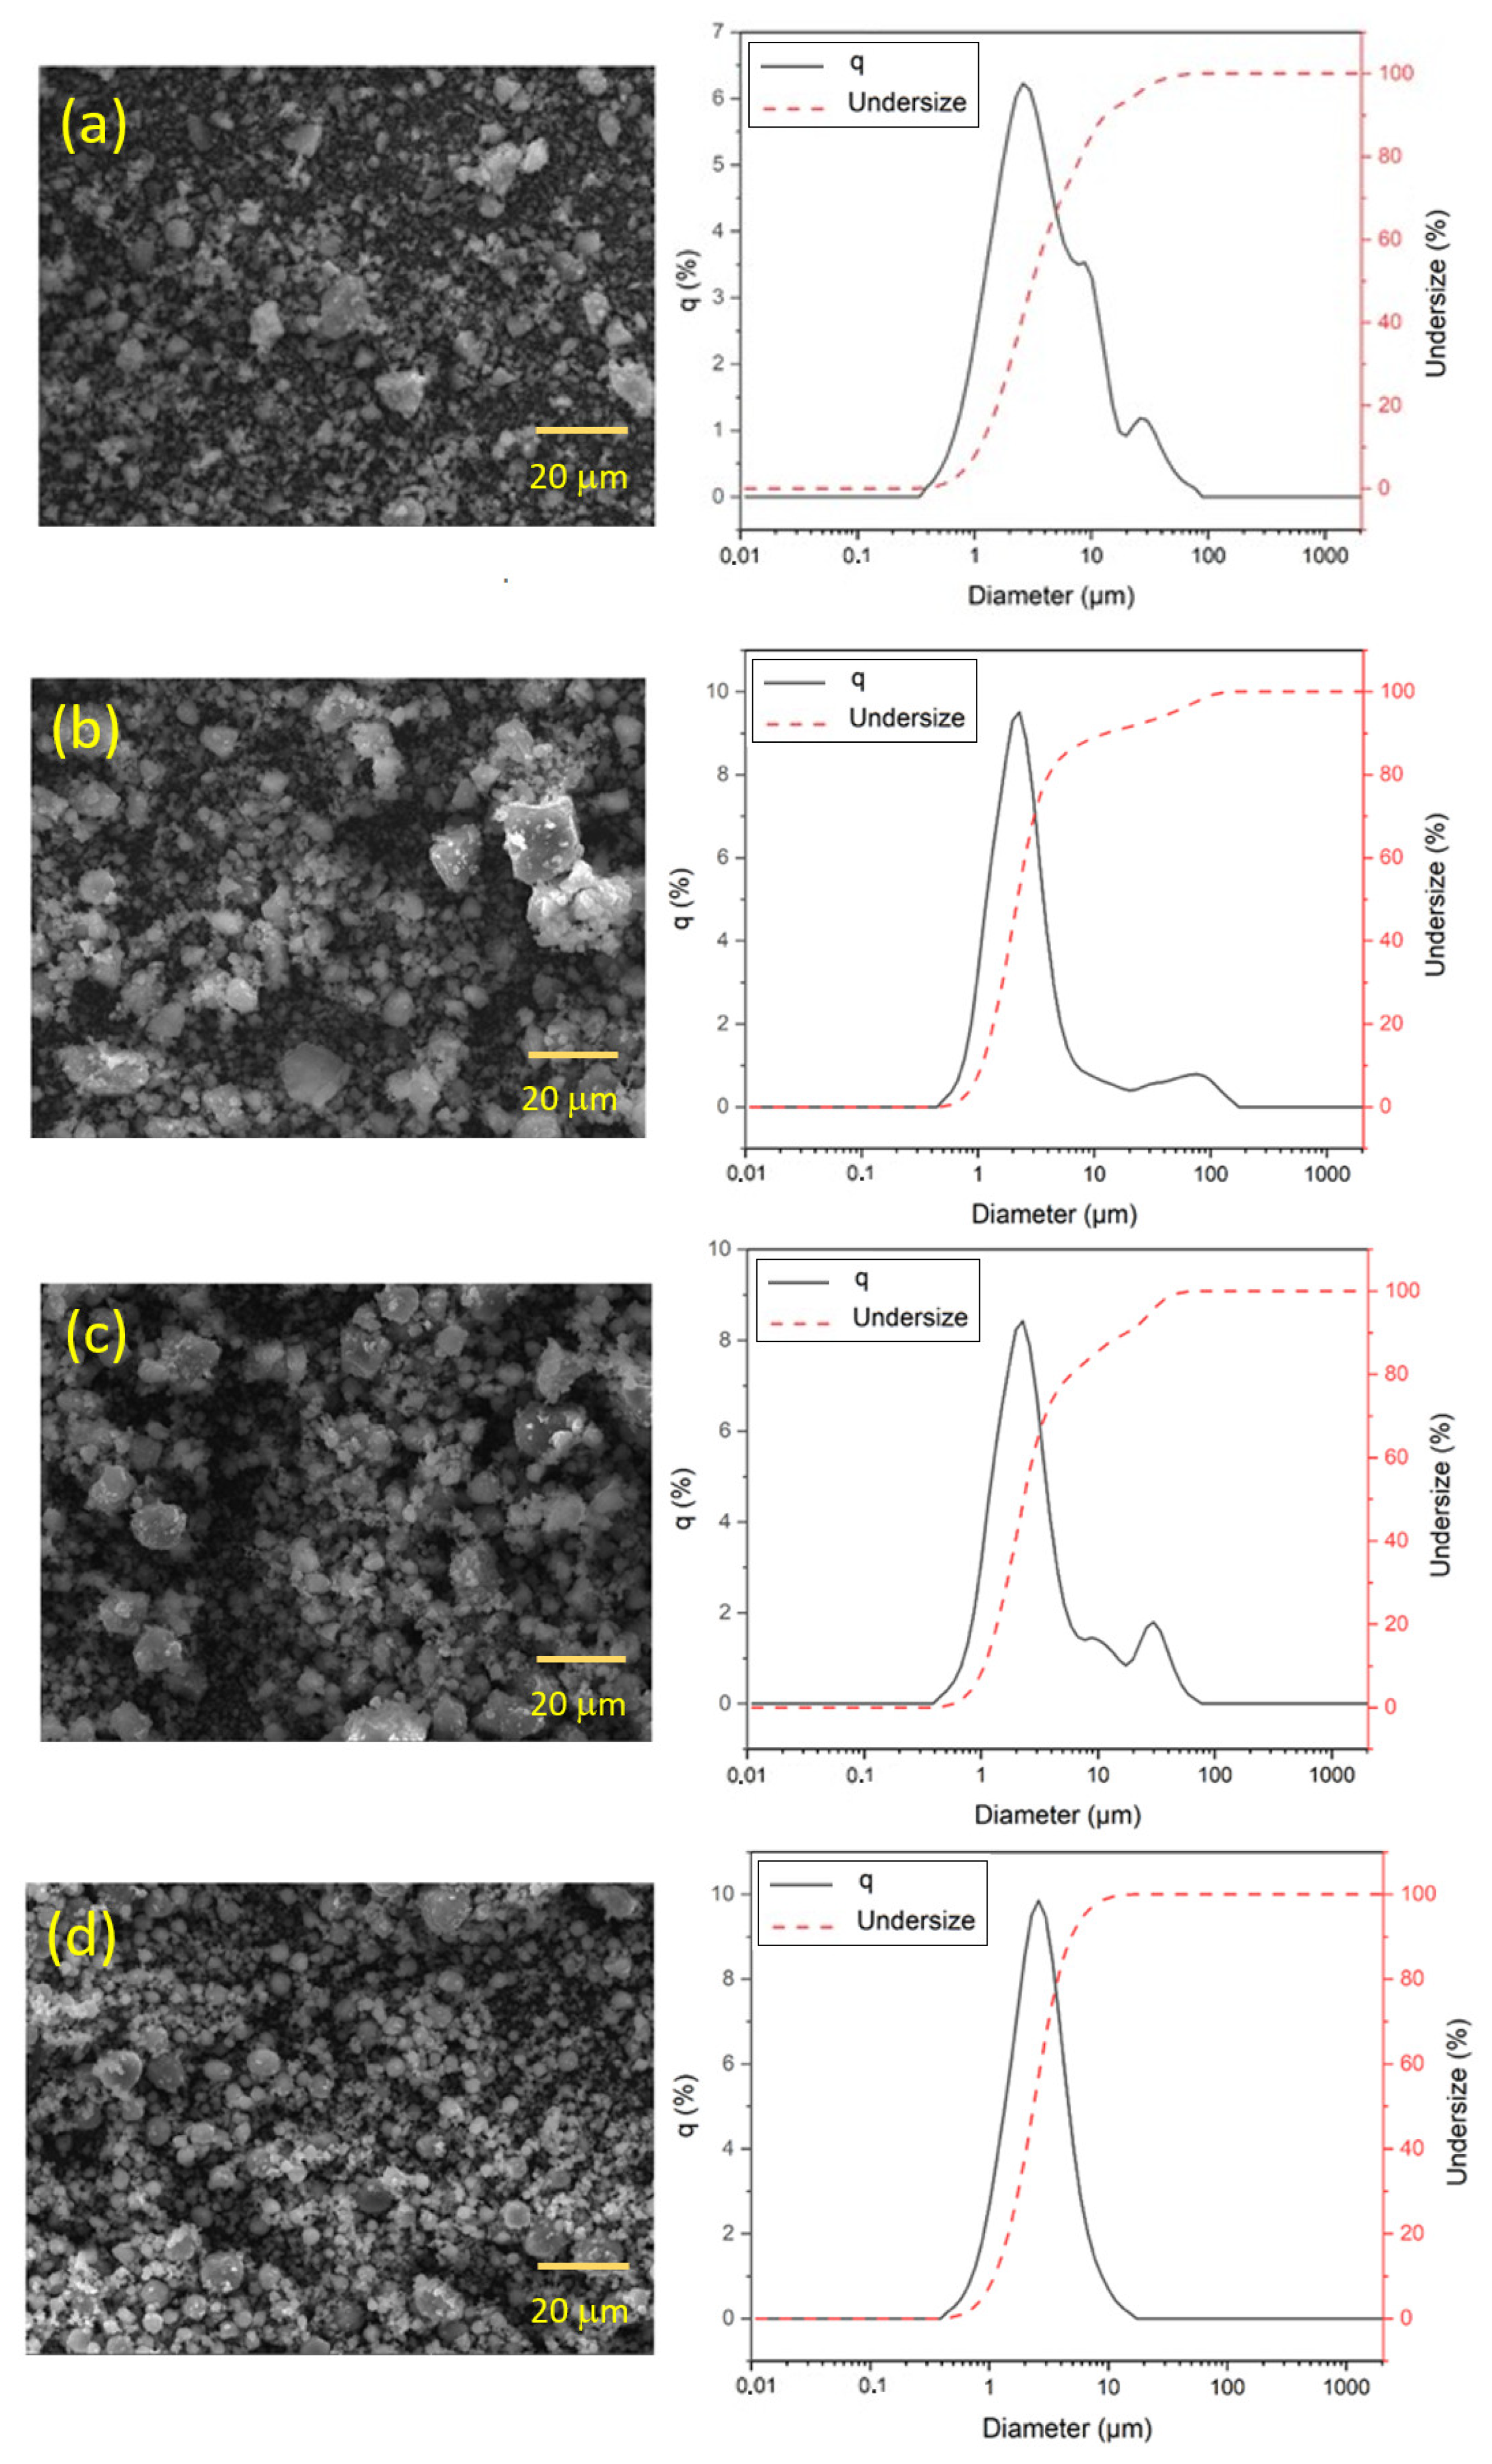
3.3. Morphological Analysis

The SEM images and the size distribution results are presented in Figure 4, showing the morphological differences between all the samples. As the grinding time increases, the BGFe particle size becomes more uniform since the particles’ sharp edges start to soften, giving them a spherical appearance, and their sizes become more evenly distributed. In the sample BGFe_1h, a higher distribution of the particle’s size is visible, as expected and in agreement with SEM images. With the rise of the ball milling time, the particle’s size became more uniform, as demonstrated by the Gaussian curve, which is narrower in the sample BGFe_48h. When comparing all the samples, it is possible to observe that the size distribution of the particles becomes narrower, and the larger particles are replaced by smaller ones. This transition is especially clear in the graphics of the BGFe_24h and BGFe_48h samples.
The ImageJ program was used to measure the particle mean size; for each sample, 150 measures were taken [28], and the results are shown in Table 1. The results confirm the presence of a broad particle size distribution in BGFe_1h and, in agreement with the granulometry results, the particle size decreases with the ball milling time.

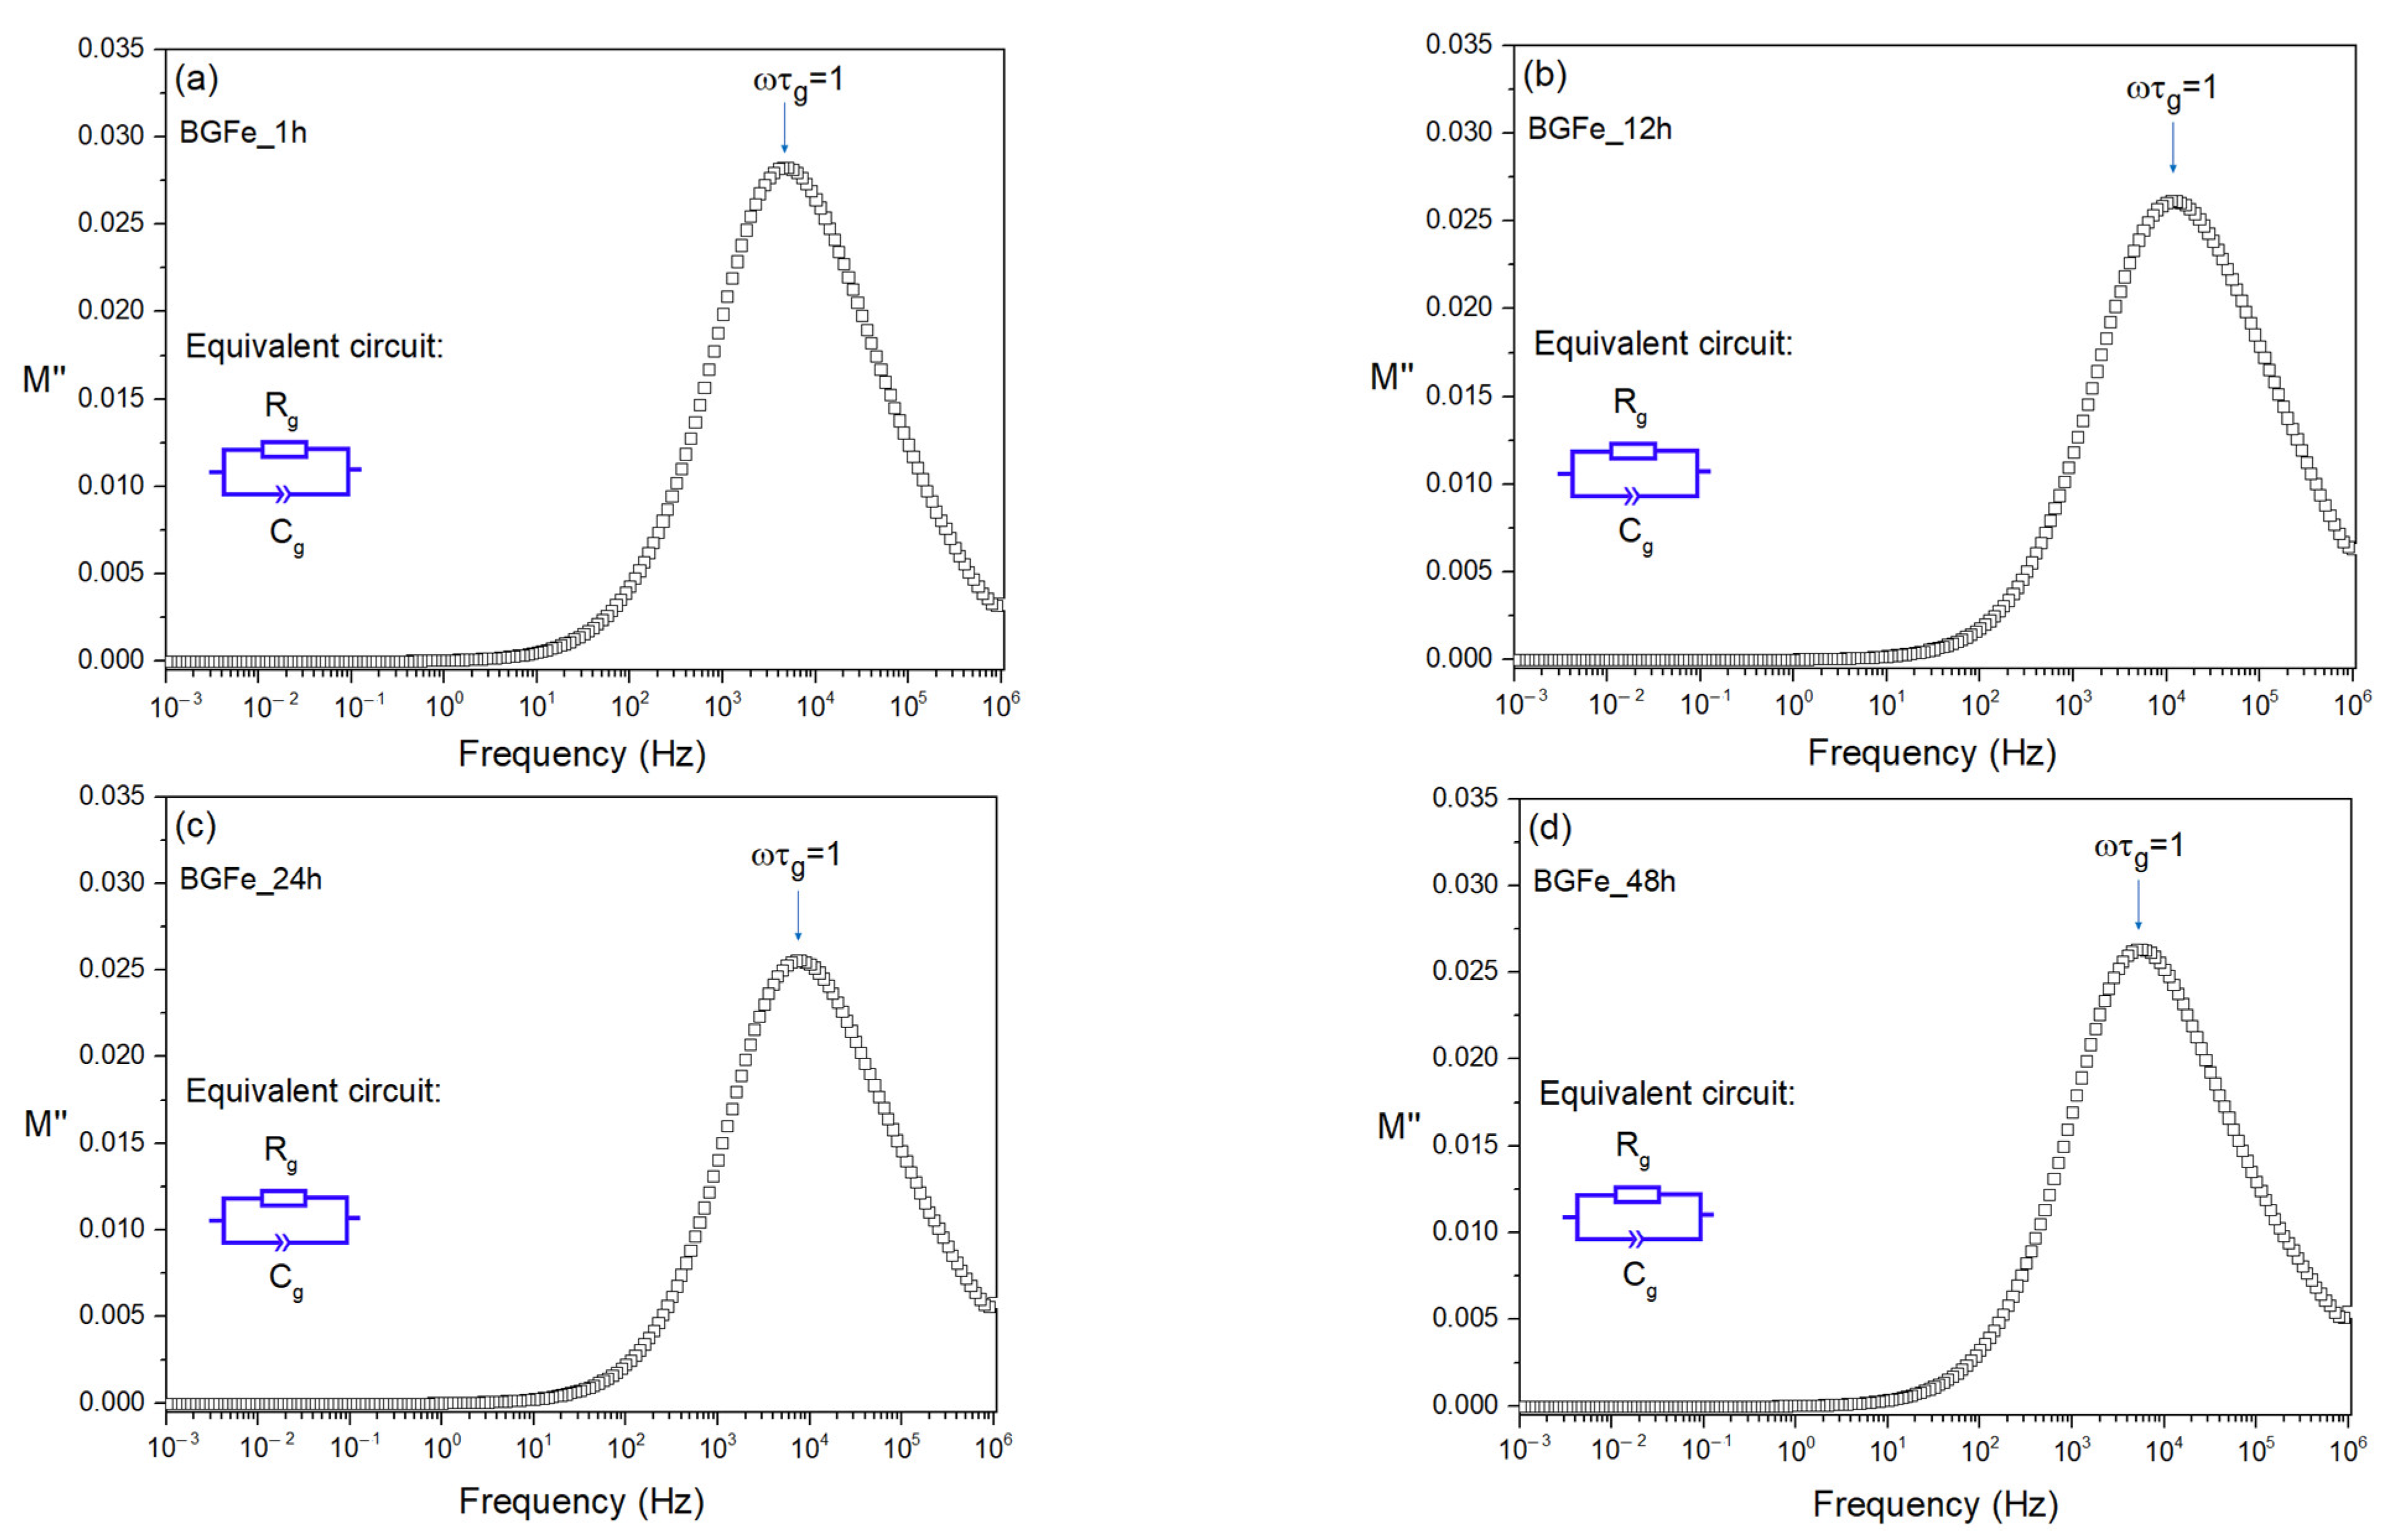
3.4. Electric Properties Analysis

Figure 5 shows the imaginary part of the dielectric modulus, M″ [13,14], as a function of the frequency. The imaginary part of the dielectric modulus can be obtained through the real part of the impedance, Z’, using the relation:
M = ω Z C 0 = ω Z A ε 0 d
where ω represents the angular frequency, d the sample thickness, A the electrode area and ε0 the empty space permittivity [13,14,29,30].
In all the samples, one single peak is visible in the high-frequency region, representing the grain polarization phenomena. The single relaxation phenomenon can be adjusted to the equivalent circuit composed of a parallel combination of a resistor and a constant-phase element, as shown in the inset.
The relaxation time, τ, can be inferred in each peak using the formula
ω m a x τ = 1
with
ω m a x = 2 π f m a x
being fmax the peak frequency.
The relaxation time can be defined in terms of resistance, R, and capacitance, C, by:
τ = R C   τ g = R g C g
where τg, Cg and Rg are the relaxation time, the capacitance and the resistance of grain, respectively. The capacitance values are determined using the M″ vs. frequency plots due to the relation [28,29]
M = C 0 2 C
The calculated capacitance and resistance values due to the grain effect are listed in Table 2.
The analysis of the values registered in Table 2 shows that the resistance and capacitance values are very similar for all samples. The resistance value can be related to the kinetics of the possible electro-Fenton reaction and, according to the obtained data, the BGFe_12h sample should present an EF kinetic that is 2.41, 1.21 and 1.58 times higher than the BGFe_1h, BGFe_24h and BGFe_48h samples, respectively. Moreover, compared to the Fe-free 45S5 glass reported by [31], the BGFe_12h sample could increase the standard rate constant of EF reaction by up to almost 20,000 times.

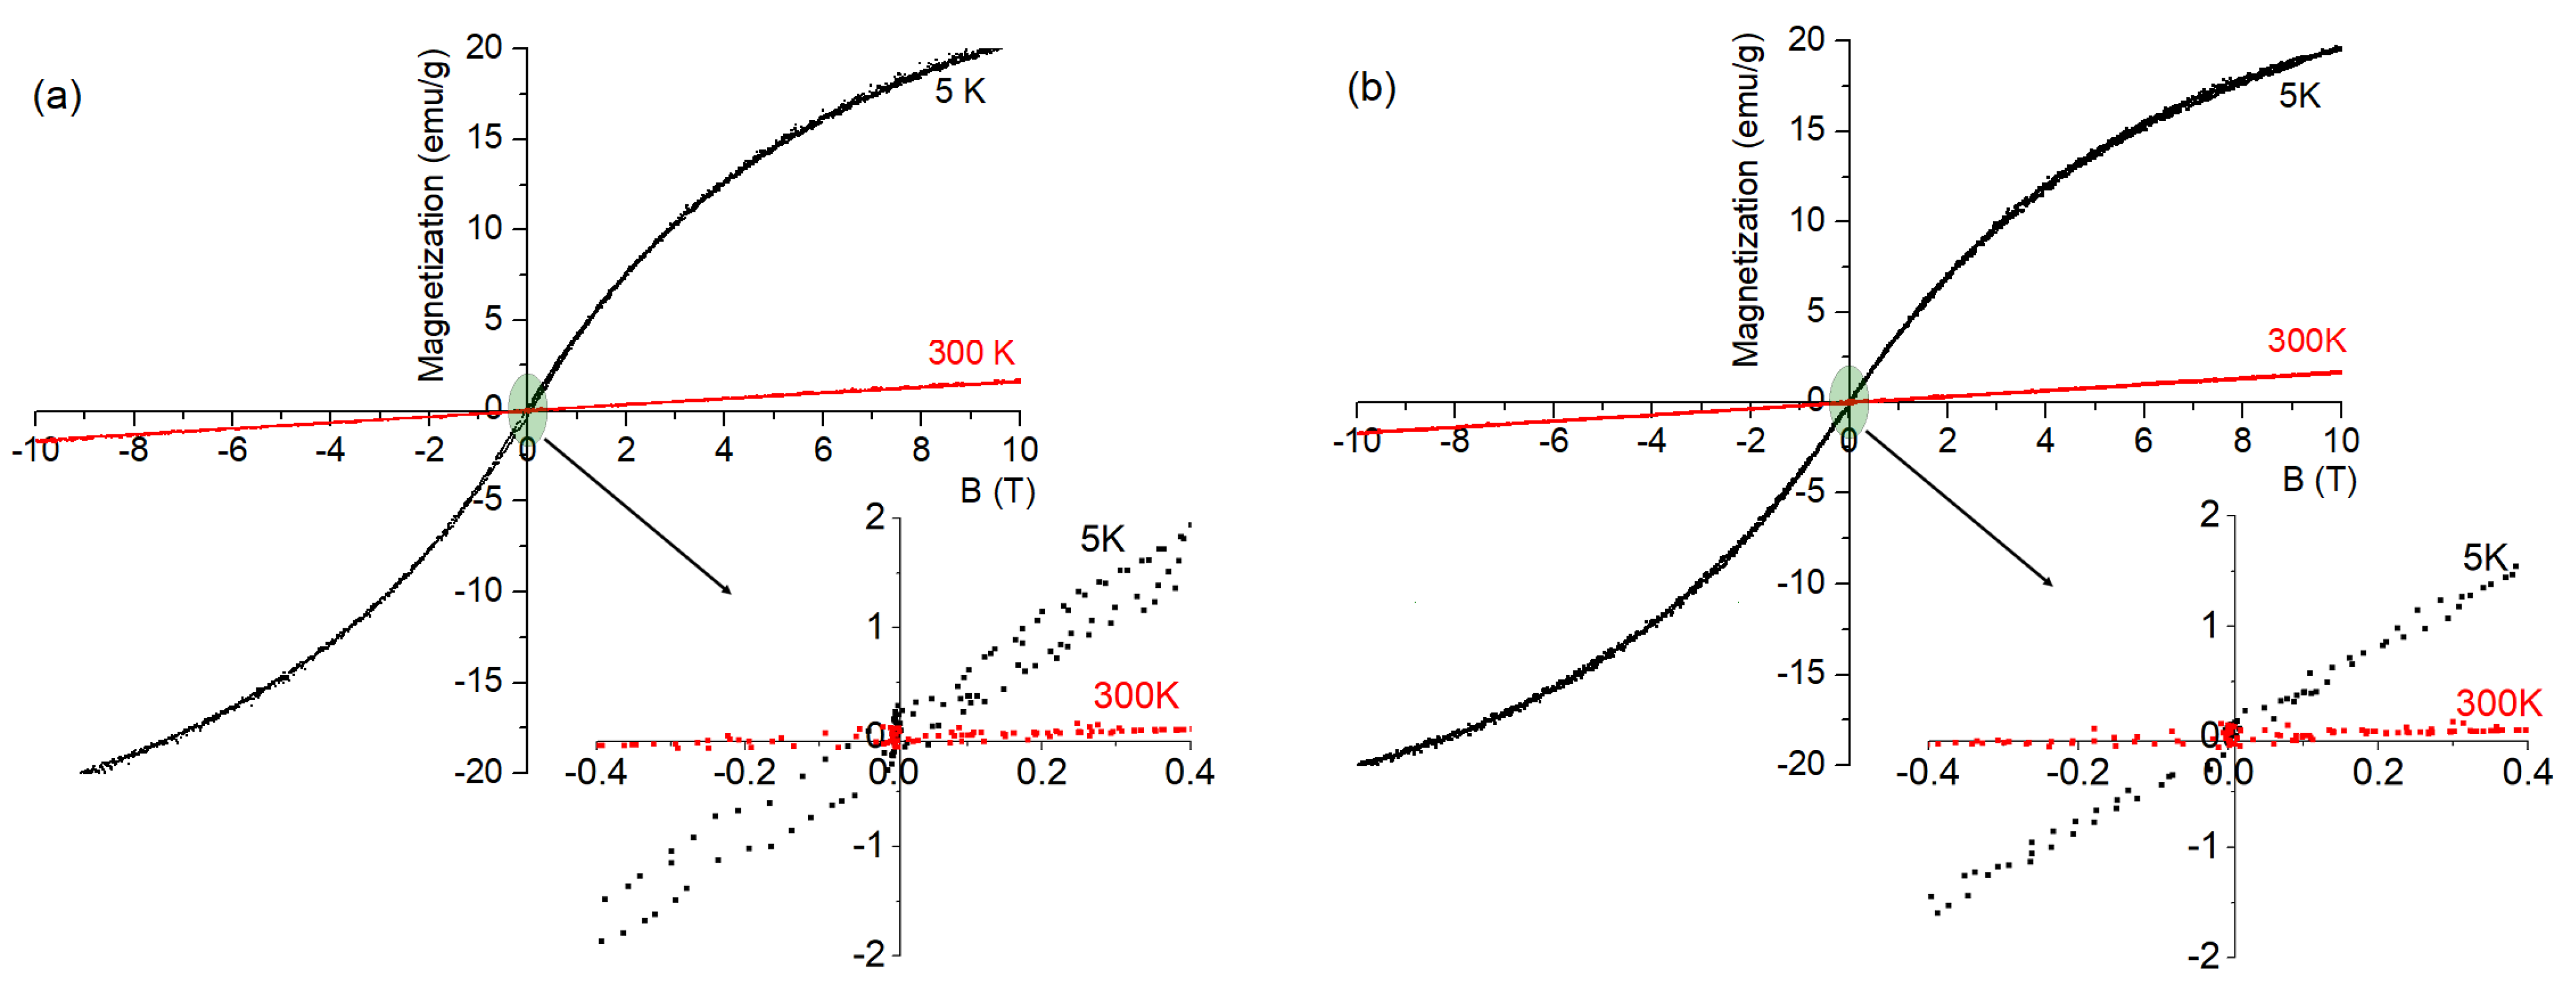
3.5. Magnetic Properties Analysis

Figure 6 shows the magnetization of the samples BGFe_1h and BGFe_48h. The results obtained are similar in all the samples, allowing the samples to be characterized as paramagnetic, meaning that their properties are not influenced by the application of an external magnetic field. Despite the elevated magnetic field that was applied to the BGFe samples, 10 T, neither one of them showed any signs of saturation, always displaying an almost linear behavior between the magnetization and the magnetic field applied, as shown in the inset of each one of the graphics. This type of relation is characteristic of paramagnetic materials. Due to the low levels of hysteresis, the specific absorption rate (SAR) was not evaluated, since the graphics of magnetization allowed us to conclude that neither of the samples was superparamagnetic.
The concentration of Fe was the same in all the samples, which explains the similar maximum value of magnetization in both of them. The lack of saturation in the graphics leads to the conclusion that, after being incorporated into the matrix of the BG, Fe ions present a solid solution, occupying the “empty structural spaces” of the glass matrix, which results in an elevated separation between the Fe ions, naturally blocking the interaction between them.
The BGFe produced was intended to be used as a cancer treatment through magnetic hyperthermia. In order for this to be possible, the material should reveal a superparamagnetic behavior, meaning that the values of the coercive field and the reminiscent magnetization should be negligible. This behavior was not observed. Instead, magnetic hysteresis was revealed, which should be related to the particle size and therefore is not suitable for a controlled thermal behavior activated magnetically [32,33].

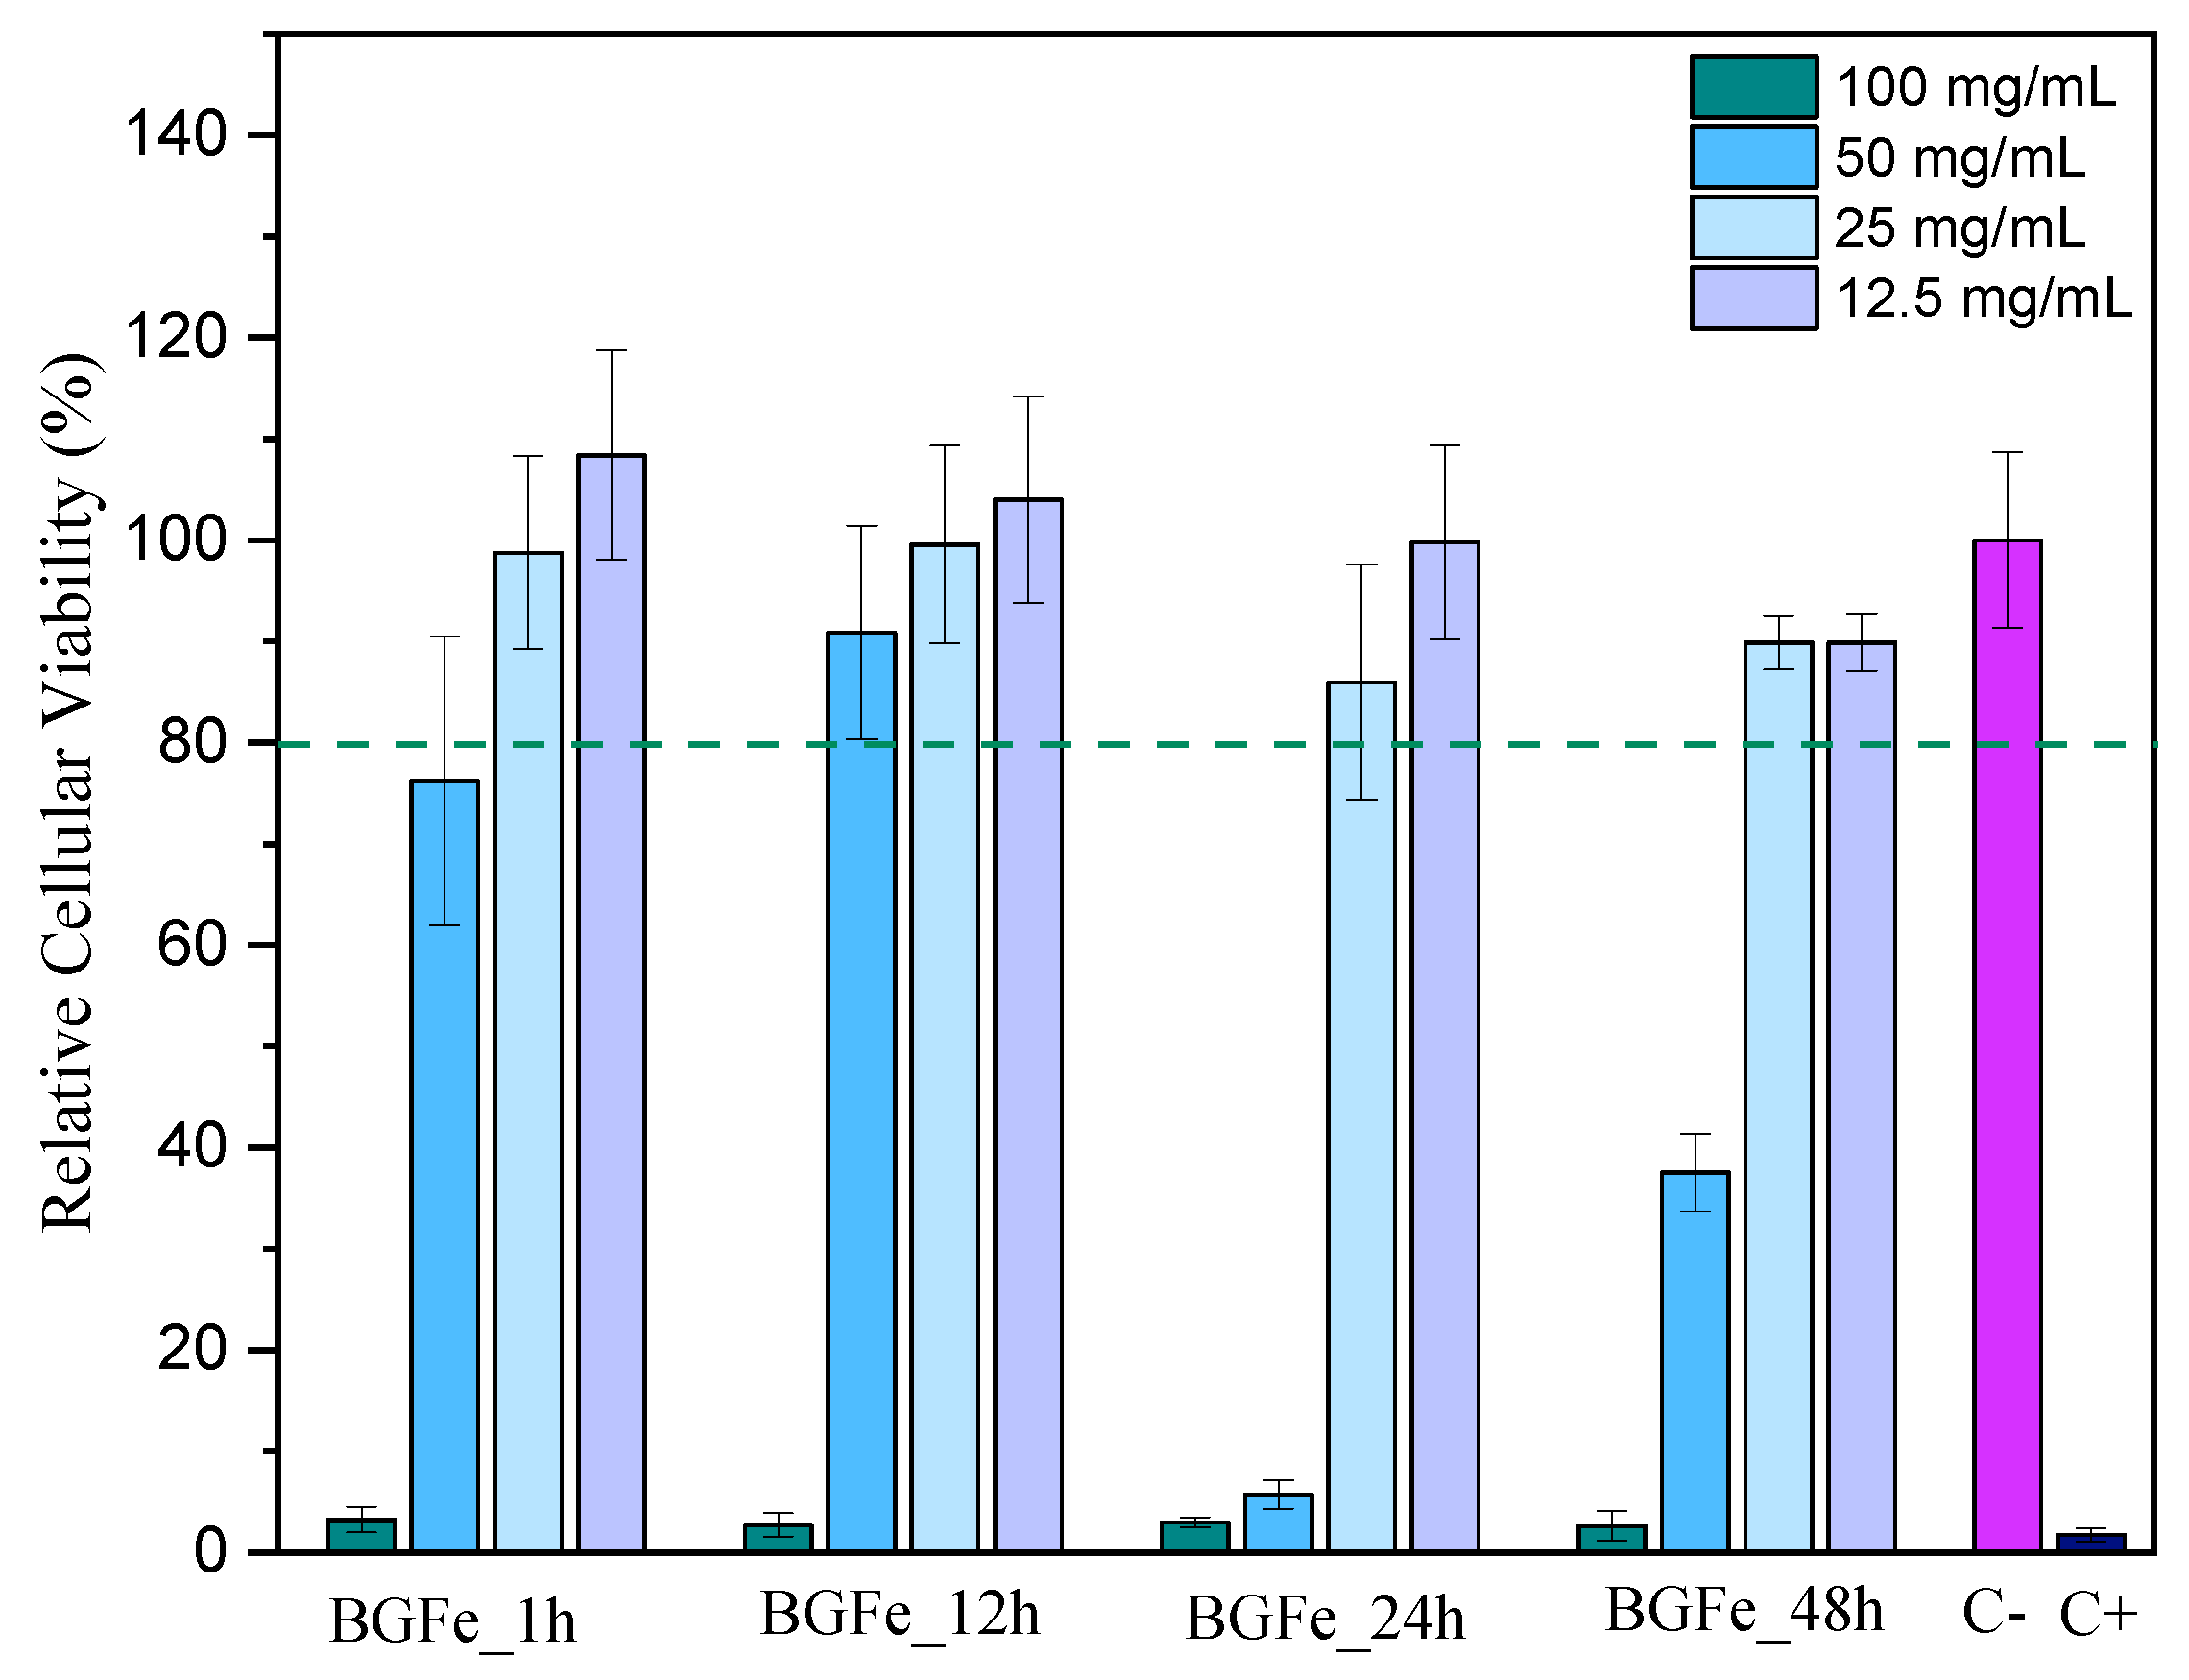
3.6. Biological Analysis

Figure 7 shows the results of cell relative viability for several concentrations of BGFe extract, in which six statistical replicates were performed. The data obtained for all samples with concentrations of 12.5 and 25 mg/mL showed cell viability higher than 80%, which means that the samples are not cytotoxic [34]. At 100 mg/mL and 50 mg/mL, the samples BGFe_24h and BGFe_48h are the most cytotoxic, revealing relative cell viability below 40%. This cytotoxic behavior should be related to the increase in the surface area promoted by the particle size decrease, allowing greater contact with the cells, since the sample BGFe_1h presents similar results to the BG sample, merc, without iron [35]. The BGFe_48h can still be used in biological applications at lower concentrations, 12.5 mg/mL and 25 mg/mL, without any negative effects on organisms.
Figure 8 presents the changes in the content of the ions on the surface of the sample after SBF immersion for 12, 24, 48, 96 and 336 h, evaluated via EDS, and the corresponding Ca/P ratio.
The formation of a hydroxyl carbonated apatite (HCA) layer starts with the ionic exchange between Na+ and Ca2+ cations with H+ presented in SBF, leading to the destruction of the silica glass network and the formation of a silica gel layer that will allow the deposition of Ca and P, resulting in the HCA layer. Therefore, it is expected that the concentration of Ca and P will increase due to the formation of the HCA, and the concentration of Na, Si, and Fe will decrease, since these elements are released into the medium [36,37].
The ability of a material to form the HCA layer can be evaluated by studying the ratio of Ca/P, since this relation dictates the formation of the bone growth, and it is expected that this ratio decreases as the immersion time increases. The molar ratio of Ca/P in human bones is 1.67, meaning that it is expected that the ratio of Ca/P will reach this value [38,39,40].
By analyzing the results, it is possible to observe that adding Fe2O3 to the BG composition influences its bioactivity, retarding the formation of the layer rich in Ca-P. This is not necessarily a disadvantageous characteristic, since a slower rate of osteointegration increases the mechanical properties of the bioglass because it is crucial that the rate of degradation corresponds to the cellular and bone formation processes that this implicates [6].
When the various samples are compared, it can be assessed that the sample BGFe_48h shows better bioactivity than all the others, revealing an increase in bioactivity between the times of immersion of 24 and 48 h. The difference between the samples’ behavior is justified by the size of the particles; since BGFe_48h has minor particles, it can react easily with the SBF. It is also noticeable that the Ca and P percentages tend to stabilize between the immersion times of 96 and 336 h, with the Si percentage being close to zero at 336 h of immersion, being this sings that the layer rich in Ca-P is almost formed [41]. The sample BGFe_24h, in the interval of 96 and 336 h of immersion, starts to show some evidence of bioactivity, showing a ratio of Ca/P close to the sample BGFe_48h.
It is important to analyze the dissolution rate of the Fe, which, when immersed in SBF, exhibits different behaviors in the different samples. The samples BGFe_1h and BGFe_12h show an insignificant change in concentration when immersed in SBF, presenting similar values after 12 and 336 h of immersion, meaning that in these samples, the chemical reaction that promotes bioactivity and the release of Fe into the medium does not occur. On the other hand, samples BGFe_24h and BGFe_48h exhibit a significant change in the atomic percentage of this ion, revealing a decrease in its content between the times of immersion of 48 and 336 h, showing that Fe was released into the medium.
Analyzing Figure 8f, it is possible to infer that after 96 h of immersion on SBF, the sample BGFe_48h has formed a layer that is rich in Ca-P, since the ratio of Ca/P is approximately 1.65 at%, and the same occurs in the sample BGFe_24h after 336 h of immersion on SBF.
Despite the retarding effect on bioactivity promoted by the addition of Fe2O3 to the BG, this feature can be overcome by diminishing the size of the particles.
The SEM results of the BGFe samples after 12 and 96 h of immersion in SBF are presented in Figure 9. These images reveal that the layer rich in Ca-P increased as the SBF immersion time increased; notoriously, the rich layer Ca-P is more evident in sample BGFe_48h. After 96 h of immersion, this sample is partially coated by the layer rich in Ca-P, with cauliflower morphology and spherical particles with a diameter of the order of 4 µm.

4. Conclusions

In this project, we successfully produced BG containing Fe2O3 samples, which were studied to evaluate the possibility of its application in the treatment of osteosarcomas.
Thermal analysis showed that adding the Fe2O3 to BG resulted in the melting temperature shifting to lower temperatures. The similarity of the structure of the BG and the BGFe was confirmed by XRD and FTIR, since BGFe samples presented the same characteristic band as an amorphous BG and the same vibrations as BG.
The morphological analyses revealed the homogeneous size of the particles and particles with a more spherical appearance and uniform sizes as the milling time increased. Granulometric tests showed that the size of the particles became more evenly distributed and that a reduction in size of almost 4 μm was observed between samples BGFe_1h and BGFe_48h.
The dielectric response showed that the sample BGFe_12h presents a lower resistance, suggesting that the kinetics of the EF reaction will be higher compared to the other samples.
Analysis of the magnetic properties of the material revealed a paramagnetic behavior and the decrease in the size of the particle did not influence the magnetic properties of the BGFe.
The cytotoxicity test allowed us to conclude that none of the samples are cytotoxic at concentrations of 12.5 and 25 mg/mL and that sample BGFe_48h presents higher levels of cytotoxicity, due to the existence of smaller particles.
Bioactivity data confirmed that the addition of Fe2O3 delays the formation of the HCA layer. Also, sample BGFe_48h, which is the sample with the smaller particle sizes, showed enhanced bioactivity. These results show that a reduction in particle size improves the bioactivity of Fe-containing 45S5 Bioglass samples.

Author Contributions

Conceptualization, J.S.R., S.R.G. and M.P.F.G.; methodology, J.S.R., S.R.G., S.S.T., J.V.d.J., A.S.P. and J.C.S.; software, J.S.R., S.R.G., S.S.T. and S.D.; validation, J.C.S., S.D. and M.P.F.G.; formal analysis, J.S.R.; investigation, J.S.R., S.R.G., S.S.T., A.S.P., J.C.S. and M.P.F.G.; resources, J.C.S. and M.P.F.G.; data curation, S.D.; writing—original draft preparation, J.S.R. and M.P.F.G.; writing—review and editing, S.R.G., S.S.T., J.C.S., S.D. and M.P.F.G.; visualization, S.D.; supervision, M.P.F.G. All authors have read and agreed to the published version of the manuscript.

Funding

This research was funded by FEDER funds through the COMPETE 2020 Program and National Funds through FCT—Portuguese Foundation for Science and Technology under the project LISBOA-01-0247-FEDER-039985/POCI-01-0247-FEDER-039985, LA/P/0037/2020, UIDP/50025/2020, and UIDB/50025/2020 of the Associate Laboratory Institute of Nanostructures, Nanomodelling and Nanofabrication—i3N. S.R.G. and A.S.P. acknowledge FCT—Portuguese Foundation for Science and Technology for the PhD grant (SFRH/BD/148233/2019 and UI/DB/151287/2021, respectively).

Institutional Review Board Statement

Not applicable.

Informed Consent Statement

Not applicable.

Data Availability Statement

The data presented in this study are available on request from the corresponding author.

Conflicts of Interest

The authors declare no conflict of interest.

References

  1. Cannio, M.; Bellucci, D.; Roether, J.A.; Boccaccini, D.N.; Cannillo, V. Bioactive glass applications: A literature review of human clinical trials. Materials 2021, 14, 5440. [Google Scholar] [CrossRef] [PubMed]
  2. Hench, L.L. The story of Bioglass®. J. Mater. Sci. Mater. Med. 2006, 17, 967–978. [Google Scholar] [CrossRef] [PubMed]
  3. Zheng, K.; Boccaccini, A.R. Sol-gel processing of bioactive glass nanoparticles: A review. Adv. Colloid Interface Sci. 2017, 249, 363–373. [Google Scholar] [CrossRef] [PubMed]
  4. Gavinho, S.R.; Pádua, A.S.; Sá-Nogueira, I.; Silva, J.C.; Borges, J.P.; Costa, L.C.; Graça, M.P.F. Biocompatibility, Bioactivity, and Antibacterial Behaviour of Cerium-Containing Bioglass®. Nanomaterials 2022, 12, 4479. [Google Scholar] [CrossRef]
  5. Greenspan, D. Bioglass at 50—A look at Larry Hench’s legacy and bioactive materials. Biomed. Glas. 2019, 5, 178–184. [Google Scholar] [CrossRef]
  6. Fernandes, H.R.; Gaddam, A.; Rebelo, A.; Brazete, D.; Stan, G.E.; Ferreira, J.M. Bioactive glasses and glass-ceramics for healthcare applications in bone regeneration and tissue engineering. Materials 2018, 11, 2530. [Google Scholar] [CrossRef]
  7. Miola, M.; Pakzad, Y.; Banijamali, S.; Kargozar, S.; Vitale-Brovarone, C.; Yazdanpanah, A.; Bretcanu, O.; Ramedani, A.; Vernè, E.; Mozafari, M. Glass-ceramics for cancer treatment: So close, or yet so far? Acta Biomater. 2019, 83, 55–70. [Google Scholar] [CrossRef]
  8. Fatima, H.; Charinpanitkul, T.; Kim, K.S. Fundamentals to apply magnetic nanoparticles for hyperthermia therapy. Nanomaterials 2021, 11, 1203. [Google Scholar] [CrossRef]
  9. Habash, R.W.; Bansal, R.; Krewski, D.; Alhafid, H.T. Thermal therapy, part 1: An introduction to thermal therapy. Crit. Rev. Biomed. Eng. 2006, 34, 459–489. [Google Scholar] [CrossRef]
  10. Lee, K.T.; Lu, Y.J.; Chiu, S.C.; Chang, W.C.; Chuang, E.Y.; Lu, S.Y. Heterogeneous Fenton reaction enabled selective colon cancerous cell treatment. Sci. Rep. 2018, 8, 16580. [Google Scholar] [CrossRef]
  11. Kermani, F.; Vojdani-Saghir, A.; Beidokhti, S.M.; Nazarnezhad, S.; Mollaei, Z.; Hamzehlou, S.; El-Fiqi, A.; Baino, F.; Kargozar, S. Iron (Fe)-doped mesoporous 45S5 bioactive glasses: Implications for cancer therapy. Trans. Oncol. 2022, 20, 101397. [Google Scholar] [CrossRef] [PubMed]
  12. Lei, P.; Bai, T.; Sun, Y. Mechanisms of ferroptosis and relations with regulated cell death: A review. Front. Physiol. 2019, 10, 139. [Google Scholar] [CrossRef] [PubMed]
  13. Graça, M.P.; Ferreira da Silva, M.G.; Sombra, A.S.; Valente, M.A. Electric and dielectric properties of a SiO2–Na2O–Nb2O5 glass subject to a controlled heat-treatment process. Phys. B 2007, 396, 62–69. [Google Scholar] [CrossRef]
  14. Graça, M.P.F.; da Silva, M.F.; Valente, M.A. NaNbO3 crystals dispersed in a B2O3 glass matrix–Structural characteristics versus electrical and dielectrical properties. Solid State Sci. 2009, 11, 570–577. [Google Scholar] [CrossRef]
  15. Borges, R.; Mendonça-Ferreira, L.; Rettori, C.; Pereira, I.S.; Baino, F.; Marchi, J. New sol-gel-derived magnetic bioactive glass-ceramics containing superparamagnetic hematite nanocrystals for hyperthermia application. Mater. Sci. Eng. C 2021, 120, 111692. [Google Scholar] [CrossRef]
  16. Benali, A.; Bejar, M.; Dhahri, E.; Sajieddine, M.; Graça, M.P.F.; Valente, M.A. Magnetic, Raman and Mössbauer properties of double-doping LaFeO3 perovskite oxides. Mater. Chem. Phys. 2015, 149, 467–472. [Google Scholar] [CrossRef]
  17. ISO Standard 10993-5; Biological Evaluation of Medical Devices. Tests for In Vitro Cytotoxicity. International Organization for Standardization: Geneva, Switzerland, 2009.
  18. ISO Standard 23317; Implants for Surgery—In Vitro Evaluation for Apatite-Forming Ability of Implant Materials. International Organization for Standardization: Geneva, Switzerland, 2014.
  19. Lefebvre, L.; Chevalier, J.; Gremillard, L.; Zenati, R.; Thollet, G.; Bernache-Assolant, D.; Govin, A. Structural transformations of bioactive glass 45S5 with thermal treatments. Acta Mater. 2007, 55, 3305–3313. [Google Scholar] [CrossRef]
  20. Gavinho, S.R.; Graça, M.P.F.; Prezas, P.R.; Kumar, J.S.; Melo, B.M.G.; Sales, A.J.M.; Almeida, A.F.; Valente, M.A. Structural, thermal, morphological and dielectric investigations on 45S5 glass and glass-ceramics. J. Non-Cryst. Solids 2021, 562, 120780. [Google Scholar] [CrossRef]
  21. Chi, C.Y.; Chen, C.Y.; Huang, J.Y.; Kuan, C.Y.; Lin, Y.Y.; Li, C.H.; Yang, C.C.; Lin, F.H. Preparation and in-vitro evaluation of Fe2O3-doped DP-bioglass in combination with 3D-printing and selective laser sintering process (3DP-SLS) for alveolar bone augmentation. Ceram. Int. 2021, 47, 12725–12734. [Google Scholar] [CrossRef]
  22. Arabyazdi, S.; Yazdanpanah, A.; Hamedani, A.A.; Ramedani, A.; Moztarzadeh, F. Synthesis and characterization of CaO-P2O5-SiO2-Li2O-Fe2O3 bioactive glasses: The effect of Li2O-Fe2O3 content on the structure and in-vitro bioactivity. J. Non-Cryst Solids 2019, 503, 139–150. [Google Scholar] [CrossRef]
  23. Brauer, D.S. Bioactive glasses—Structure and properties. Angew. Chem. Int. Ed. 2015, 54, 4160–4181. [Google Scholar] [CrossRef] [PubMed]
  24. Mecca, F.G.; Bellucci, D.; Cannillo, V. Effect of Thermal Treatments and Ion Substitution on Sintering and Crystallization of Bioactive Glasses: A Review. Materials 2023, 16, 4651. [Google Scholar] [CrossRef] [PubMed]
  25. Li, G.; Zhang, K.; Pei, Z.; Zhang, N.; Yu, Y.; Zhao, S.; Liang, G.; Zhou, J.; Xing, Y. A novel method to enhance magnetic property of bioactive glass-ceramics for hyperthermia. Ceram. Int. 2019, 45, 4945–4956. [Google Scholar] [CrossRef]
  26. Boccaccini, A.R.; Chen, Q.; Lefebvre, L.; Gremillard, L.; Chevalier, J. Sintering, crystallisation and biodegradation behaviour of Bioglass®-derived glass–ceramics. Faraday Discuss. 2007, 136, 27–44. [Google Scholar] [CrossRef]
  27. Gavinho, S.R.; Prezas, P.R.; Ramos, D.J.; Sá-Nogueira, I.; Borges, J.P.; Lança, M.C.; Silva, J.C.; Henriques, C.M.R.; Pires, E.; Kumar, J.S.; et al. Nontoxic glasses: Preparation, structural, electrical and biological properties. Int. J. Appl. Ceram. Technol. 2019, 16, 1885–1894. [Google Scholar] [CrossRef]
  28. Schneider, C.A.; Rasband, W.S.; Eliceiri, K.W. NIH Image to ImageJ: 25 years of image analysis. Nat. Methods 2012, 9, 671–675. [Google Scholar] [CrossRef]
  29. Singh, L.; Rai, U.S.; Mandal, K.D. Dielectric, modulus and impedance spectroscopic studies of nanostructured CaCu2.70Mg0.30Ti4O12 electro-ceramic synthesized by modified sol–gel route. J. Alloys Compd. 2013, 555, 176–183. [Google Scholar] [CrossRef]
  30. Coşkun, M.; Polat, Ö.; Coşkun, F.M.; Durmuş, Z.; Çağlar, M.; Türüt, A. The electrical modulus and other dielectric properties by the impedance spectroscopy of LaCrO3 and LaCr0.90Ir0.10O3 perovskites. RSC Adv. 2018, 8, 4634–4648. [Google Scholar] [CrossRef]
  31. Gavinho, S.R.; Melo, B.M.G.; Borges, J.P.; Silva, J.C.; Graça, M.P.F. Thermal, Structural, Morphological and Electrical Characterization of Cerium-Containing 45S5 for Metal Implant Coatings. Coatings 2023, 13, 294. [Google Scholar] [CrossRef]
  32. Goh, Y.F.; Akram, M.; Alshemary, A.Z.; Hussain, R. Synthesis, characterization and in vitro study of magnetic biphasic calcium sulfate-bioactive glass. Mater. Sci. Eng. C 2015, 53, 29–35. [Google Scholar] [CrossRef]
  33. Danewalia, S.S.; Singh, K. Bioactive glasses and glass–ceramics for hyperthermia treatment of cancer: State-of-art, challenges, and future perspectives. Mater. Today Bio 2021, 10, 100100. [Google Scholar] [CrossRef] [PubMed]
  34. López-García, J.; Lehocký, M.; Humpolíček, P.; Sáha, P. HaCaT keratinocytes response on antimicrobial atelocollagen substrates: Extent of cytotoxicity, cell viability and proliferation. J. Funct. Biomater. 2014, 5, 43–57. [Google Scholar] [CrossRef] [PubMed]
  35. Sohaebuddin, S.K.; Thevenot, P.T.; Baker, D.; Eaton, J.W.; Tang, L. Nanomaterial cytotoxicity is composition, size, and cell type dependent. Part. Fibre Toxicol. 2010, 7, 22. [Google Scholar] [CrossRef] [PubMed]
  36. Crush, J.; Hussain, A.; Seah, K.T.M.; Khan, W.S. Bioactive glass: Methods for assessing angiogenesis and osteogenesis. Front. Cell Dev. Biol. 2021, 9, 643781. [Google Scholar] [CrossRef]
  37. Peitl, O.; Zanotto, E.D.; Hench, L.L. Highly bioactive P2O5–Na2O–CaO–SiO2 glass-ceramics. J. Non-Cryst. Solids 2001, 292, 115–126. [Google Scholar] [CrossRef]
  38. Beaufils, S.; Rouillon, T.; Millet, P.; Le Bideau, J.; Weiss, P.; Chopart, J.P.; Daltin, A.L. Synthesis of calcium-deficient hydroxyapatite nanowires and nanotubes performed by template-assisted electrodeposition. Mater. Sci. Eng. C 2019, 98, 333–346. [Google Scholar] [CrossRef]
  39. Bhakta, S.; Pattanayak, D.K.; Takadama, H.; Kokubo, T.; Miller, C.A.; Mirsaneh, M.; Reaney, I.M.; Brook, I.; van Noort, R.; Hatton, P.V. Prediction of osteoconductive activity of modified potassium fluorrichterite glass-ceramics by immersion in simulated body fluid. J. Mater. Sci. Mater. Med. 2010, 21, 2979–2988. [Google Scholar] [CrossRef]
  40. Gavinho, S.R.; Pádua, A.S.; Sá-Nogueira, I.; Silva, J.C.; Borges, J.P.; Costa, L.C.; Graça, M.P.F. Fabrication, Structural and Biological Characterization of Zinc-Containing Bioactive Glasses and Their Use in Membranes for Guided Bone Regeneration. Materials 2023, 16, 956. [Google Scholar] [CrossRef]
  41. Borden, M.; Westerlund, L.E.; Lovric, V.; Walsh, W. Controlling the bone regeneration properties of bioactive glass: Effect of particle shape and size. J. Biomed. Mater. Res. Part B 2022, 110, 910–922. [Google Scholar] [CrossRef]
Figure 1. DTA-TG spectra of 45S5 Bioglass containing 10% of Fe2O3.
Magnetochemistry 09 00209 g001
Figure 2. XRD patterns of BG and BGFe_1h.
Magnetochemistry 09 00209 g002
Figure 3. FTIR spectra of the prepared samples.
Magnetochemistry 09 00209 g003
Figure 4. SEM images of the powder at magnification 2.00 kx (left images) and granulometric evaluation (right images): (a) BGFe_1h, (b) BGFe_12h, (c) BGFe_24h and (d) BGFe_48h. Undersize—the fraction of particles that are smaller than a specific size.
Magnetochemistry 09 00209 g004
Figure 5. The imaginary part of the modulus, M″, as a function of frequency.
Magnetochemistry 09 00209 g005
Figure 6. Magnetization of the samples, (a) BGFe_1h, and (b) BGFe_48h, when the field was applied at 5 K and 300 K. The insets are a magnification of lower values of the applied magnetic field.
Magnetochemistry 09 00209 g006
Figure 7. Cytotoxicity of the extracts prepared for each sample using Saos-2 cells. C-, negative control, C+ positive control.
Magnetochemistry 09 00209 g007
Figure 8. Atomic percentage of the different ions after 12, 24, 48, 96 and 336 h of immersion on SBF, (a) Ca, (b) P, (c) Si, (d) Na, (e) Fe and (f) Molar ratio of Ca/P.
Magnetochemistry 09 00209 g008
Figure 9. SEM images of the studied samples after 12 h (top images) and 96 h (bottom images) of immersion on SBF: (a,b) BGFe_1h, (c,d) BGFe_12h, (e,f) BGFe_24h and (g,h) BGFe_48h.
Magnetochemistry 09 00209 g009
Table 1. The particle size of the samples measured using: (A) ImageJ software (version 1.53t) analysis on the SEM micrographs of the sample’s surface; (B) granulometric analysis.
BGFe_1hBGFe_12hBGFe_24hBGFe_48h
A—Particle mean size (µm)3.3872.5362.7492.037
B—Particle mean size (µm)3.5722.8342.9782.397
Table 2. Grain resistance and capacitance of the studied samples.
SampleCg (F)Rg (Ω)
BGFe_1h1.11 × 10−113.21 × 10⁶
BGFe_12h1.07 × 10−111.33 × 10⁶
BGFe_24h1.24 × 10−111.62 × 10⁶
BGFe_48h1.34 × 10−112.11 × 10⁶
Disclaimer/Publisher’s Note: The statements, opinions and data contained in all publications are solely those of the individual author(s) and contributor(s) and not of MDPI and/or the editor(s). MDPI and/or the editor(s) disclaim responsibility for any injury to people or property resulting from any ideas, methods, instructions or products referred to in the content.

