
Band Structure Evolution during Reversible Interconversion between Dirac and Standard Fermions in Organic Charge-Transfer Salts

 , and
, and 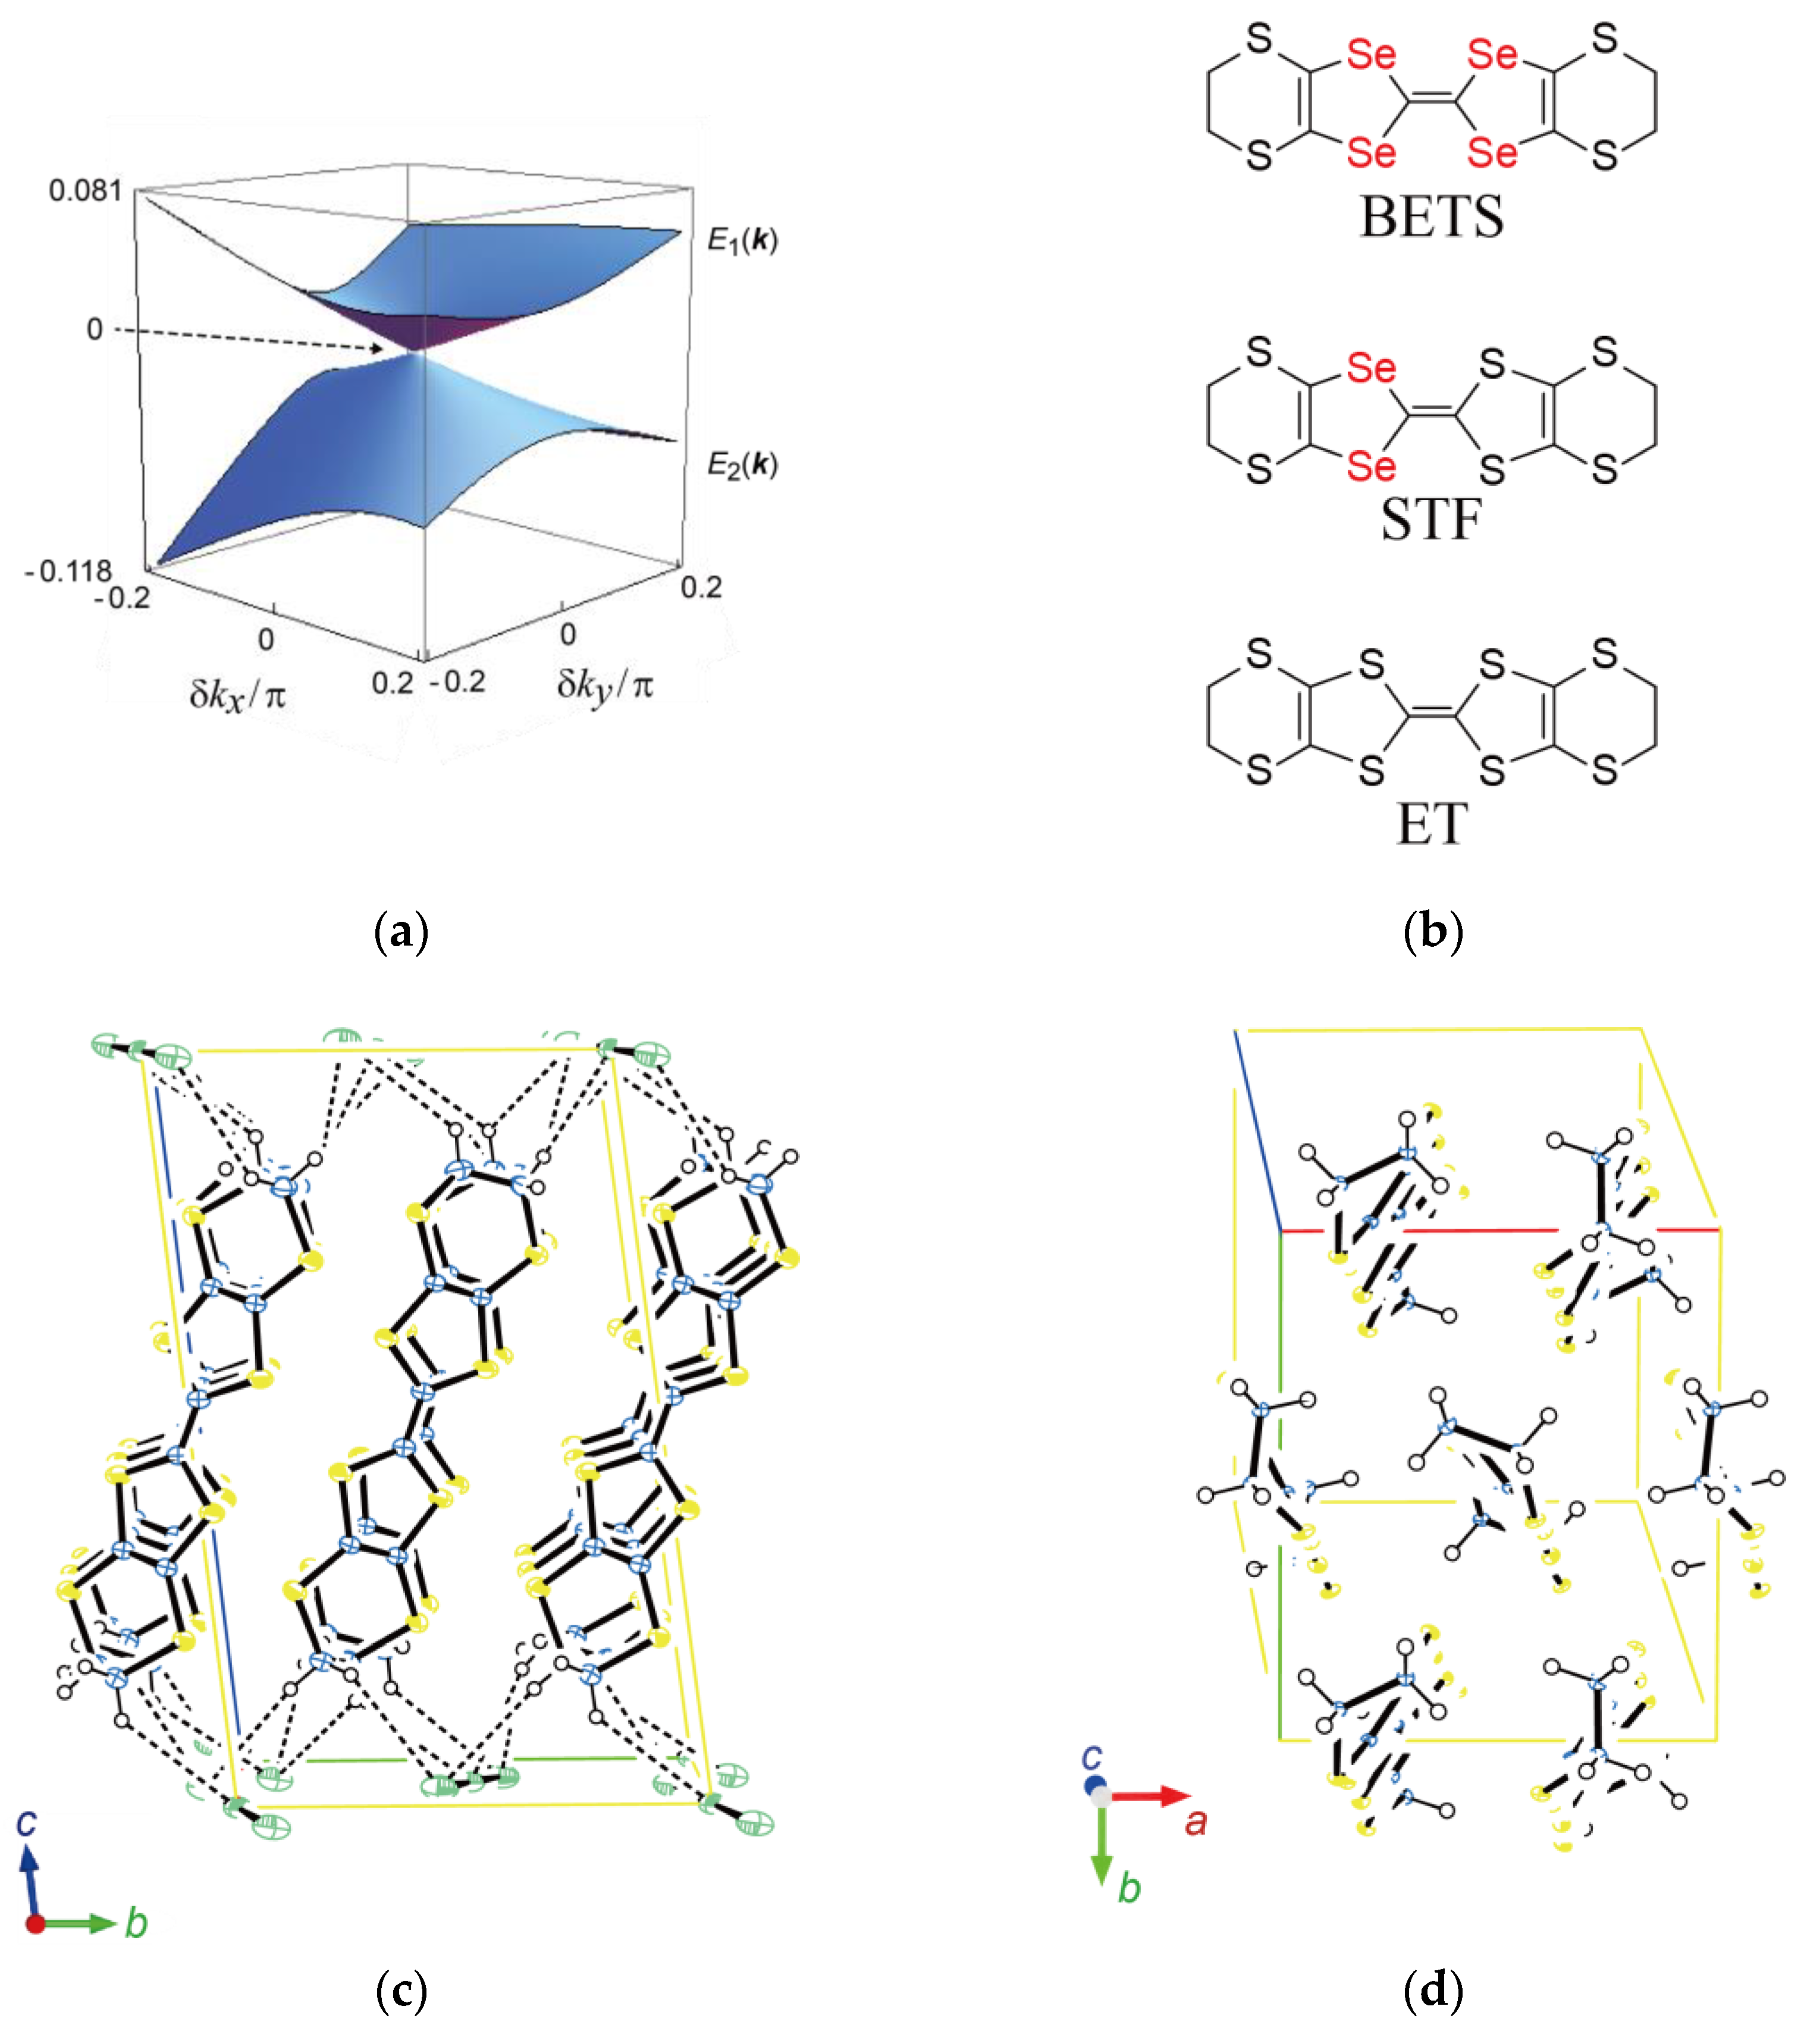
Abstract
:1. Introduction
2. Materials and Methods
2.1. Materials
2.2. Electrical Resistivity Measurements
2.3. Magnetic Susceptibility Measurements
2.4. ESR Spectra Measurements
2.5. X-ray Structural Analyses
2.6. Band Structure Calculation
3. Results and Discussion
3.1. Crystal Structures of α-D2I3

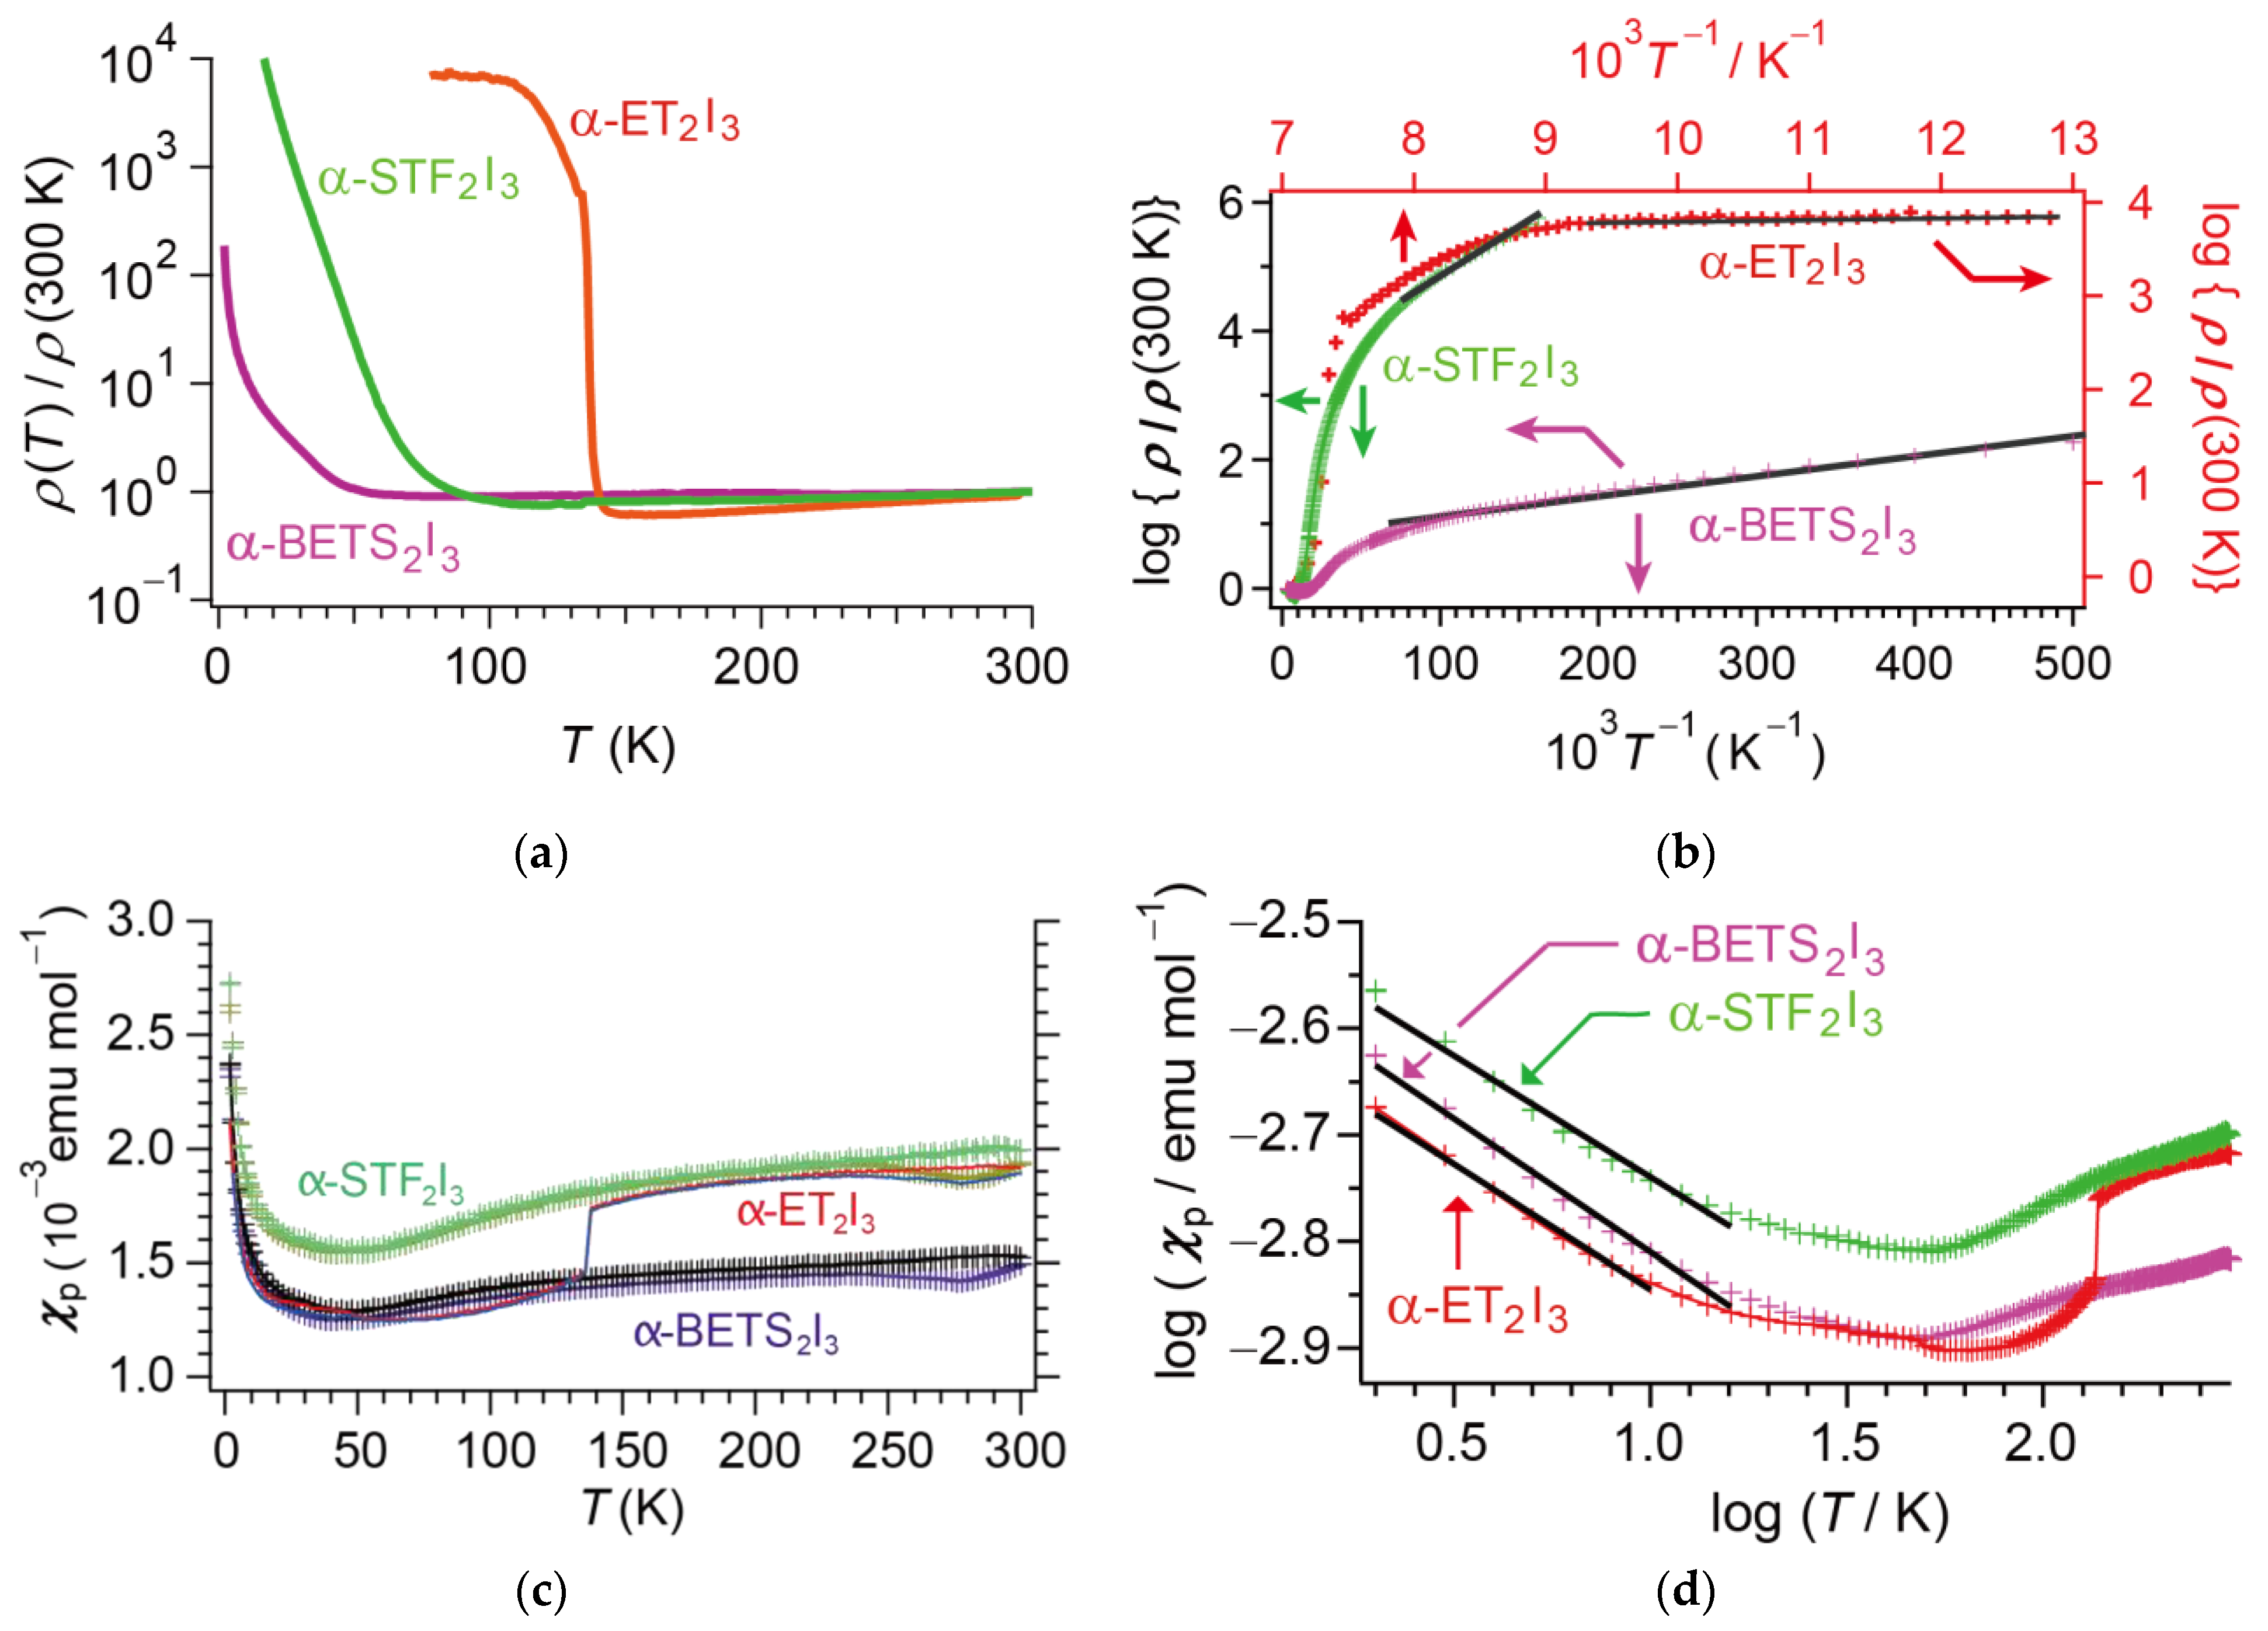
3.2. Physical Properties of α-D2I3
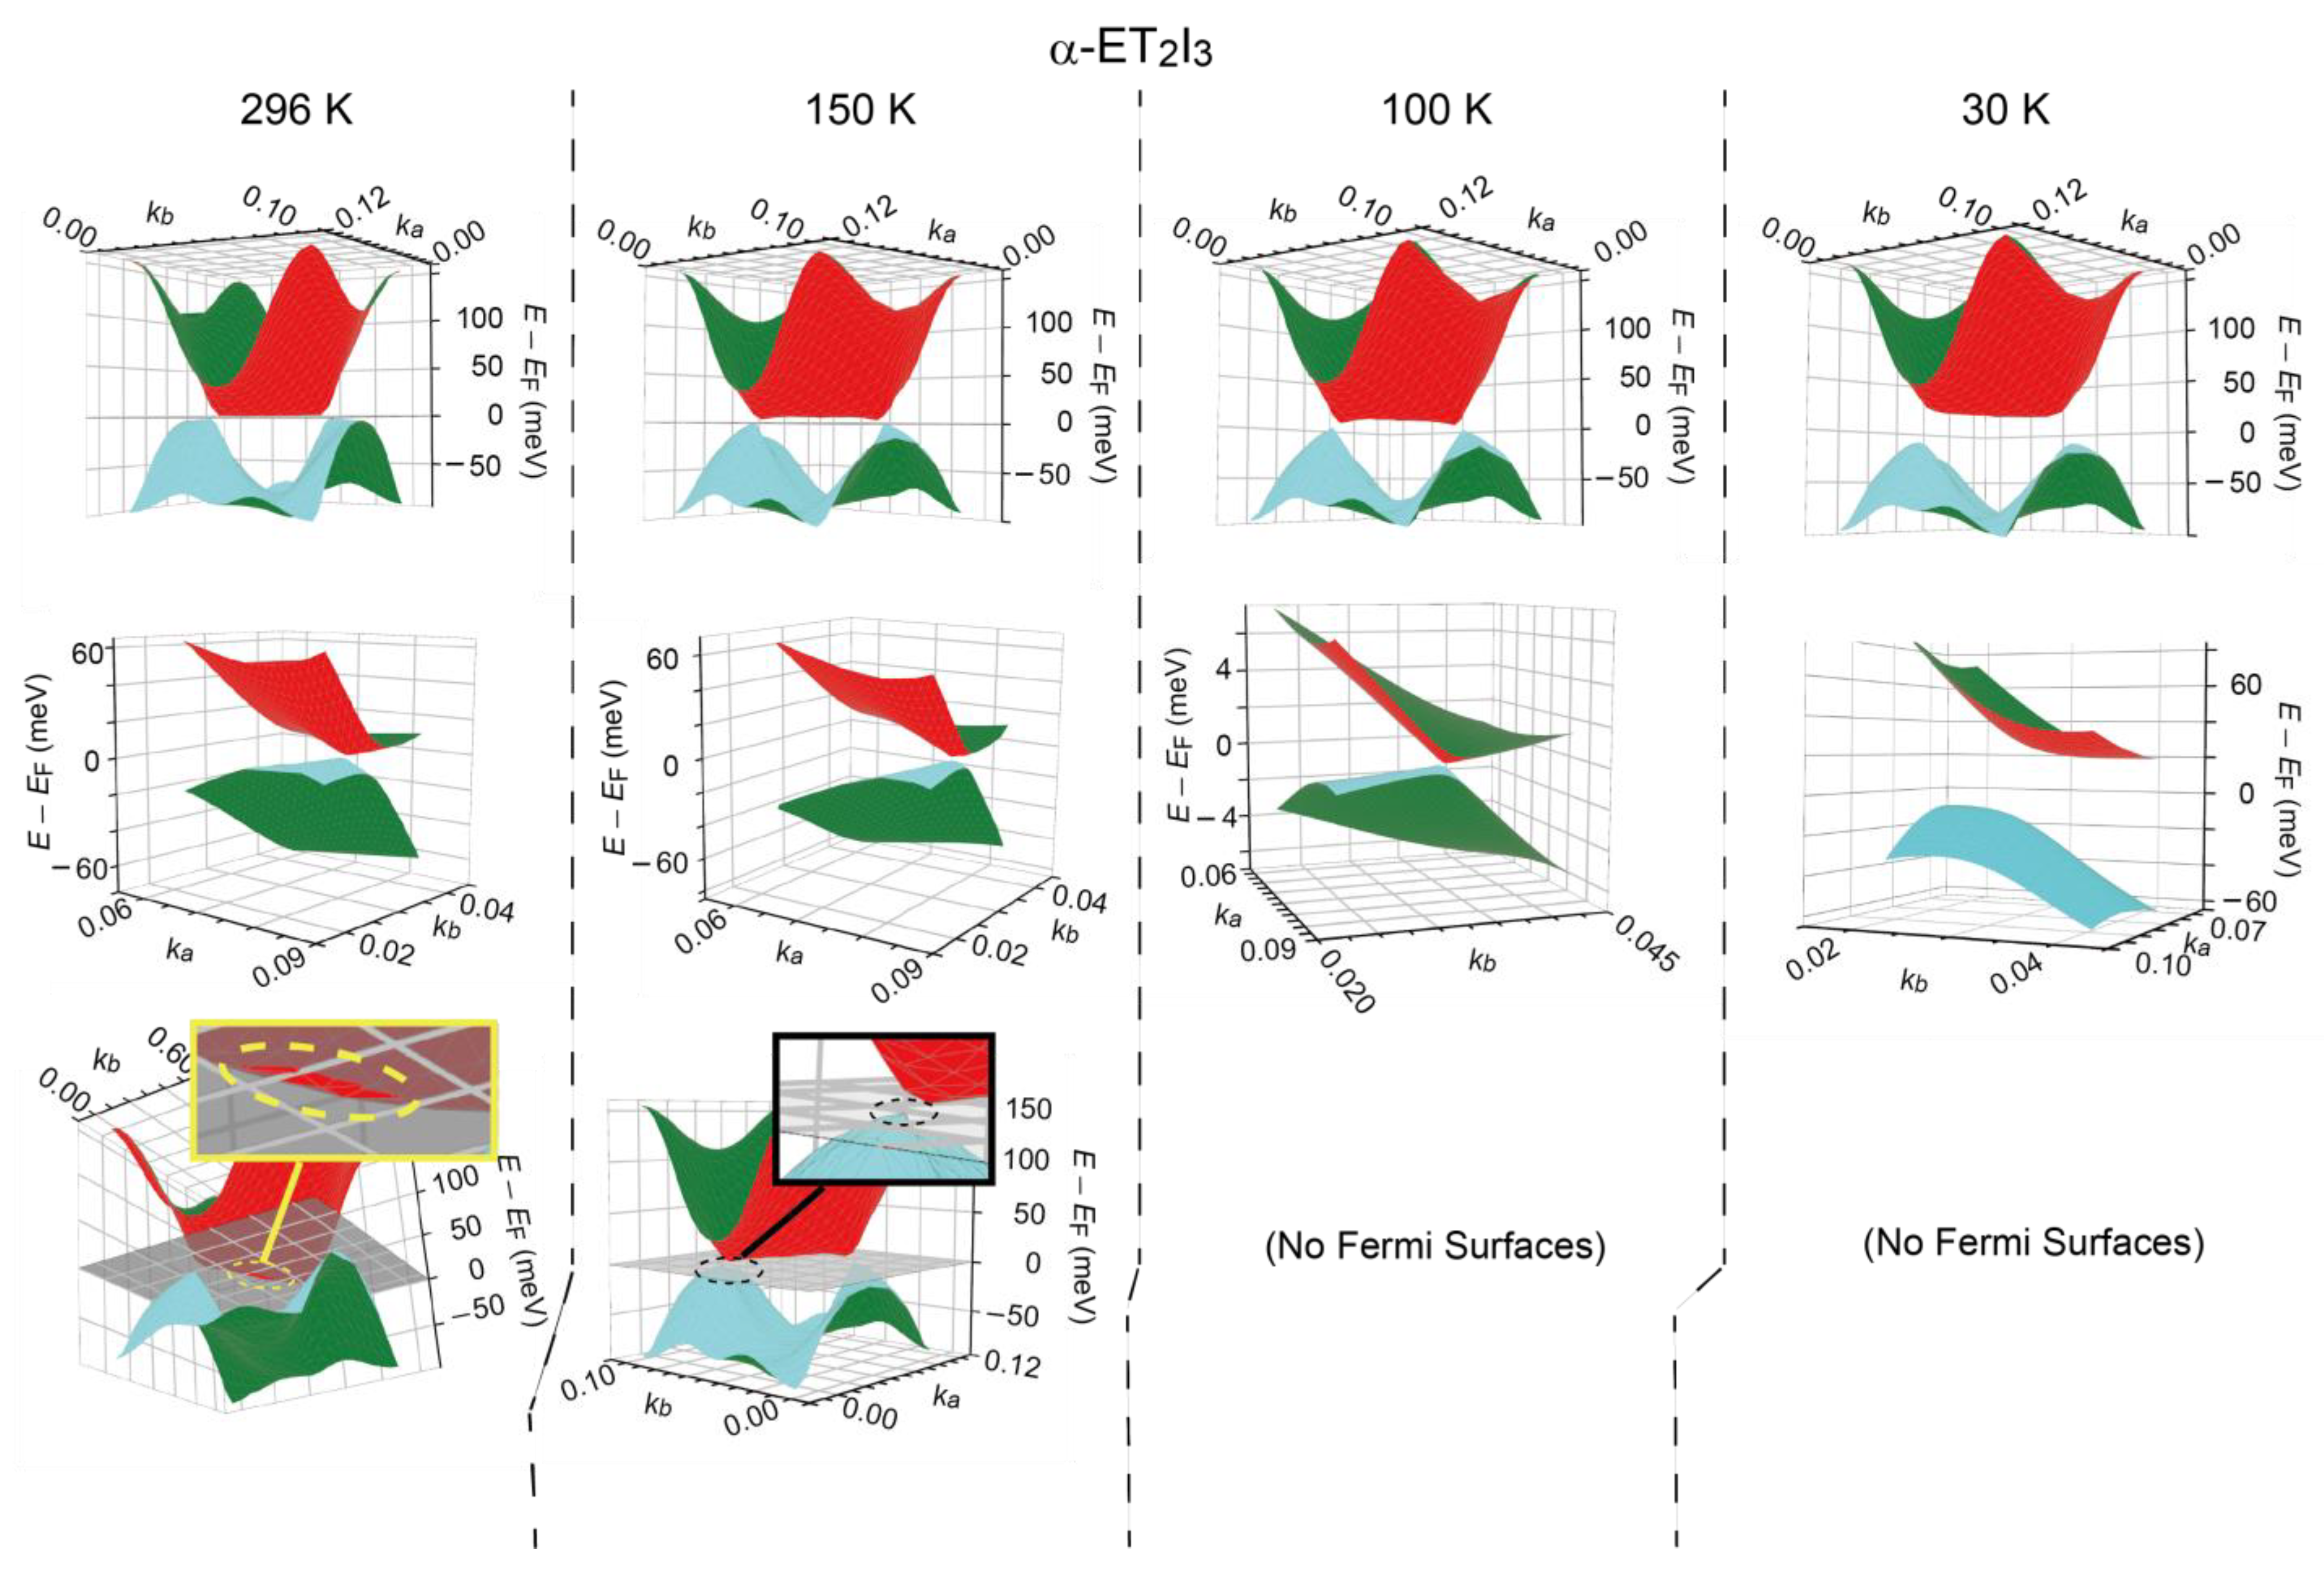
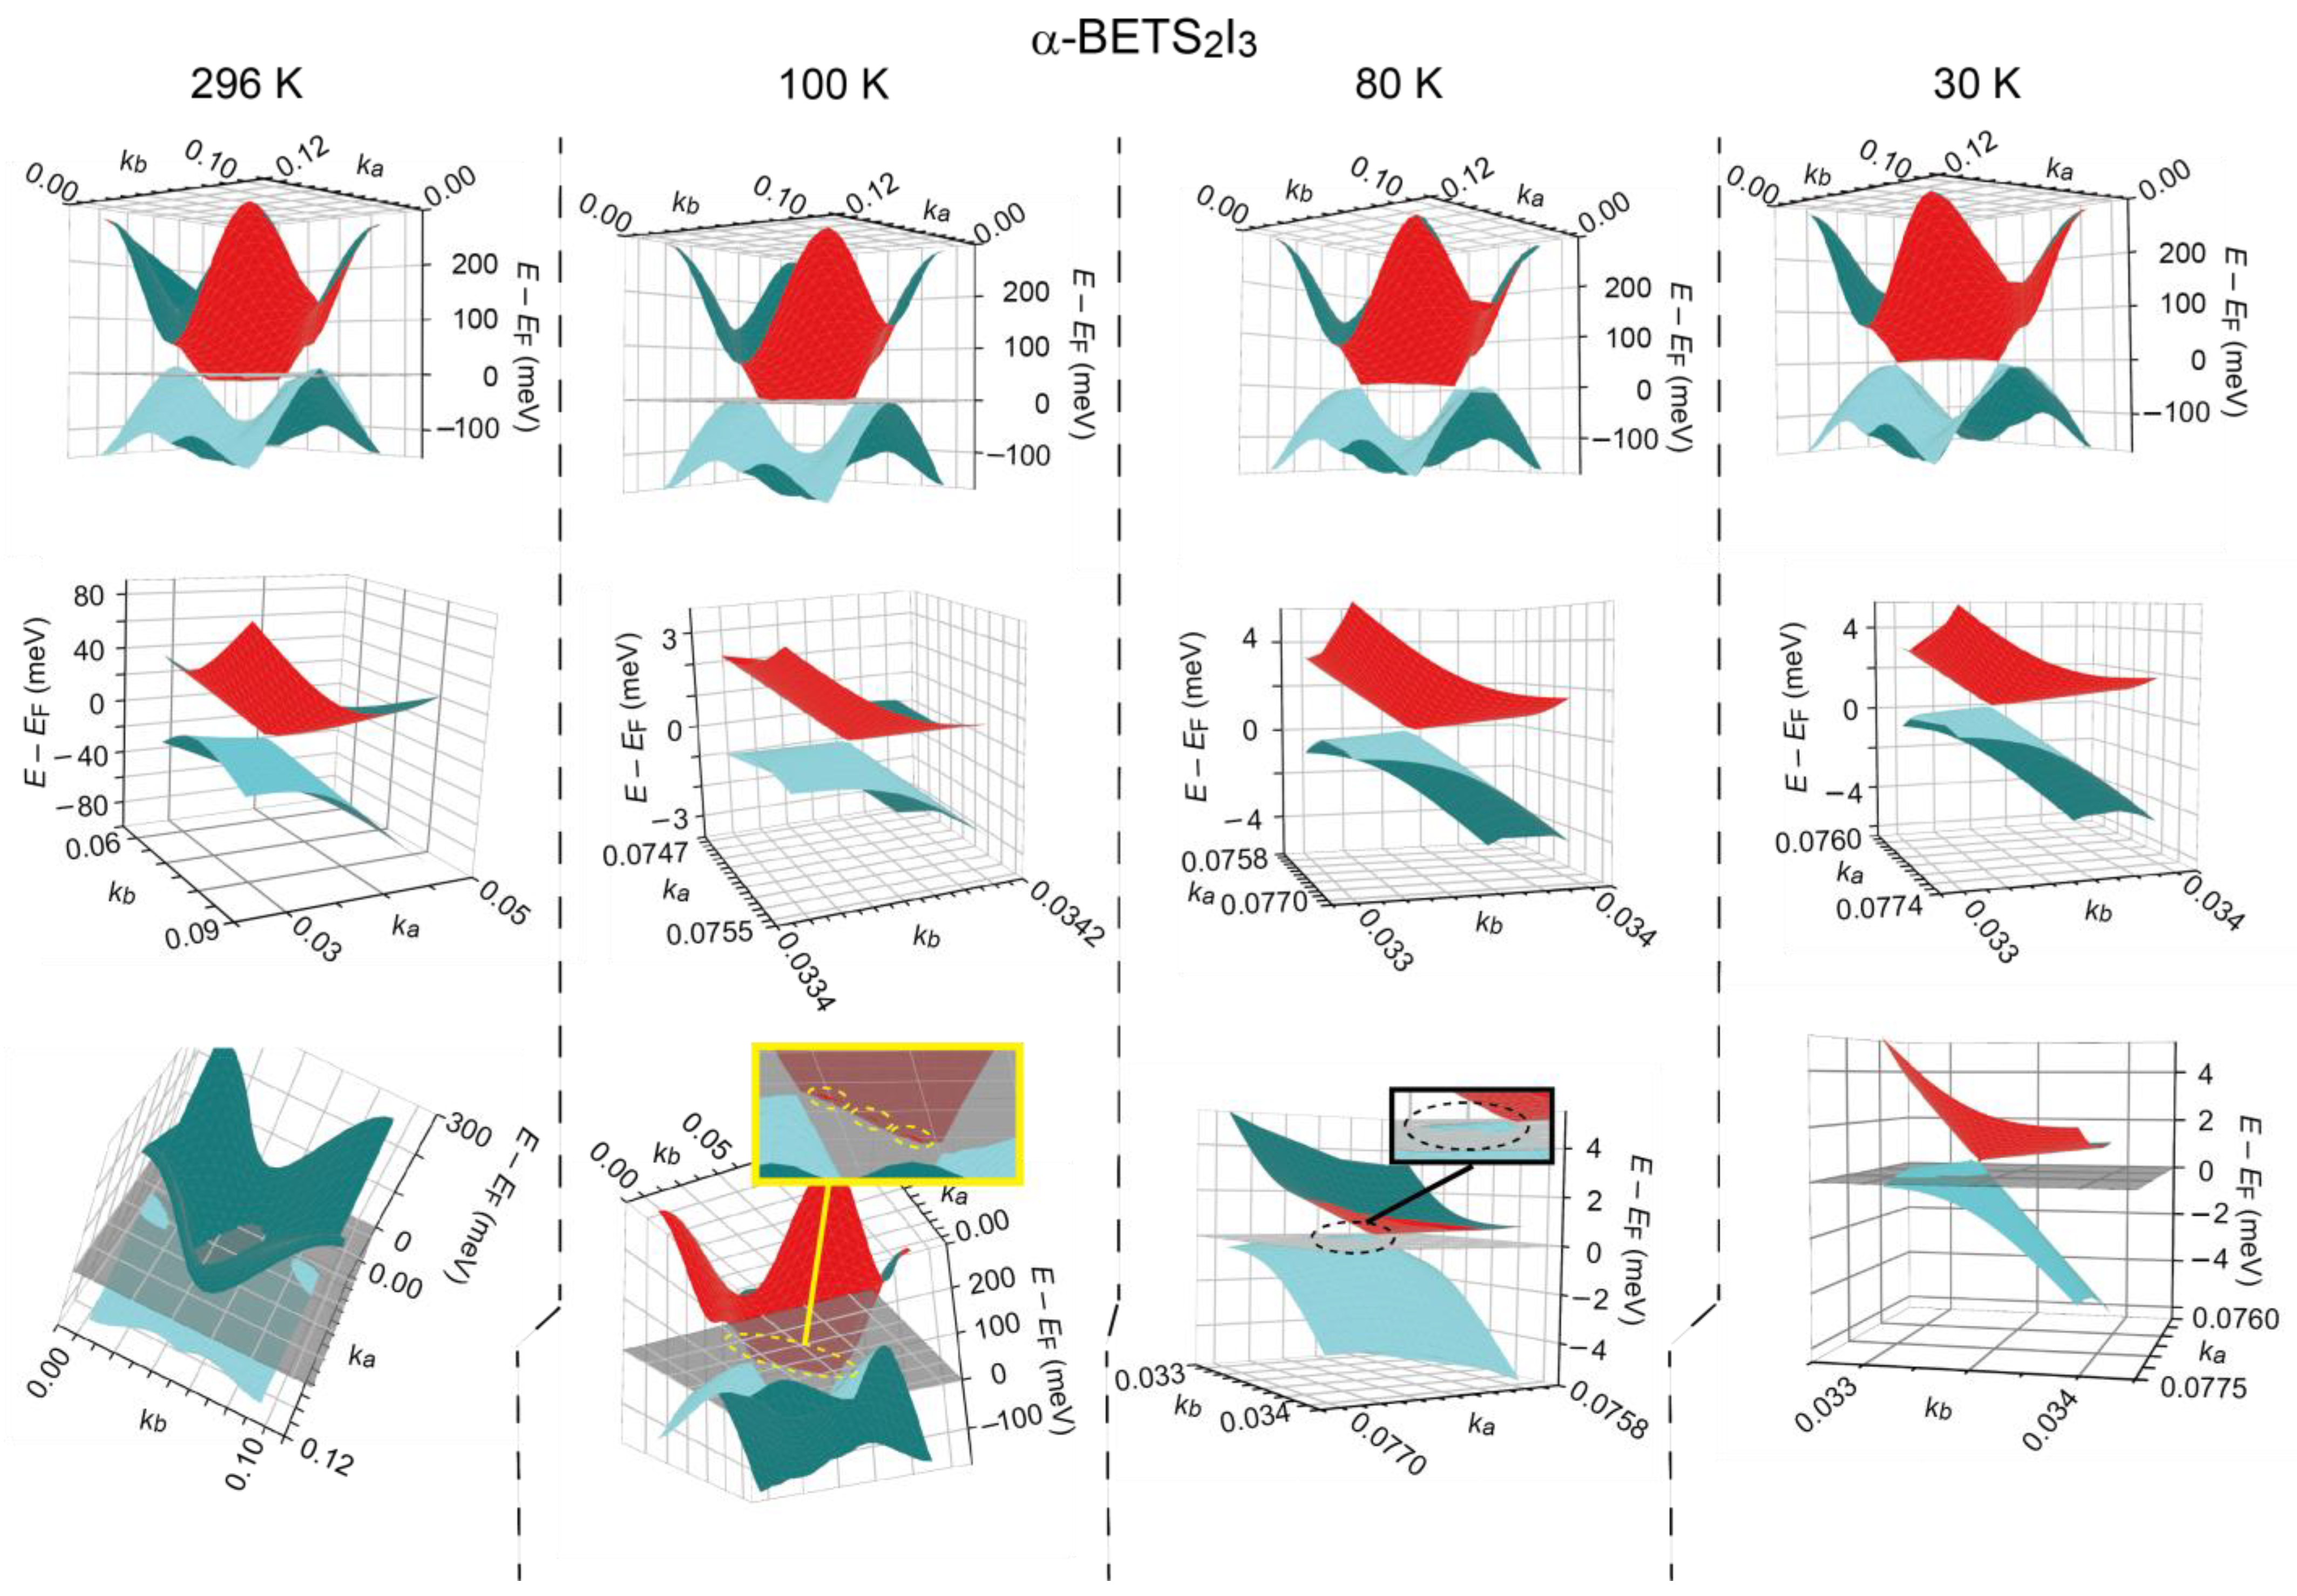
3.3. Calculated Band Structures of α-ET2I3
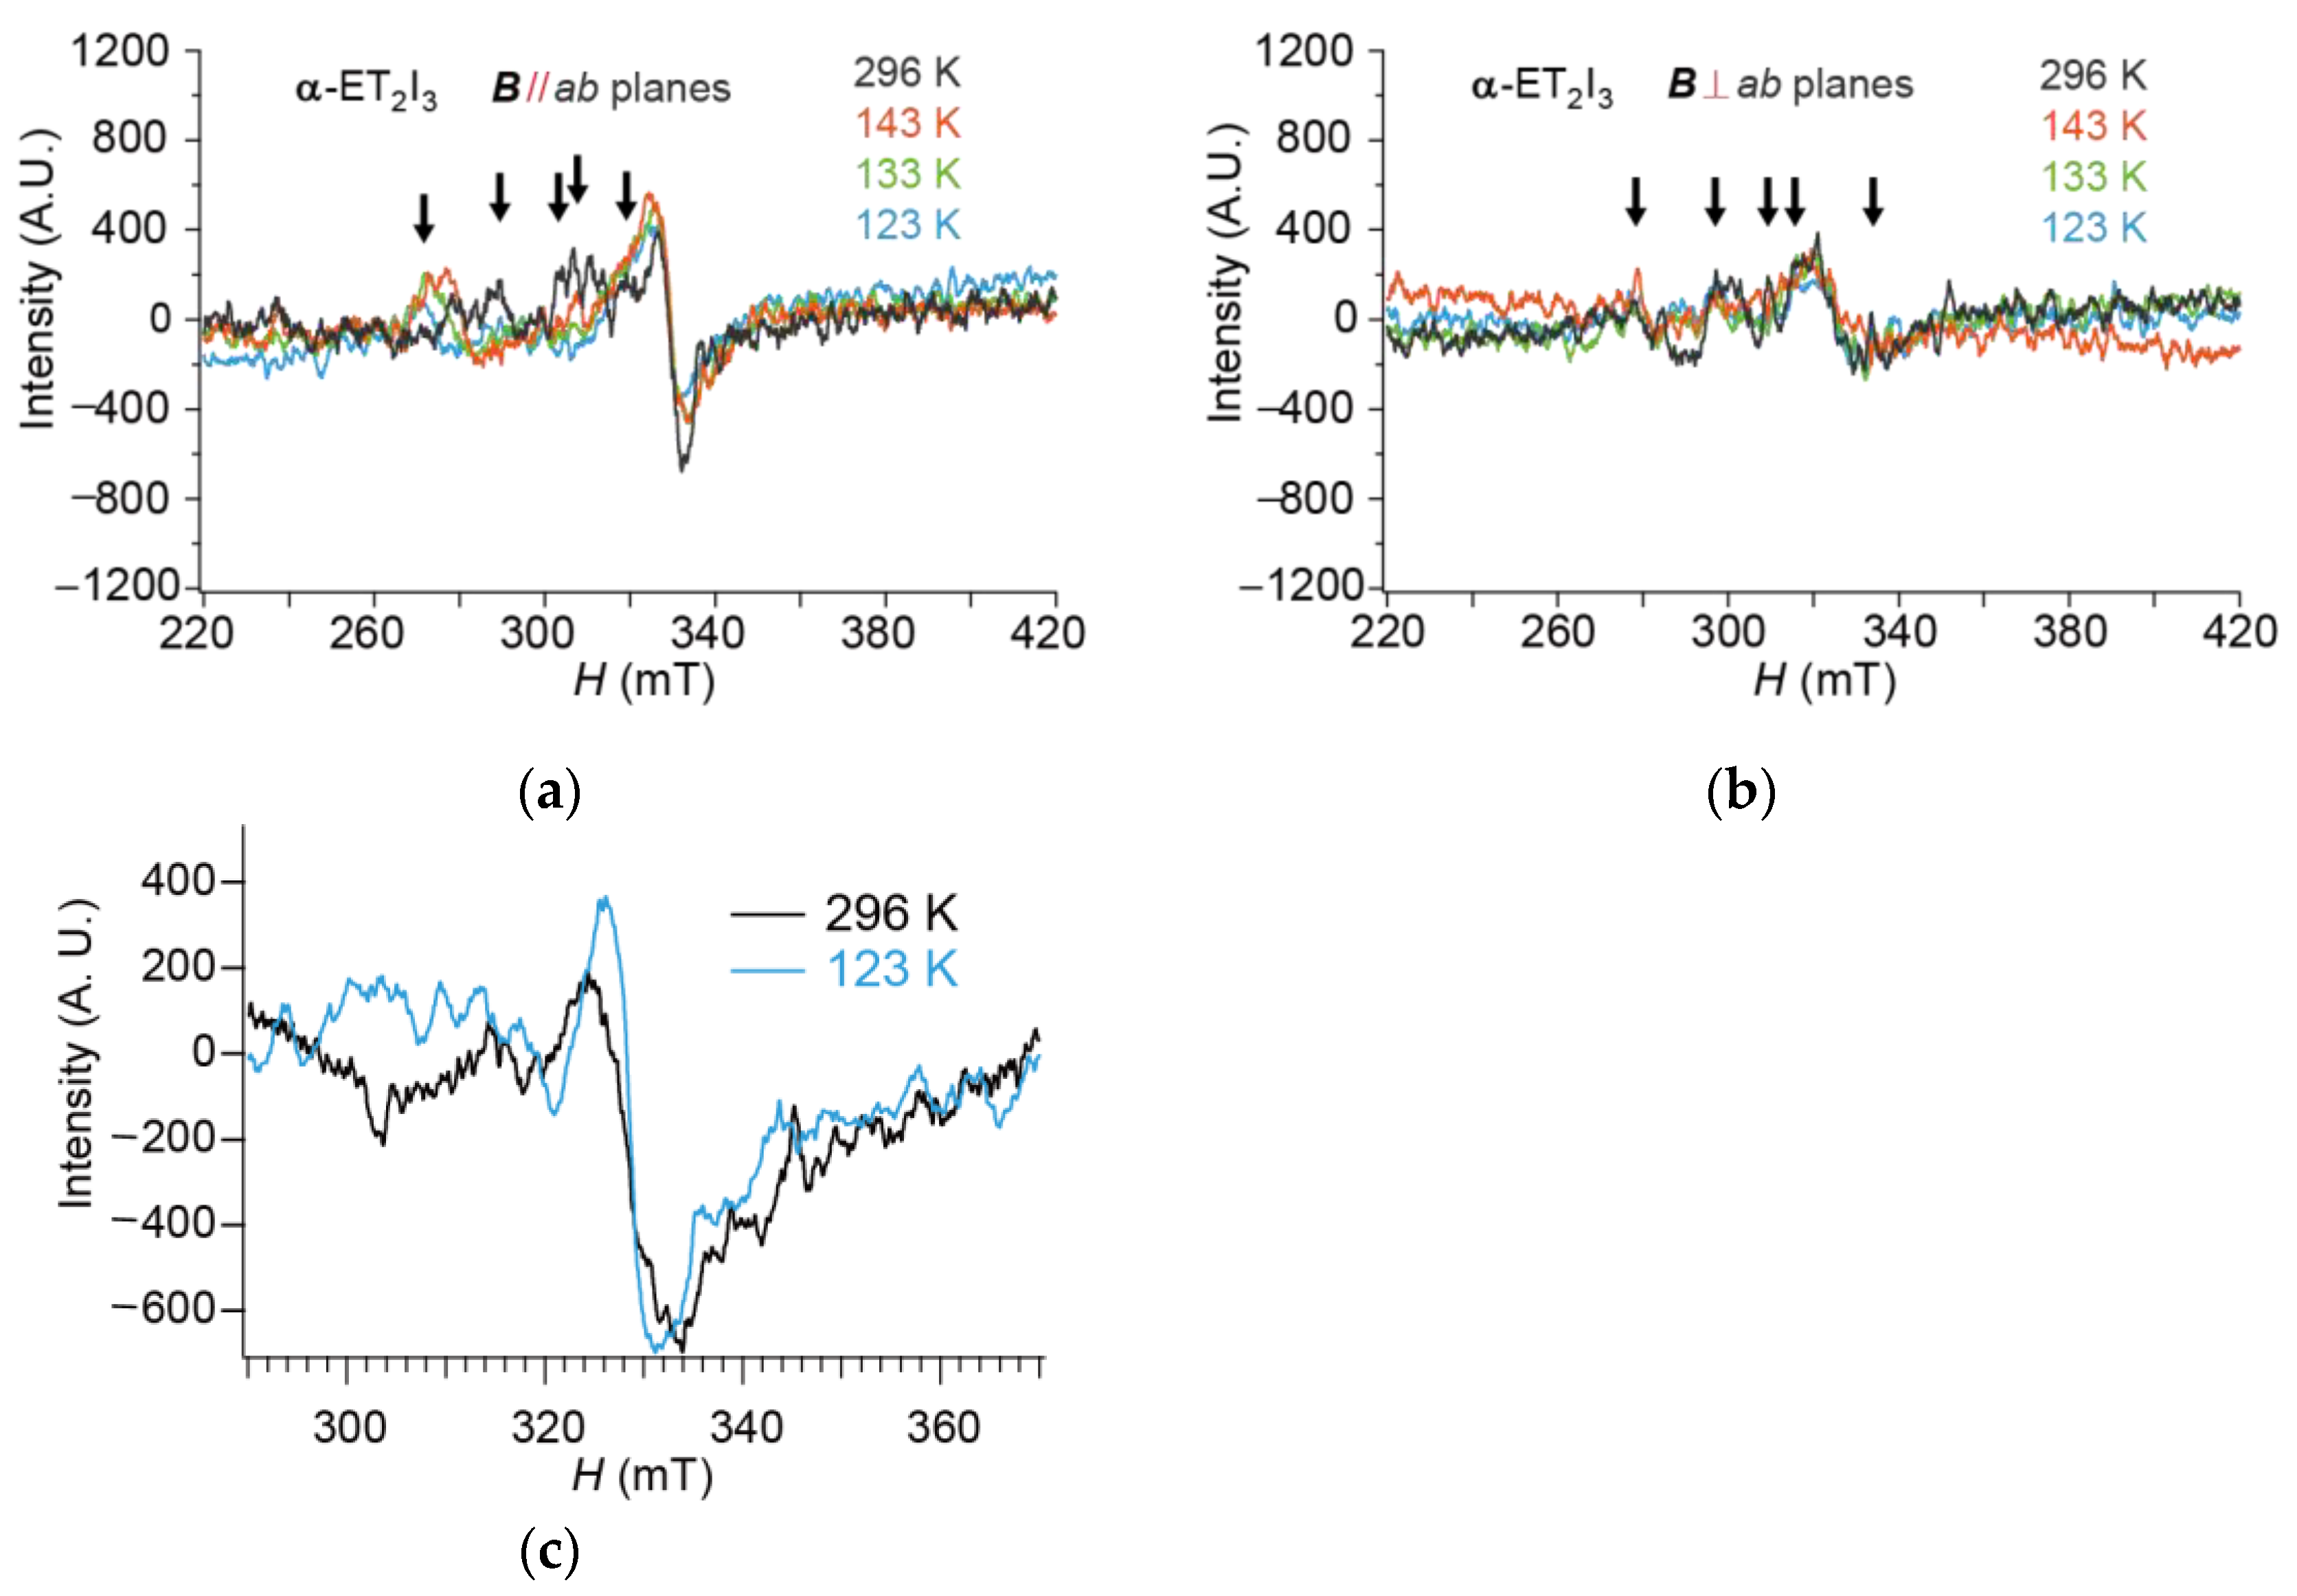
3.4. Spectroscopic Evidence for the Occurrence of DFs: ESR
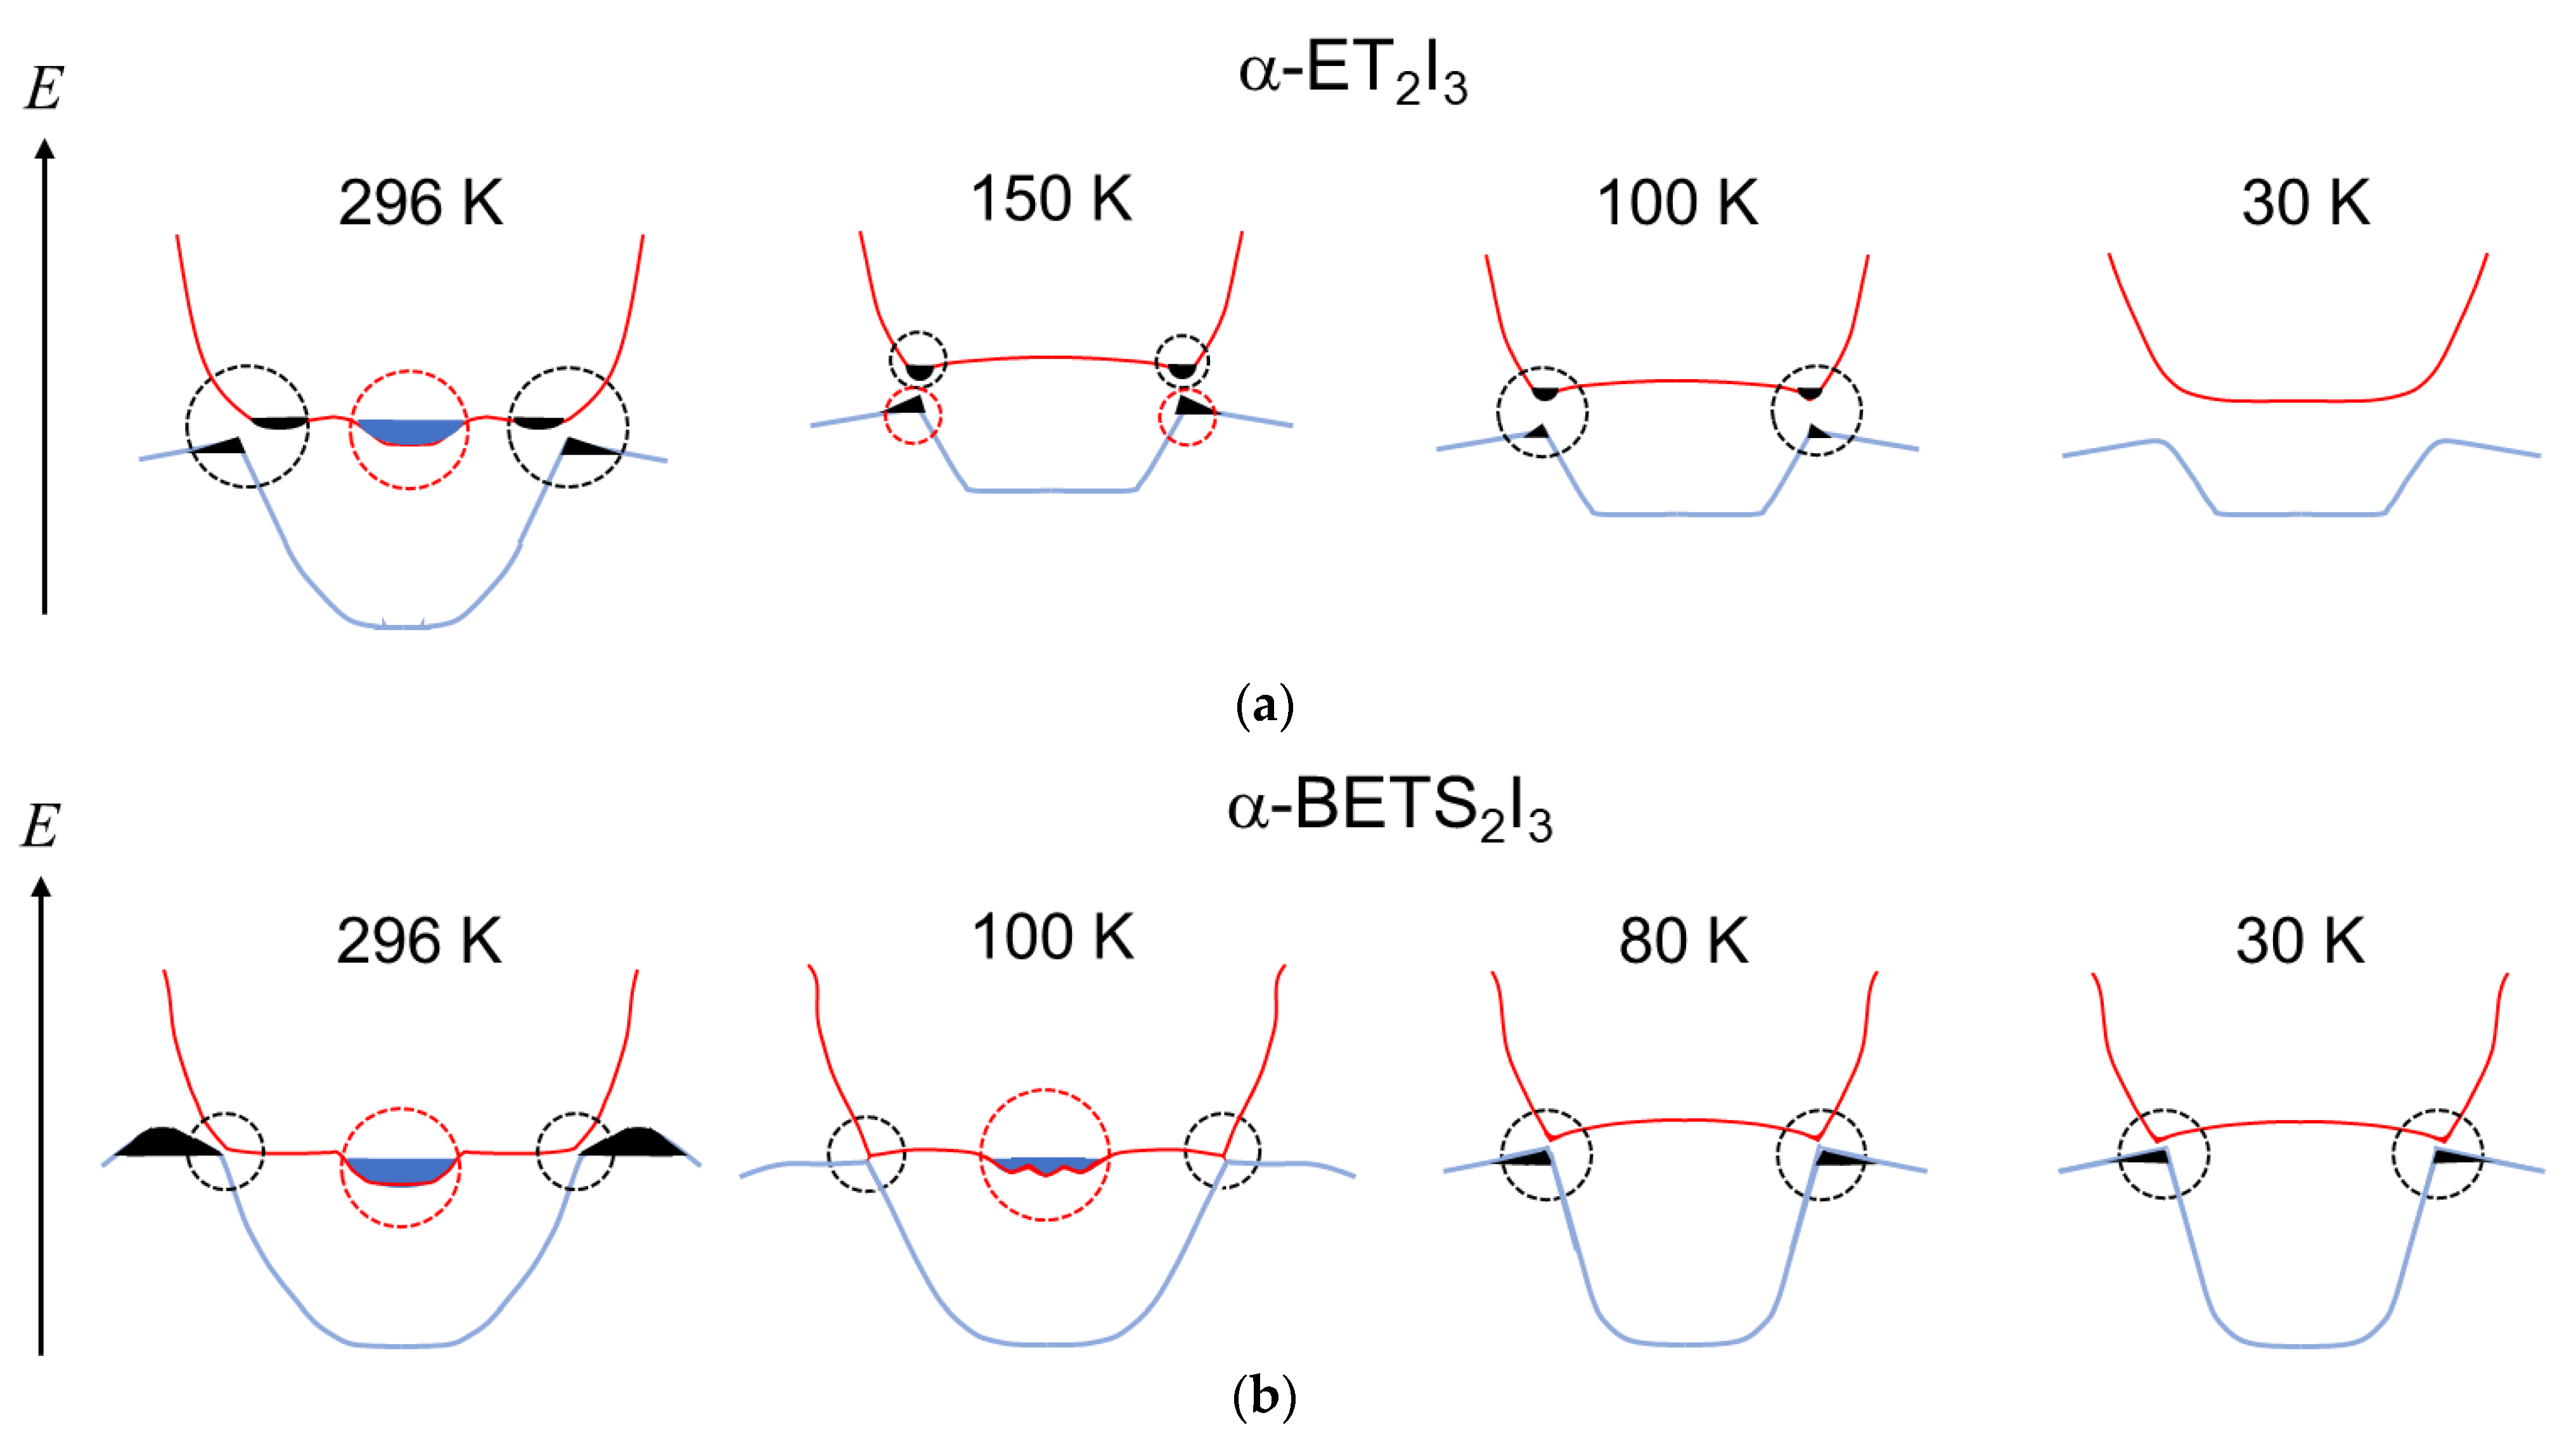
3.5. Chemistry Driving the Massless–Massive Fermion Transformation
4. Conclusions
Supplementary Materials
Author Contributions
Funding
Institutional Review Board Statement
Informed Consent Statement
Data Availability Statement
Acknowledgments
Conflicts of Interest
References
- Castro Neto, A.H.; Guinea, F.; Peres, N.M.R.; Novoselov, K.S.; Geim, A.K. The electronic properties of graphene. Rev. Mod. Phys. 2009, 81, 109–162. [Google Scholar] [CrossRef] [Green Version]
- Park, S.H.; Sammon, M.; Mele, E.; Low, T. Plasmonic gain in current biased tilted Dirac nodes. Nat. Commun. 2022, 13, 7667. [Google Scholar] [CrossRef] [PubMed]
- Geng, D.; Zhou, H.; Yue, S.; Sun, Z.; Cheng, P.; Chen, L.; Meng, S.; Wu, K.; Feng, B. Observation of gapped Dirac cones in a two-dimensional Su-Schrieffer-Heeger lattice. Nat. Commun. 2022, 13, 7000. [Google Scholar] [CrossRef] [PubMed]
- Lu, Q.; Cook, J.; Zhang, X.; Chen, K.Y.; Snyder, M.; Nguyen, D.T.; Sreenivasa Reddy, P.V.; Qin, B.; Zhan, S.; Zhao, L.-D.; et al. Realization of unpinned two-dimensional dirac states in antimony atomic layers. Nat. Commun. 2022, 13, 4603. [Google Scholar] [CrossRef]
- Bauernfeind, M.; Erhardt, J.; Eck, P.; Thakur, P.K.; Gabel, J.; Lee, T.-L.; Schäfer, J.; Moser, S.; Di Sante, D.; Claessen, R.; et al. Design and realization of topological Dirac fermions on a triangular lattice. Nat. Commun. 2021, 12, 5396. [Google Scholar] [CrossRef] [PubMed]
- Guo, C.; Alexandradinata, A.; Putzke, C.; Estry, A.; Tu, T.; Kumar, N.; Fan, F.-R.; Zhang, S.; Wu, Q.; Yazyev, O.V.; et al. Temperature dependence of quantum oscillations from non-parabolic dispersions. Nat. Commun. 2021, 12, 6213. [Google Scholar] [CrossRef]
- Park, H.; Gao, W.; Zhang, X.; Oh, S.S. Nodal lines in momentum space: Topological invariants and recent realizations in photonic and other systems. Nanophotonics 2022, 11, 2779–2801. [Google Scholar] [CrossRef]
- Bai, Y.; Li, N.; Li, R.; Liu, P. Ultrafast dynamics of helical Dirac fermions in the topological insulators. Adv. Physics: X 2022, 7, 2013134. [Google Scholar] [CrossRef]
- Jana, S.; Bandyopadhyay, A.; Datta, S.; Bhattacharya, D.; Jana, D. Emerging properties of carbon based 2D material beyond graphene. J. Phys.: Cond. Mat. 2022, 34, 053001. [Google Scholar] [CrossRef]
- Yilmatz, T.; Tong, X.; Dai, Z.; Sadowski, J.T.; Schwier, E.F.; Shimada, K.; Hwang, S.; Kisslinger, K.; Kaznatcheev, K.; Vescovo, E.; et al. Emergent flat band electronic structure in a VSe2/Bi2Se3 heterostructure. Commun. Mater. 2021, 2, 11. [Google Scholar] [CrossRef]
- Khoury, J.F.; Schoop, L.M. Chemical bonds in topological materials. Trends Chem. 2021, 3, 700–715. [Google Scholar] [CrossRef]
- Kumar, N.; Guin, S.N.; Manna, K.; Shekhar, C.; Felser, C. Topological quantum materials from the viewpoint of chemistry. Chem. Rev. 2021, 121, 2780–2815. [Google Scholar] [CrossRef] [PubMed]
- Bhattacharyya, S.; Akhgar, G.; Gebert, M.; Karel, J.; Edmonds, M.T.; Fuhrer, M.S. Recent progress in proximity coupling of magnetism to topological insulators. Adv. Mater. 2021, 33, 2007795. [Google Scholar] [CrossRef] [PubMed]
- Mandal, I.; Saha, K. Thermopower in an anisotropic two-dimensional Weyl semimetal. Phys. Rev. B 2020, 101, 045101. [Google Scholar] [CrossRef] [Green Version]
- Neubauer, D.; Yaresko, A.; Li, W.; Löhle, A.; Hübner, R.; Schilling, M.B.; Shekhar, C.; Felser, C.; Dressel, M.; Pronin, A.V. Optical conductivity of the Wyle semimetal NbP. Phys. Rev. B 2018, 98, 195203. [Google Scholar] [CrossRef] [Green Version]
- Chen, Z.-G.; Shi, Z.; Yang, W.; Lu, X.; Lai, Y.; Yan, H.; Wang, F.; Zhang, G.; Li, Z. Observation of an intrinsic bandgap and Landau level renormalization in graphene/boron-nitride heterostructures. Nat. Commun. 2014, 5, 4461. [Google Scholar] [CrossRef] [Green Version]
- Timusk, T.; Carbotte, J.P.; Homes, C.C.; Basov, D.N.; Sharapov, S.G. Three-dimensional Dirac fermions in quasicrystals as seen via optical conductivity. Phys. Rev. B 2013, 87, 235121. [Google Scholar] [CrossRef] [Green Version]
- Pop, F.; Mézière, C.; Allain, M.; Auban-Senzier, P.; Tajima, N.; Hirobe, D.; Yamamoto, H.M.; Canadell, E.; Avarvari, N. Unusual stoichiometry, band structure and band filling in conducting enantiopure radical cation salts of TM-BEDT-TTF showing helical packing of the donors. J. Mater. Chem. C 2021, 9, 10777–10786. [Google Scholar] [CrossRef]
- Hirata, M.; Kobayashi, A.; Berthier, C.; Kanoda, K. Interacting chiral electrons at the 2D Dirac points: A review. Rep. Prog. Phys. 2021, 84, 036502. [Google Scholar] [CrossRef]
- Kajita, K.; Nishio, Y.; Tajima, N.; Suzumura, Y.; Kobayashi, A. Molecular Dirac fermion systems –Theoretical and experimental approaches –. J. Phys. Soc. Jpn. 2014, 83, 072002. [Google Scholar] [CrossRef]
- Naito, T.; Doi, R.; Suzumura, Y. Exotic Dirac cones on the band structure of α-STF2I3 at ambient temperature and pressure. J. Phys. Soc. Jpn. 2020, 89, 023701. [Google Scholar] [CrossRef] [Green Version]
- Nomoto, T.; Imajo, S.; Akutsu, H.; Nakazawa, Y.; Kohama, Y. Correlation-driven organic 3D topological insulator with relativistic fermions. Nat. Commun. 2023, 14, 2130. [Google Scholar] [CrossRef] [PubMed]
- Kawasugi, Y.; Masuda, H.; Uebe, M.; Yamamoto, H.M.; Kato, R.; Nishio, Y.; Tajima, N. Pressure-induced phase switching of Shubnikov-de Haas oscillations in the molecular Dirac fermion system a-(BETS)2I3. Phys. Rev. B 2021, 103, 205140. [Google Scholar] [CrossRef]
- Tsumuraya, T.; Suzumura, Y. First-principles study of the effective Hamiltonian for Dirac fermions with spin-orbit coupling in two-dimensional molecular conductor α-(BETS)2I3. Eur. Phys. J. B 2021, 94, 17. [Google Scholar] [CrossRef]
- Kitou, S.; Tsumuraya, T.; Sawahata, H.; Ishii, F.; Hiraki, K.-I.; Nakamura, T.; Katayama, N.; Sawa, H. Ambient-pressure Dirac electron system in the quasi-two-dimensional molecular conductor α-(BETS)2I3. Phys. Rev. B 2021, 103, 035135. [Google Scholar] [CrossRef]
- Naito, T.; Doi, R. Band structure and physical properties of α-STF2I3: Dirac electrons in disordered conduction sheets. Crystals 2020, 10, 270. [Google Scholar] [CrossRef] [Green Version]
- Ohki, D.; Yoshimi, K.; Kobayashi, A. Transport properties of the organic Dirac electron system α-(BEDT-TSeF)2I3. Phys. Rev. B 2020, 102, 235116. [Google Scholar] [CrossRef]
- Uykur, E.; Li, W.; Kuntscher, C.A.; Dressel, M. Optical signatures of energy gap in correlated Dirac fermions. npj Quantum Mater. 2019, 4, 19. [Google Scholar] [CrossRef] [Green Version]
- Hirata, M.; Ishikawa, K.; Matsuno, G.; Kobayashi, A.; Miyagawa, K.; Tamura, M.; Berthier, C.; Kanoda, K. Anomalous spin correlations and excitonic instability of interacting 2D Weyl fermions. Science 2017, 358, 1403–1406. [Google Scholar] [CrossRef] [Green Version]
- Beyer, R.; Dengl, A.; Peterseim, T.; Wackerow, S.; Ivek, T.; Pronin, A.V.; Schweitzer, D.; Dressel, M. Pressure-dependent optical investigations of α−(BEDT-TTF)2I3: Tuning charge order and narrow gap towards a Dirac semimetal. Phys. Rev. B 2016, 93, 195116. [Google Scholar] [CrossRef] [Green Version]
- Hirata, M.; Ishikawa, K.; Miyagawa, K.; Tamura, M.; Berthier, C.; Basko, D.; Kobayashi, A.; Matsuno, G.; Kanoda, K. Observation of an anisotropic Dirac cone reshaping and ferrimagnetic spin polarization in an organic conductor. Nat. Commun. 2016, 7, 12666. [Google Scholar] [CrossRef] [PubMed] [Green Version]
- Liu, D.; Ishikawa, K.; Takehara, R.; Miyagawa, K.; Tamura, M.; Kanoda, K. Insulating nature of strongly correlated massless Dirac fermions in an organic crystal. Phys. Rev. Lett. 2016, 116, 226401. [Google Scholar] [CrossRef] [PubMed] [Green Version]
- Ogata, M.; Ozaki, S.; Matsuura, H. Anomalous Spin Transport Properties of Gapped Dirac Electrons with Tilting. J. Phys. Soc. Jpn. 2022, 91, 023708. [Google Scholar] [CrossRef]
- Suzumura, Y.; Tsumuraya, T. Electric and magnetic responses of two-dimensional Dirac electrons in organic conductor a-(BETS)2I3. J. Phys. Soc. Jpn 2021, 90, 124707. [Google Scholar] [CrossRef]
- Morinari, T.; Suzumura, Y. On the possible zero-gap state in organic conductor a-(BEDT-TSF)2I3 under pressure. J. Phys. Soc. Jpn 2014, 83, 094701. [Google Scholar] [CrossRef]
- Suzumura, Y.; Naito, T. Conductivity of two-dimensional Dirac electrons close to merging in organic conductor a-STF2I3 at ambient pressure. J. Phys. Soc. Jpn. 2022, 91, 064701. [Google Scholar] [CrossRef]
- Oroszlány, L.; Dóra, B.; Cserti, J.; Cortijo, A. Topological and trivial magnetic oscillations in nodal loop semimetals. Phys. Rev. B 2018, 97, 205107. [Google Scholar] [CrossRef] [Green Version]
- Feilhauer, J.; Apel, W.; Schweitzer, L. Merging of the Dirac points in electronic artificial graphene. Phys. Rev. B 2015, 92, 245424. [Google Scholar] [CrossRef] [Green Version]
- Delplace, P.; Gómez-León, A.; Platero, G. Merging of Dirac points and Floquet topological transitions in ac-driven graphene. Phys. Rev B 2013, 88, 245422. [Google Scholar] [CrossRef] [Green Version]
- Dóra, B.; Herbut, I.F.; Moessner, R. Coupling, merging, and splitting Dirac points by electron-electron interaction. Phys. Rev. B 2013, 88, 075126. [Google Scholar] [CrossRef] [Green Version]
- Wang, L.; Fu, L. Interaction-induced merging of Dirac points in non-Abelian optical lattices. Phys. Rev. A 2013, 87, 053612. [Google Scholar] [CrossRef] [Green Version]
- Tarruell, L.; Greif, D.; Uehlinger, T.; Jotzu, G.; Esslinger, T. Creating, moving and merging Dirac points with a Fermi gas in a tunable honeycomb lattice. Nature 2012, 483, 302–305. [Google Scholar] [CrossRef] [PubMed] [Green Version]
- Montambaux, G.; Piéchon, F.; Fuchs, J.-N.; Goerbig, M.O. A universal Hamiltonian for motion and merging of Dirac points in a two-dimensional crystal. Eur. Phys. J. B 2009, 72, 509–520. [Google Scholar] [CrossRef] [Green Version]
- Pereira, V.M.; Castro Neto, A.H.; Peres, N.M.R. Tight-binding approach to uniaxial strain in graphene. Phys. Rev. B 2009, 80, 045401. [Google Scholar] [CrossRef] [Green Version]
- Naito, T.; Kobayashi, H.; Kobayashi, A. The electrical behavior of charge-transfer salts based on an unsymmetrical donor bis(ethylenedithio)diselenadithiafulvalene (STF): Disorder effect on the transport properties. Bull. Chem. Soc. Jpn. 1997, 70, 107–114. [Google Scholar] [CrossRef]
- Inokuchi, M.; Tajima, H.; Kobayashi, A.; Ohta, T.; Kuroda, H.; Kato, R.; Naito, T.; Kobayashi, H. Electrical and optical properties of α-(BETS)2I3 and α-(BEDT-STF)2I3. Bull. Chem. Soc. Jpn. 1995, 68, 547–553. [Google Scholar] [CrossRef]
- Kato, R.; Kobayashi, H.; Kobayashi, A. Synthesis and properties of bis(ethylenedithio)tetraselenafulvalene (BEDT-TSeF) compounds. Synth. Met. 1991, 42, 2093–2096. [Google Scholar] [CrossRef]
- Bender, K.; Hennig, I.; Schweitzer, D.; Dietz, K.; Endres, H.; Keller, H.J. Synthesis, structure and physical properties of a two-dimensional organic metal, di[bis(ethylenedithiolo)tetrathiofulvalene]triiodide, (BEDT-TTF)2+I3−. Mol. Cryst. Liq. Cryst. 1984, 108, 359–371. [Google Scholar] [CrossRef] [Green Version]
- Kakiuchi, T.; Wakabayashi, Y.; Sawa, H.; Takahashi, T.; Nakamura, T. Charge ordering in a-(BEDT-TTF)2I3 by synchrotron X-ray diffraction. J. Phys. Soc. Jpn. 2007, 76, 113702. [Google Scholar] [CrossRef] [Green Version]
- Rothaemel, B.; Forró, L.; Cooper, J.R.; Schilling, J.S.; Weger, M.; Bele, P.; Brunner, H.; Schweitzer, D.; Keller, H.J. Magnetic susceptibility of α and β phases of di[bis(ethylenedithiolo)tetrathiafulvalene]tri-iodide [(BEDT-TTF)2I3] under pressure. Phys. Rev. B 1986, 34, 704–712. [Google Scholar] [CrossRef]
- Tajima, N.; Tamura, M.; Nishio, Y.; Kajita, K.; Iye, Y. Transport property of an organic conductor a-(BEDT-TTF)2I3 under high pressure—Discovery of a novel type of conductor. J. Phys. Soc. Jpn. 2000, 69, 543–551. [Google Scholar] [CrossRef]
- Ivek, T.; Korin-Hamzić, B.; Milat, O.; Tomić, S.; Clauss, C.; Drichko, N.; Schweitzer, D.; Dressel, M. Electrodynamic response of the charge ordering phase: Dielectric and optical studies of α-(BEDT-TTF)2I3. Phys. Rev. B 2011, 83, 165128. [Google Scholar] [CrossRef] [Green Version]
- Venturini, E.L.; Azevedo, L.J.; Schirber, J.E.; Williams, J.M.; Wang, H.H. ESR study of two phases of di[bis(ethylenedithio)tetrathiafulvalene]triiodide [(BEDT-TTF)2I3]. Phys. Rev. B 1985, 32, 2819–2823. [Google Scholar] [CrossRef] [PubMed]
- Sugano, T.; Saito, G.; Kinoshita, M. Conduction-electron-spin resonance in organic conductors: α and β phases di[bis(ethylenedithio)tetrathiafulvalene]triiodide [(BEDT-TTF)2I3]. Phys. Rev. B 1986, 34, 117–125. [Google Scholar] [CrossRef] [PubMed]
- Uji, S.; Kodama, K.; Sugii, K.; Takahide, Y.; Terashima, T.; Kurita, N.; Tsuchiya, S.; Kohno, M.; Kimata, M.; Yamamoto, K.; et al. Kosterlitz-Thouless-type transition in a charge ordered state of the layered organic conductor a-(BEDT-TTF)2I3. Phys. Rev. Lett. 2013, 110, 196602. [Google Scholar] [CrossRef] [PubMed]
- Seo, H. Charge ordering in organic ET compounds. J. Phys. Soc. Jpn. 2000, 69, 805–820. [Google Scholar] [CrossRef] [Green Version]
- Seo, H.; Merino, J.; Yoshioka, H.; Ogata, M. Theoretical aspects of charge ordering in molecular conductors. J. Phys. Soc. Jpn. 2006, 75, 051009. [Google Scholar] [CrossRef] [Green Version]
- Takano, Y.; Hiraki, K.; Yamamoto, H.M.; Nakamura, T.; Takahashi, T. Charge disproportionation in the organic conductor, α-(BEDT-TTF)2I3. J. Phys. Chem. Solids 2001, 62, 393–395. [Google Scholar] [CrossRef]
- Yamamoto, K.; Kowalska, A.A.; Yakushi, K. Direct observation of ferroelectric domains created by Wigner crystallization of electrons in α-[Bis (ethylenedithio) tetrathiafulvalene]2I3. Appl. Phys. Lett. 2010, 96, 122901. [Google Scholar] [CrossRef]
- Kondo, R.; Kagoshima, S. Crystal and electronic structures of a-(BEDT-TTF)2I3 under uniaxial strains. J. Phys. IV France 2004, 114, 523–525. [Google Scholar] [CrossRef]
- Kondo, R.; Kagoshima, S.; Harada, J. Crystal structure analysis under uniaxial strain at low temperature using a unique design of four-axis x-ray diffractometer with a fixed sample. Rev. Sci. Instrum. 2005, 76, 093902. [Google Scholar] [CrossRef]
- Ishibashi, S.; Tamura, T.; Kohyama, M.; Terakura, K. Ab initio electronic-structure calculations for a-(BEDT-TTF)2I3. J. Phys. Soc. Jpn. 2006, 75, 015005. [Google Scholar] [CrossRef]
- Naito, T.; Suzumura, Y. Theoretical model for novel electronic state in a Dirac electron system close to merging: An imaginary element between sulfur and selenium. Crystals 2022, 12, 346. [Google Scholar] [CrossRef]
- Kino, H.; Miyazaki, T. First-Principles Study of Electronic Structure in a-(BEDT-TTF)2I3 at Ambient Pressure and with Uniaxial Strain. J. Phys. Soc. Jpn. 2006, 75, 034704. [Google Scholar] [CrossRef] [Green Version]
- Monteverde, M.; Goerbig, M.O.; Auban-Senzier, P.; Navarin, F.; Henck, H.; Pasquier, C.R.; Mézière, C.; Batail, P. Coexistence of Diarc and massive carriers in a-(BEDT-TTF)2I3 under hydrostatic pressure. Phys. Rev. B 2013, 87, 245110. [Google Scholar] [CrossRef] [Green Version]
- Katayama, S.; Kobayashi, A.; Suzumura, Y. Pressure-induced zero-gap semiconducting state in organic conductor a-(BEDT-TTF)2I3 salt. J. Phys. Soc. Jpn. 2006, 75, 054705. [Google Scholar] [CrossRef] [Green Version]
- Naito, T.; Inabe, T. Molecular hexagonal perovskite: A new type of organic–inorganic hybrid conductor. J. Solid State Chem. 2003, 176, 243–249. [Google Scholar] [CrossRef]
- Naito, T.; Matsuo, S.; Inabe, T.; Toda, Y. Carrier dynamics in a series of organic magnetic superconductors. J. Phys. Chem. C 2012, 116, 2588–2593. [Google Scholar] [CrossRef] [Green Version]
- Dolomanov, O.V.; Bourhis, L.J.; Gildea, R.J.; Howard, J.A.K.; Puschmann, H. OLEX2: A complete structure solution, refinement and analysis program. J. Appl. Cryst. 2009, 42, 339–341. [Google Scholar] [CrossRef]
- Kresse, G.; Hafner, J. Ab initio molecular dynamics for liquid metals. Phys. Rev. B 1993, 47, 558–561. [Google Scholar] [CrossRef]
- Mochalin, V.N.; Shenderova, O.; Ho, D.; Gogotsi, Y. The properties and applications of nanodiamonds. Nat. Nanotechnol. 2012, 7, 11–23. [Google Scholar] [CrossRef] [PubMed]
- Pouget, J.-P.; Alemany, P.; Canadell, E. Donor-anion interactions in quarter-filled low-dimensional organic conductors. Mater. Horiz. 2018, 5, 590–640. [Google Scholar] [CrossRef] [Green Version]
- Alemany, P.; Pouget, J.-P.; Canadell, E. Essential role of anions in the charge ordering transition of a-(BEDT-TTF)2I3. Phys. Rev. B 2012, 85, 195118. [Google Scholar] [CrossRef]
- Ivek, T.; Čulo, M.; Kuveždić, M.; Tutiš, E.; Basletić, M.; Mihaljević, B.; Tafra, E.; Tomić, S.; Löhle, A.; Dressel, M.; et al. Semimetallic and charge-ordered a-(BEDT-TTF)2I3: On the role of disorder in dc transport and dielectric properties. Phys. Rev. B 2017, 96, 075141. [Google Scholar] [CrossRef] [Green Version]
- Kim, A.S.; Walter, A.L.; Moreschini, L.; Seyller, T.; Horn, K.; Rotenberg, E.; Bostwick, A. Coexisting massive and massless Dirac fermions in symmetry-broken bilayer graphene. Nat. Mater. 2013, 12, 887–892. [Google Scholar] [CrossRef] [Green Version]
- Zhou, B.; Dong, S.; Wang, X.; Zhang, K. Prediction of two-dimensional d-block elemental materials with normal honeycomb, triangular-dodecagonal, and square-octagonal structures from first principles. Appl. Surf. Sci. 2017, 419, 484–496. [Google Scholar] [CrossRef]
- Yuan, X.; Yan, Z.; Song, C.; Zhang, M.; Li, Z.; Zhang, C.; Liu, Y.; Wang, W.; Zhao, M.; Lin, Z.; et al. Chiral Landau levels in Wyle semimetal NbAs with multiple topological carriers. Nat. Commun. 2018, 9, 1854. [Google Scholar] [CrossRef]
- Luyang, W.; Dao-Xin, Y. Coexistence of spin-1 fermion and Dirac fermion on the triangular kagome lattice. Phys. Rev. B 2018, 98, 161403. [Google Scholar] [CrossRef] [Green Version]
- Miyazaki, T.; Kino, H. Atomic and electronic structures of the high-pressure superconductor b'-(BEDT-TTF)2ICl2: A first-principles study of the pressure effects. Phys. Rev. B 2003, 68, 220511. [Google Scholar] [CrossRef]
- Miyazaki, T.; Kino, H. First-principles study of the pressure effects on b'-(BEDT-TTF)2AuCl2. Phys. Rev. B 2006, 73, 035107. [Google Scholar] [CrossRef]
- Fujiyama, S.; Maebashi, H.; Tajima, N.; Tsumuraya, T.; Cui, H.-B.; Ogata, M.; Kato, R. Large diamagnetism and electromagnetic duality in two-dimensional Dirac electron system. Phys. Rev. Lett. 2022, 128, 027201. [Google Scholar] [CrossRef] [PubMed]
- Coulon, C.; Clérac, R. Electron spin resonance: A major probe for molecular conductors. Chem. Rev. 2004, 104, 5655–5687. [Google Scholar] [CrossRef] [PubMed]


Disclaimer/Publisher’s Note: The statements, opinions and data contained in all publications are solely those of the individual author(s) and contributor(s) and not of MDPI and/or the editor(s). MDPI and/or the editor(s) disclaim responsibility for any injury to people or property resulting from any ideas, methods, instructions or products referred to in the content. |
© 2023 by the authors. Licensee MDPI, Basel, Switzerland. This article is an open access article distributed under the terms and conditions of the Creative Commons Attribution (CC BY) license (https://creativecommons.org/licenses/by/4.0/).
Share and Cite
Oka, R.; Ohara, K.; Konishi, K.; Yamane, I.; Shimada, T.; Naito, T. Band Structure Evolution during Reversible Interconversion between Dirac and Standard Fermions in Organic Charge-Transfer Salts. Magnetochemistry 2023, 9, 153. https://doi.org/10.3390/magnetochemistry9060153
Oka R, Ohara K, Konishi K, Yamane I, Shimada T, Naito T. Band Structure Evolution during Reversible Interconversion between Dirac and Standard Fermions in Organic Charge-Transfer Salts. Magnetochemistry. 2023; 9(6):153. https://doi.org/10.3390/magnetochemistry9060153
Chicago/Turabian StyleOka, Ryuhei, Keishi Ohara, Kensuke Konishi, Ichiro Yamane, Toshihiro Shimada, and Toshio Naito. 2023. "Band Structure Evolution during Reversible Interconversion between Dirac and Standard Fermions in Organic Charge-Transfer Salts" Magnetochemistry 9, no. 6: 153. https://doi.org/10.3390/magnetochemistry9060153