1. Introduction
The fast-paced advancements in electronic devices, information technology, wearable devices, and 5G technology have significantly increased electromagnetic interference (EMI) and radiation pollution [
1]. This has required developing new materials with advanced shielding capabilities to reduce the effects of EMI. Developing this kind of material aims to increase the security of sensitive devices or systems that can be susceptible to EMI. Moreover, new advanced materials must ensure the protection of human health to reduce the risk of problems derived from exposure to electromagnetic radiation. Consequently, there is a high demand for advanced materials that can significantly address the challenges posed by EMI.
The investigation of lightweight EMI shielding materials will allow the possibility of increasing safety in 5G communications. When it comes to shielding materials, one of the most determining parameters for the application of the material is shielding effectiveness (SE). The SE indicates the attenuation intensity experimented by an electromagnetic wave traveling through a medium, A, after interacting with a medium, B (shield).
Magnetic materials, which are the main ones responsible for magnetic losses, achieve electromagnetic wave (EMW) absorption through magnetic hysteresis loss, eddy current effects, and ferromagnetic resonance [
2,
3,
4]. Ferrites are widely used as EMW absorbers due to their high magnetic permeability, saturation magnetization (Ms), and resistivity (Ω), as well as a significant flexibility that allows the modification of their chemical composition to adapt their magnetic properties to specific applications [
5,
6,
7]. A recent study evaluated the efficiency of magnetostatic protection using nanostructured permalloy shielding coatings, demonstrating their potential for enhancing the shielding efficiency of electronic devices achieving a maximum SE value of 29 dB [
8]. On the other hand, carbonaceous materials (e.g., carbon nanotubes (CNT), MXenes, or graphene foams) are excellent candidates for enhancing the absorption of the incident EMW due to their interesting electromagnetic and molecular properties, such as a unique combination of high conductivity and low density [
9,
10]. Specifically, multi-walled carbon nanotubes (MWCNTs) possess a shielding effect against EMI owing to their conductivity and unique internal porous structure and morphology. Consequently, they are an excellent and cost-effective choice for the primary material in composites. Moreover, the availability of specific heteroatomic groups in MWCNTs makes them suitable for convenient modification in subsequent applications. The combination of high conductivity and the presence of numerous internal interfaces because of either their porous structure or molecular arrangement enhances the dielectric loss through interfacial polarization. This also introduces an additional absorption mechanism based on multiple reflections, consisting of the continuous reflection of the incident wave in the different interfaces of the particle; thus, enhancing the attenuation of the EMW reflections [
9,
11]. The dispersion of carbonaceous particles in a polymer matrix, either thermoplastic or thermosetting, entails the improvement of the SE capabilities of the matrix [
12] This allows the obtaining of specific compounds for lightweight applications overcoming the limitations of metals in terms of high density and corrosion susceptibility. Increasing the content of carbonaceous particles was found to have a positive effect on the SE of the resulting compound, achieving a maximum absorption of −38 dB in the X-band with 5% wt MWCNTs [
13] and −66 dB for a polystyrene (PS) compound containing 20% wt MWCNT obtained via compression molding [
14].
However, further increasing the content of carbon fillers also entails the increment of the compound viscosity and, therefore, hinders its processability, as noted in [
15]. Fiber-reinforced polymer (FRP) composite materials are characterized by their heterogeneity and anisotropy, which imparts to them the property of not exhibiting plastic deformation. FRP composites have found widespread use in a diverse range of contemporary applications, such as space, aviation, and automotive. Carbon-fiber-reinforced polymer (CFRP) and glass-fiber-reinforced polymer (GFRP) composite materials, among other fiber-reinforced materials, have gained increasing popularity due to their outstanding strength and low specific weight properties, leading them to replace conventional materials in various applications [
16]. The use of CFRP is a prominent alternative to address the manufacturing problems derived from the use of particle-based composites [
17]. Although recent studies have demonstrated the feasibility of using woven prepreg laminates to produce shielding effectiveness of more than 100 dB at low frequencies (<1 GHz) [
18], the specific contribution of each type of shielding mechanism and the effect of the typology of the fibers at higher frequencies remains an open question. Suitable compositions and orientation of fibers made desired properties and functional characteristics of some GFRP composites equal to steel, had higher stiffness than aluminum, and the specific gravity was one-quarter of the steel [
19]. Martinez et al. performed SE measurements in the frequency range of 300 kHz–8 GHz on GF composites in combination with different conductive materials, such as MWCNT and copper mesh, reporting an attenuation of approximately −40 dB up to 1.5 GHz for the copper mesh case [
20]. Another study investigated the EMI shielding performance of carbon-nanomaterial-embedded fiber-reinforced polymer composites, revealing that the EMI shielding effectiveness of the composites was significantly improved with the addition of carbon nanomaterials. A sample with 3% CNT-GNP CFRP composition demonstrated an EMI shielding effectiveness higher than 15 dB [
21].
To evaluate the suitability of these novel shielding materials for integration into a 5G system or other high-frequency applications, it is necessary to perform a characterization of their SE. Due to the wide variety of applications and shapes that a shielding material can adopt, this is generally characterized as a planar material. Depending on the frequency range where the material will operate, there are various measurement methods to determine their shielding effectiveness. Currently, the most widely used standard for measuring the effectiveness of shielding of planar materials is the ASTM D4935-18 standard [
22]. However, this standard is limited in frequency to 1.5 GHz, making it significantly restricted when considering 5G technology that operates at much higher frequencies. Alternative measurement methods based on free-space measurements, such as the IEEE 299 standard, are available but are hindered by the complexity of measurement due to the dimensions of the material sample required and the infrastructure required to perform the measurements [
23]. Considering these limitations, alternative measurement methods derived from existing standards are currently being developed to address these issues.
In this work, the proposed measurement method is based on an absorbing box that overcomes the limitations that standard methods present. This method eliminates the sample size and mechanization issue, as it does not require a sample that is either too large or too small. Additionally, it makes it possible to measure in a frequency range that goes further than the region defined by the method presented in the ASTM D4935-18 standard. Furthermore, this method mitigates the problems of surrounding influences as measurements are taken within a controlled, absorbing environment. The results of EMI shielding effectiveness of the developed samples are reported in the frequency range of 700 MHz–18 GHz, covering the sub-6 GHz band of the 5G spectrum and part of the mmWave band.
This manuscript is organized as follows. First,
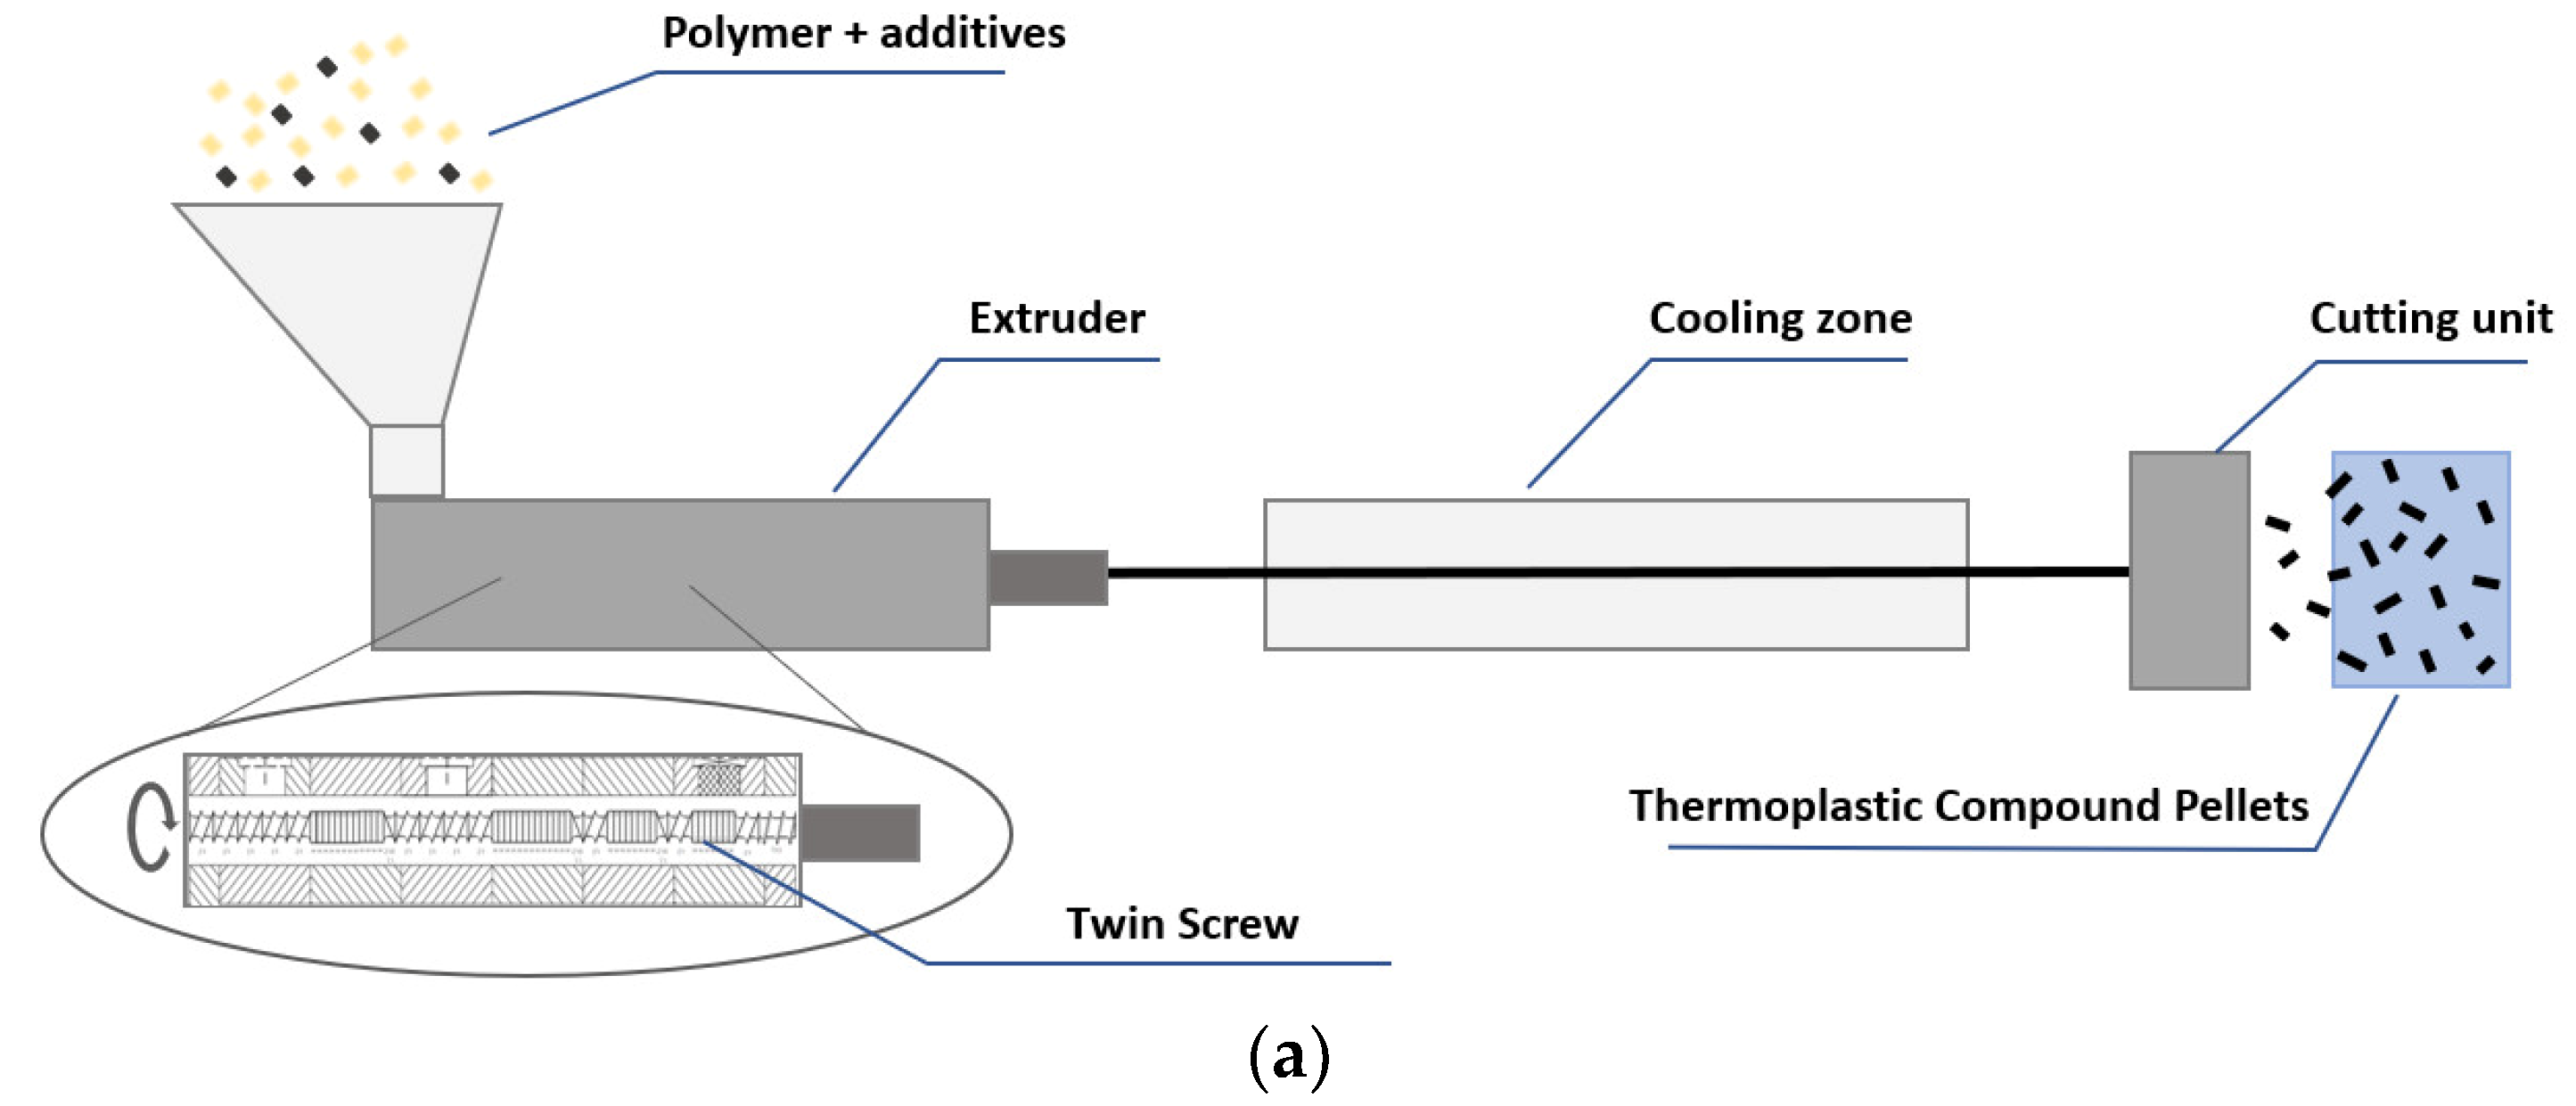
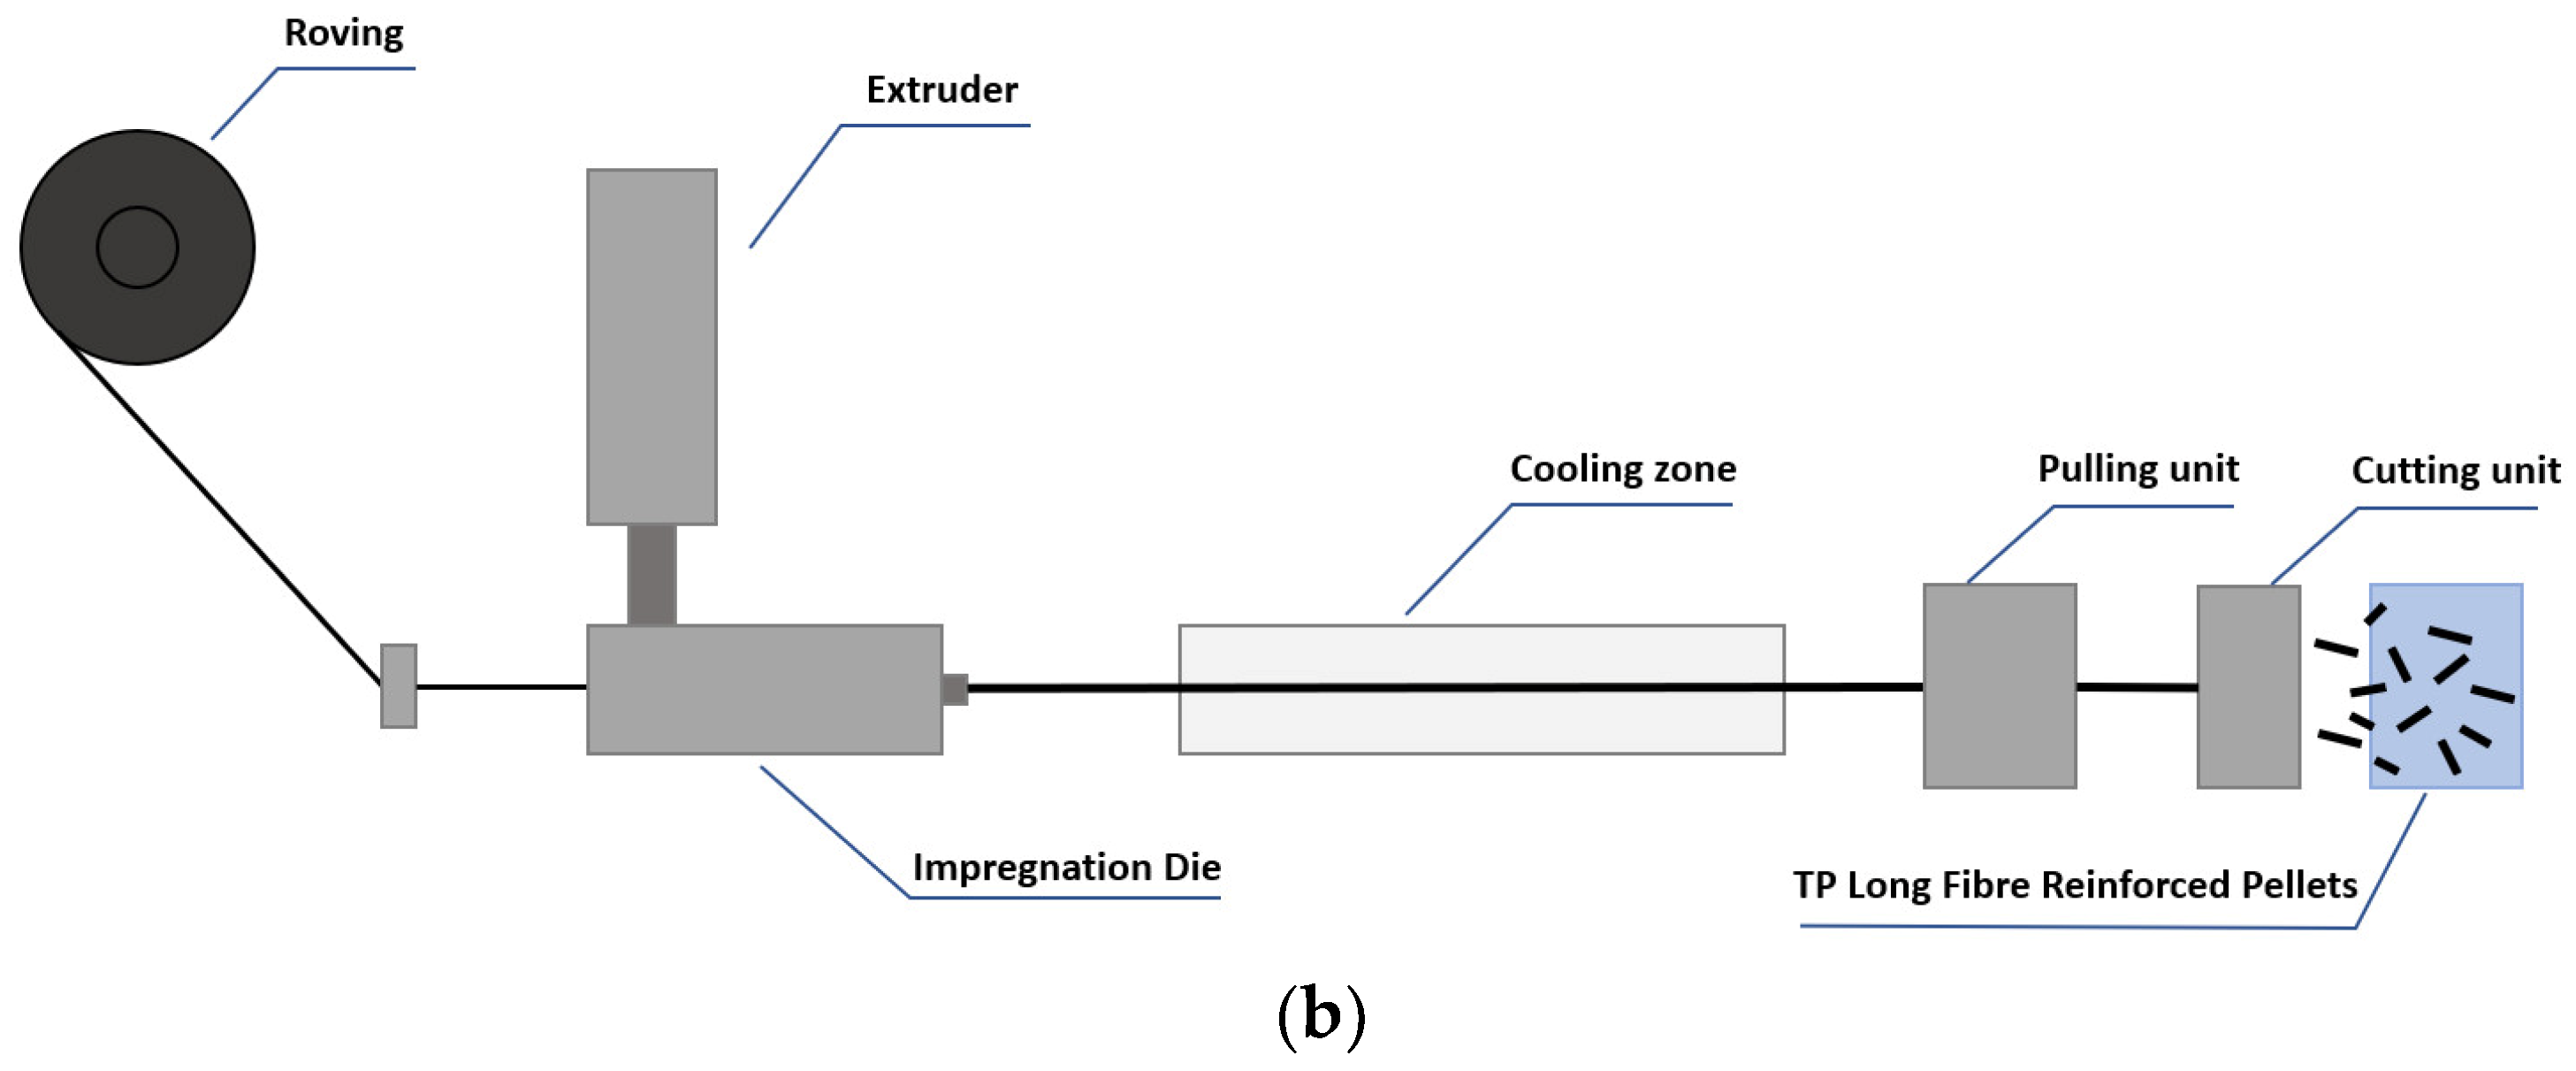
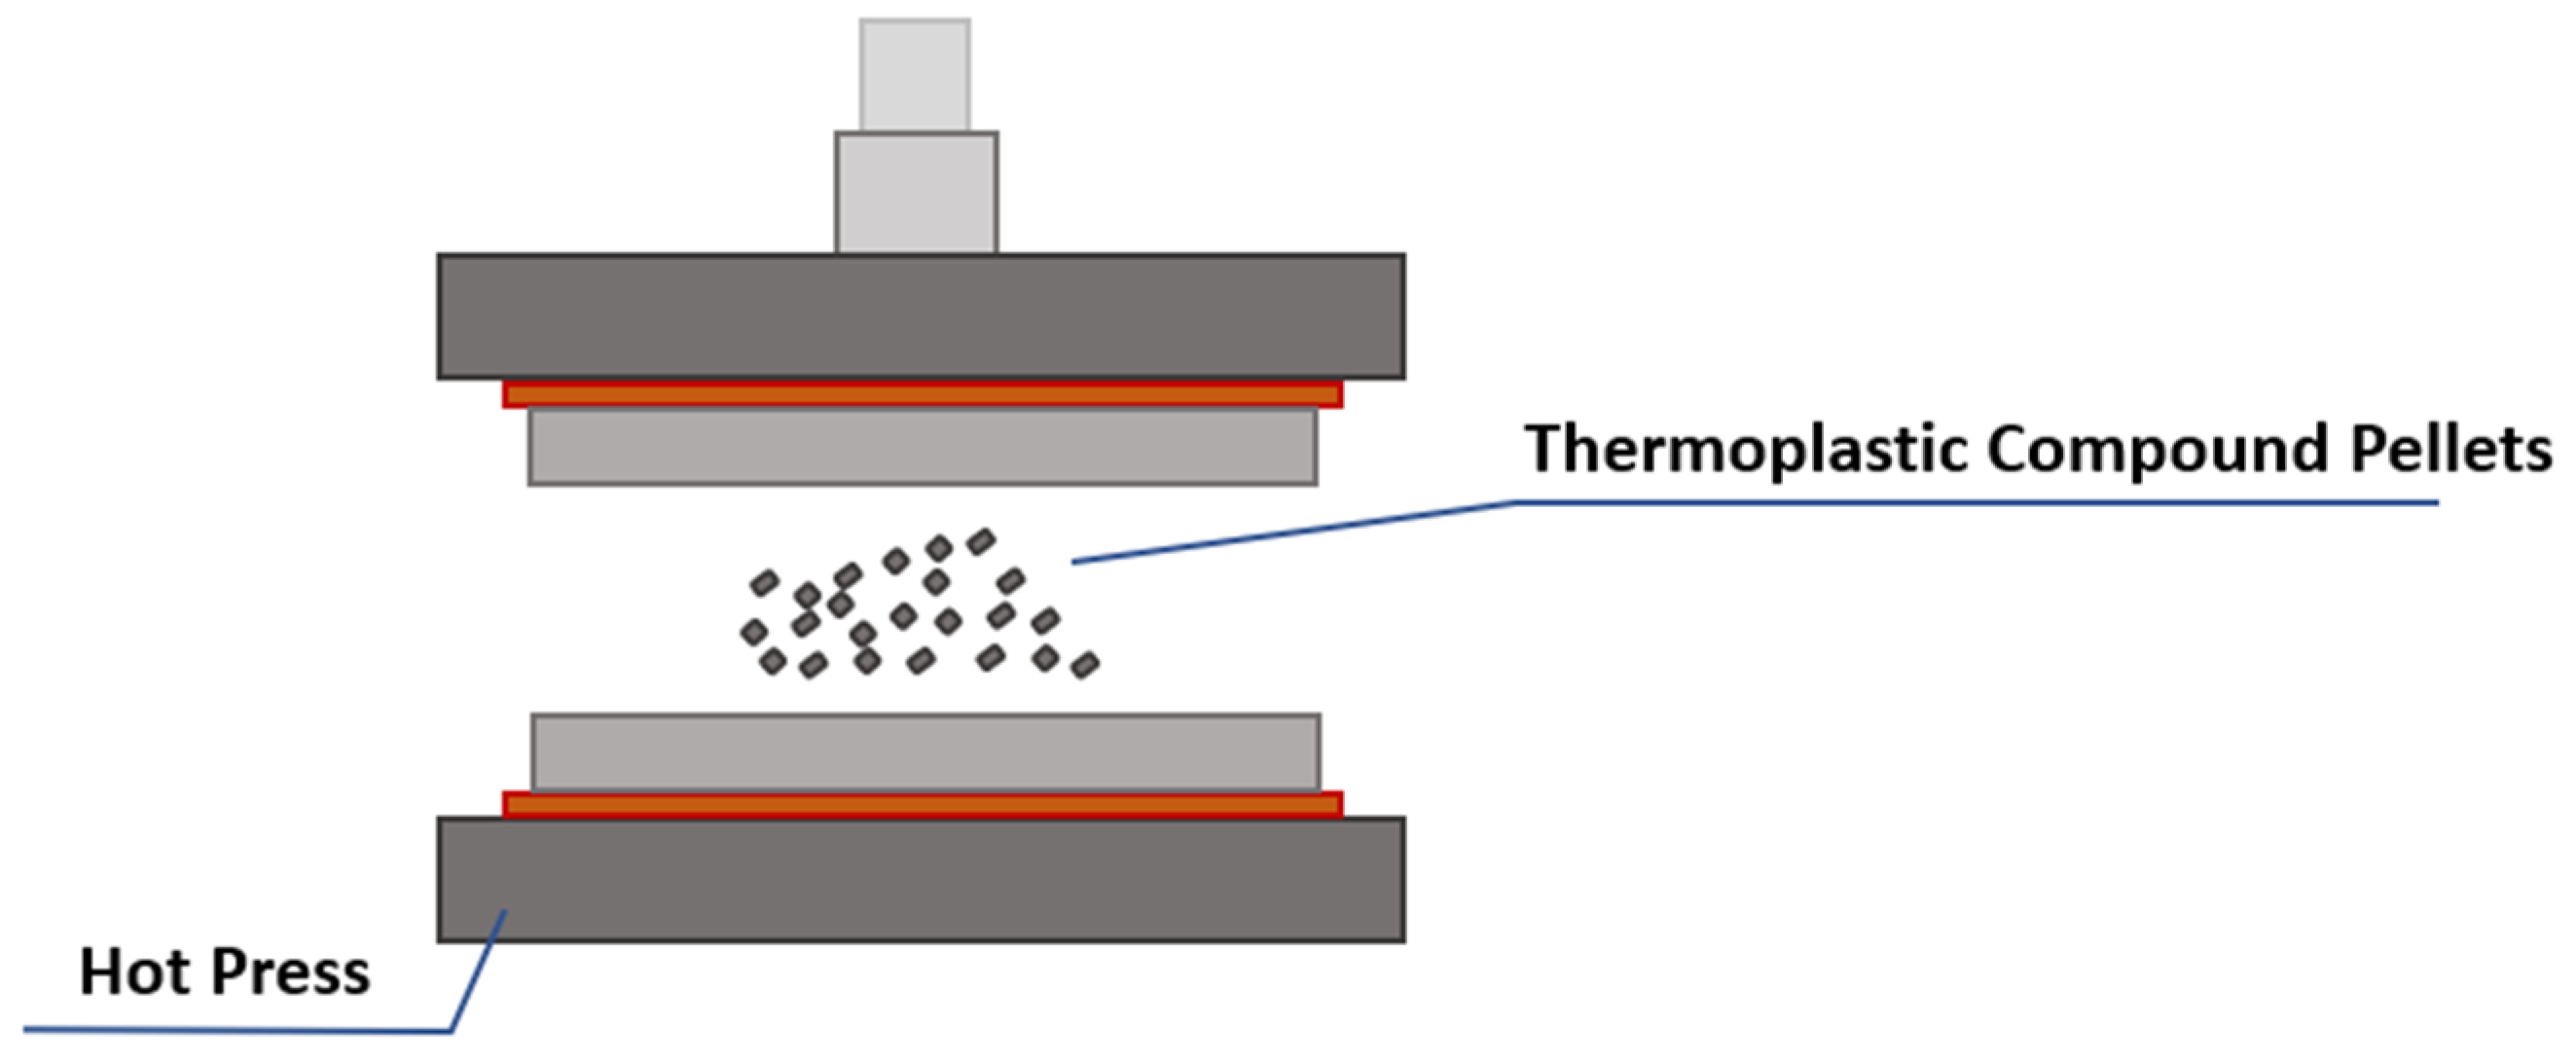
Section 2 describes the manufacturing process of the five samples and their most relevant characteristics.
Section 3 illustrates the main planar material measurement methods. This section also describes the current standard methods, their limitations, and the non-standardized measurement techniques. In this section, it is described the measurement setup to determine the SE of the different samples. Subsequently, the obtained results are presented in
Section 4. This section also discusses the performance of the samples in the entire frequency range in terms of the attenuation that they provide. Finally, the main conclusions obtained in this research are summarized in
Section 5.
3. Planar Material Measurement Methods
The current standard method that defines the measurement procedure to determine the shielding effectiveness of planar materials is the ASTM 4935-18. Nevertheless, the frequency region of this measurement method is limited in frequency (up to 1.5 GHz). Other measurement techniques used to analyze the performance of planar materials are based on the IEEE 299 standard. Due to the wide variety of applications that need to be shielded by using housing with a specific size and shape, planar materials are generally characterized, considering different field conditions. Thereby, depending on the frequency range and the sample features, different measurement techniques may be used to cover the entire frequency range of interest. The 5G operates in a wide range of frequencies. Currently, two different frequency ranges are available for the 5G technology, FR1 and FR2. The bands in the FR1 spectrum are envisaged for the operation of traditional cellular communication, whereas FR2 bands aim to provide short-range very high data rate capability. The 5G FR1 range covers frequencies up to 7.125 GHz, and FR2 encompasses frequencies above 24.5 GHz.
3.1. Standard Measurement Methods
The main techniques for the measurement of the SE of planar materials are based on using mono-mode coaxial TEM cells, according to the standard ASTM D4935-18, or the use of emitting and receiving antennas as in the IEEE 299 standard. The first method has a frequency limit of about 1.5 GHz; the last one applies for higher frequencies, but it requires large sheet samples, which is a disadvantage when dealing with novel materials that rely on rare raw materials. The cost of the shielding particles can be very high, making unfeasible the manufacturing of large-scale samples. Consequently, measuring these materials using a method that requires covering the entire door of an anechoic chamber becomes impractical.
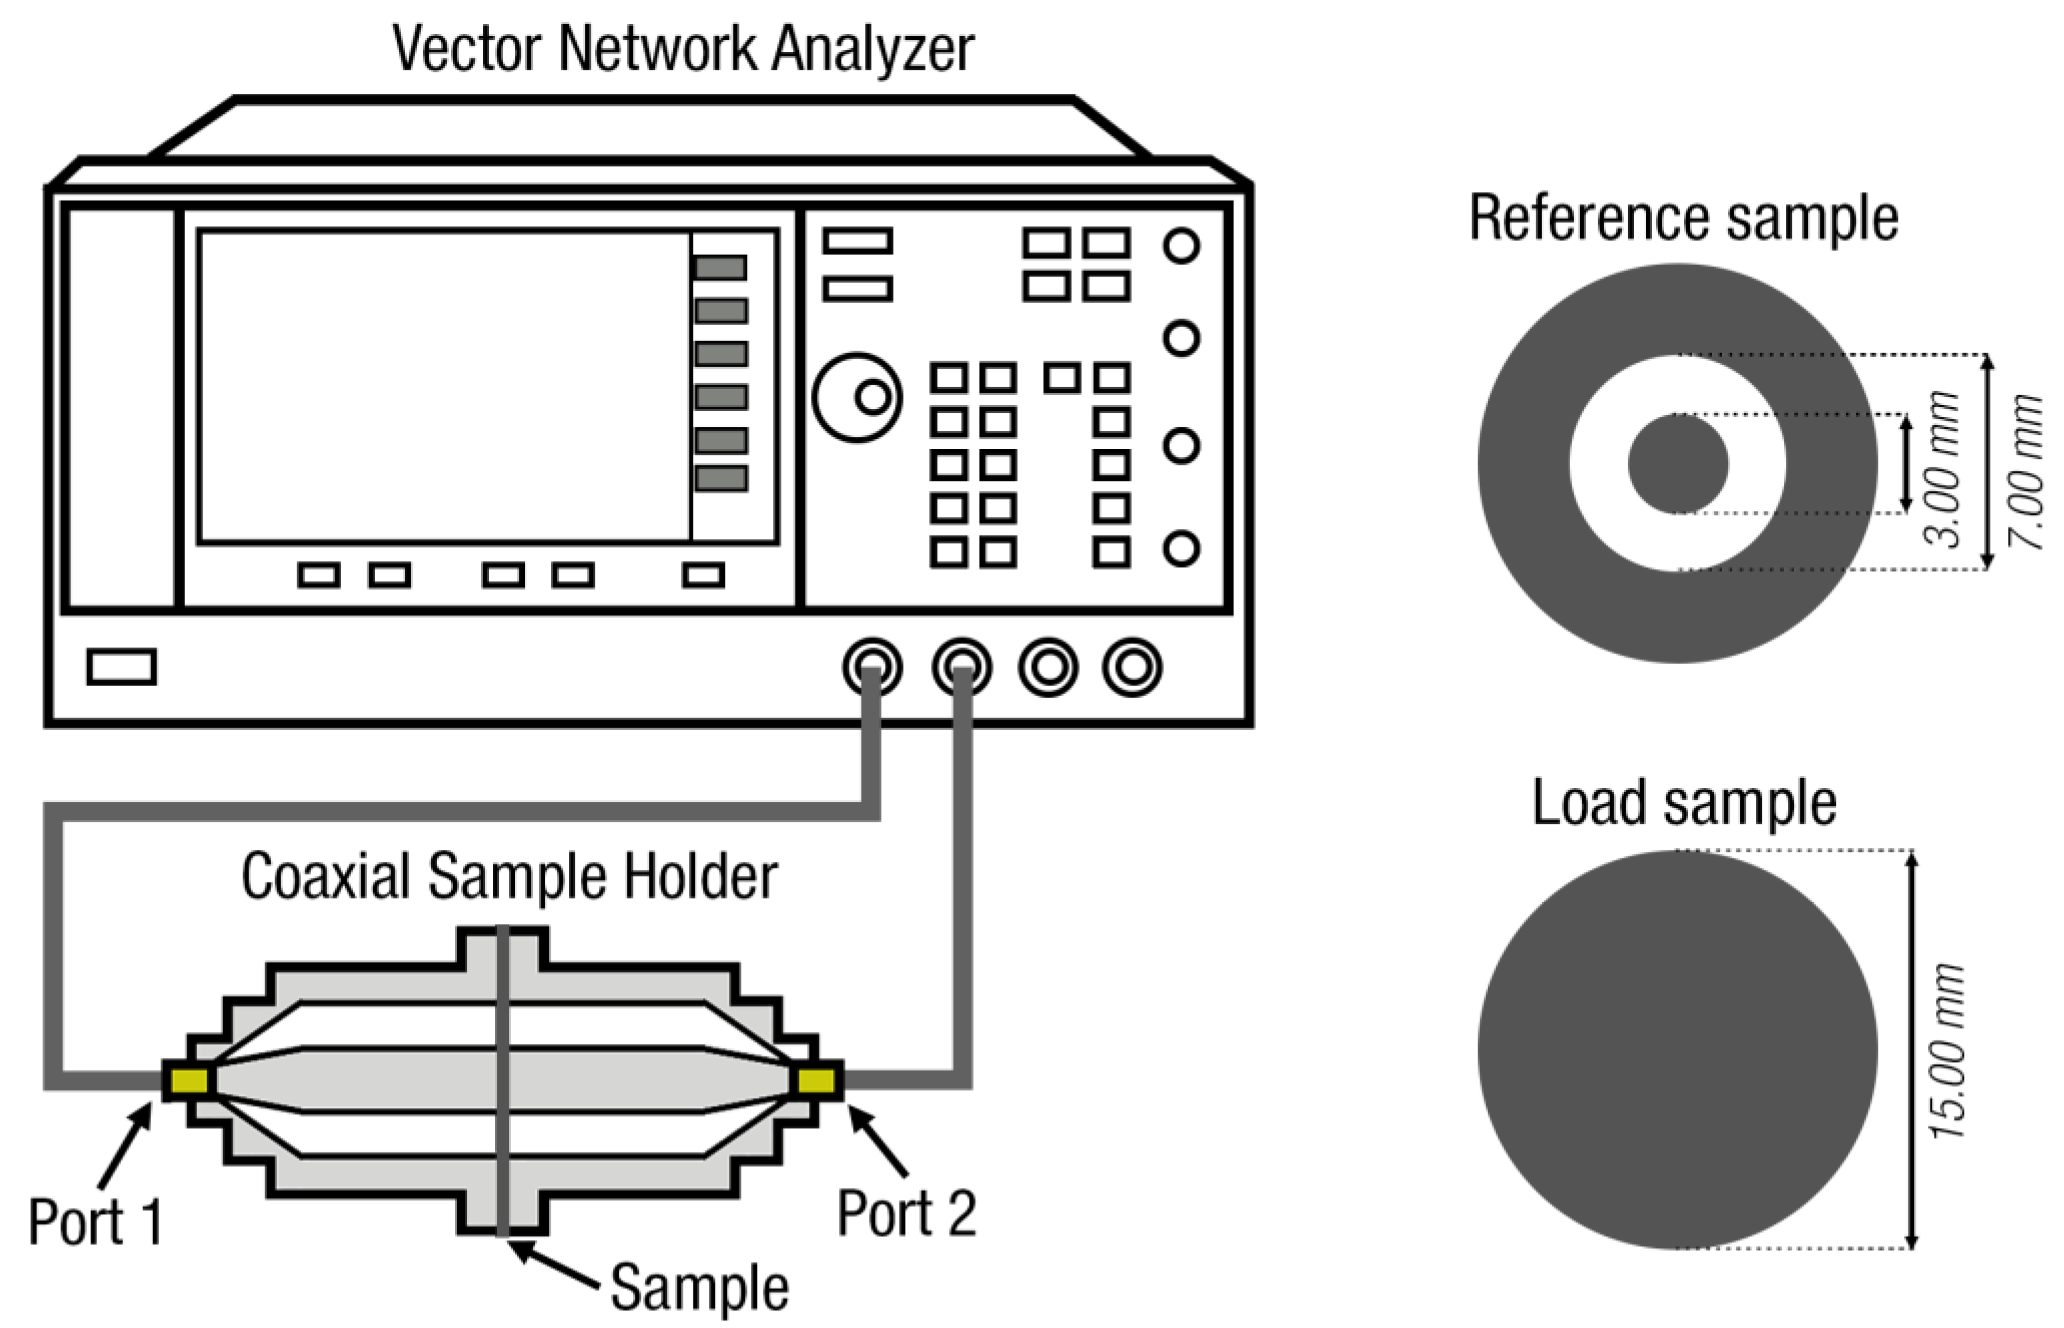
The ASTM D4935-18 is the standard test method for measuring the electromagnetic shielding effectiveness of planar materials. This method allows measuring planar samples in a narrow frequency range from 30 MHz to 1.5 GHz. The technique measures the insertion loss (IL) that results when introducing test samples in a coaxial two-conductor transmission line holder, supporting transverse electromagnetic (TEM) propagation mode. The procedure requires two types of specimens with the same thickness to make SE measurements: the reference and the load specimens (
Figure 5). The difference between the measurements of the load and the reference specimen provides the measurement of the SE, caused by the reflection and absorption of the material between the two flanks of the coaxial probe. The upper-frequency limit that can be measured with this method depends on the cut-off frequency for the transverse electric propagation mode of the coaxial cell holder. At frequencies higher than the cut-off, higher-order modes other than TEM can propagate, changing the field distribution inside the cell and causing resonances in the measured results, which have an adverse effect on the accuracy of the measured results. Therefore, the main disadvantage of the fixture is the narrow frequency band of operation, which is limited, considering the operating frequencies of current electronic devices and systems.
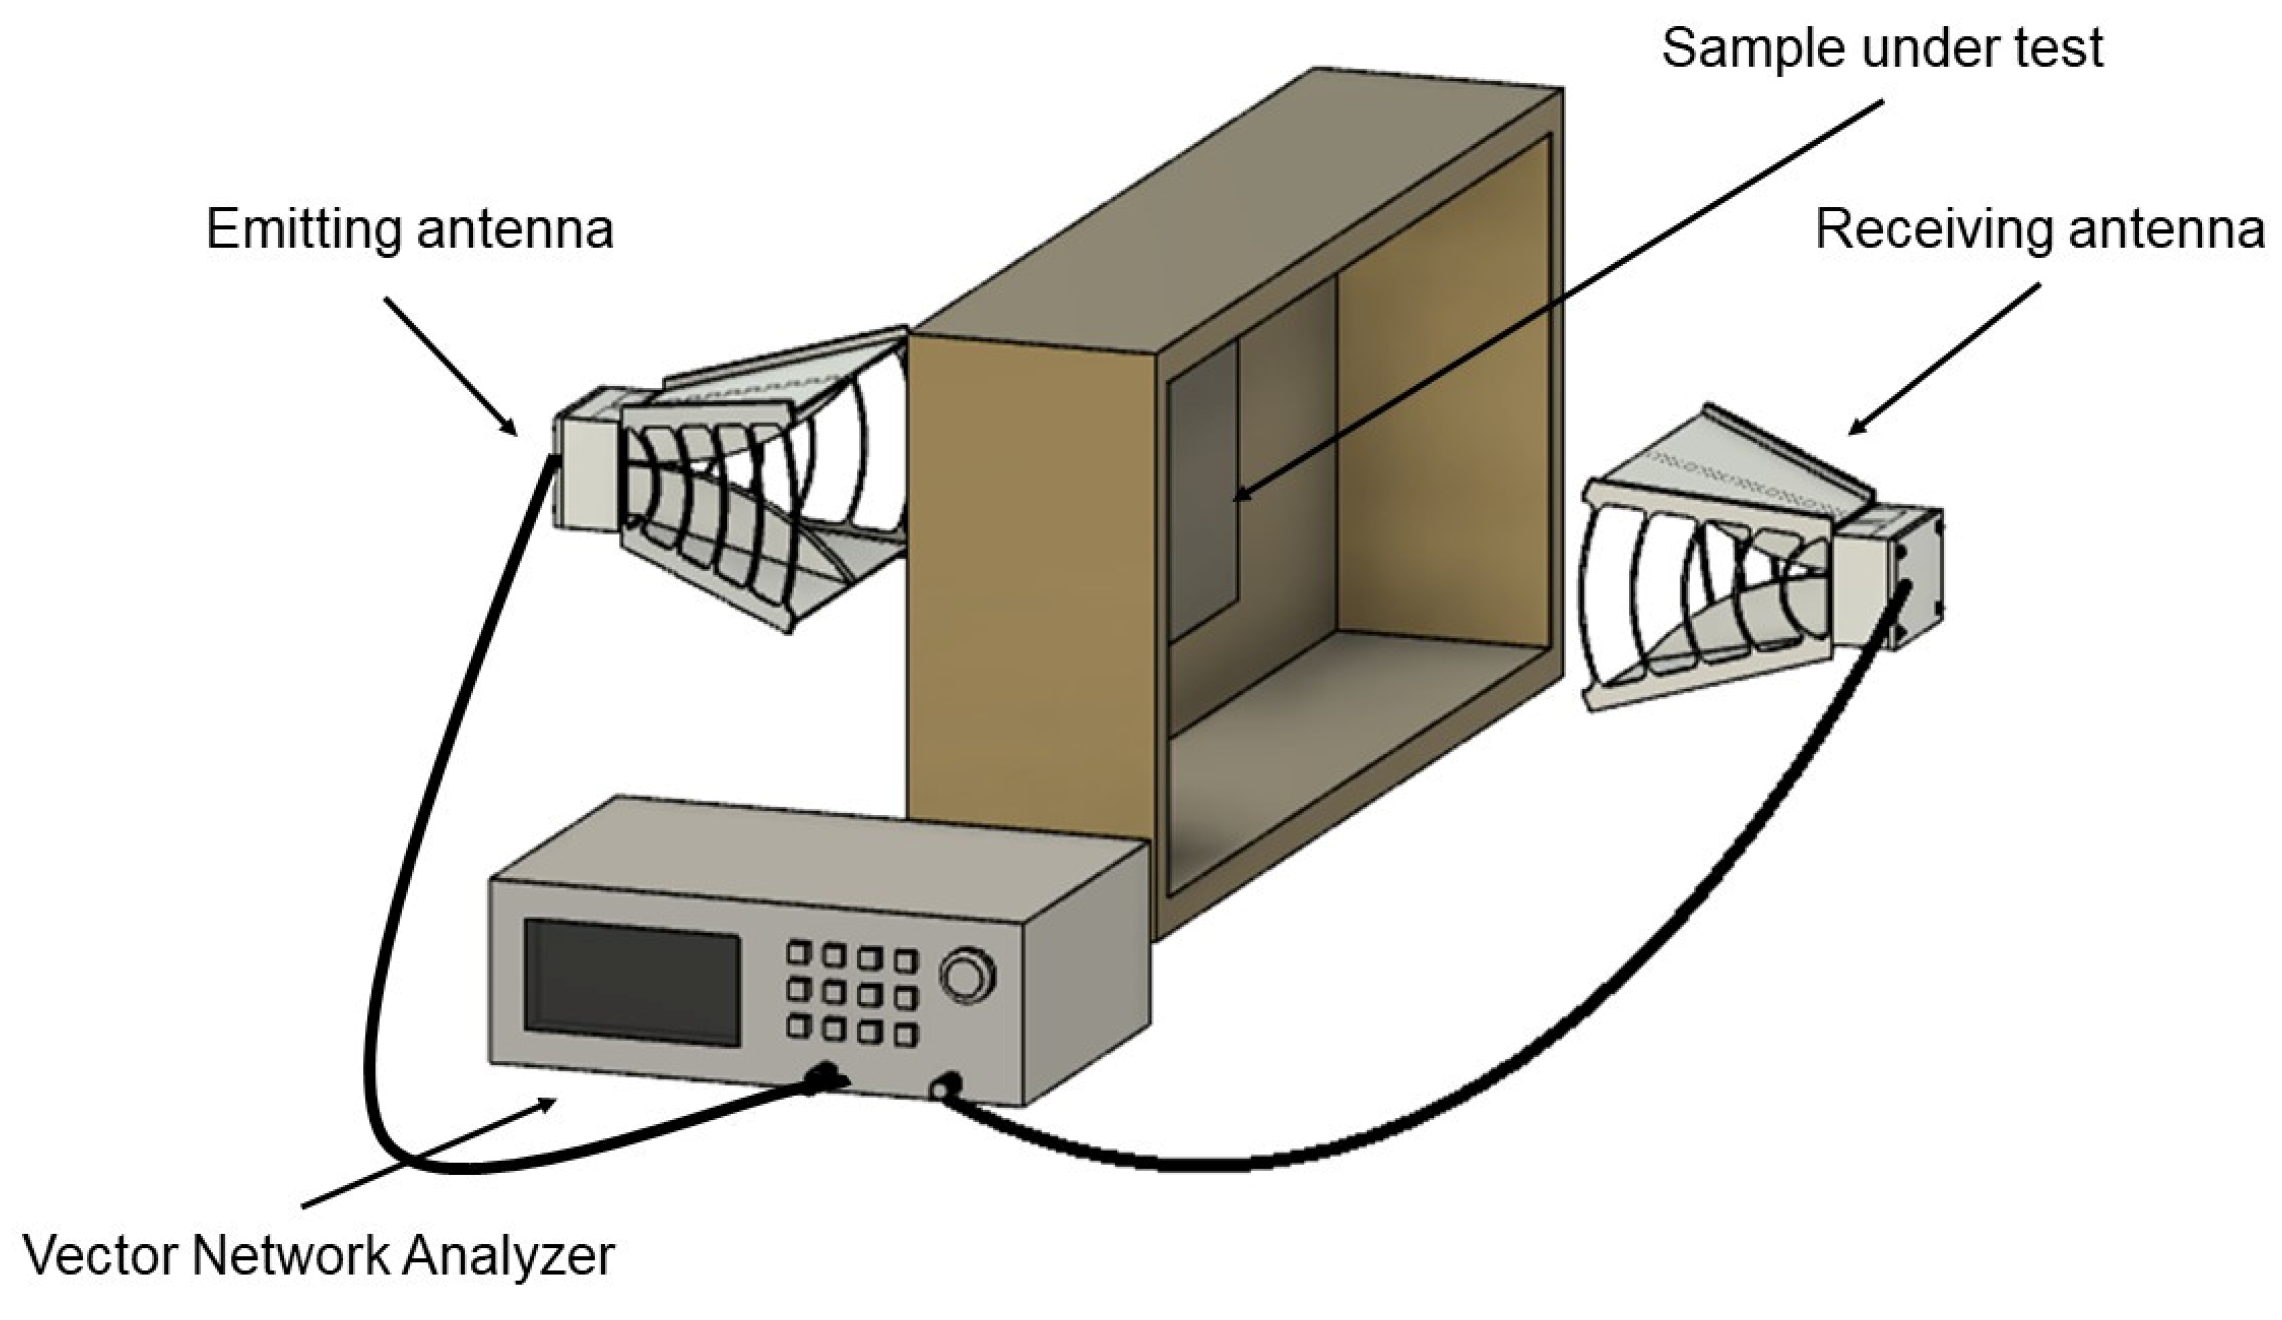
The IEEE 299 standard defines how to measure the effectiveness of electromagnetic shielding enclosures. This method is carried out by placing a sample of the material under test between two antennas connected to a vector network analyzer equipment (VNA) that provides the emitting signal to one of the antennas and receives the field measured by the receiving antenna (
Figure 6). Thereby, it is possible to obtain the shielding effectiveness of the material under test by analyzing the S-parameters obtained through a reference measurement (without the material sample) and a load measurement (by placing the material between the two antennas). The reference can be taken in free space or through an open aperture in an anechoic chamber wall. The SE is obtained by taking the difference between the received field strength (in dB units) with the sample absent and with the sample present. The nature of the illuminating field varies with frequency and the type of antenna used.
To these limitations is added the high influence between the characteristics of the anechoic chamber as well as the proper location/orientation of the antennas and the sample in the space.
3.2. Non-Standardized Measurement Methods
Due to the increase in operating frequencies and the evolution of 5G towards FR2, it is important to develop non-standardized measurement methods through setups, fixtures, and techniques compatible with the operating frequencies of 5G technologies and the samples manufactured.
From the standards, some derivative methods can be highlighted: nested reverberation chambers [
30], vibrating intrinsic reverberation chambers [
31], TEM cell methods [
32], ASTM D4935-18 high-frequency variants [
33,
34,
35], or absorber box methods [
36,
37]. The last one proposes an alternative to free space measurements in an anechoic chamber, where the sample size is significantly reduced, and no complex sample preparation is required. Moreover, the equipment and the sample size determine the cutoff frequency, so the method is considerably adaptable to the type of material to be measured. This alternative also eliminates the main problems that the other techniques present, making this method suitable for this study.
As some bibliographic sources indicate, extending the upper-frequency limit of the ASTM D4935-18 standard could be possible. Some institutions have modified this standard coaxial cell holder to perform SE measurements at higher frequencies and on smaller-size materials under test [
34,
35]. Basically, as the cut-off frequency, and consequently the upper-frequency limit, depends on cell dimensions, new versions of coaxial sample holders can be designed and fabricated, reducing the inner radius of the outer conductor and the radius of the center one.
On the other hand, the measurements based on the IEEE 299 standard are another interesting line of research since they can be performed with RF antennas (inside an anechoic chamber), extending the frequency region defined by the ASTM D4935-18 standard. The upper frequency for IEEE 299 methods is limited by the chamber leakage and the need for the sample to be large enough to minimize edge diffraction effects. Nevertheless, test-to-test variations arise from normal differences between instruments, from discrepancies between transmitting and receiving antennas, including their positions, and primarily from differences between test techniques. Most of the methods based on free space require sample dimensions too large, in addition to being strongly conditioned by the environmental conditions and the directivity of the antennas. Consequently, the proposed alternative method is based on an EMI absorber box lined with absorbent material and two antennas: one transmitter and one receiver.
3.3. Proposed Shielding Effectiveness Measurement System
The proposed measurement method is an adaptation of one of the methods included in the P2715 standard, a guide for the characterization of the shielding effectiveness of planar materials. This method provides the SE of planar materials, adapting to the specific requirements of the study. The main advantage is that the sample machining is simple, which represents a significant breakthrough when dealing with rigid and delicate materials that cannot be machined with very specific geometries or tiny dimensions. Furthermore, no electrical connection to the sample is required, which allows the measurement of samples with low conductivity, contrary to the measurement method proposed in the ASTM D4935 standard. These facts mean that a wide range of measurements can be made with reasonable speed due to the easiness of the measurement procedure. Another notable advantage is the elimination of frequency limitation, making it a suitable method for measurements in the frequency range where 5G technology operates.
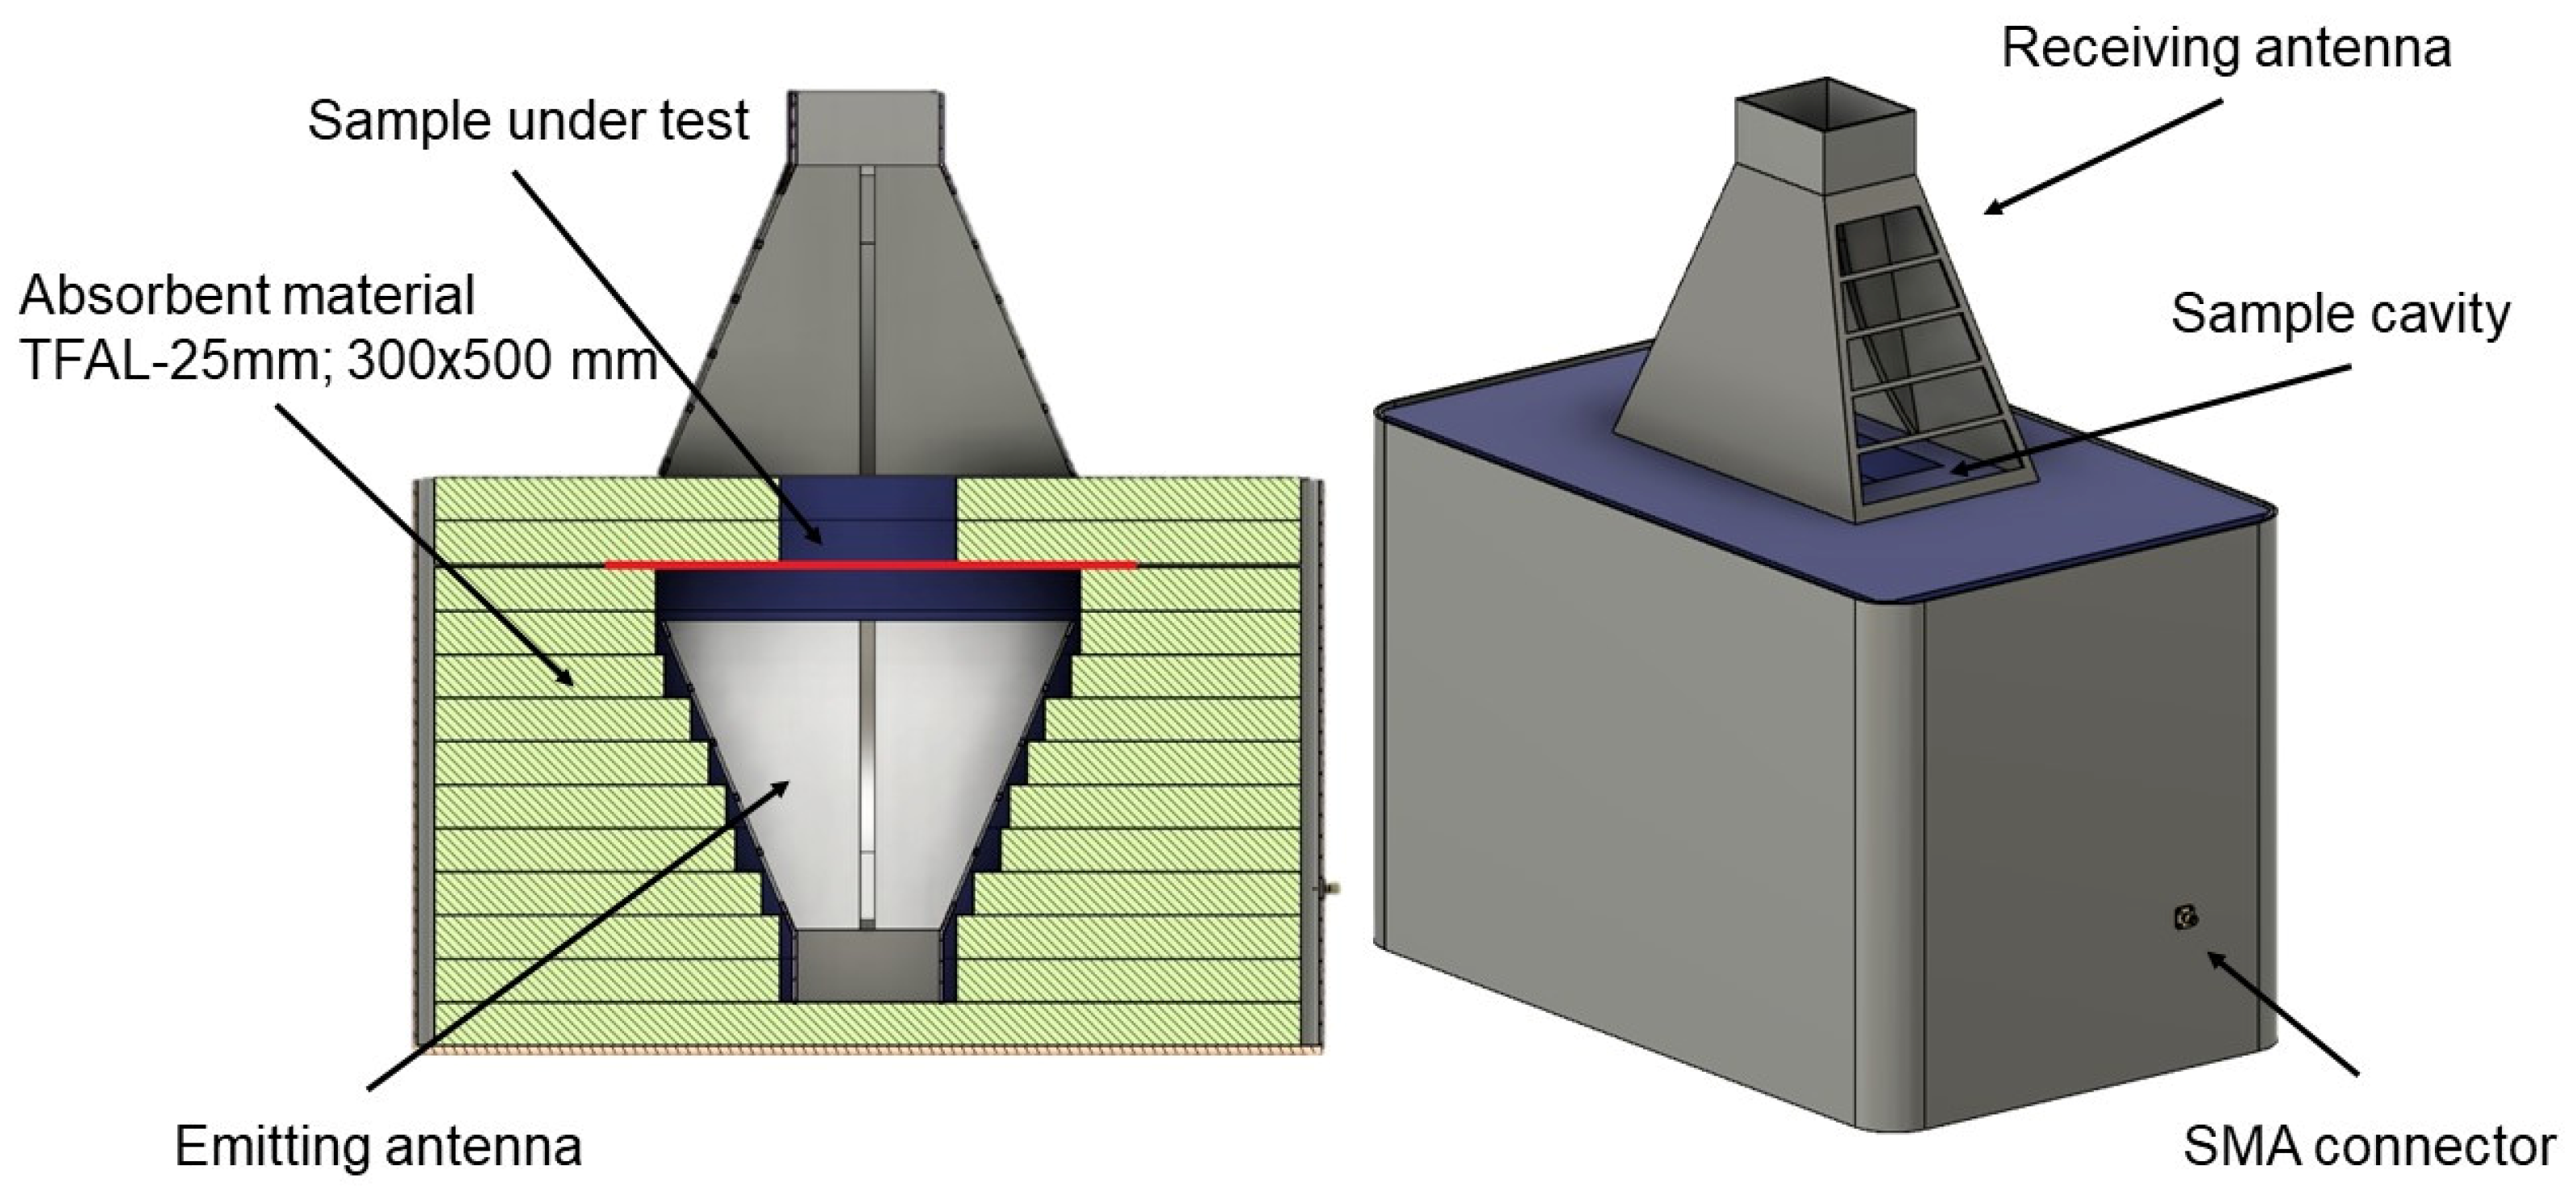
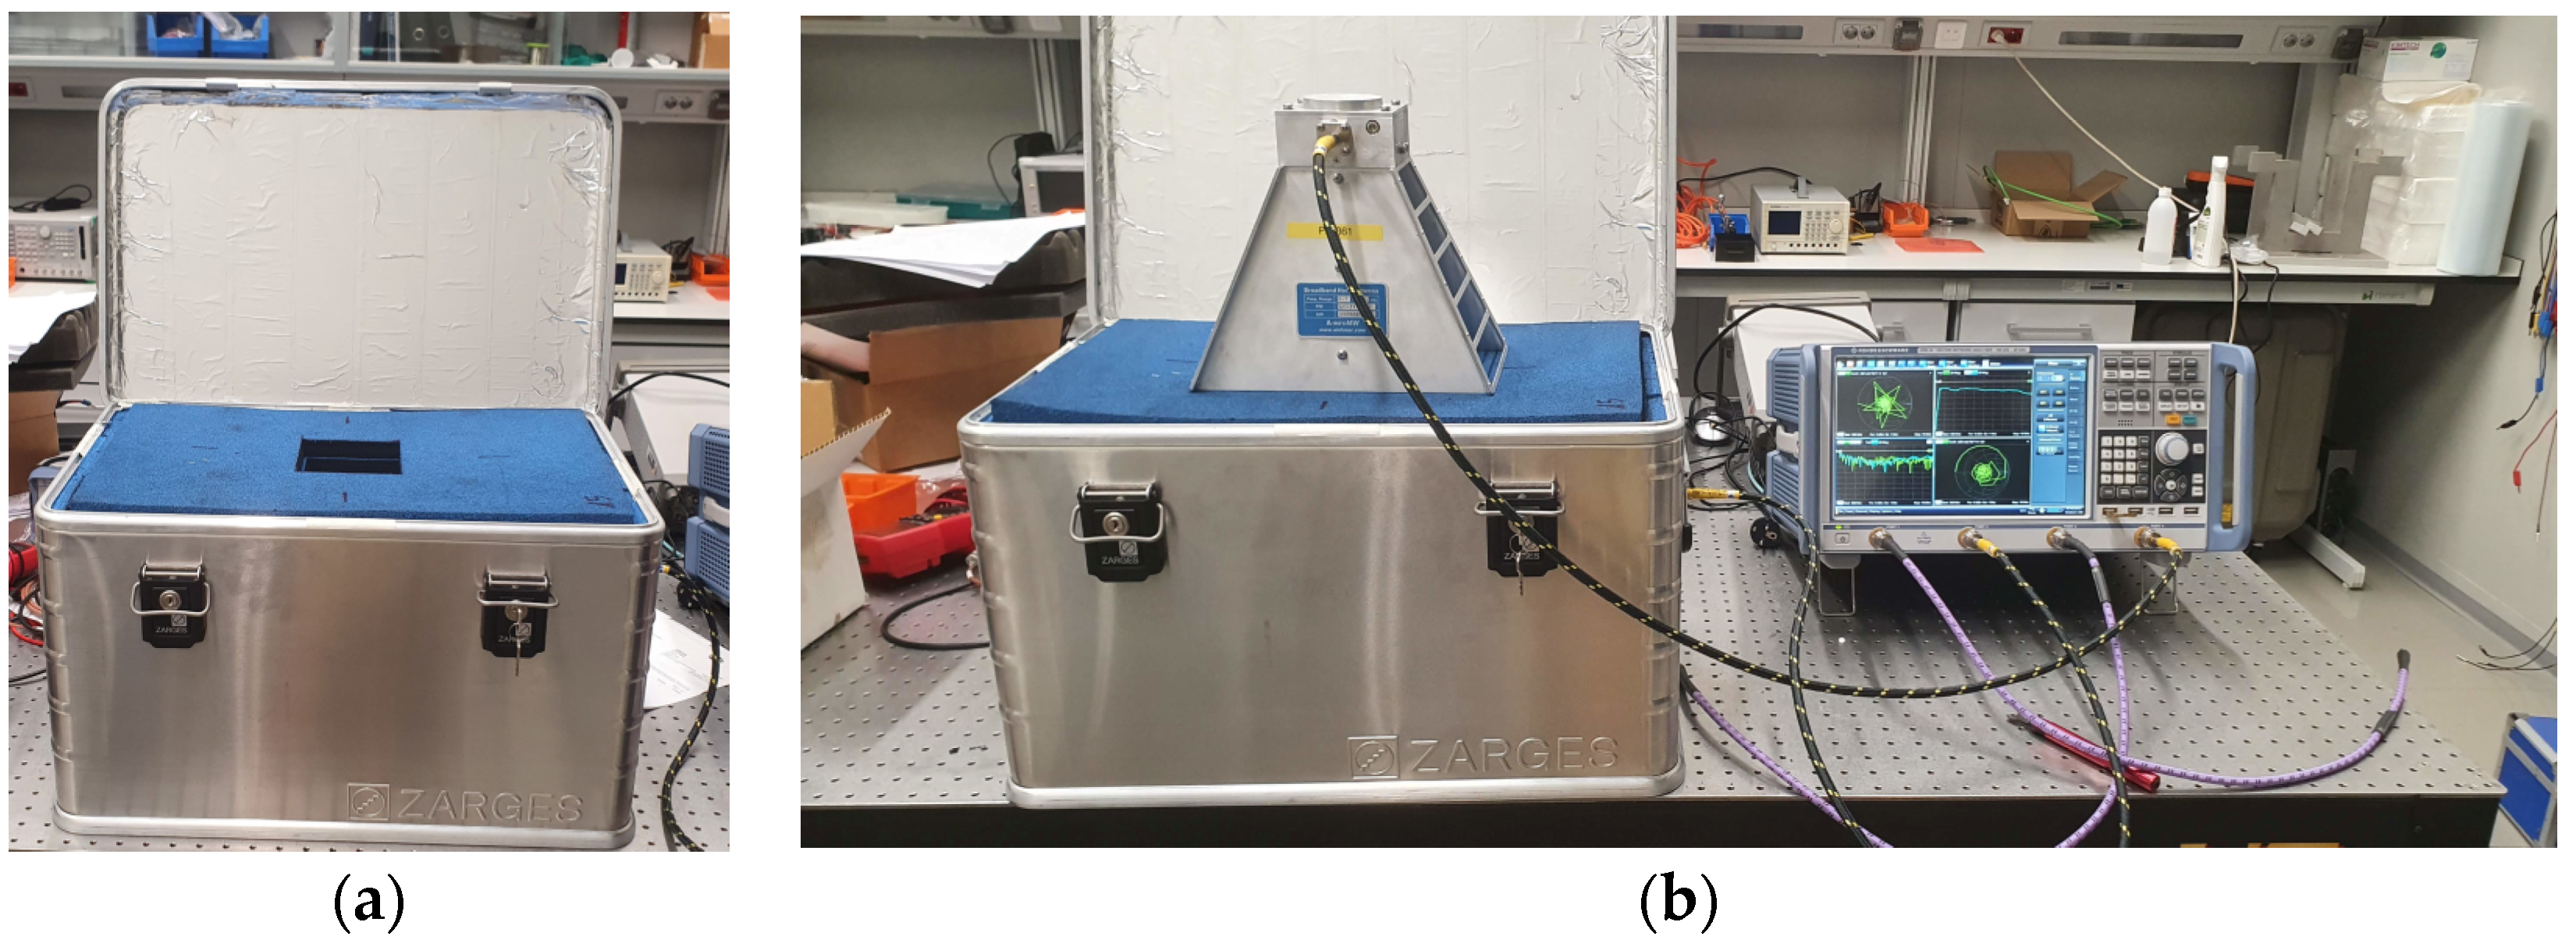
The scheme of the proposed prototype is shown in
Figure 7. The receiving antenna embedded in the absorber and the receiving antenna are commercial 700 MHz to 18 GHz A-Info LB-7180 ridged waveguide horns. The dimensions of the cavity are 300 × 500 mm, thus, adapting to the rectangular shape of the horn antennas [
38]. In one of the sides of the box, a hole has been drilled where an SMA-type connector is placed and connected to the transmitting antenna inside the cavity. The laminated absorber is arranged inside the cavity of the absorber box cut to fit the geometry and dimensions of the antenna. The absorber material is a commercial series made from polyurethane foam that is treated with carbon and assembled in a laminate construction to generate a controlled conductivity gradient. The upper layers above the emitting antenna have a square opening of 100 × 100 mm where the sample is placed to measure the SE of the sample. Assuming no contact exists between the equipment and the sample, two more sheets of absorbent material are placed on top of the sample to mitigate diffraction losses due to the edge effect and to flatten the sample in case it has a concave or convex shape due to the manufacturing process. These top layers of absorbers have an opening of the same dimensions as the sample layer to illuminate the sample as uniformly as possible.
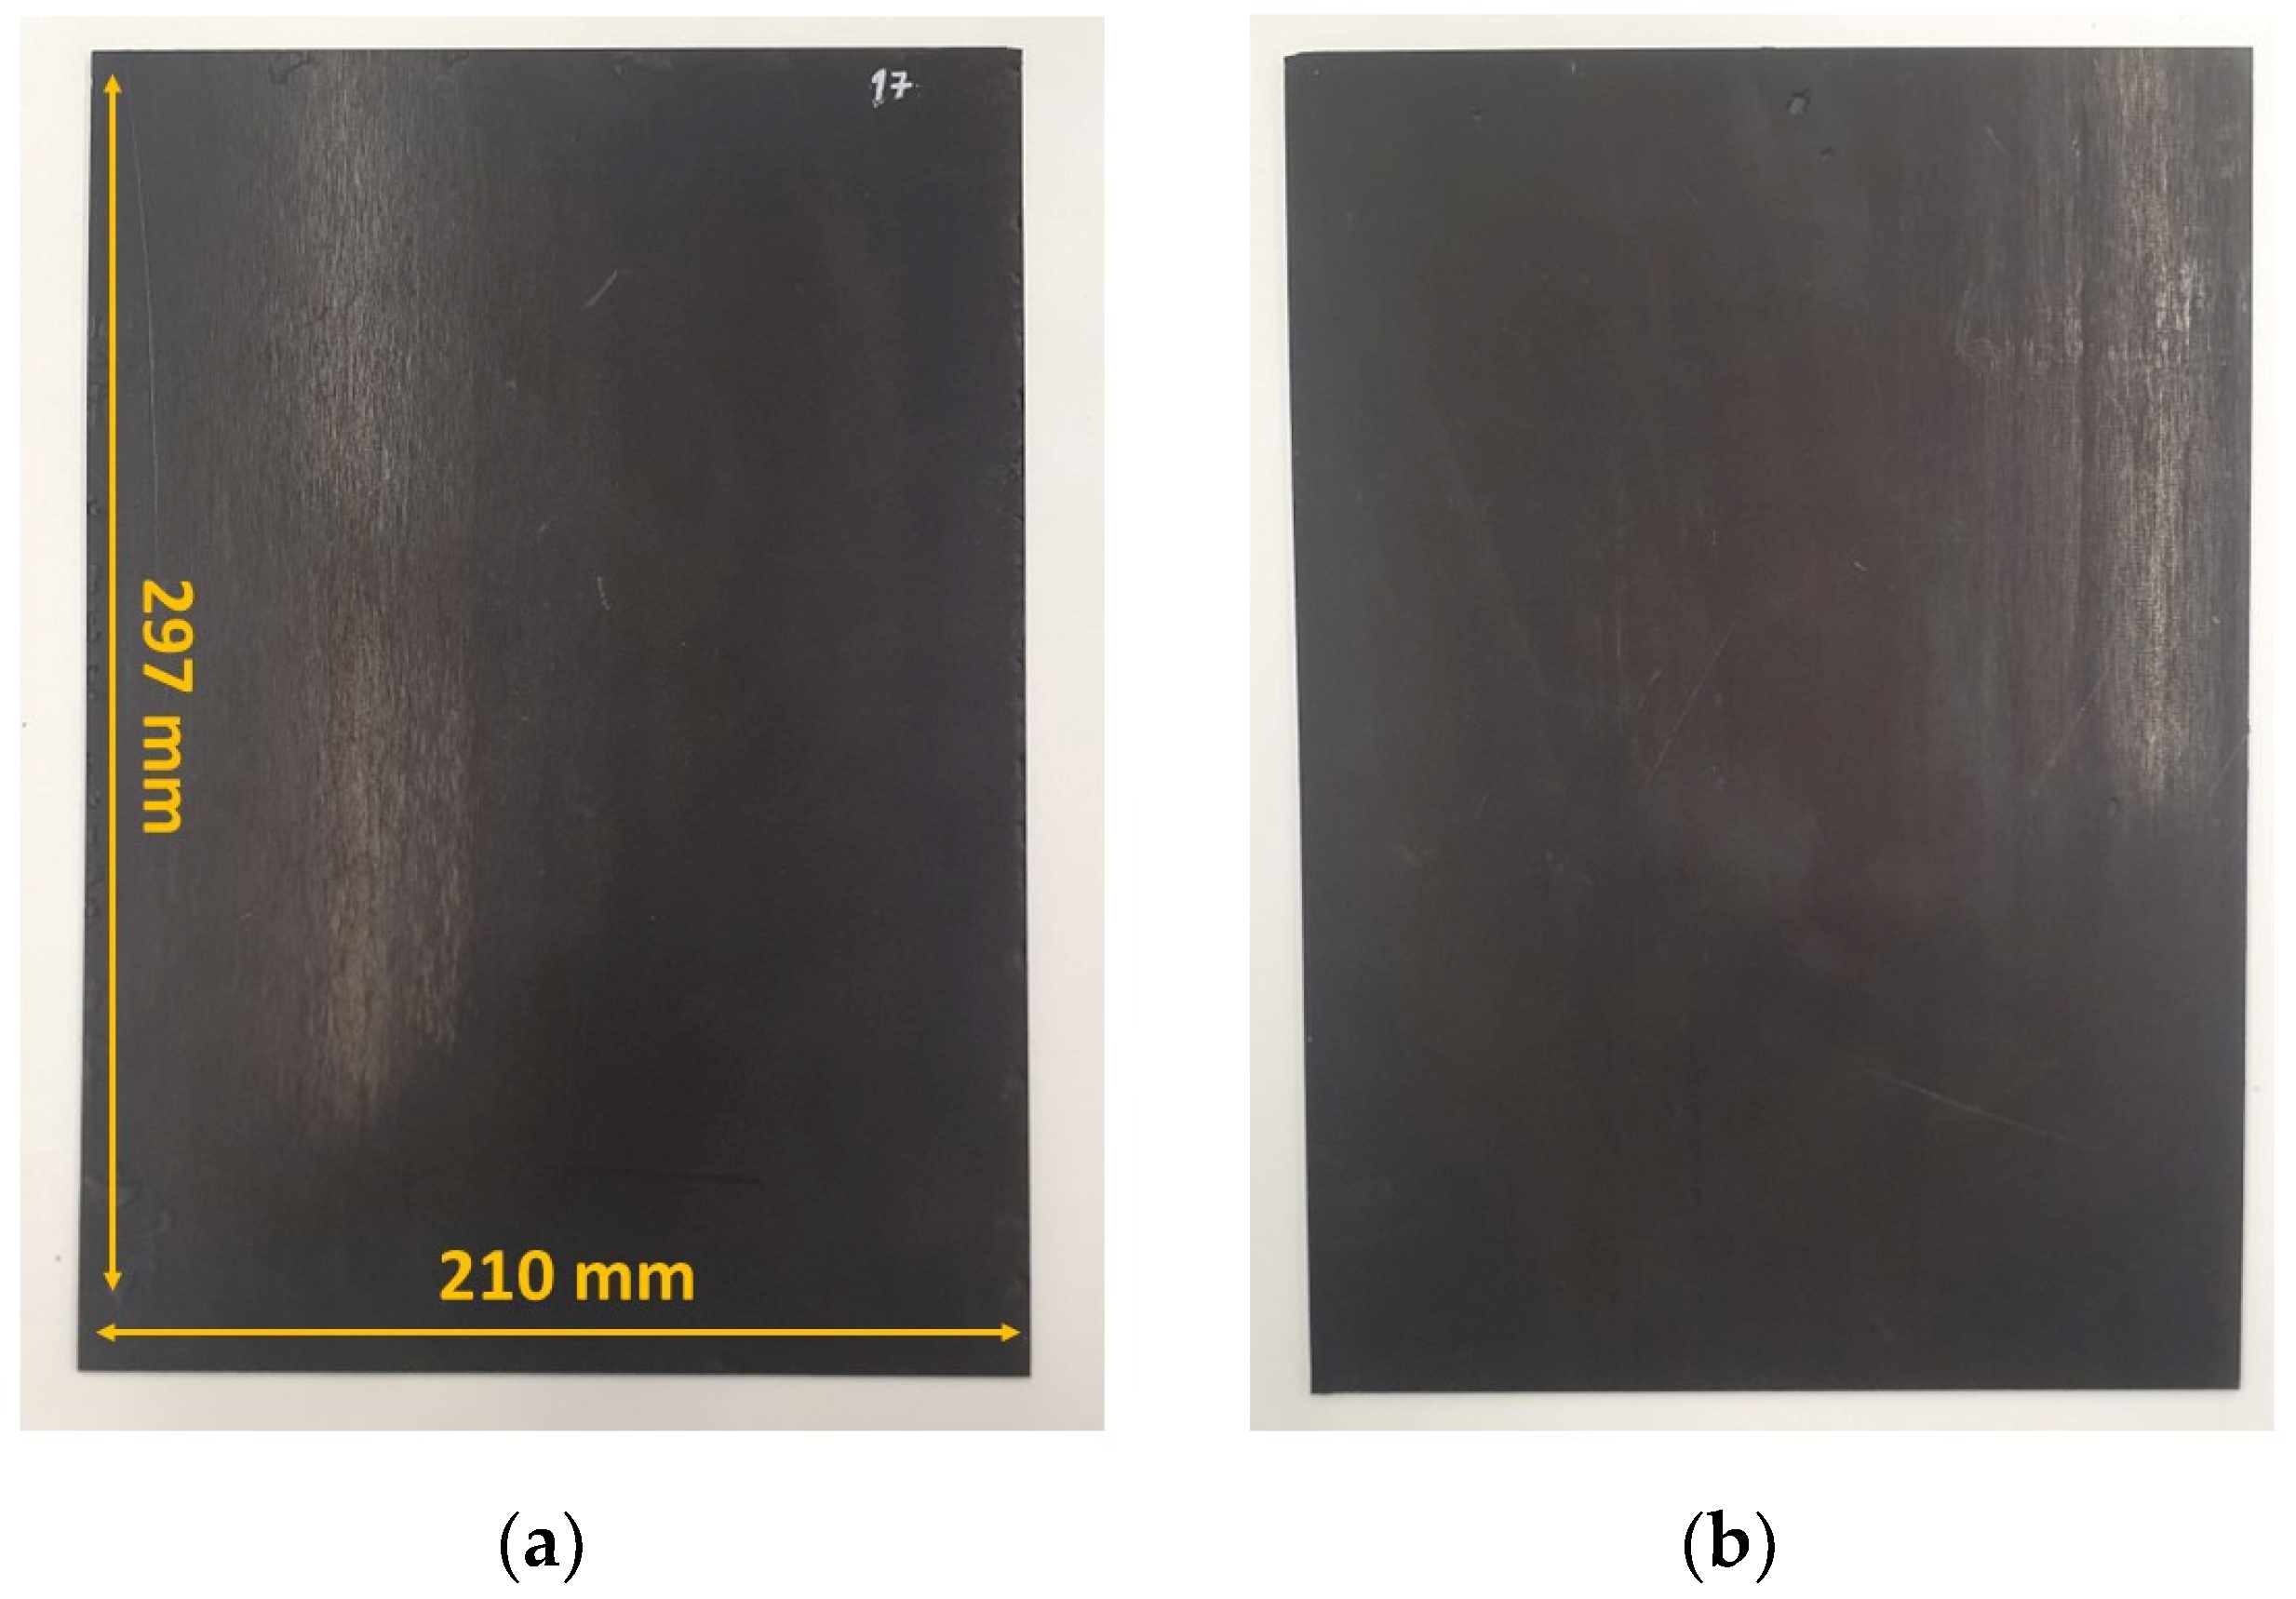
The selected size of the developed samples is 210 × 297 mm. These dimensions correspond to a fairly standard size for sample prototyping, although it is possible to perform measurements with samples up to 300 × 500 mm, which corresponds to the maximum dimensions of the cavity. Furthermore, with this size, the samples aim to be large enough to reduce the edge effect previously mentioned, but at the same time, small enough to ensure that production is simple and cost-effective.
The antennas are connected to port 1 (emitting channel) and port 2 (receiving channel) of a VNA measuring equipment through an SMA-type connector and two cables Megaphase KB18-S1S1-48 SMA. The frequency range of the final system is 700 MHz–18 GHz, limited by the maximum and minimum operating frequencies of the antennas.
The procedure to obtain the shielding effectiveness of the different samples is based on measuring the scattering parameter S
21 by taking the transmission ratio through the system without any sample (S
21,ref), and with the sample present in the cavity (S
21,sample). Subsequently, the SE is calculated according to Equation 1:
The prototype and the final measurement setup are shown in
Figure 8, where the receiving horn antenna is situated above a material under test and connected to the VNA equipment.
To characterize the system, the measurement of the dynamic range of the proposed method has been carried out. The SE of the cavity without a sample has been compared with the SE resulting from placing a perfect electric conductor (PEC) with the maximum size of the cavity (300 × 500 mm) to avoid the effect of diffraction at the edges. In this case, the sample is an aluminum sheet with a thickness of
t = 2 mm.
Figure 9 shows the resulting dynamic range of the system, which is approximately -100 dB and is expected to be suitable to measure the SE of the developed materials according to the values obtained in previous studies of composites with similar characteristics [
20,
39].
The most notable features of the measurement method used to evaluate the developed samples are summarized in
Table 4.
4. Results and Discussion
This section is focused on showing the results corresponding to the measurement of seven sample composites under test. Firstly, it is compared the different composite samples based on ABS (samples 1, 2, 3, and 7) to analyze how the increase in the concentration of CNT is turned into an improvement of the SE parameter. Subsequently, the influence of the reinforcement material used to manufacture the composite is studied by comparing the samples based on glass fiber and carbon fiber (samples 4 and 5). Finally, the effect of introducing a thicker carbon fiber reinforcement in the composite is analyzed (samples 4 and 6).
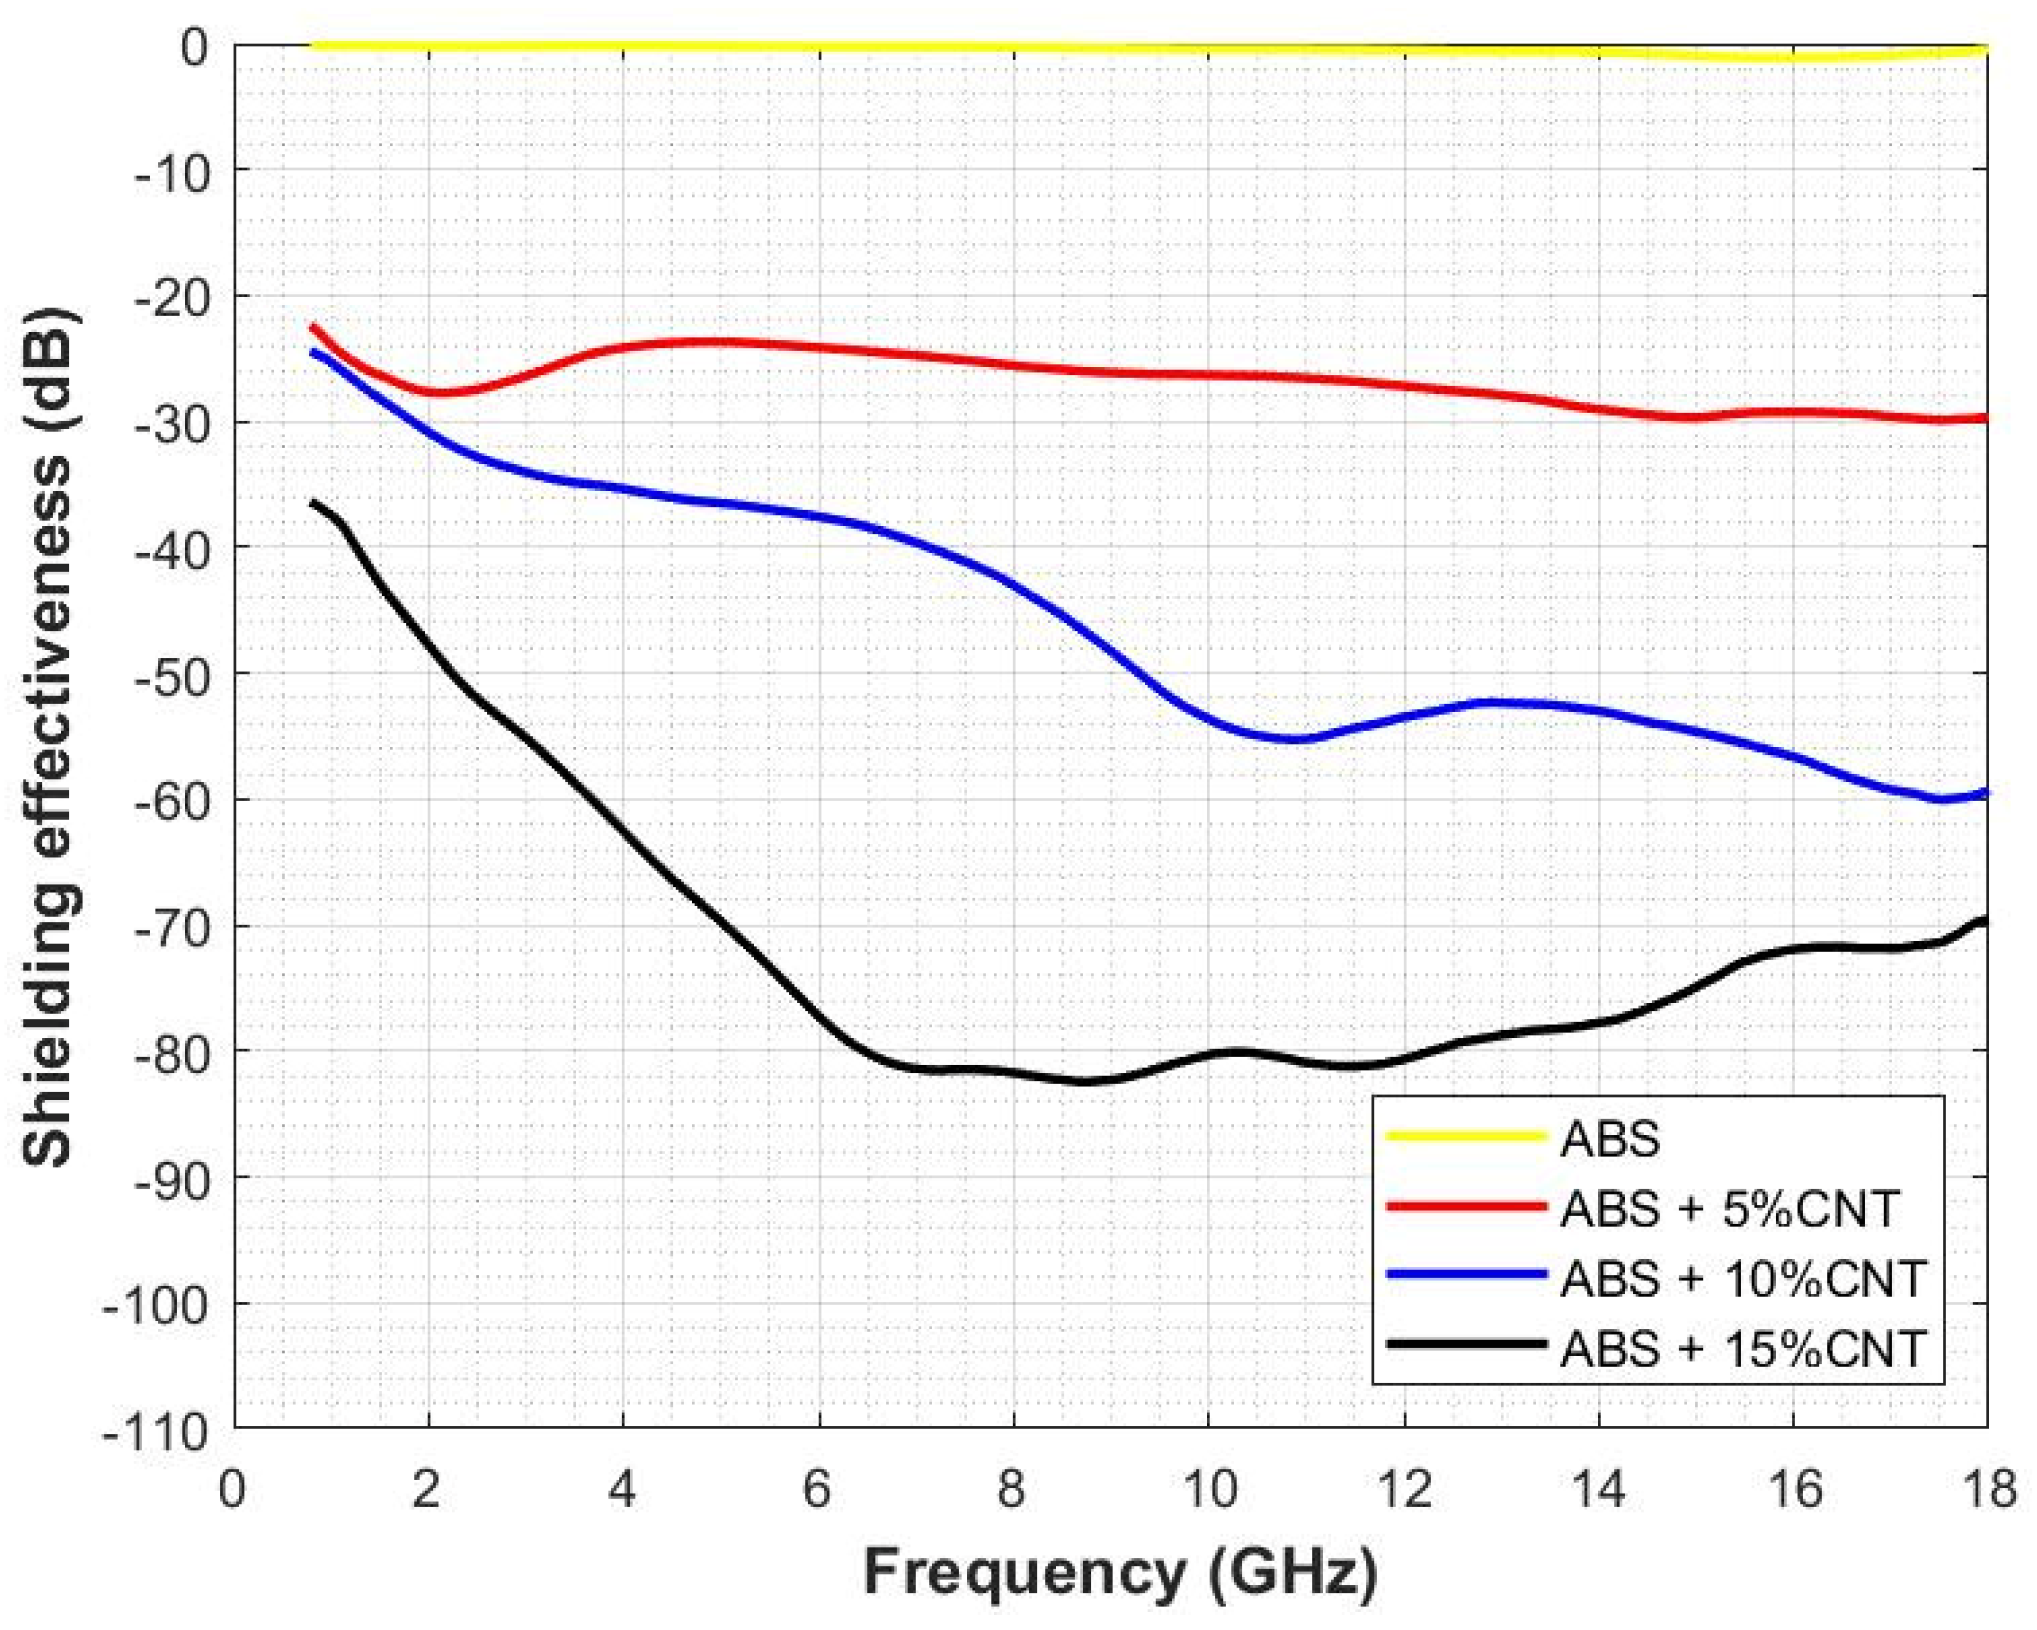
Figure 10 shows the results obtained in terms of SE of different composites with an ABS matrix without fiber reinforcement and three different concentrations of %w CNT. The ABS trace represents the outcome of the SE measurement conducted on the ABS matrix without any filler material. This particular measurement is used as a reference to compare the SE values obtained from the other samples. It can be observed how this trace does not provide considerable attenuation but the increase in CNT filler leads to a rise in the SE provided by the material. If we take the value of 7.125 GHz as a reference, which corresponds to the upper limit of the FR1 band in the 5G spectrum, a value of −24.75 dB is obtained for the trace with a concentration of 5w%CNT. For the sample with twice the weight concentration of CNT, the SE value increases to −39.65 dB. In the last case, for the 15w%CNT sample at the reference frequency, the SE value obtained is −81.30 dB.
Below the reference frequency, the behavior of the traces is slightly different. The red trace corresponding to sample 2 shows a linear behavior, whereas the traces corresponding to the samples with the highest CNT concentration (samples 3 and 7) show an increase in SE as the frequency increases. On the other hand, starting at approximately 14 GHz, it can be observed that the red trace (sample 2) continues to exhibit a flat behavior, whereas the blue trace (sample 3) continues to decrease. However, the black trace (sample 7) shows a change in slope, taking an ascending trend. This fact leaves the door open for further study at higher frequencies to determine if, at a given frequency, the sample with the highest concentration of CNT may not necessarily present the greatest attenuation.
It has been observed that to achieve higher levels of attenuation, it is necessary to increase the concentration of CNT. However, this presents a challenge during the machining process as the addition of CNT increases the viscosity of the composite. To address this issue, two compounds have been developed with the addition of different reinforcements, one based on CF and the other based on GF. These reinforcements provide rigidity to the material, thereby improving its mechanical properties.
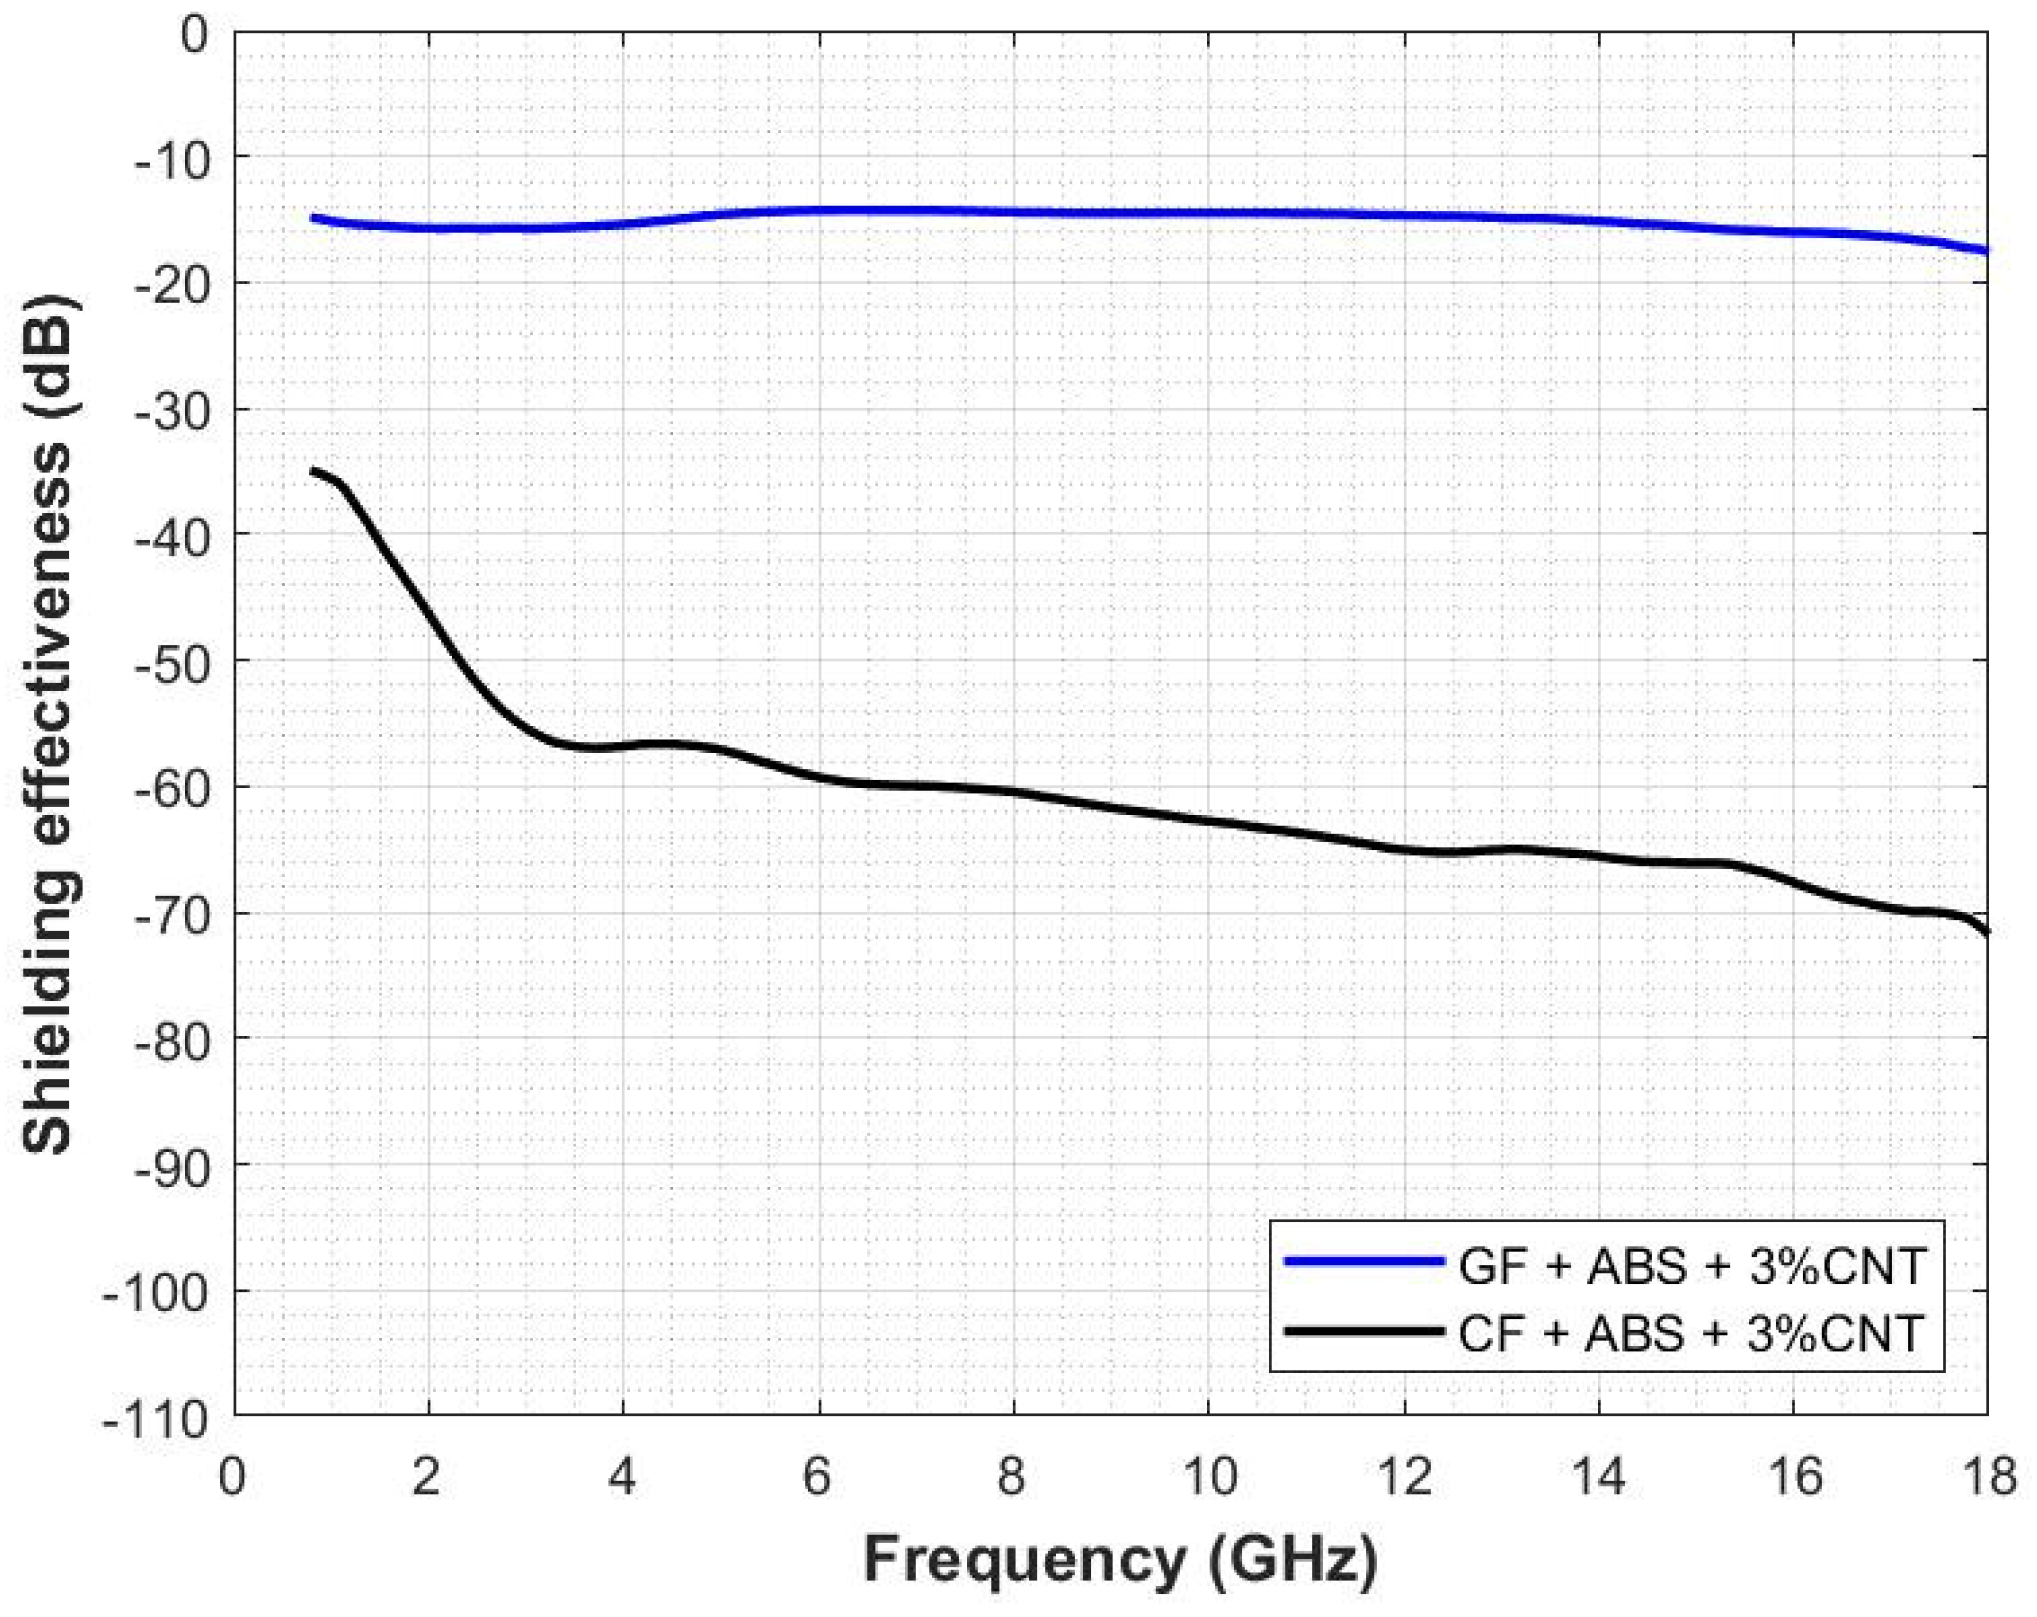
Figure 11 shows the shielding effectiveness provided by the CF reinforcement sample comparing it with the GF reinforcement sample (samples 4 and 5, respectively) with a 3w%CNT. It can be observed that the CF sample exhibits considerably higher attenuation compared to the GF sample when the same %w filler is introduced. Quantitatively comparing the results, for the selected reference frequency of 7.125 GHz, it can be observed that the SE value of the CF sample is −60.03 dB. In contrast, the SE value obtained for the GF sample is −14.24 dB, which significantly differs from the CF sample, even though the weight percentage of CNT is the same for both samples. This is attributed to the nature of the fiber reinforcements, as carbon fiber alone exhibits a certain level of shielding depending on the fiber density due to the highly conductive nature of carbon fibers, whereas fiberglass does not cause significant attenuation.
Although GF does not provide a significant attenuation by itself, these two compounds have been compared due to the fact that GF provides some advantages in terms of cost, production, and machining. GF is generally more affordable because the materials used to produce it are widely available. Additionally, the manufacturing of GF is simpler and requires fewer processing steps. On the other hand, this type of reinforcement is easier to manipulate and has a longer lifespan than CF reinforcement. Therefore, the type of reinforcement chosen will depend on the final application of the composite and the required level of attenuation.
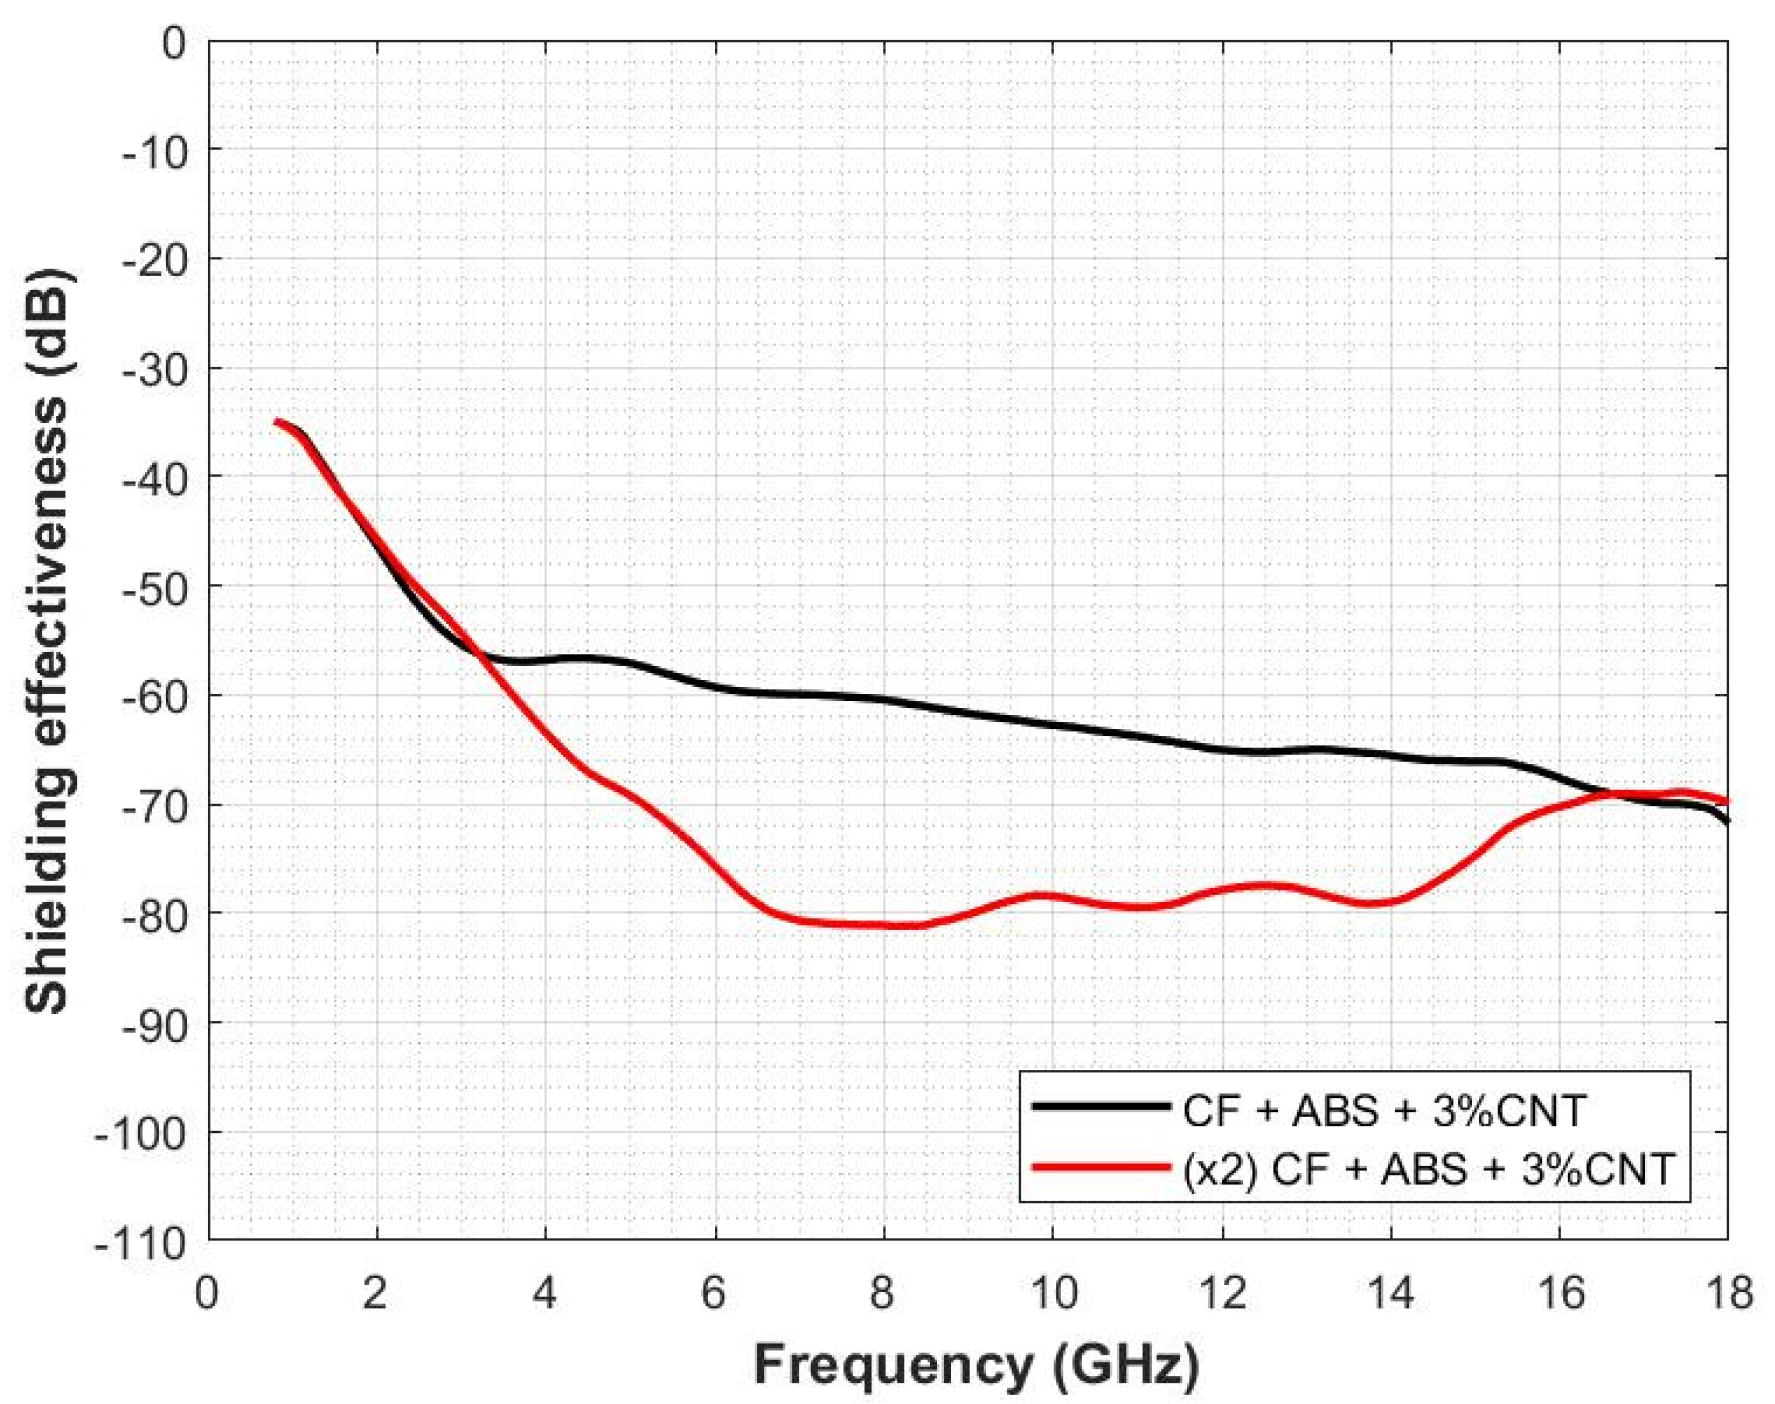
Figure 12 shows the influence of the sample thickness in the measurement of the SE. To achieve this, a CF reinforcement sample (sample 4) with a thickness of
t = 2 mm and 3w%CNT filling is compared with two stacked sheets of the sample (sample 6). On the other hand, the red trace shows the measurement result of the two overlapping sheets. These observations suggest that the sample thickness significantly affects the shielding capability of the material. Below the reference frequency, the behavior of the traces is similar up to approximately 3.5 GHz, where the two traces diverge. It can be observed how the CF sample (black trace) presents considerable attenuation, particularly from 4 GHz. From this point up to 7.125 GHz, the black trace (sample 2) shows a linear behavior with a slightly decreasing slope, whereas the red trace (sample 6) shows a more abrupt decrease until the reference frequency, where it flattens out. Comparing the results for the selected frequency of 7.125 GHz, it can be observed that the SE value of the single-layer CF sample is −60.03 dB, whereas the SE value of the double-layer CF sample shows an increase of 21.29 dB, reaching a SE value of −81.32 dB. Moreover, it is noted that the red trace shows an increase in slope starting at approximately 16 GHz. This phenomenon may be attributed to multiple reflections that occur between the two sheets of material.
The following
Table 5 provides a summary of the most representative results for each of the seven samples in three different frequency ranges. This table shows the maximum and minimum SE values in decibels.
The ability to detect these variations is essential for optimizing the performance of shielding materials in a given application. By identifying the frequency ranges in which a material provides the most significant attenuation in terms of attenuation, it is possible to design more effective shielding systems. These results demonstrate how this method is capable of detecting variations in the shielding performance of the material across different frequency ranges.
5. Conclusions
The proposed measurement methodology shows significant advantages, including the simplicity of the sample machining, which means that very specific geometries or tiny dimensions are not required. This method allows the measurement of samples with low conductivity, contrary to the measurement method proposed in the ASTM D4935 standard. The sample insertion and removal process can be completed within a matter of seconds, which supposes that a wide range of measurements can be made with reasonable speed due to the easiness of the measurement procedure. The measured dynamic range is approximately −100 dB, allowing us to analyze the samples developed in this study in the frequency range where 5G technology operates.
On the other hand, EMI shielding effectiveness in the 700 MHz–18 GHz frequency range has been studied. Two types of materials have been compared, depending on the presence of fiber reinforcement. It has been observed the performance of the materials studied in a wider frequency spectrum than specified by ASTM4935-18 standard and controlling the surrounding effects by using the absorber box method.
Some of the samples analyzed have demonstrated to provide a significant attenuation. For those composites based on a polymer matrix with different concentrations of CNT, a value of −81.30 dB has been obtained for the frequency of 7.125 GHz for the 15w%CNT composite, which is a very significant SE value considering the nature of these materials. Whilst it is true that an increased volume fraction of filler may lead to a decrease in the mechanical performance of the host matrix by means of deterioration of its inherent morphology, it is necessary to incorporate a higher filler content in order to achieve higher SE. It is desirable to employ CNT/polymer composites at low filler loadings to produce cost-effective and versatile conductive composites.
The inclusion of a carbon fiber reinforcement has proven to be an effective strategy for achieving significant attenuation in composite materials, providing higher attenuation than the GF-reinforced composite with the same CNT concentration. This approach offers an advantage over using a high percentage of filler, which may lead to undesirable mechanical properties. This is due to the highly conductive nature of carbon fibers, which can effectively attenuate electromagnetic radiation. Furthermore, using CF reinforcement can also provide additional benefits such as increased stiffness and strength, as well as reduced weight. This, in turn, makes these materials an excellent alternative to replace traditional shielding materials.
It has to be highlighted that these types of characterizations are very relevant from a technological and industrial point of view. Specifically, for those sectors related to 5G technology, since the use of EMI shielding based on plastic materials has many advantages, such as manufacturing cost reduction.


 ,
, 


