1. Introduction
The rare earth orthoferrite (RFeO
3) with perovskite structure has received intensive attention, thanks to its exotic magnetism, multiferroics and unique features for fast magneto–optical isolator, ultra-fast spin switching, etc. [
1]. Moreover, due to the suitable band gap, RFeO
3 has also been considered as a potential visible light photocatalyst for the degradation of organic pollutants [
2,
3,
4]. Interestingly, these magnetic photocatalysts display advantages of magnetic separation and recyclability after photocatalytic reactions, which make them easy to recover from waste water to avoid secondary pollution. As a typical orthorferrite compound, GdFeO
3 contains Gd
3+ half-filled 4f shell and a stable structure with a
Pbnm space group. It displays a narrow band gap (around 2.4 eV), capable of absorbing both visible and UV light. Some studies have been conducted to investigate the photocatalytic behaviors of GdFeO
3, and effective strategies have also been proposed to boost the photocatalytic performance. For instance, the substitution of Mn at the Fe site of GdFeO
3 introduces an extra electronic state between the conduction band and the valence band, which reduces the optical band gap and enhances the rhodamine-B (Rh-B) degradation efficiency [
5]. The degradation rate of Rh-B is greatly improved by a factor of 2.5 for GdFe
0.7Mn
0.3O
3 as compared to pure GdFeO
3. Similarly, the introduction of Mn in ErFeO
3 greatly increases the photocatalytic degradation efficiency of methylene blue (MB), due to the narrower band gap and smaller particle size [
6]. Moreover, the degradation efficiency of Rh-B up to 92% at 120 min is achieved in GdFeO
3/g-C
3N
4-3:7 composites, while minor weigh loss is observed during the consecutive runs [
7].
Bismuth ferrites (BiFeO
3), with distorted rhombohedral perovskite structure, shows fascinating multiferroic properties with simultaneous antiferromagnetic ordering (T
N = 370 °C) and ferroelectric configurations (T
c = 830 °C) at room temperature [
8]. BiFeO
3 is also regarded as a novel photocatalyst under visible light irradiation, owing to its narrow band gap (2.0 eV–2.2 eV) and excellent chemical stability [
9,
10]. Meanwhile, the internal electric field from ferroelectric BiFeO
3 possibly enhances surface reactions and photogenerated charge separation efficiency [
11]. However, the photocatalytic performance is still restricted by the presence of impurity phases, structural instability, and slow mobility rate [
12]. Various strategies have also been applied to boost the photocatalytic efficiency, such as surface engineering, morphology tuning, heterostructure formation, doping and crystal facet engineering. For example, La-doped BiFeO
3-based multiferroics were synthesized to achieve a strong magnetic response and high piezo-photocatalytic activity [
12]. The optical bandgap of BiFeO
3 nanoparticles has been tuned from 2.06 eV to 1.75 eV by Cd-Ni co-doping. The best degradation activity of MB and Rh-B has been achieved in a Bi
0.94Cd
0.06Fe
0.94Ni
0.06O
3 sample under UV–visible irradiation, which may be originated from the high surface area, smaller average particle size and bandgap [
8]. MB dye was almost completely degraded in 120 min for a AgFe
2O
4/BiFeO
3 heterostructure under visible light irradiation [
13].
Now, enhanced photocatalytic performance of ferrites is still highly expected by effective regulation of the structure, morphology, band energy, etc. Dopants are proven to be feasible strategies to modify the magnetic and photocatalytic properties of orthoferrites. Substituents may act as surface traps for holes and electrons, reducing recombination rate and increasing photo-produced charge carrier lifetime, leading to enhanced photocatalysis of materials [
11]. The lattice structure, electronic band gap and the dipole–dipole interaction of perovskites can also be effectively regulated by the substitution at the A site or B site, making it possible to effectively modulate the optical, magnetic, electrical and catalytic properties. Orthorhombic GdFeO
3 and rhombohedral BiFeO
3 show distinctive crystal structures. Cation substitution of Gd
3+ for larger Bi
3+ cations results in structural modifications mainly in FeO
6 rotations and tilting, and the electric polar moment on GdFeO
3 is also modified by the s
2 lone pairs of electrons in the Bi cations [
14]. Therefore, the influence of Bi
3+ on the lattice structure, band energy, magnetic properties and catalytic behaviors of GdFeO
3 need to be explored. Recently, it has been reported that the introduction of Bi
3+ in YFeO
3 does not generate significant changes in band gap values and photocatalytic efficiency, but modifies the crystal structure and the magnetic behavior [
14]. The investigation towards the effect of Bi
3+ on the structure, magnetic and photocatalytic characteristics of GdFeO
3 is still scarce. Herein, a series of Gd
1-xBi
xFeO
3 (x = 0, 0.1, 0.3, 0.5, 0.7, 0.9, 1) powders were prepared by the sol–gel method. Sponge-like particles are usually formed during the sol–gel method, which is helpful for enhancing the catalytic reactions. The crystal structure, crystalline morphology, magnetic and optical properties of the as-prepared samples were fully characterized. The photocatalytic activity of the samples was investigated via the degradation of MB under visible light irradiation. The photocatalytic efficiency was effectively increased by the introduction of Bi
3+. The optimum catalytic performance was observed for Gd
0.5Bi
0.5FeO
3, which was mainly ascribed to the narrower band gap, increased optical absorption, and enhanced charge transfer efficiency.
3. Results
Gd
xBi
1−xFeO
3 (x = 0, 0.1, 0.3, 0.5, 0.7) samples were prepared and calcined at 700 °C, while Gd
xBi
1−xFeO
3 (x = 0.9, 1) powders were successfully obtained at 550 °C. The results indicate that Bi
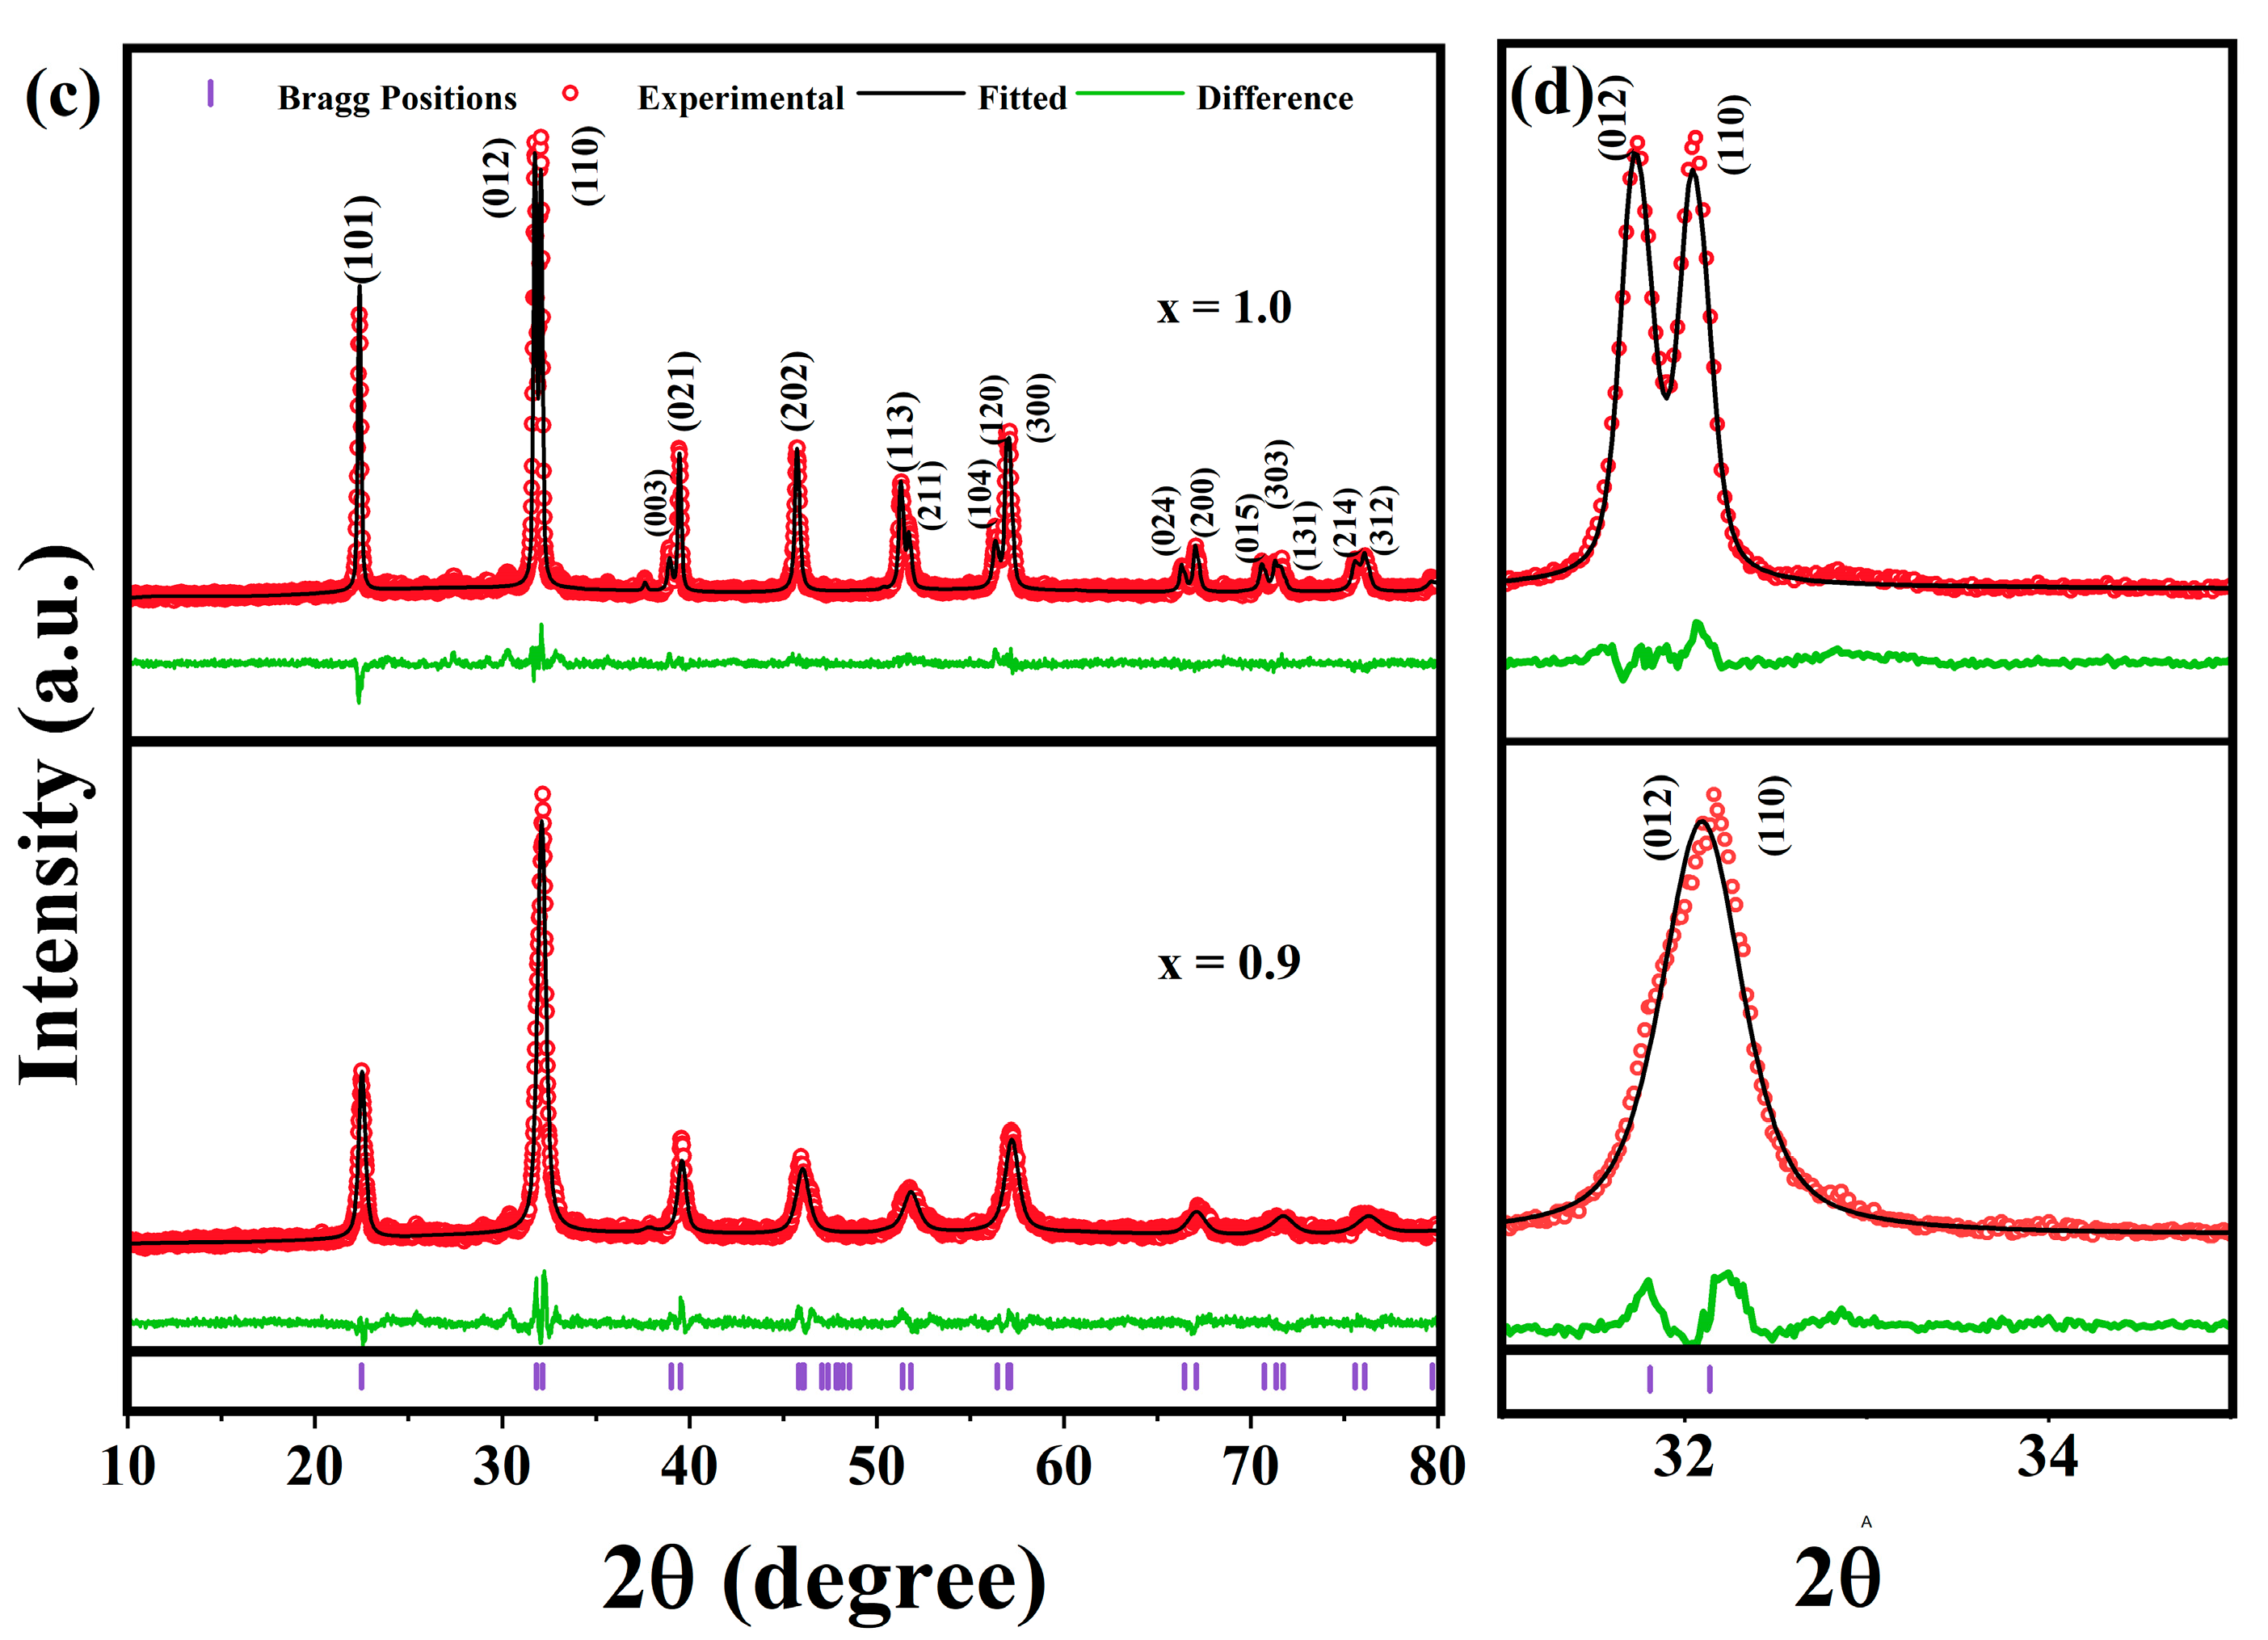
3+ is effective in lowering the formation temperature of orthoferrite, without any observable impurities. The Rietveld refined X-ray powder diffraction patterns of Gd
xBi
1-xFeO
3 are shown in
Figure 1. In
Figure 1a, when the content of Bi
3+ was ≤0.5, the pure orthorhombic perovskite phase (GdFeO
3, PDF No. 74-1476) was observed, without any impurities. Obviously, the mixed phase of the
Pnma (wt ≈ 64.68%) and
R3c (wt ≈ 35.32%) phase was observed at x = 0.7, indicating that the orthorhombic perovskite structure can remain when the content of bismuth was lower than x = 0.7.
Figure 1b reveals an enlarged view of the (112) diffraction peak around 32° and 34°. As the Bi concentration increased, this diffraction peak shifted towards a lower 2θ value, suggesting enlarged lattice volumes. In
Figure 1c, when the concentration of Bi
3+ was ≥0.9, the pure rhombohedral perovskite (
R3c) (BiFeO
3, PDF No. 72-2112) was obtained. The phase transition was attributed to the structural distortion resulting from the incorporation of Bi
3+ ions into the lattice of GFO, since the ionic radius of Bi
3+ (1.17 Å) is larger than of Gd
3+ (1.05 Å) [
15]. Lattice distortion will cause changes in the lattice parameters, bond length, bond angle of Fe-O-Fe and other related parameters.
Table 1 shows the refined unit cell parameters, bond angle, bond length and goodness of fit. For the samples of Gd
xBi
1−xFeO
3 (x = 0, 0.1, 0.3, 0.5), the lattice parameters of the
Pnma phase gradually increased with the increased concentration of Bi
3+, suggesting the component-driven structural distortions. For the samples of Gd
xBi
1−xFeO
3 (x = 0.7, 0.9, 1) in the
R3c phase, the lattice constants
a and
b decreased with the increase in Bi content while the lattice constant
c increased with the increase in Bi. Overall, the unit volumes were enlarged with the introduction of Bi for these samples. Additionally, the change of the bond length and the bond angles were varied for the
Pnma phase and the
R3c phase. In particular, for GBFO5, the Fe-O1 bond length and the Fe-O2 bond length were expanded to 2.043 Å and 2.033 Å, respectively, while the bond angles of Fe-O1-Fe and Fe-O2-Fe were increased to be 142.943° and 146.985°, respectively. Moreover, it has been reported that the hybridization between Bi and O could possibly induce enhanced octahedral tilting distortion of the perovskite structure [
16].
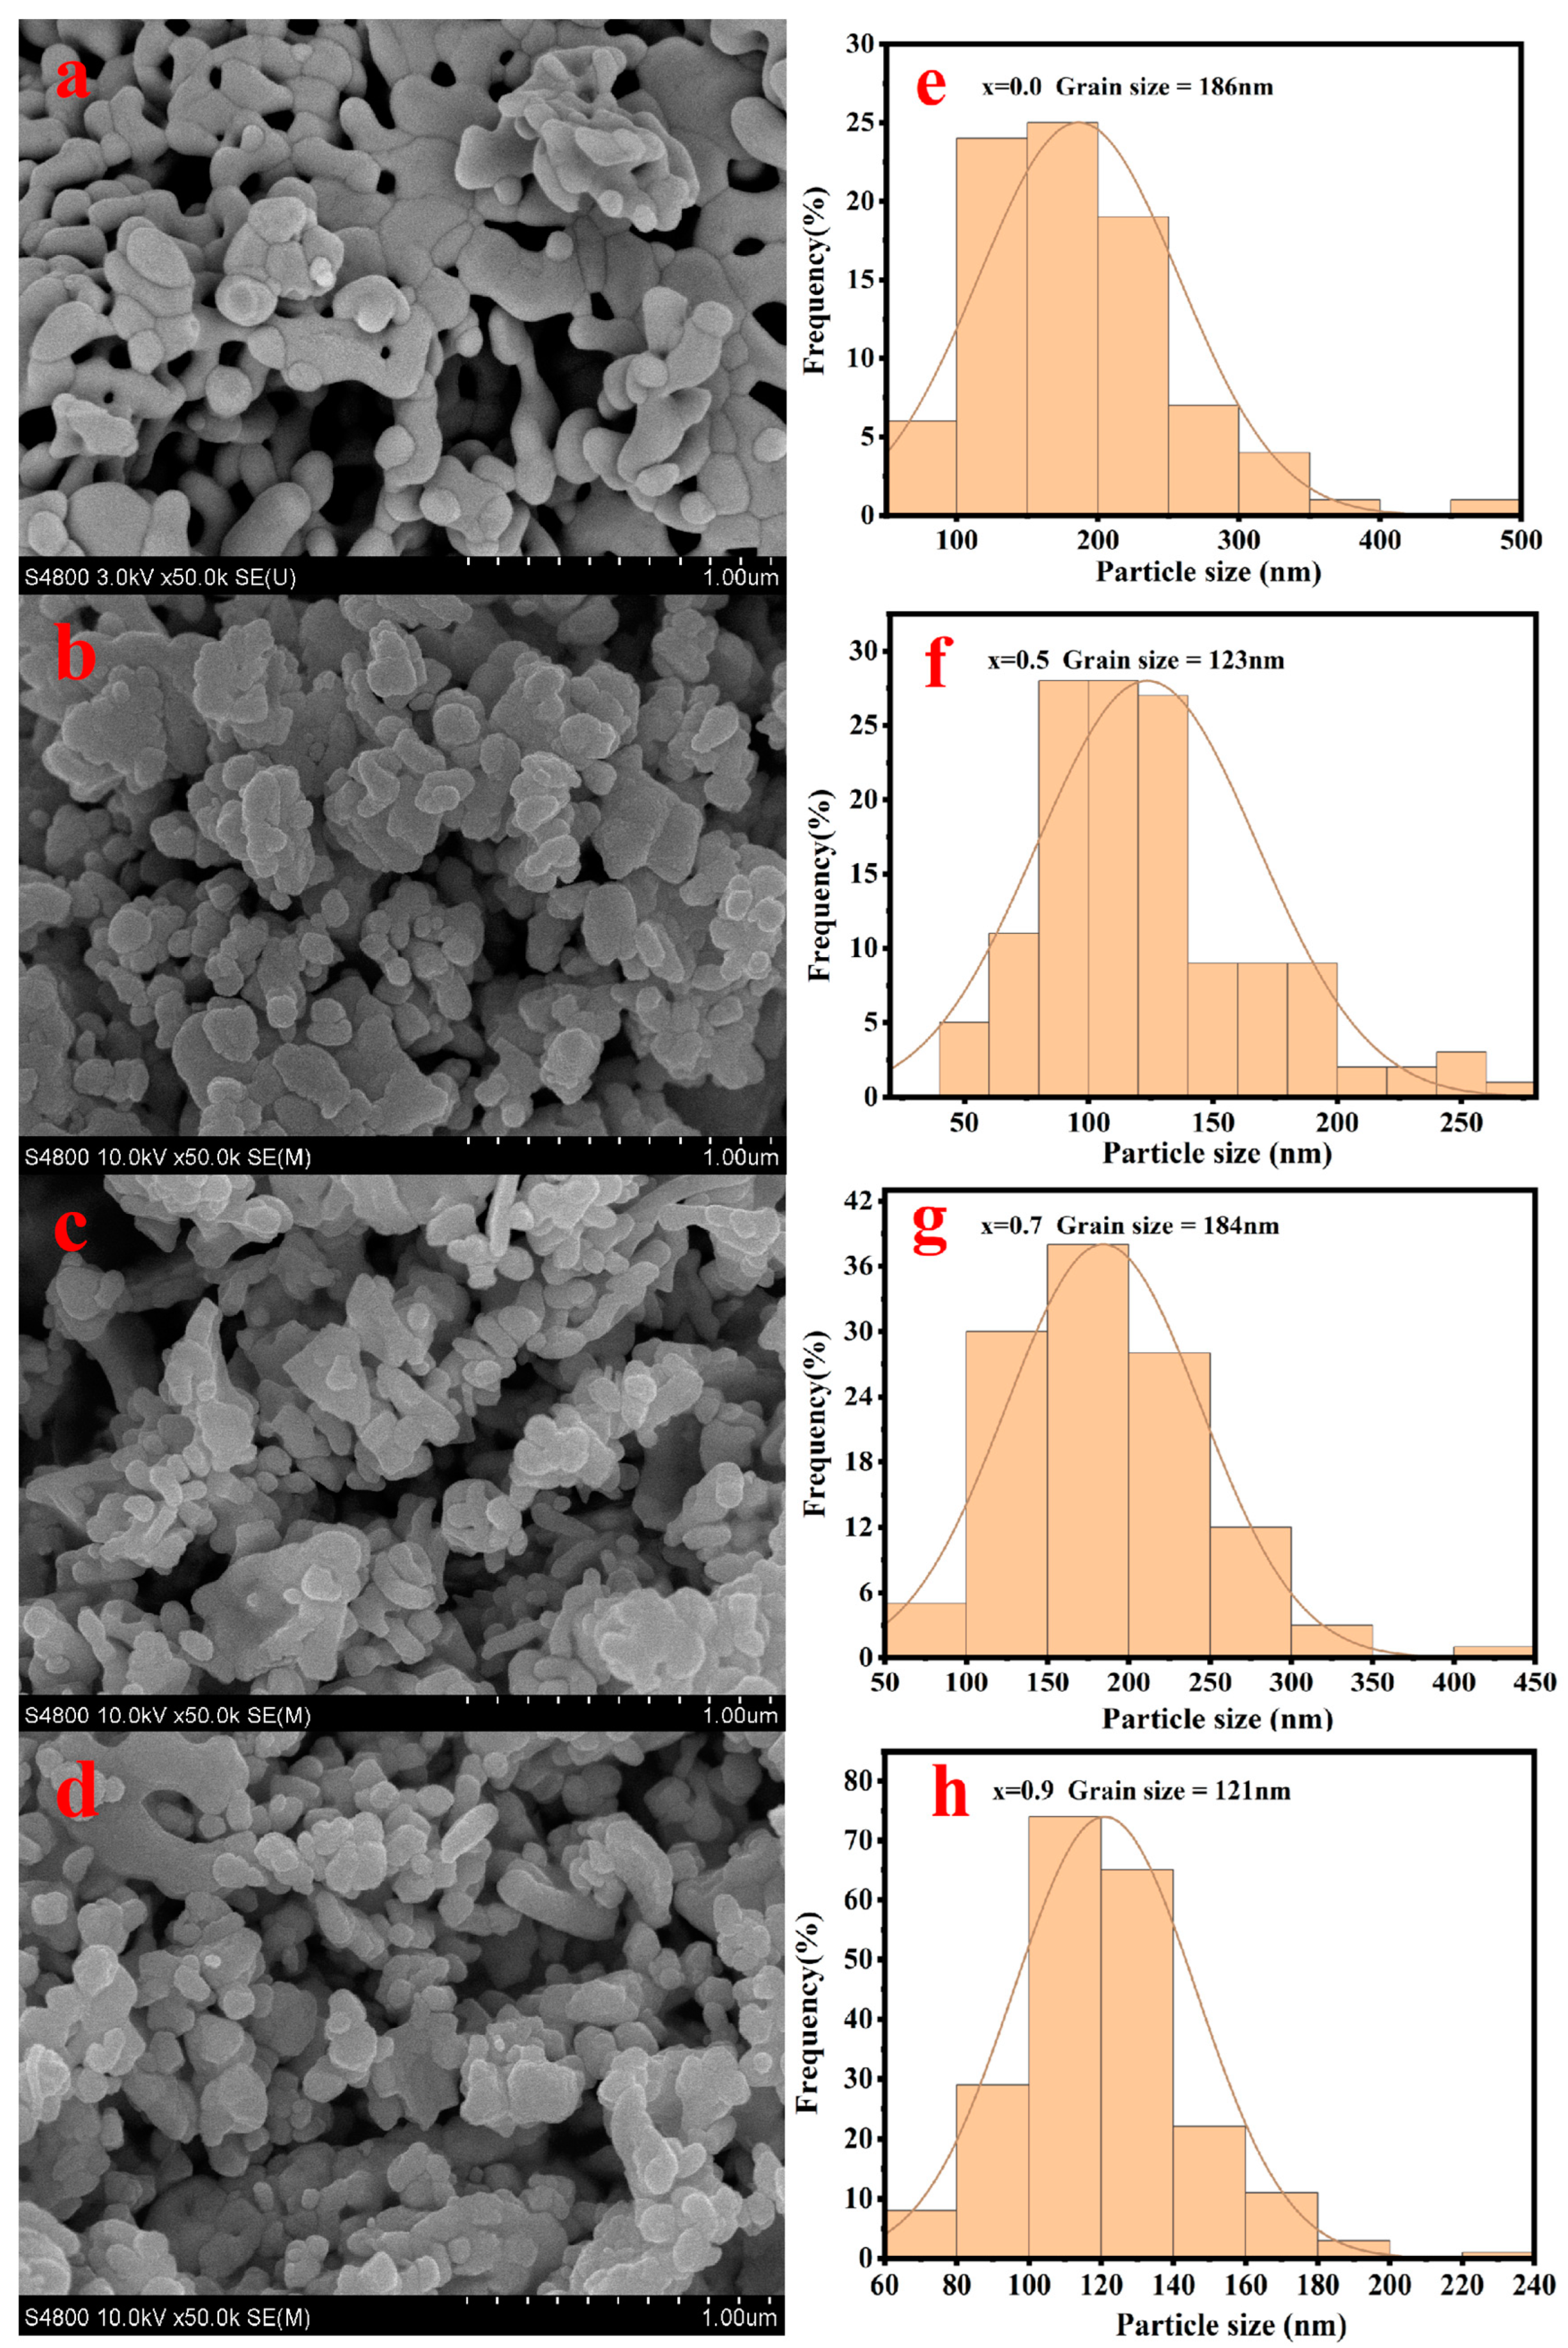
Figure 2a–d shows the SEM images of the prepared Gd
1−xBi
xFeO
3 (x = 0, 0.5, 0.7, 0.9) powders. The Gd
1−xBi
xFeO
3 (x = 0, 0.5, 0.7) samples were calcined at 700 °C and Gd
0.1Bi
0.9FeO
3 was prepared at 550 °C. The statistical calculation of the grain size distribution of the corresponding samples is shown in
Figure 2e–h. In
Figure 2a, pure GFO particles were highly agglomerated and the crystalline grains were well defined by the grain boundaries, which showed irregular shapes with an average grain size around 190 nm. The continuous porous network was attributed from the releasing of a large amount of gas during the combustion reaction process. Plate-like particles were observed for Gd
0.5Bi
0.5FeO
3, as seen in
Figure 2b, with an average particle size around 123 nm.
Figure 2c shows the SEM images of the prepared Gd
0.3Bi
0.7FeO
3 powder, with a grain size of about 180 nm. Apparently, with increasing doping amounts, the grain size of the samples decreased gradually, indicating that the crystal growth was inhibited by the introduction of Bi
3+. This behavior could be attributed to the formation of crystal defects due to the occupation of the lattice site of the host structure by dopant ions, which acts as a barrier to the crystal growth and thus reduces the particle size [
17].
Figure 2d shows the SEM images of the Gd
0.1Bi
0.9FeO
3 powder calcined at 550 °C. Due to the lower calcination temperature, the elliptical or spherical particles were partially agglomerated, with a particle size of around 120 nm. Smaller particles had a higher surface energy, which may stimulate the agglomeration process to occur [
18].
Figure 3 demonstrates the result of the XPS analysis of the spectra of the elements Bi, Fe and O in the Gd
0.5Bi
0.5FeO
3 sample.
Figure 3a shows the two peaks located at 158.68 eV for Bi 4f
7/2 and 163.98 eV for Bi 4f
5/2. The energy difference between the Bi 4f
7/2 and Bi 4f
5/2 peaks was around 5.3 eV, which confirms the +3 oxidation state of bismuth [
19]. In
Figure 3b, the asymmetric peaks observed in the Fe 2p spectrum were resolved into Fe 2p
3/2 and Fe 2p
1/2. The typical peaks of Fe
3+ were located at 711.03 eV and 724.83 eV, with a satellite peak at 718.22 eV. Meanwhile, the peaks at 709.72 eV and 723.25 eV were assigned to Fe
2+. The appearance of defects broke the charge balance of the system in the process of Bi ion replacing Gd. In order to make the charge balance of the system, Fe
3+ ions were converted to Fe
2+ ions. The presence of Fe ions of varied valence states will be conducive to the formation of more oxygen vacancies, which is beneficial to the surface adsorption on catalysts of organic and oxygen species [
20].
Figure 3c depicts the O 1s spectra of the GBFO5 powder; two peaks were found at 529.28 eV and 530.78 eV. The O-I peak is generally believed to be caused by the O
2− ion in the crystal structure of the material, and O-II peaks may be formed by oxygen vacancies or defects [
21].
Figure 4a,b shows the magnetic hysteresis loops of Gd
1−xBi
xFeO
3 (x = 0.0, 0.1, 0.3, 0.5, 0.7 and 0.9) at room temperature. In
Figure 4a, the linear hysteresis curve was observed for GFO and GBFO1, showing characteristic features of antiferromagnetic (AFM) behavior, due to their canted antiferromagnetic spin structure and high magnetic anisotropic energy. Similar AFM characteristics of GdFeO
3 was also reported by other groups [
22,
23]. Magnetic hysteresis loops were observed for Gd
1−xBi
xFeO
3 (x = 0.3, 0.5, 0.7, 0.9), indicating that the week ferromagnetic behavior was partly induced by Bi
3+. Meanwhile, the magnetization was weakened for Gd
1−xBi
xFeO
3 (x = 0.0, 0.1, 0.3, 0.5, 0.7), and it was moderately strengthened for Gd
1−xBi
xFeO
3 (x = 0. 9) which belongs to the
R3c phase of BiFeO
3. Overall, compared with pure GdFeO
3, weak ferromagnetic behaviors were observed for solid solution compounds, and the magnetization of Gd
1−xBi
xFeO
3 was effectively decreased. In view of the unsaturation of the M-H curves for Gd
1−xBi
xFeO
3 (x = 0–0.7), canted antiferromagnetic ordering is still considered to exist in these samples even though the ferromagnetism was enhanced.
Generally, the magnetic variations are influenced by a variety of factors, including the chemical composition, magnetic anisotropic field, structure, grain size, morphology, defects, domain wall motion, magnetic moment reversal, etc. [
24]. With the
Pbnm structure, the family of RFeO
3 has two magnetic sublattices from the 4f-electrons of R
3+ and 3d-electrons of Fe
3+, and there exists three types of magnetic exchange interaction: Fe
3+-Fe
3+, R
3+-R
3+ and Fe
3+-R
3+ [
1]. The spin-canting of RFeO
3 is mainly caused by the Dzyaloshinskii–Moriya interaction between antiferromagnetically ordered Fe 3d spins, and the spin-canting angle is closely related to the lattice distortion including the bond angle and length of Fe-O-Fe. For GdFeO
3, at room temperature, the Fe
3+-Fe
3+ interaction was dominant, which caused the Fe
3+ spins usually order at 660 K to have a slightly canted
G-type AFM structure. The substitution of Gd
3+ ions by Bi
3+ ions with larger radii can result in the modification of the lattice distortion. Considering the XRD refinement results, the Fe-O bond length and the Fe-O-Fe bond angle were highly dependent on the doping content of Bi. It can be seen that magnetization of Gd
1−xBi
xFeO
3 (x = 0, 0.1, 0.3, 0.5, 0.7) was directly proportional to the Fe-O2-Fe bond angle and inversely proportional to the Fe-O2 bond length, which is consistent with the conclusion of Raj et al. [
25]. Generally, the introduction of bismuth usually results in decreased magnetization at room temperature, which also originates from decreased interactions between Fe-O-Fe and distortion of the FeO
6 octahedral of the perovskite structure. Meanwhile, according to the SEM results, compared with GFO, smaller and more dispersed particles were observed for Gd
1-xBi
xFeO
3, which possibly led to the enhancement of the surface spin effect, thus reducing the saturation magnetization.
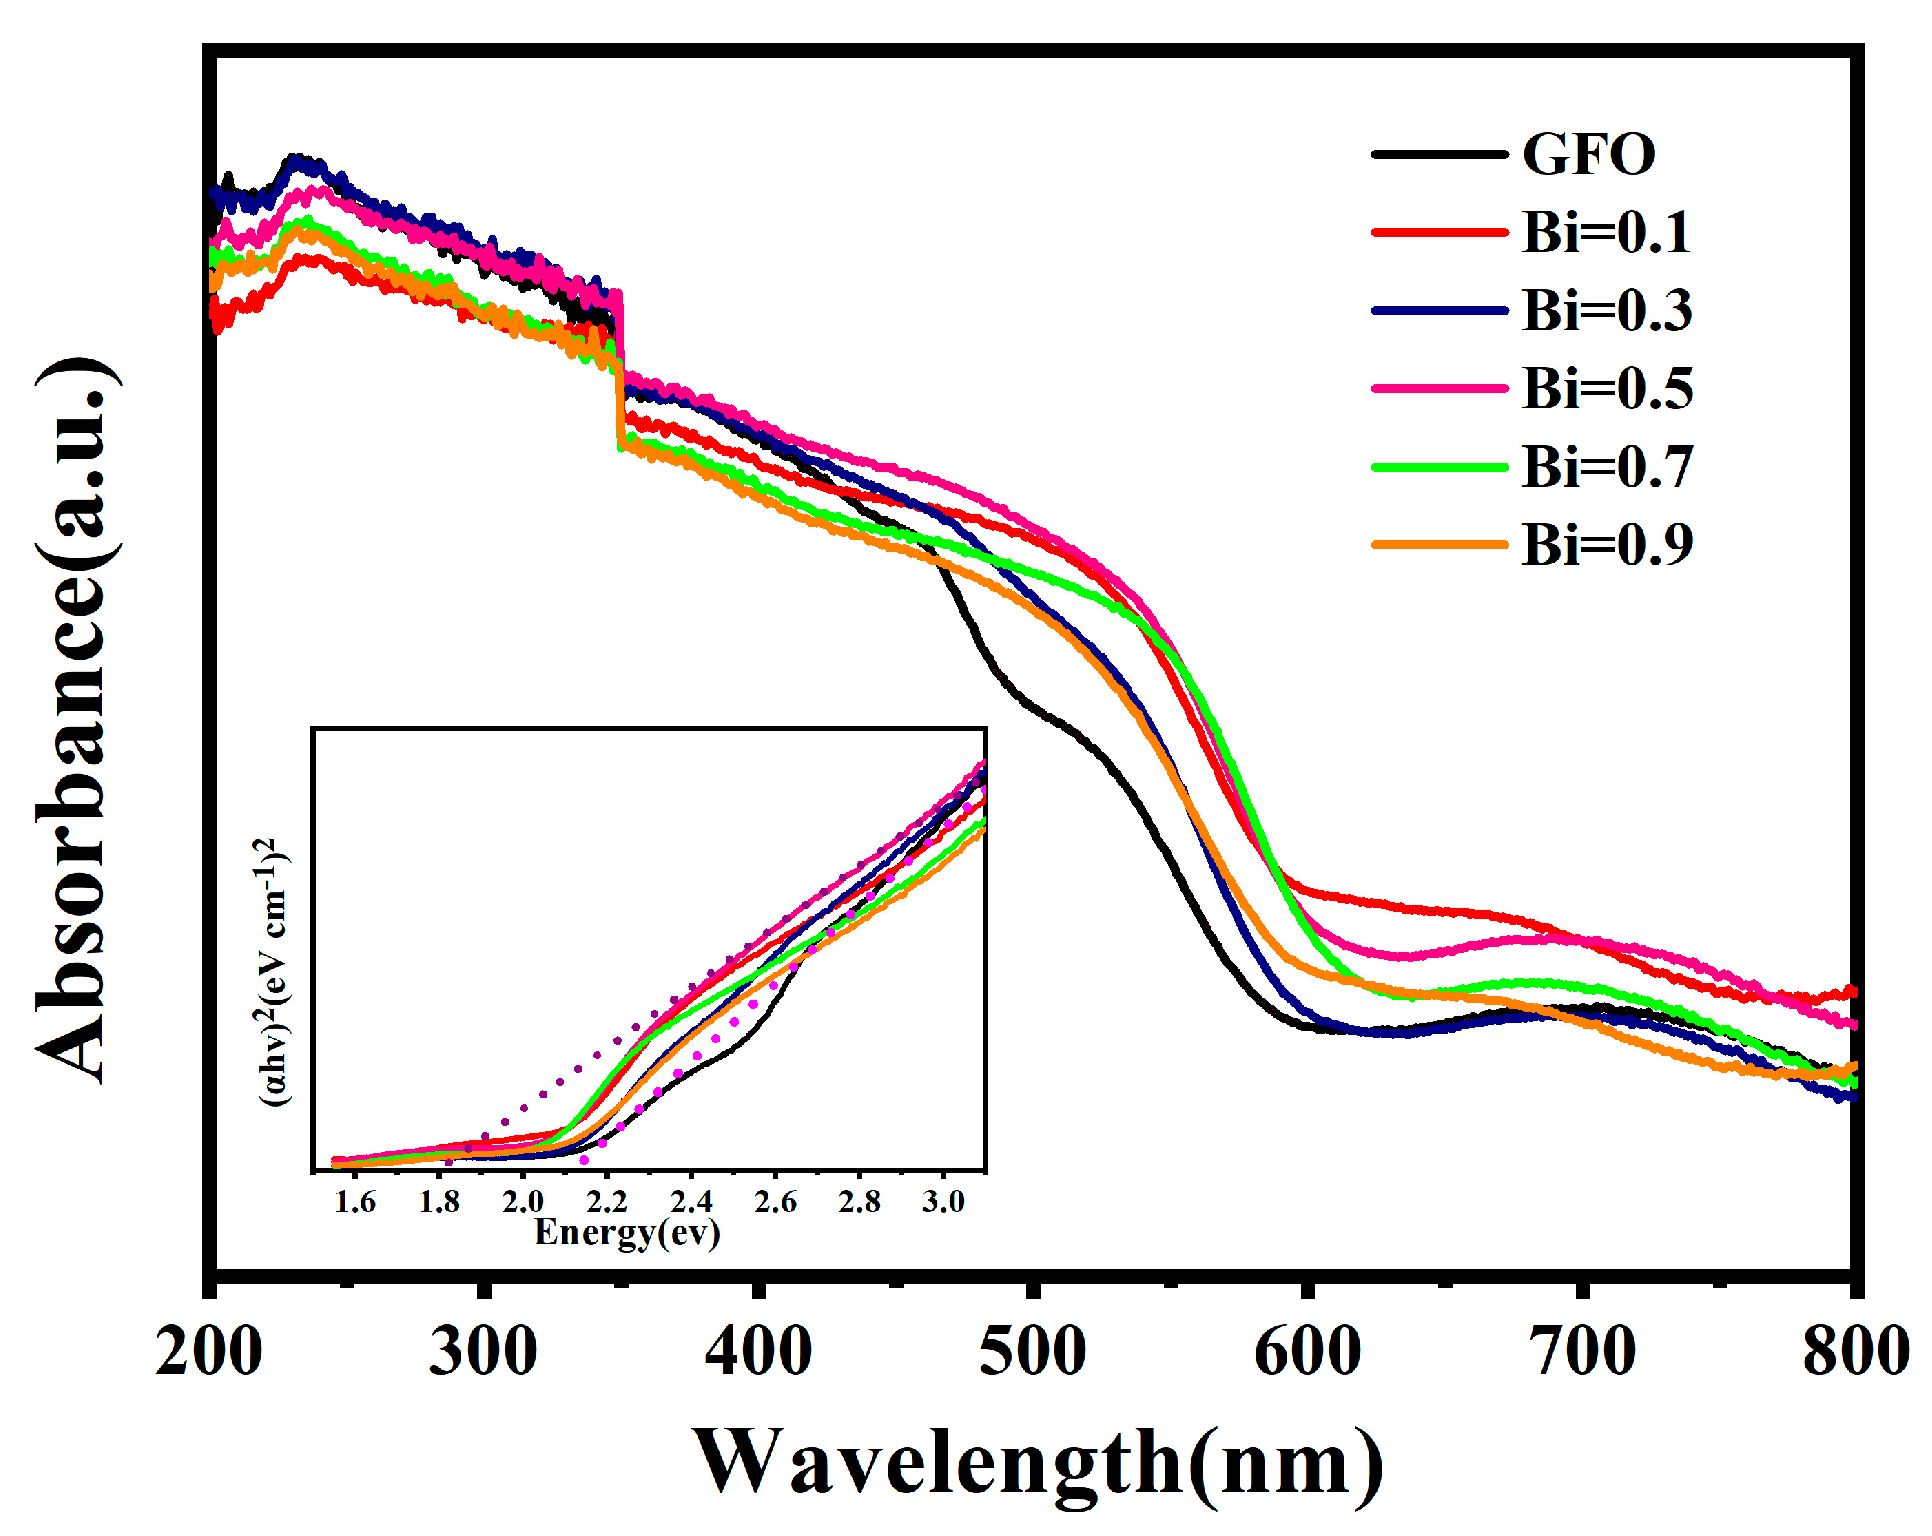
Light absorption is crucial for photocatalytic activities. The UV-vis absorbance spectra of the Gd
1−xBi
xFeO
3 samples are presented in
Figure 5. The optical band gap of Gd
1−xBi
xFeO
3 was calculated by the Tauc relationship:
where
α,
h,
v,
Eg and
A are the absorption coefficient, Plank’s coefficient, light frequency, band gap energy and a constant, respectively. The
Eg value was estimated by extrapolating the linear region of the plot in the energy axis (insets in
Figure 5). According to linear extrapolation, the bandgap of GdFeO
3 was calculated to be 2.21 eV, which is quite comparable with previous reports [
26,
27]. For the Bi
3+-doped GdFeO
3, the optical band gap was effectively decreased, with enhanced absorptions of both UV and visible light. In addition, the narrower band gap allowed more carrier excitation under visible light irradiation, implying improved photocatalytic activities. In particular, the smallest band gap and highest visible light absorption were observed in Gd
0.5Bi
0.5FeO
3, and the band gap was around 1.8 eV.
In addition, the reduction in band gap for all the doped sample may be related to the distortion in the Fe-O-Fe octahedral rearrangement of molecular orbitals and decreased particles size [
28]. The decrease of the band gap was also observed in Sm-doped BiFeO
3 and Mn-doped GdFeO
3 [
5,
29]. The hybridization between the Fe-3d and O-2p states depends on Fe-O-Fe exchange angles, which directly modify the band gap [
14]. In addition, the band gap is also the result of some other factors, such as the defect levels, the crystallinity and the oxygen vacancies on the surface. Thus, the higher absorption and narrower band gap of GFO5 may originate from its smaller particle size, lattice distortion caused by appropriate Bi ion doping, higher crystallinity, etc. Proper band gap could promote the light absorption and increase photogenerated charge carriers, thus improving the catalytic activity [
30]. The introduction of Bi dopants favors the light absorption in the GFO nanoparticles, implying that improved visible light-driven photocatalytic performance is expected.
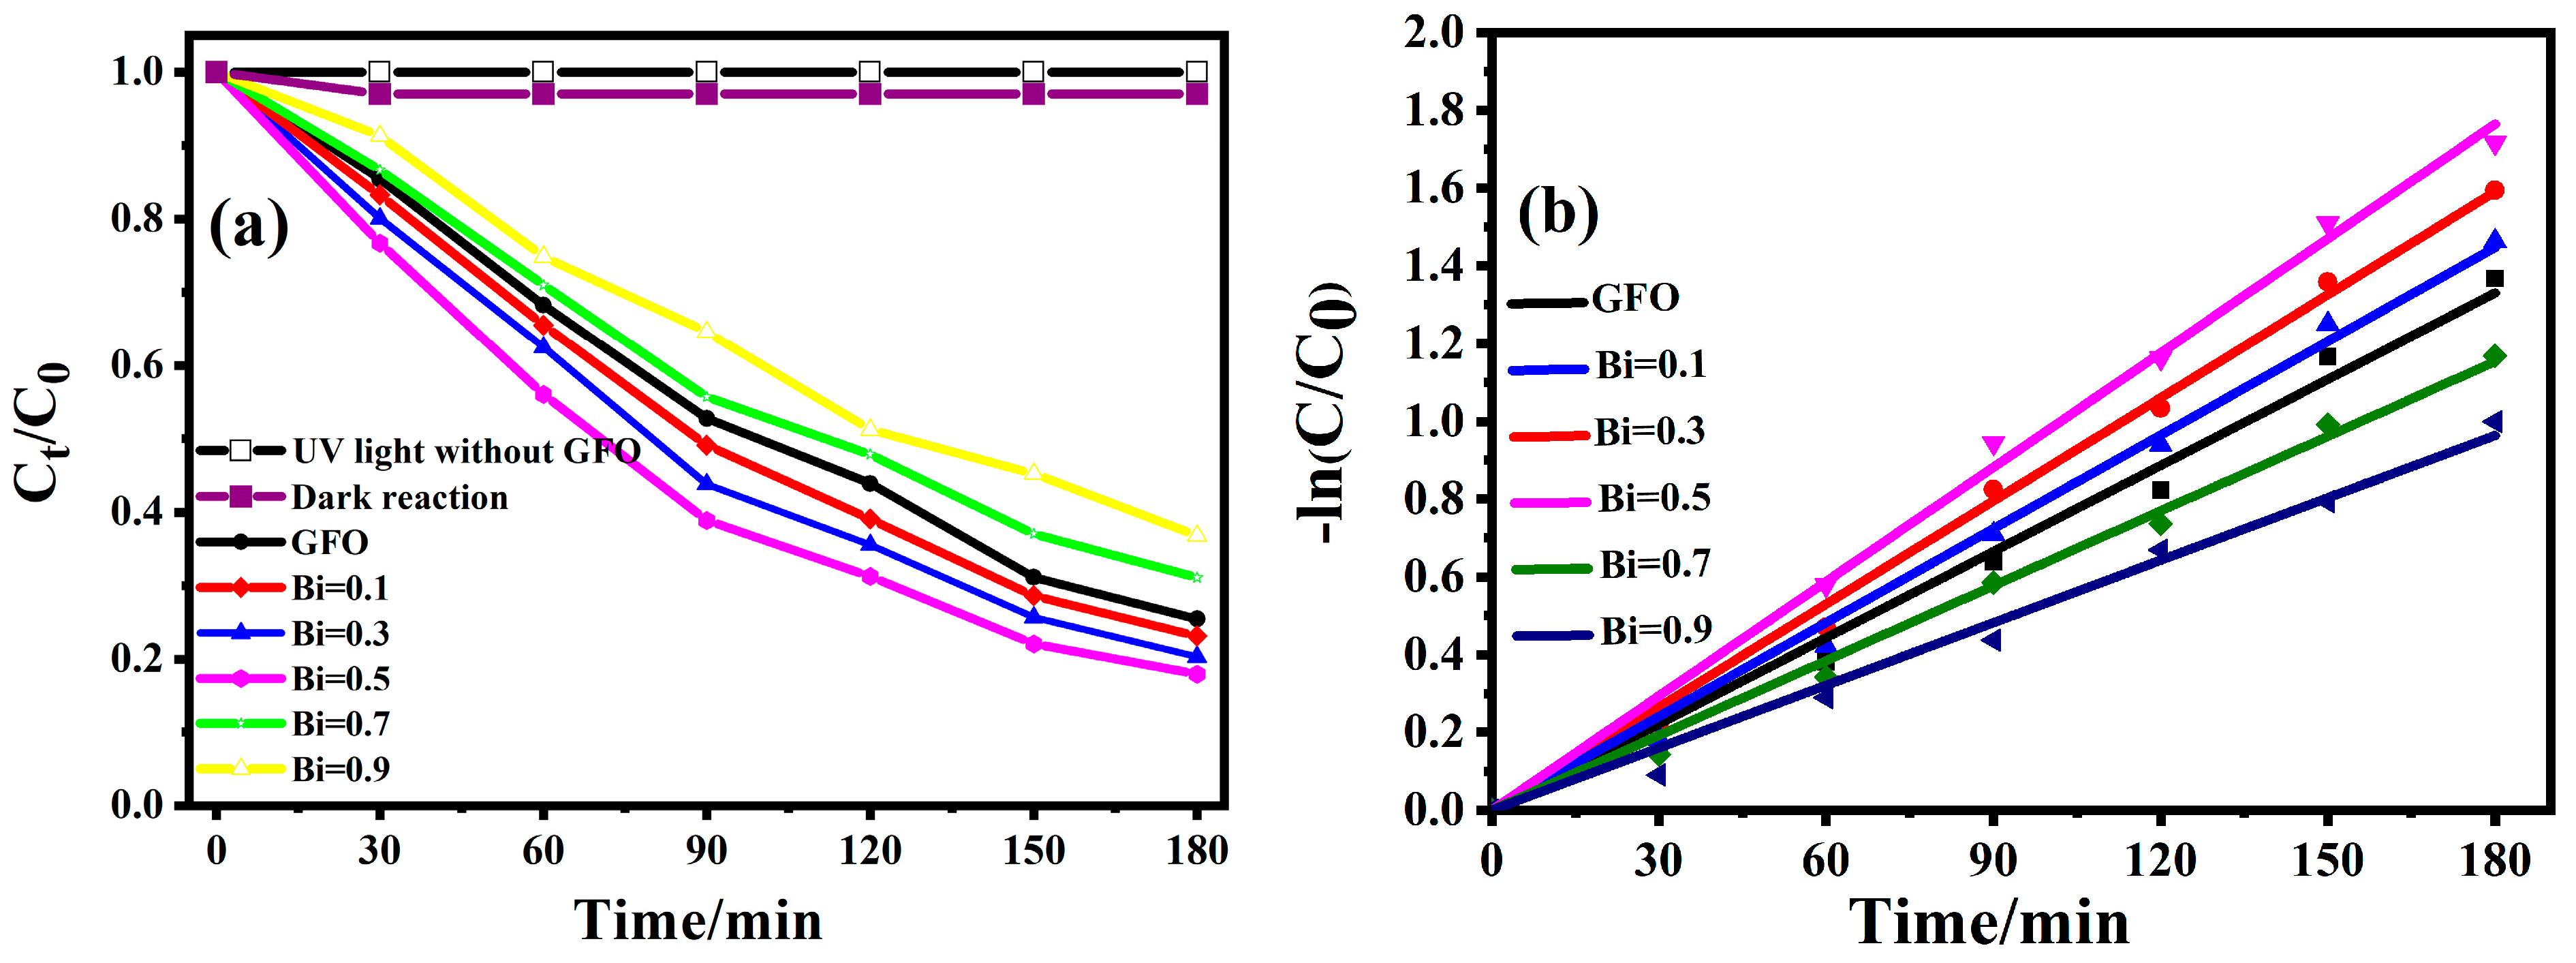
The photocatalytic activity of Gd
1−xBi
xFeO
3 samples were evaluated by degradation of MB under visible light irradiation. The (C
t/C
0) vs. visible light irradiation time (t) curve for Gd
1−xBi
xFeO
3 sample is shown in
Figure 6a. The concentration of MB hardly changed when the photocatalyst was not added or the reaction was carried out in the dark. It indicates that MB is a stable pollutant and the solution reached the adsorption–desorption equilibrium. After 180 min of visible light illumination, the degradation efficiency reached about 74%, 79.7%, 76.7%, 82.1%, 69% and 63.2% for GFO, GBFO1, GBFO3, GBFO5, GBFO7 and GBFO9, respectively. Obviously, the concentration of Bi
3+ ions doping affected the photocatalytic performance of the sample. With the increase of the Bi
3+ doping amount, the degradation efficiency of MB first increased and then decreased, and GBFO5 showed exceptionally enhanced photocatalytic efficiency. The degradation performance of Gd
1-xBi
xFeO
3 was similar to the result of the Y
1−xBi
xFeO
3 system, in which the catalytic activities ranged from 50% to 80% MB degradation efficiency for 180 min for x = 0.1 to x = 0.4, respectively [
14]. A BiFeO
3-GdFeO
3 heterojunction photocatalyst has been reported to degrade 56% MB and 98% MB in 180 min and 9 h, respectively, under sunlight irradiation [
31]. The nanogranular BiFeO3 exhibited 53% MB dye degradation after irradiation for 180 min [
32]. The nanotubes showed much improved catalytic activity with a degradation efficiency of 75% after irradiation for 180 min. The results also imply that the photocatalytic performance is partly influenced by the crystalline morphology.
Figure 6b represents the ln(C
0/C
t) vs. irradiation time (t) curves, where the linearity nature indicated the first-order kinetics of the visible light-driven photocatalytic MB degradation. Therefore, the photocatalytic activities can be evaluated by the apparent first-order rate constant k, and it can be expressed by Equation (2) [
33]:
where C
0 represents the initial concentration of MB, C is the concentration of MB after the degradation with respect to time (t) and k is the rate constant. The obtained values of k were 7.3 × 10
−3 min
−1, 8.0 × 10
−3 min
−1, 8.8 × 10
−3 min
−1, 9.8 × 10
−3 min
−1, 6.4 × 10
−3 min
−1 and 5.3 × 10
−3 min
−1 for GFO, GBFO1, GBFO3, GBFO5, GBFO7 and GBFO9, respectively. This further confirmed that proper Bi
3+ substitution of GFO can significantly improve the photocatalytic activity.
The charge separation of e
−-h
+ pairs on the interface of the photocatalyst can be revealed by the electrochemical impedance spectra (EIS). The radii of the semicircles are proportional to the charge transfer resistance. For the photocatalytic reaction, a reduction in resistance always means a faster charge transfer and slower recombination of holes and photoelectrons occurred, which is helpful for the relevant photocatalytic efficiency.
Figure 7a shows the EIS spectra obtained for GFO, GBFO1, GBFO3, GBFO5, GBFO7 and GBFO9. Compared with GFO, the radius of the semicircle for Gd
1-xBi
xFeO
3 (x = 0.1, 0.3, 0.5) decreased with increasing Bi
3+, implying reduced charge transfer resistance. Thereafter, the radius of the semicircle increased for Gd
1−xBi
xFeO
3 (x = 0.7, 0.9). GBFO5 exhibited the smallest semicircle, which is indicative of the best charge transfer efficiency and the slowest recombination of holes and photoelectrons out of these five samples, which contribute to the photo-degradation organic pollutants.
Figure 7b shows the Mott–Schottky plots of GFO, GBFO1, GBFO3, GBFO5, GBFO7 and GBFO9 with a fixed frequency (2000 Hz). The positive slope featured typical n-type semiconductors for the samples. According to Equation (3), the flat band potential V
FB of Gd
1−xBi
xFeO
3 was estimated by the Mott–Schottky (MS) measurement [
34].
where,
is the space charge capacitance (in F cm
−2),
e is electronic charge in
C,
ε0 is the permittivity of free space, ε is the dielectric constant of the semiconductors,
Nd is the charge carrier density in cm
−3,
EFB is the flat band potential in V,
K is the Boltzmann constant and
T is the temperature in
K. The flat-band potentials V
FB were obtained from the extrapolation of the Mott–Schottky plots, which were −0.45, −0.53, −0.55, −0.68, −0.50 and −0.48 eV (vs. Ag/AgCl) for GFO, GBFO1, GBFO3, GBFO5, GBFO7 and GBFO9, respectively. Then, the values corresponded to be −0.25, −0.33, −0.35, −0.48, −0.30 and −0.28 eV versus the normal hydrogen electrode (NHE), respectively. Generally, the conduction band minimum (E
CB) of n-type semiconductors is approximately more negative than E
FB by 0.2 eV. Correspondingly, the conduction band minimum (E
CB) of Gd
1−xBi
xFeO
3 (x = 0.0, 0.1, 0.3, 0.5, 0.7 and 0.9) were calculated to be −0.45, −0.53, −0.55, −0.68, −0.50 and −0.48 eV, respectively. The valence band maximum (E
VB) can be determined with the relation Eg = E
VB − E
CB, and the optical bandgaps were obtained from the UV-vis absorption spectra. Based on these results, the band energy diagram was displayed in
Figure 8. Compared with GFO, the conduction band of Bi-doped samples was more negative, making it easier to generate superoxide anions to participate in the reactions.
The scavenger studies were carried out for GBFO5 which was taken as the typical example. Tertbutyl-alcohol (TBA), p-benzoquinone(p-BQ), K2Cr2O7 and EDTA-2Na were used as scavengers for OH·, O2·−, e− and h+, respectively. These scavengers were separately added to the solution. The photocatalytic experiments were conducted in the presence of the scavengers along with GBFO5. When irradiated for 180 min, with the addition of TBA and EDTA-2Na, the degradation efficiency reached 75.3% and 73.7%, respectively. Compared to the solution without any scavengers, the addition of TBA and EDTA-2Na had a negligible influence on the photocatalytic activity, implying that OH· and h+ are not the main active species. On the contrary, only 40.2% and 33.7% of MB was degraded with the addition of p-BQ and K2Cr2O7, respectively. Severe depression of the performance indicates that O2− and e− were the dominant reactive species responsible for the degradation of MB.
According to the above results and discussions, a possible mechanism of the charge transfer and photocatalytic degradation was also proposed. As illustrated in the scheme in
Figure 8, under visible light irradiation, photogenerated electrons in the valance band (VB) of the photocatalyst obtain sufficient energy to jump to the conduction band (CB), leaving holes in the VB (Equation (4)). Since the conduction band edge of Gd
1-xBi
xFeO
3 is more negative than the standard redox potential E(O
2·−/O
2)(−0.33 eV vs. NHE) [
35], the excited electrons migrate to the catalyst surface, followed by reaction with dissolved O
2 to generate superoxide radicals (O
2·−) (Equation (5)). In addition, the standard redox potential E(O
2/H
2O
2) (0.685 eV vs. NHE) [
36] is located between the CB and VB of Gd
1-xBi
xFeO
3, indicating that electrons could also react with oxygen to form H
2O
2, which is subsequently reduced to form hydroxyl radicals (OH
·) (Equations (6) and (7)) [
7]. The holes formed at the VB may directly oxidize the organic pollutant [
11]. Finally, the superoxide radicals, hydroxyl radical and holes decompose the MB into CO
2, H
2O and by-products, which could be benzenesulfonicacid 2-amino-5-(methyl amino)-hydroxybenzene sulfonic acid and 2-amino-5-(NN-methyl formamide) benzene sulfonic acid [
37].
In addition to the photocatalytic efficiency, the reusability and the stability of photocatalyst are two important factors for practical application. To evaluate the stability, we conducted photocatalytic experiments using Gd
0.5Bi
0.5FeO
3 for five successive runs under the same conditions as mentioned above. The sample was irradiated for 180 min for every cycle. As shown in
Figure 9a, almost no change in the photocatalytic activity was observed after five circulations, suggesting good stability. To further verify its stability, we performed XRD measurements of the GBFO5 nanoparticles before and after the photocatalysis reaction, which is displayed in
Figure 9b. The crystal structure of the GBFO5 photocatalyst did not change after the photocatalytic reaction and no secondary phase was observed after the reaction, verifying good stability of this photocatalyst.
The photocatalytic activities are generally determined by numerous factors, including the crystalline phase, morphology, defects, band energy, surface activity, etc. Enhanced photocatalytic activities of Gd1−xBixFeO3 have been observed, with the optimum performance observed with Gd0.5Bi0.5FeO3. The SEM results indicated that GBFO5 samples show smaller particle sizes, which endows it with higher photocatalytic activity due to the increased number of reactive sites for surface reactions. Based on the absorption spectra, it can be seen that Bi doping leads to a lower band gap and higher absorbance in a wider visible light region, which contributed to the generation of more photogenerated carriers. Combined with the EIS and Mott-Schottky measurements, GBFO5 also showed high charge transfer efficiency and more negative redox potential over the O2·−/O2 redox potential. The photogenerated electrons were easier to react with oxygen to generate superoxide anions which were the dominant active species for the degradation of MB. Although GBFO9 was also characterized with smaller crystalline particles, the band structure of GBFO5 is more favorable for the redox reactions. All these factors possibly contribute to the optimum performance of Gd0.5Bi0.5FeO3. Experiments exploring deeper insights into the photocatalytic kinetics are still going on.


