Article

Influence of the Preparation Technique on the Magnetic Characteristics of ε-Fe2O3-Based Composites

by
Dmitriy O. Testov
1,
Kamil G. Gareev
1,2,
Ivan K. Khmelnitskiy
1,2,*,
Andrei Kosterov
3,
Leonid Surovitskii
3,4 and
Victor V. Luchinin
1,2
1
Engineering Centre for Microtechnology and Diagnostics, Saint Petersburg Electrotechnical University “LETI”, 197022 Saint Petersburg, Russia
2
Department of Micro and Nanoelectronics, Saint Petersburg Electrotechnical University “LETI”, 197022 Saint Petersburg, Russia
3
Department of Earth Physics, Saint Petersburg University, 199034 Saint Petersburg, Russia
4
Department of Geological and Mining Engineering and Sciences, Michigan Technological University, Houghton, MI 49931, USA
*
Author to whom correspondence should be addressed.
Magnetochemistry 2023, 9(1), 10; https://doi.org/10.3390/magnetochemistry9010010
Submission received: 8 December 2022 / Revised: 22 December 2022 / Accepted: 26 December 2022 / Published: 28 December 2022

Abstract

:
ε-Fe2O3 is an iron(III) oxide polymorph attracting an increasing interest due to its unique magnetic properties combining extremely high coercivity and relatively large saturation magnetization. We review existing methods for the ε-Fe2O3 synthesis focusing on synthesis speed, repeatability, manufacturability and purity of the final product. Samples of ε-Fe2O3 have been synthesized using the two methods that appear the most promising: silica gel impregnation and microemulsion. In both cases, ε-Fe2O3 and α-Fe2O3 are present in the final product as attested by X-ray diffraction patterns and magnetic properties (maximum coercive force at 300 K~1 Tesla). Two different precursors, iron(III) nitrate and iron(II) sulfate, have been used in the silica gel impregnation method. Somewhat surprisingly, iron sulfate proved superior yielding ε-Fe2O3 content of 69% in the total iron oxide product, compared to 25% for iron nitrate under the same synthesis conditions. These results pave the way for modifying the existing ε-Fe2O3 synthesis methods aiming to increase the content of the epsilon phase in the final product and, consequently, improve its physicochemical properties.

1. Introduction

Iron(III) oxide (Fe2O3) is one of the most commonly used metal oxides for various applications. The polymorphic nature of Fe2O3 has been known for a very long time, and nowadays, the existence of five (alpha, beta, gamma, epsilon, and zeta) Fe2O3 crystalline polymorphs has been established [1,2].
The most stable and widespread are alpha and gamma polymorphs found in nature as the minerals hematite and maghemite, respectively. Beta and zeta polymorphs are metastable and do not exist in natural conditions [2,3,4]. The Epsilon phase, once also believed to be metastable, has been increasingly found in rocks [5,6] and in man-made materials [7,8,9]. Of all Fe2O3 polymorphs, only ε-Fe2O3 is characterized by a combination of unique magnetic properties, primarily high coercivity and small particle size in the nanometer range.
ε-Fe2O3 polymorph was discovered in 1934 [10]. Despite notable differences between the obtained material and both hematite and maghemite, its characteristic properties took many decades to establish. In 1946, an X-ray diffraction spectrum of Fe2O3 synthesized at high temperatures was reported [11]. This spectrum did not correspond to either α-Fe2O3 or Fe3O4, which is a stable phase at temperatures above 1700 K in an inert atmosphere [11]. Below 1600 K, some of the ε-Fe2O3 nanoparticles appeared to be converted into the more stable α-Fe2O3, while at higher temperatures, all Fe2O3 polymorphs were converted into Fe3O4. Only much later, in 1963, was this new structure named and characterized [12].
Tronc et al. [13] have proposed that ε-Fe2O3 is a non-collinear four-sublattice ferrimagnet, likely to be piezoelectric, with three octahedrally and one tetrahedrally coordinated sublattices, arranged in such a way that Fe spins in the tetrahedral sublattice are canted with respect to those in octahedral ones. However, the magnetic structure of ε-Fe2O3 is still debated. The initial assessment [13] has been challenged, suggesting that at 300 K, no spin canting occurs in the tetrahedral sublattice, and the net magnetization of ε-Fe2O3 is simply due to uncompensated magnetic moment of spins in the tetrahedral and one of the octahedral sublattices, while the moments of two other octahedral sublattices mutually cancel [14]. Furthermore, ε-Fe2O3 exhibits rich and not yet fully understood magnetic behavior at cryogenic temperatures [14,15,16].
Concerning the crystal structure of ε-Fe2O3, Tronc et al. [13] have demonstrated that it occupies an intermediate position between γ-Fe2O3 and α-Fe2O3 in several respects, for example, the arrangement of anions and the proportion of four-coordinated cations. The formation of ε-Fe2O3 occurred during the heat treatment of γ-Fe2O3 particles dispersed in silicon dioxide. γ-Fe2O3 particles are resistant to heating as long as the matrix or shell prevents their sintering, which, depending on the degree of agglomeration, leads to the formation of ε-Fe2O3 or α-Fe2O3. Consequently, in order to obtain ε-Fe2O3, it is necessary to limit the size of particles formed during the synthesis of metastable phases. This approach appears promising for obtaining high purity ε-Fe2O3 and potentially can be used to obtain other currently unknown polymorphs of iron oxide under various temperature conditions.
Recently, ε-Fe2O3-like phases have been found in a number of natural [5,6] and man-made materials [7,8,9]. For example, Dejoie et al. [7] have detected the ε-Fe2O3 polymorph in the ceramics of the Song Dynasty (960–1279) manufactured in Jian Yao-type kilns. This suggests that the formation of Fe2O3 polymorphs is associated with thermal transformations of iron-containing materials in the oxidizing atmosphere.
Due to the outstanding magnetic properties of ε-Fe2O3, this polymorph can be used in various applications. First of all, its high coercivity ε-Fe2O3 makes it a promising candidate for a recording medium. Investigation of the effect of high-frequency resonance in the ε-Fe2O3 phase [17,18] shows the possibility of its applications in electronic devices intended for high-speed wireless communication, for effective suppression of electromagnetic interference and stabilization of the electromagnetic transmittance [18,19,20]. ε-Fe2O3 possesses both spontaneous magnetization and polarization, so it can be used as an advanced magnetoelectric material with possible applicability in various electric/magnetic field-tunable devices [21] or in biomedicine for the targeted delivery of drugs (under the action of a magnetic field), including colloidal solutions of magnetic nanoparticles (MNPs). For example, during transdermal procedures, in particular, based on the use of microneedles [22]. Synthetic and biogenic MNPs based on various ferrimagnetic iron oxides (Fe3O4, γ-Fe2O3, and ε-Fe2O3) have low toxicity and, therefore, are used in preparations for theranostics [23].
The present work carries out a review of the most promising synthesis methods of ε-Fe2O3, the most efficient synthesis methods of this polymorph are selected, and the physical properties of samples of this material are obtained and studied.

2. Synthesis Methods for ε-Fe2O3

Several methods for synthesizing high-purity ε-Fe2O3 have been considered: sol-gel method, silica gel impregnation method, microemulsion method, chemical vapor deposition (CVD), thin film deposition methods, and thermal decomposition method.
The sol-gel method makes it possible to synthesize ε-Fe2O3 in a silica gel matrix, which is necessary to limit the maximum sizes of nanoparticles during annealing. To obtain the sol, tetraethoxysilane (TEOS) is used as a silica nanocomposite precursor. Iron nitrate serves as a source of iron for the formation of an oxide phase, which subsequently turns into ε-Fe2O3 upon annealing [24]. With the help of TEOS, a shell for iron oxide particles is formed, which is necessary to limit particle size during growth. The processes of hydrolysis and condensation proceed in an acidic hydroethanolic medium at a molar ratio of TEOS:H2O:EtOH = 1:6:6, pH ≈ 0.9. The reactions are self-catalyzed by nitric acid formed during the hydrolysis of iron nitrate. Gelation at room temperature occurs in 20 days; after that, the gel is dried for 14 h at 60–80 °C. The obtained red-brown translucent glassy material is crushed in an agate mortar and then subjected to heat treatment in air with temperature increasing in steps of 100 °C, followed by 3-h annealing and slowly cooling at each temperature, from 300 °C to 1100 °C.
Using this method, samples of ε-Fe2O3-SiO2 composite nanoparticles with an average diameter of 25 nm have been obtained [24]. The properties of samples depend on the synthesis conditions, varying from superparamagnetic to ferrimagnetic at 300 K for the samples annealed at 1000 °C and 1100 °C. Néel temperature of the ε-Fe2O3 phase was found to be 510 K, and the coercive force at 300 K was about 20 kOe. At the same time, ε-Fe2O3 remained stable up to about 1300 °C.
In 2021, samples of ε-Fe2O3 with a high coercivity (>1 T) were synthesized using the sol-gel method [25]. The formation of the ε-Fe2O3 phase apparently followed γ → ε → α pathway. The highest ε-Fe2O3 content, of up to 90% in the mixture as calculated from Mössbauer spectra measured at room temperature, was achieved for the sample heat-treated at 1000 °C for 10 h. The magnetic properties of the samples range from superparamagnetism to a ferrimagnetic behavior, and a two-step magnetic transition typical for ε-Fe2O3 [14,15,16] was observed in the range of 80–150 K.
The silica gel impregnation method is a modification of the sol-gel method, in which a silica gel is used as the SiO2 matrix, allowing to exclude the long-term sol-gel stage from the synthesis process. Silica gel is impregnated with iron sulfate solutions of various concentrations, followed by drying (4 h at 180 °C) and high-temperature annealing in a muffle furnace (4 h at 400–900 °C). Using this method, it is possible to synthesize stable nanoparticles with a diameter of 20 nm, a Néel temperature of 470 K and a coercive force of about 9 kOe [26,27,28,29,30].
The microemulsion method is based on mixing two microemulsions formed with cetyltrimethylammonium bromide (CTAB) and octane-based butanol-1 (oil phase). A solution of Ba(NO3)2 and Fe(NO3)3 salts was placed in an aqueous phase within the reverse micelles of the first microemulsion, and a solution of was placed inside the second one. Microemulsions are mixed, and then TEOS is added to the solution, all operations being carried out with rapid stirring until the mixture reaches homogeneity. The desired material is separated by centrifugation, heated to 900–1100 °C, and maintained at this temperature for 4 h [31,32].
Samples synthesized by this method contained rod-shaped ε-Fe2O3 nanoparticles with geometric dimensions of 100–140 × 20–40 nm, Neel temperature of 480 K and coercive force of 20 kOe.
Chemical vapor deposition is implemented using a microwave torch discharge, which is initiated in argon on a hollow nozzle-shaped electrode. ε-Fe2O3 is deposited on the walls of the reaction chamber (quartz tube) from a flowing gas mixture consisting of vapors of iron pentacarbonyl (Fe(CO)5) and hydrogen peroxide (H2O2) [33]. In such a system, ε-Fe2O3 precipitates at a rate of about 1 g/h and, immediately after being removed from the reaction chamber, can be stored in air as a powder. Due to the flow system, this method can work continuously, but it has a significant drawback – the final product contains a significant amount of γ-Fe2O3 and α-Fe2O3 impurities.
The thin film deposition methods can be based either on atomic layer deposition (ALD) or pulsed laser deposition (PLD).
To implement the ALD process, FeCl3 powder placed in a reactor in an open boat at 158 °C and deionized water in a container outside of the reactor are used as precursors [34]. Nitrogen is used as a carrier gas to purge the reactor after each cycle. Thin films of ε-Fe2O3 are deposited on a silicon or borosilicate glass substrate at temperatures from 210 °C to 360 °C, having a thickness of about 260 nm and a coercive force of 1.6 kOe.
Epitaxial films of ε-Fe2O3 have been obtained by PLD from a Fe2O3 target on GaN substrates using a KrF laser [35,36]. The growth of ε-Fe2O3 takes place in an oxygen atmosphere at a pressure of 20 Pa and a substrate temperature of 750–850 °C. For the obtained films, the correlation between the crystal structure and magnetic properties, dependence of the coercive force on the thickness, and mechanism of films nucleation and formation have been investigated.
The method of thermal decomposition consists of annealing a nontronite clay mineral (Garfield, Washington, DC, USA) followed by separation of the iron oxide phase by leaching of silicates. The coarsely ground material was heated to 900 °C at an arbitrary rate and then to 970 °C at a rate of 0.5 °C/min and maintained at this temperature for 30 h. After annealing, iron oxide was isolated by leaching the silicate phases with sodium hydroxide solution for 5 days at 70 °C. After filtration and thorough washing with water and a solution of acetic acid, a brown powder was obtained. This method can be used to obtain crystalline ε-Fe2O3 in the form of a precipitate or in the form of nanoparticles in a palladium matrix during the internal oxidation of the Pd96Fe4 alloy [37].
The priority parameter for ε-Fe2O3 is the coercive force, while methods should be selected to optimize for speed and final product purity. Based on the data summarized in Table 1, we used the microemulsion method and the silica gel impregnation method to synthesize ε-Fe2O3. The silica gel impregnation method is simple, fast, and low-cost. The microemulsion method is more complicated but is characterized by the absence of other iron oxide polymorphic modifications and the highest fraction of ε-Fe2O3 in the final product. The SiO2 matrix used in these methods can be removed by etching.

3. Materials and Methods

Silica gel impregnation method. Silica gels with different physicochemical characteristics (Silipor 300, Silipor 075 (Vekton, Russia), Superico (Merck Millipore, Burlington, Massachusetts, MA, USA)) have been purchased and used as is to create the SiO2 matrix. Silica gels were impregnated with 1-molar solutions of either iron(II) sulfate or iron(III) nitrate (99%, Vekton, Russia), followed by drying for 4 h at 110 °C. Sequential repetition of impregnation and drying processes has resulted in an increase in ε-Fe2O3 concentration in the final product. The dried samples were subjected to high-temperature annealing at 900 °C.
The microemulsion method combines microemulsion and sol-gel technologies. First, two reverse microemulsions were prepared using 9.7 mM CTAB, 39 mM butanol-1 (99%, Vekton, Russia) and 330 mM deionized water in 110 mM isooctane (99%, Vekton, Russia). The reverse micelles of the first microemulsion contained an aqueous solution of salts: 0.74 mM Fe(NO3)3 (99%, Vekton, Russia) and 0.074 mM Ba(NO3)2 (99%, Vekton, Russia), and the second contained 30 mM aqueous ammonia (99%, Vekton, Russia). The second microemulsion was then added dropwise to the first one with rapid stirring. 6.7 mM TEOS (99%, Vekton, Russia) was added to the resulting solution, followed by stirring for 20 h at a speed of 300 rpm. After 20 h of stirring, a gel was formed, which was successively washed with chloroform and methanol, and a precipitate was separated by centrifugation. The precipitate has then been annealed at 1000 °C. Synthesis procedures and obtained samples are summarized in Table 2. Samples obtained using the silica gel impregnation method are named according to the used silica gel and the precursor (Iron Sulphate—S or Iron Nitrate—N): Superico—SUP and SUP-2, Silipor 75–S75, Silipor 300—S300S, S300S-2, S300N. Three samples obtained by the microemulsion method under the same synthesis conditions are designated ME-A, ME-B, and ME-M, respectively.
X-ray diffractograms of the samples prepared with the silica gel impregnation method have been recorded using a Bruker D2 Phaser (Bruker, Billerica, MA, USA) automatic powder diffractometer. The experiment conditions were: X-ray tube radiation – CoKα1+2, wavelengths λCoKα1 = 1.78900 Å and λCoKα2 = 1.79283 Å, tube operation mode 30 kV/10 mA, position-sensitive detector, reflection geometry, Bragg-Brentano focusing scheme, sample rotation speed 20 rpm, diffraction angle interval 2θ = 5–80°, scan step 0.02°, exposure at a point 1 s. Diffractograms for the samples synthesized with the microemulsion method have been analyzed using a Bruker D8 Discover diffractometer (Bruker, Billerica, MA, USA) in the parallel beam mode with linear focusing, slit width 0.6 mm, a position-sensitive detector with 2.1 aperture, theta-two-theta scanning mode, exposure at a point 2 s. Phase identification has been carried out with the PDXL2 software package (Rigaku, Version 2.0.2, Tokyo, Japan) using the Powder Diffraction File (PDF-2, 2020) powder diffraction database.
Samples have been characterized using remanence measurements in the 1.8–300 K range carried out using a SQUID magnetometer MPMS 3 (Quantum Design, San Diego, CA, USA) in the vibrating sample mode. Isothermal remanent magnetization (IRM) has been acquired in a 5 T field at 1.8 K after cooling in a zero magnetic field (zero field cooling, ZFC) and in a strong magnetic field (5 T, field cooling, FC), respectively. IRM decay curves in the zero field were then measured quasi-continuously during warming to 300 K at the 1.5 K/min rate in the MPMS temperature sweeping mode. IRM (5 T), acquired at 300 K, was measured at the same rate during the cooling-warming cycle between 300 and 1.8 K in a zero field.
To assess the samples’ behavior at high temperatures, the AC magnetic susceptibility (driving field frequency 976 Hz, amplitude 200 A/m) has been measured as a function of temperature up to 700 °C (973 K) in air, using an MFK-1FA Kappabridge (AGICO, Brno, Czech Republic) equipped with a CS4 furnace. This experiment requires about 150–200 mg of material in powder form, and therefore measurements have been performed for the samples synthesized with the silica gel impregnation method only. The microemulsion method didn’t provide an insufficient amount of the material during a single synthesis cycle for the susceptibility measurements.
Hysteresis loops have been measured in a maximum field (7 T, 295 K) using the MPMS 3 in the vibrating sample mode with a logarithmic field increment of 400 points per loop. To obtain coercivity of remanence (Hcr) values, IRM acquired in a 5 T has been remagnetized by the magnetic field of opposite sign up to 3 T, and the respective remagnetization curves have been measured using the same instrument.

4. Results and Discussion

4.1. X-ray Diffractograms

X-ray diffractograms (Figure 1) show lines belonging to ε-Fe2O3 and hematite phases. For samples synthesized with the silica gel impregnation method, the crystalline lattice parameters (Table 3) of both polymorphs correspond reasonably well to the data from the literature. For ε-Fe2O3: a = 5.098(2) Å, b = 8.785(3) Å, and c = 9.468(2) Å [15]; a = 5.095 Å, b = 8.789 Å, and c = 9.437 Å [38] and for α-Fe2O3: a = 5.0345 Å and c = 13.749 Å [39]. However, in samples synthesized with the microemulsion method, the ε-Fe2O3 lattice appears slightly deformed in the ab plane so that the parameter a is some 1–2% lower than the values reported in the literature and found for samples synthesized with the silica gel impregnation method in this study. It should be noted that the hematite phase in these samples also shows lattice parameters slightly smaller than reference values. This may indicate that iron oxides are squeezed to some extent in the silicate matrix. The relative fraction of ε-Fe2O3 phase in the total iron oxide content varies widely, from ~25% in the sample prepared with nitrate precursor to >70% in the sample prepared under the same conditions but with the sulfate precursor.

4.2. Magnetic Properties

Temperature dependences of AC magnetic susceptibility are shown in Figure 2. All samples except S300N show strong Hopkinson peaks associated with the magnetic transition of the ε-Fe2O3 phase and much weaker but still noticeable peaks just below the hematite Néel temperature. The transition temperature of the ε-Fe2O3 phase lies in the 225–230 °C (498–503 K) range, close to the maximum values reported in the previous studies [24,40,41,42,43,44,45,46]. The S300N sample (Figure 2c) is notable in that it does not exhibit Hopkinson peaks associated with the magnetic transitions, although the transition temperature of the ε-Fe2O3 phase for this sample is similar to others. The different AC susceptibility behavior of this sample may be due to a smaller grain size of both ε-Fe2O3 and hematite phases.
Figure 3 illustrates the low-temperature remanence behavior and hysteresis loops measured at 295 K for two samples that show coercivities in excess of 1 Tesla, as expected for the ε-Fe2O3 phase [24,44,46,47,48,49,50].
Coercivity, magnetization and remanence values are listed in Table 4. Remanent magnetization acquired at 1.8 K shows a complex behavior that is characterized by:
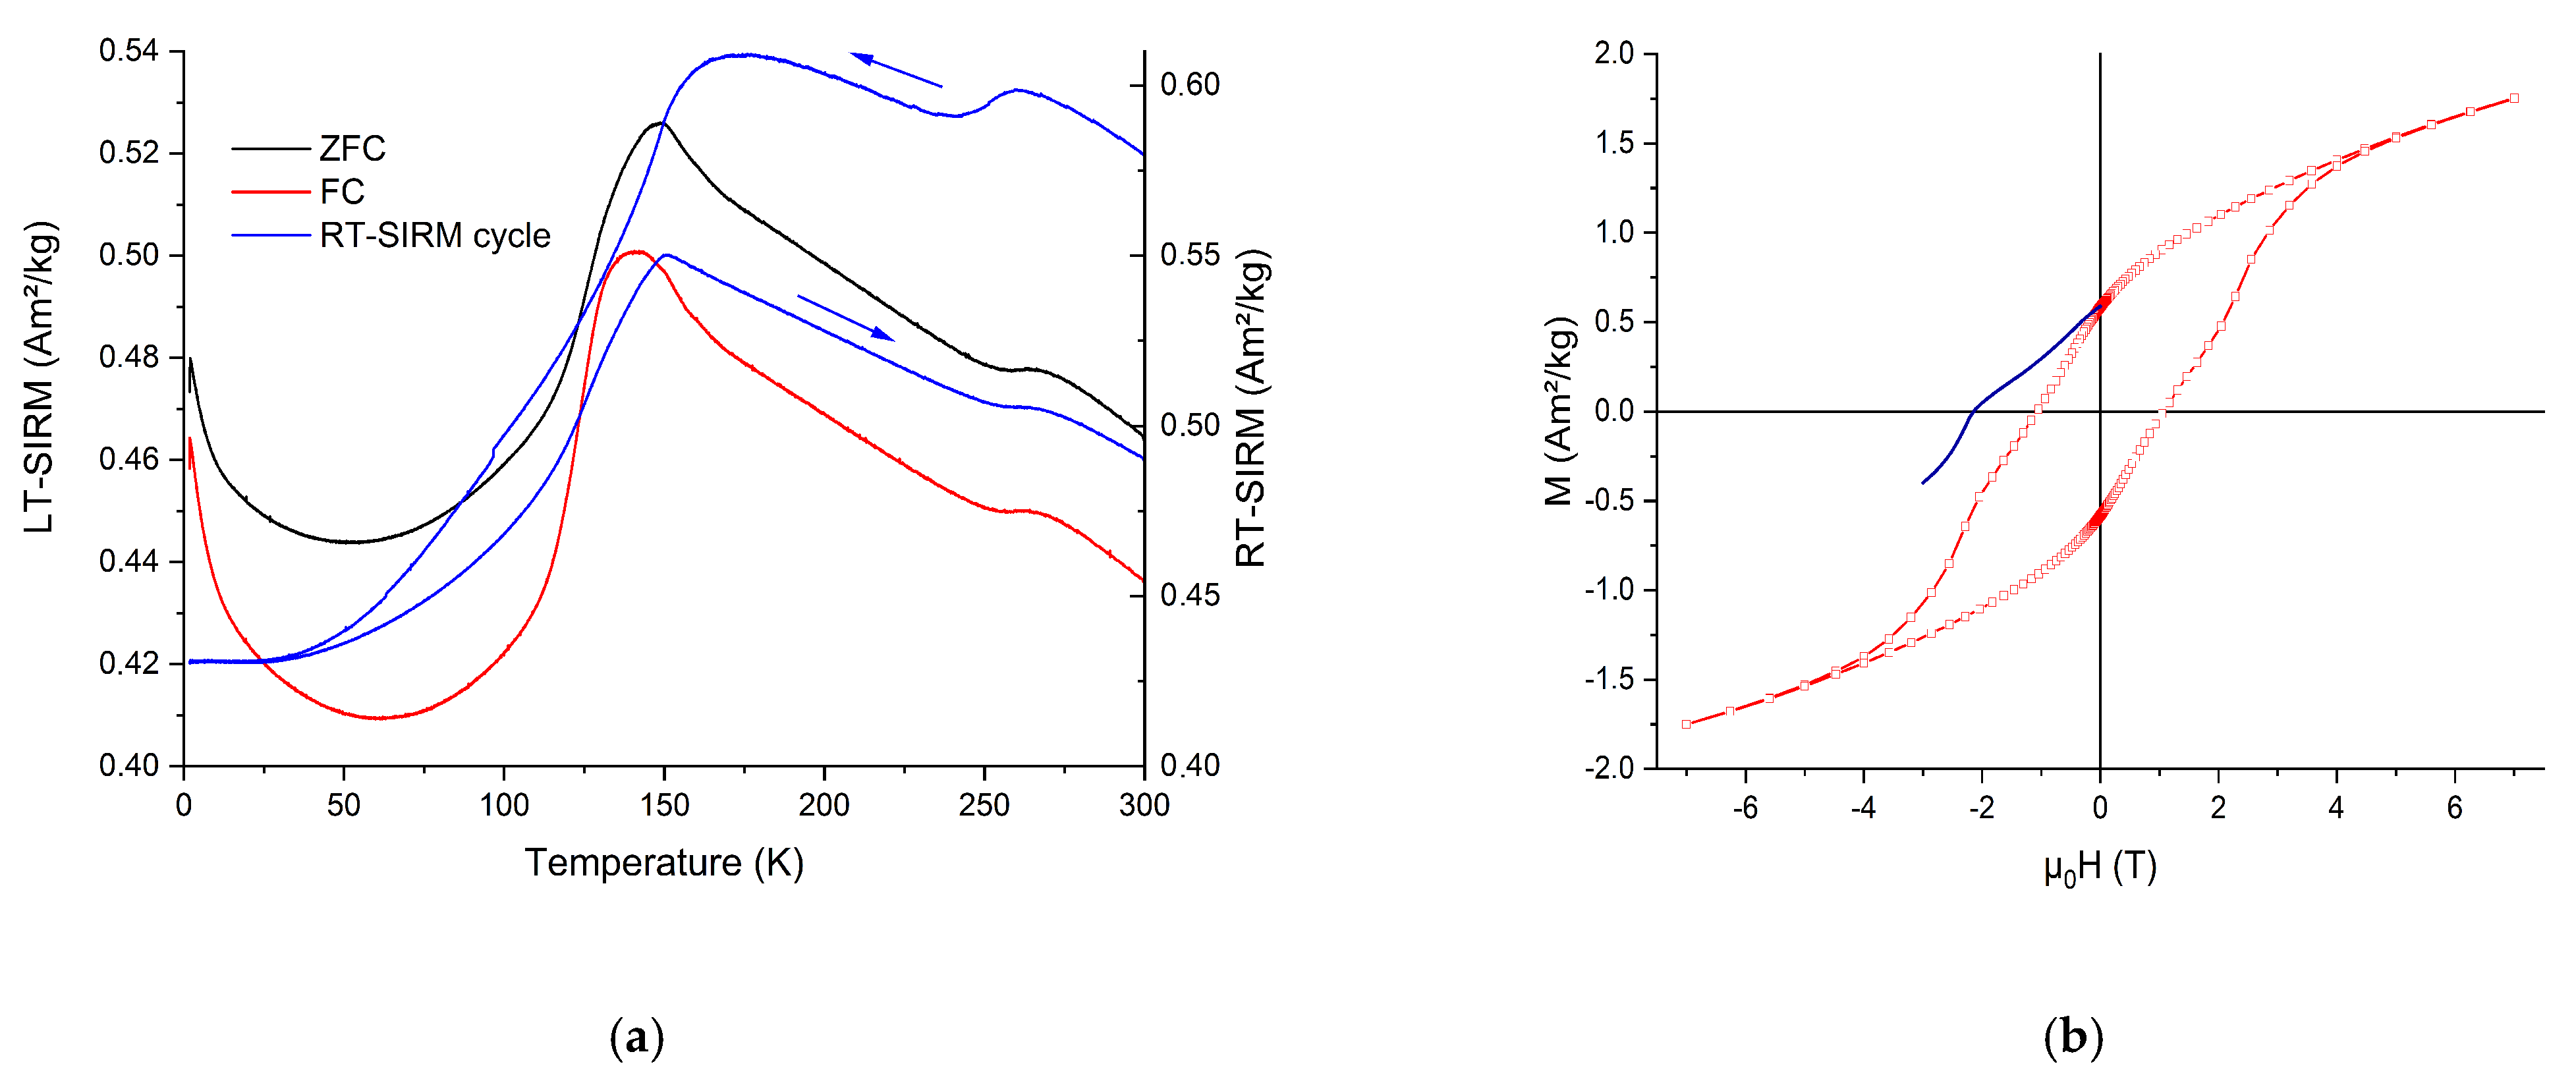
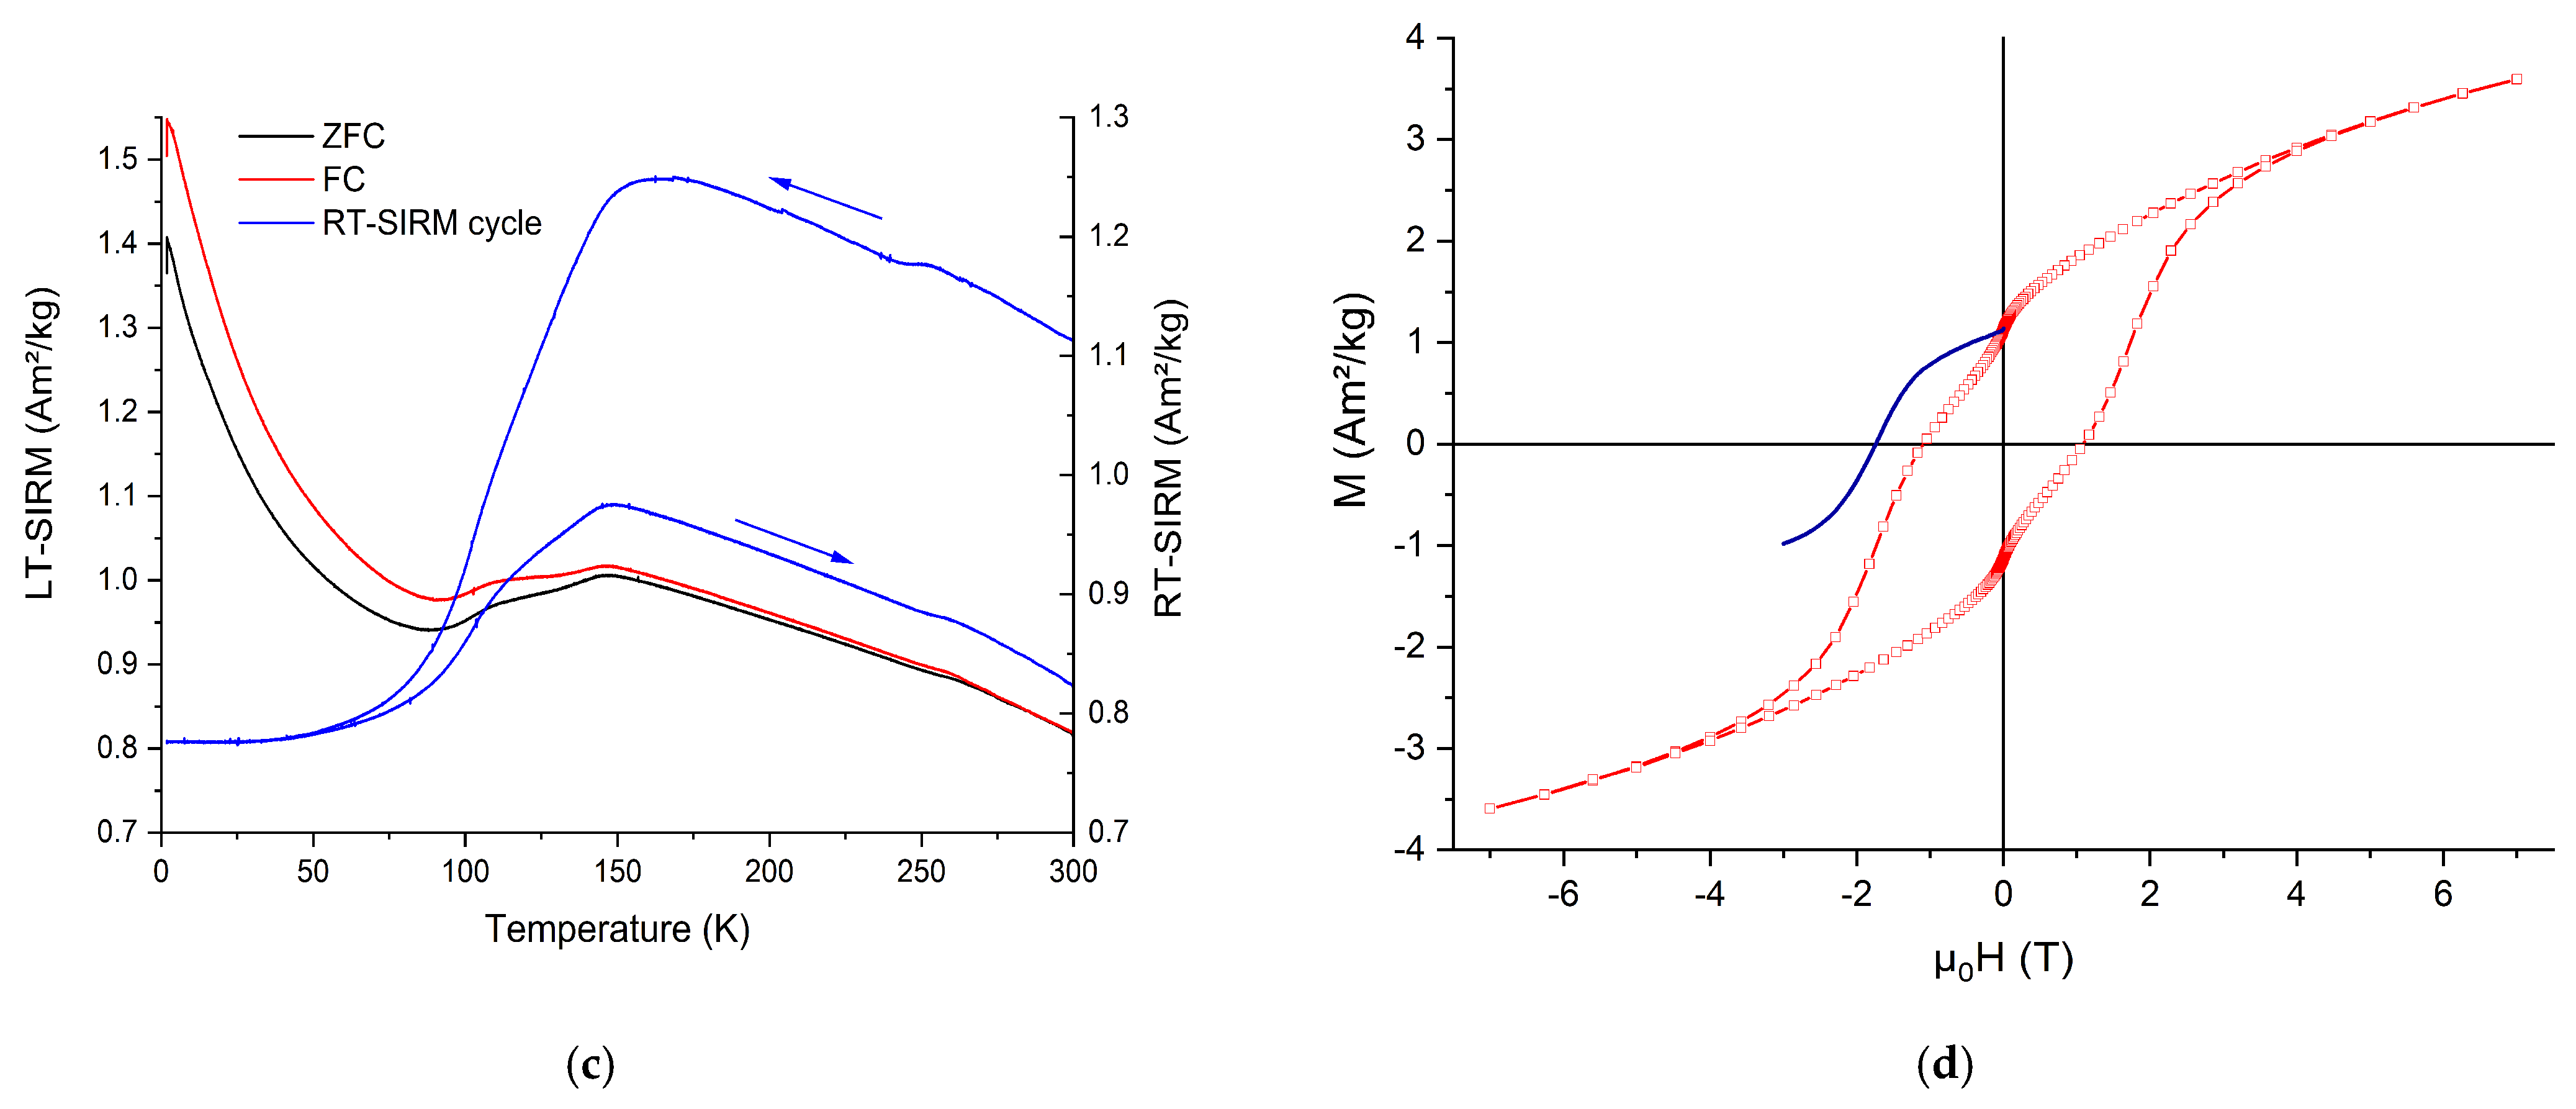
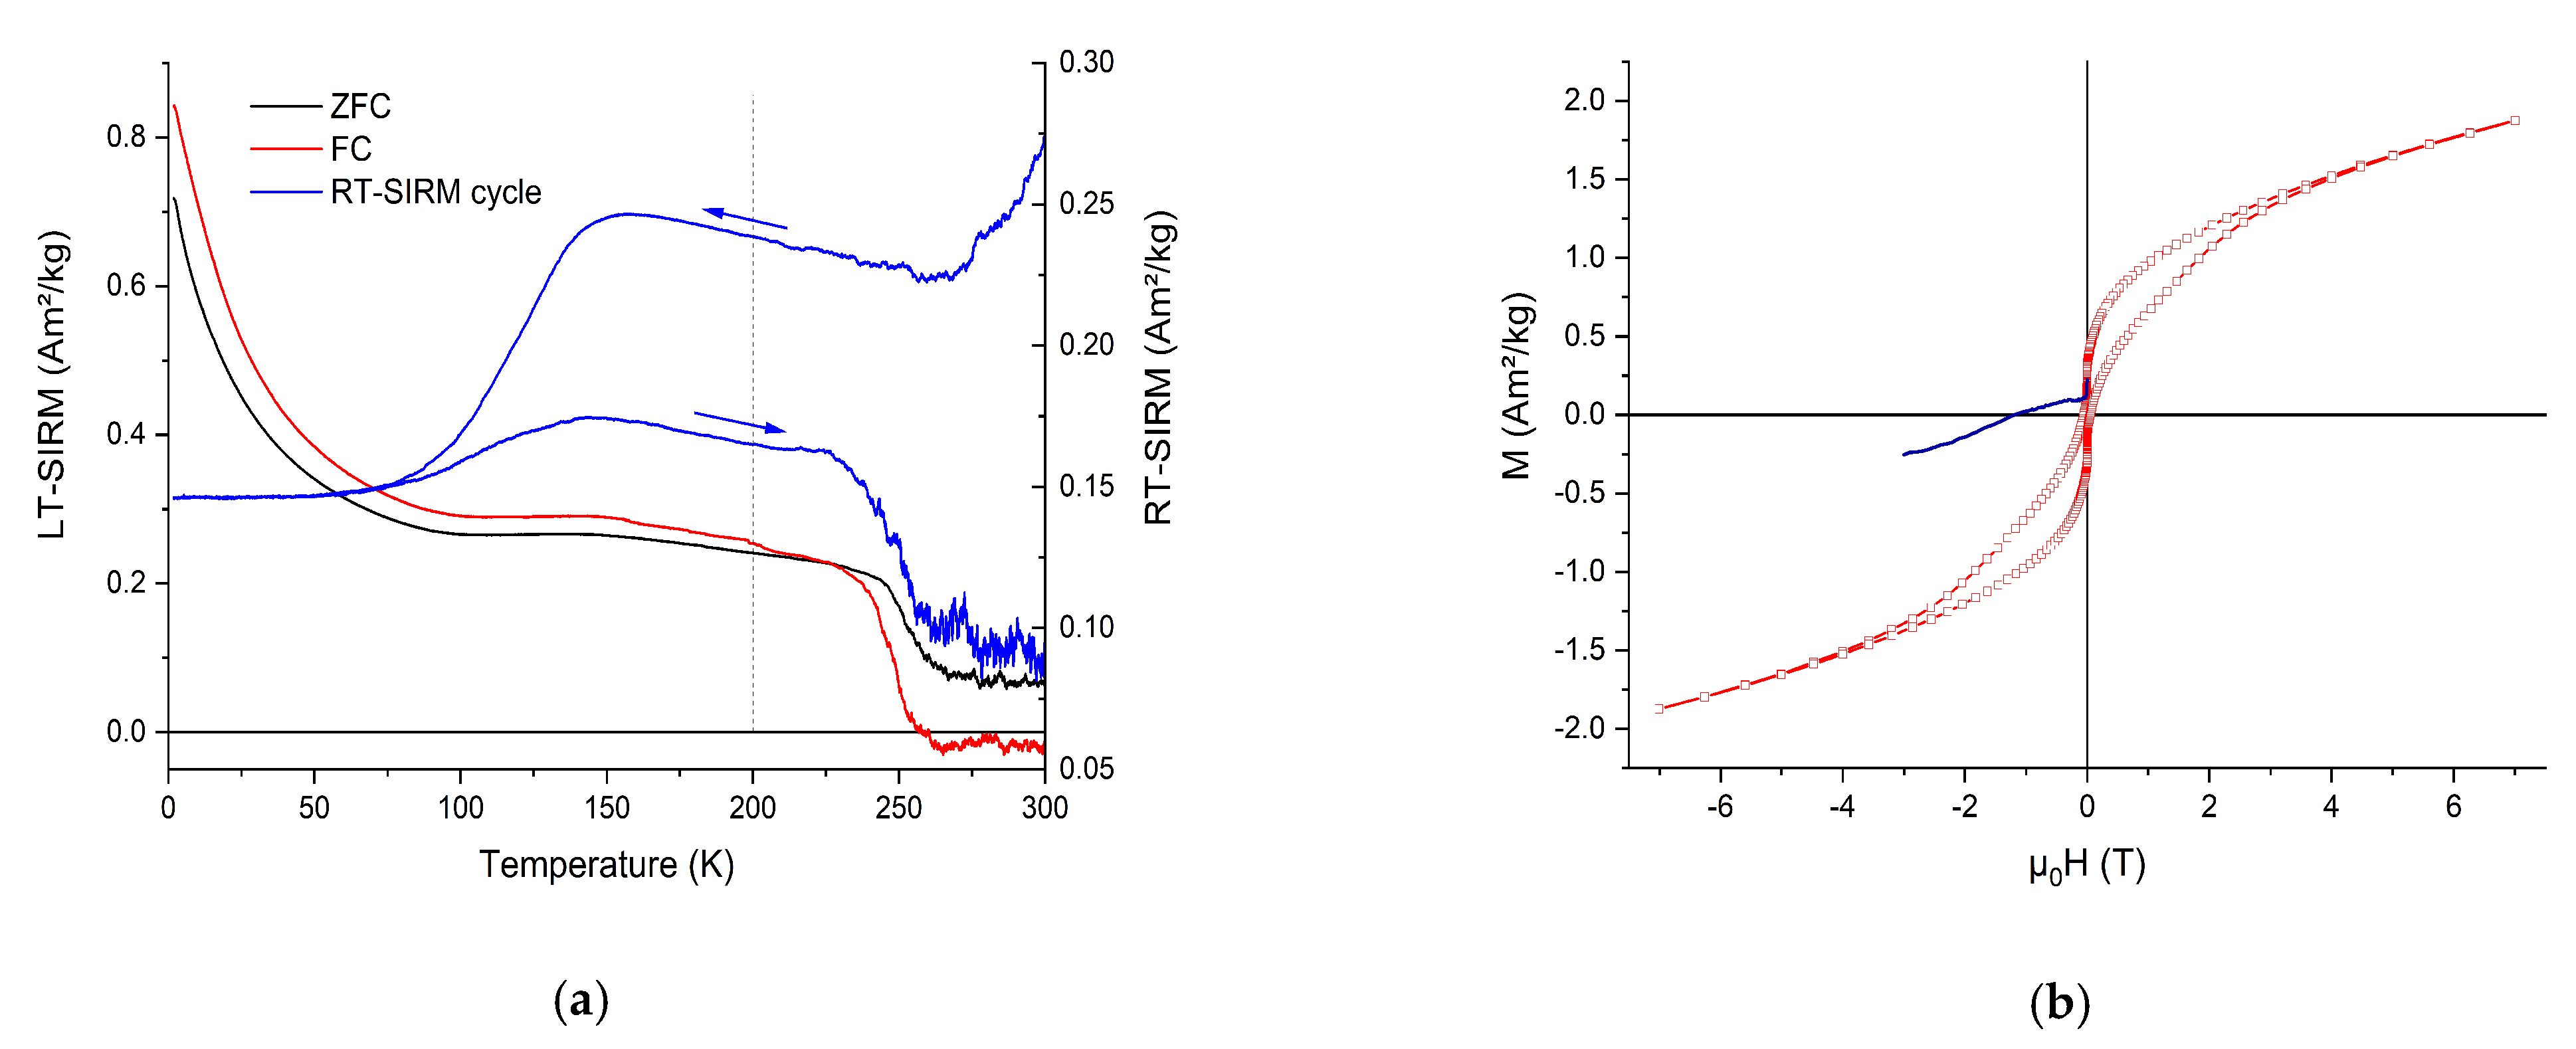
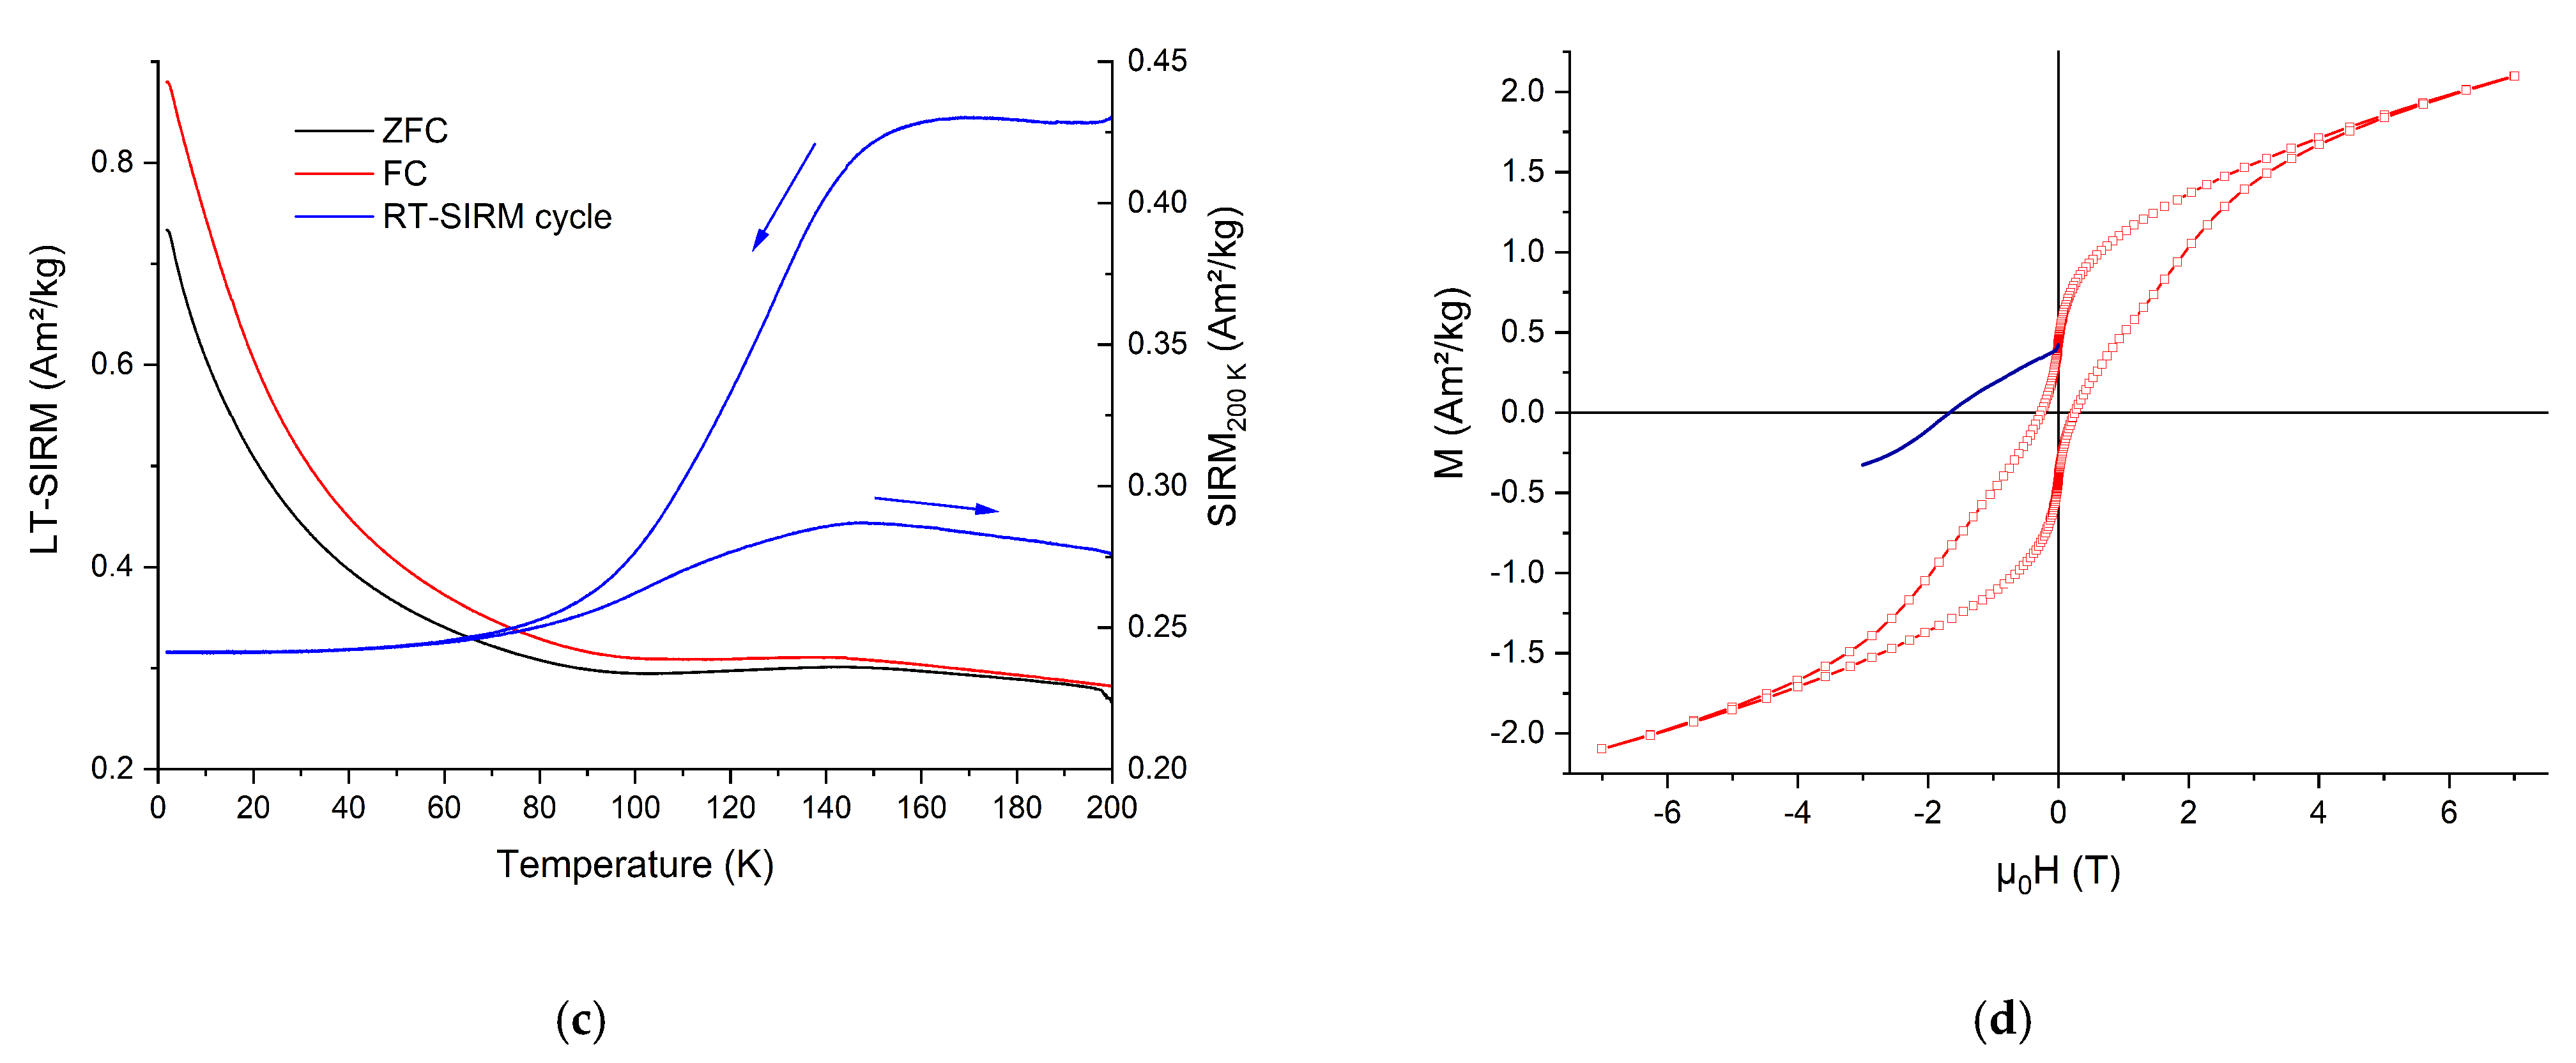
  • The rapid decrease between 1.8 K and 60–70 K;
  • Increase between 60–70 K and 150 K;
  • The relatively gradual decrease between 150 K and room temperature.
However, the relative proportion of these features is different for different samples. For the sample synthesized with the silica gel impregnation method, loss of magnetization between 1.8 K and 70 K is far more prominent than the following rebound, while the opposite pattern is observed for the sample synthesized with the microemulsion method. For both samples, remanence acquired at 300 K exhibits notable irreversibility during the zero-field cooling-warming cycle, losing 15–20% of its value after the cycle. In addition, both the low- and room-temperature remanence curves show weak but discernible features around 240 K, likely due to the Morin transition in hematite [51]. This is somewhat lower than the transition temperature in bulk hematite [52]. However, the Morin transition temperature is known to decrease significantly with grain size [53,54,55,56], implying the fine (<100 nm) size of the hematite particles in these samples.
Apart from the behavior described above, which seems to be characteristic of the ε-Fe2O3 phase, a feature that can be viewed as a collapse of the remanent magnetization signal has been observed in some samples (Figure 4). Remanence acquired at 1.8 K drops suddenly around 250 K to small, sometimes near-zero, values (Figure 4a). The hysteresis loop at 295 K (Figure 4b) becomes strongly wasp-waisted due to coexisting soft and hard magnetic phases. The coercive force then appears to be controlled by a soft phase, while the coercivity of remanence Hcr is due to the hard one. At the same time, the remanence signature between 1.8 K and 200 K in this sample (Figure 4c) resembles that measured for the samples containing stable ε-Fe2O3 phase (Figure 3), though the coercivity values at 200 K are still considerably lower. All this suggests that, unlike others, samples showing remanence collapse close to room temperature contain a significant fraction of ε-Fe2O3 particles at the verge of superparamagnetism. The lower coercivity at 200 K further indicates that stable ε-Fe2O3 particles may also have a smaller size than in other samples.
Remanence measurements presented here are of particular interest in studies of natural and some man-made materials, such as archaeological ceramics. Standard methods used in the physics of magnetic materials may fail in this case since they employ field measurements, and the signal of the ferromagnetic (sensu lato) phases usually present in a concentration <1% concentration will be masked by an overwhelmingly large contribution from the paramagnetic matrix. Therefore, reference data for carefully prepared and thoroughly characterized synthetic ε-Fe2O3 are tantamount to the correct interpretation of measurements made on natural samples. Until now, remanence curves for ε-Fe2O3 between 2 K and 300 K have only been reported for the material prepared with the sol-gel method, the precursor being iron(III) and yttrium nitrates with an approximate Fe:Y atomic ratio of 4:3 [42]. Their Mr (300 K, 5 T) cooling curve closely resembles those reported in this study, while the FC (2 K, 5 T) curve shows fast decay below 50 K and gradually flattens above that temperature, similar to S300N sample behavior below 200 K in our study. At the same time, we have observed a more variable shape of zero-field decay curves for remanence acquired at 1.8 K. This must be related to fine details of the material synthesis and resulting properties and deserves further study.

5. Conclusions

Existing methods for the synthesis of ε-Fe2O3 iron(III) oxide polymorph have been reviewed. The two most promising methods have been chosen: silica gel impregnation and microemulsion. These methods were used to synthesize samples of silica-iron oxide composite. The iron oxide phase in the final product contains 25.3% to 70% ε-Fe2O3 by weight, the rest being hematite (α-Fe2O3). The samples are characterized by a relatively high coercive force reaching ~ 1 Tesla at 300 K, Curie temperatures of 225–230 °C (498–503 K) characteristic of the ε-Fe2O3 phase, and also Néel temperatures of ~680 °C (953 K) and the Morin phase transition at ~240 K, characteristic of hematite. A comparison of two different iron salts used as precursors in the silica gel impregnation method has shown that iron(II) sulfate is clearly superior to iron(III) nitrate yielding 69% of ε-Fe2O3 per total iron oxide mass versus 25.3%, respectively. The substantial hematite content in the samples synthesized by the microemulsion method may indicate that the synthesis parameters are not optimal, and further research in this area is needed. It is also necessary to work out and optimize the process of etching the SiO2 matrix to obtain high-purity samples of ε-Fe2O3.

Author Contributions

Conceptualization, D.O.T. and K.G.G.; methodology, D.O.T., K.G.G., A.K. and L.S.; validation, I.K.K. and V.V.L.; investigation, D.O.T., K.G.G., A.K. and L.S.; resources, A.K., I.K.K., L.S. and V.V.L.; writing—original draft preparation, D.O.T. and A.K.; writing—review and editing, K.G.G., I.K.K. and V.V.L.; supervision, K.G.G.; project administration, I.K.K.; funding acquisition, V.V.L. All authors have read and agreed to the published version of the manuscript.

Funding

The work has been funded by the Russian Science Foundation (Grant No. 21-19-00719) in part of the synthesis technique development and the sample preparation.

Institutional Review Board Statement

Not applicable.

Informed Consent Statement

Not applicable.

Data Availability Statement

Not applicable.

Acknowledgments

The study of the crystal structure, magnetic properties, and other measurements was carried out at the resource centers “X-ray diffraction methods of research”, “Center for Diagnostics of Functional Materials for Medicine, Pharmacology and Nanoelectronics”, and “Geomodel” of the Science Park of St. Petersburg University.

Conflicts of Interest

The authors declare no conflict of interest.

References

  1. Cornell, R.M.; Schwertmann, U. The Iron Oxides: Structure, Properties, Reactions, Occurrence and Uses; Wiley-VCH: Weinheim, Germany, 2003. [Google Scholar] [CrossRef]
  2. Tuček, J.; Machala, L.; Ono, S.; Namai, A.; Yoshikiyo, M.; Imoto, K.; Tokoro, H.; Ohkoshi, S.-I.; Zbořil, R. Zeta-Fe2O3—A new stable polymorph in iron(III) oxide famil. Sci. Rep. 2015, 5, 15091. [Google Scholar] [CrossRef] [PubMed] [Green Version]
  3. Levato, C. Iron Oxides Prehistoric Mines: A European Overview. Anthropol. Præhistorica 2016, 126, 9–23. [Google Scholar]
  4. Gay-Lussac, J.L. Extrait d’un Mémoire sur les oxides de fer. Ann. Chim. 1811, 80, 163–170. [Google Scholar]
  5. Xu, H.; Lee, S.; Xu, H. Luogufengite: A new nano-mineral of Fe2O3 polymorph with giant coercive field. Am. Mineral. 2017, 102, 711–719. [Google Scholar] [CrossRef]
  6. Sprain, C.J.; Feinberg, J.M.; Lamers, R.; Bono, R.K. Characterization of magnetic mineral assemblages in clinkers: Potential tools for full vector paleomagnetic studies. Geochem. Geophys. Geosystems 2021, 22, e2021GC009795. [Google Scholar] [CrossRef]
  7. Dejoie, C.; Sciau, P.; Li, W.; Noé, L.; Mehta, A.; Chen, K.; Luo, H.; Kunz, M.; Tamura, N.; Liu, Z. Learning from the past: Rare ε-Fe2O3 in the ancient black-glazed Jian (Tenmoku) wares. Sci. Rep. 2014, 4, 4941. [Google Scholar] [CrossRef] [Green Version]
  8. López-Sánchez, J.; McIntosh, G.; Osete, M.L.; del Campo, A.; Villalaín, J.J.; Pérez, L.; Kovacheva, M.; Rodríguez de la Fuente, O. Epsilon iron oxide: Origin of the high coercivity stable low Curie temperature magnetic phase found in heated archeological materials. Geochem. Geophys. Geosystems 2017, 18, 2646–2656. [Google Scholar] [CrossRef]
  9. López-Sánchez, J.; Palencia-Ortas, A.; del Campo, A.; McIntosh, G.; Kovacheva, M.; Martín-Hernández, F.; Carmona, N.; Rodríguez de la Fuente, O.; Marín, P.; Molina-Cardín, A.; et al. Further progress in the study of epsilon iron oxide in archaeological baked clays. Phys. Earth Planet. Inter. 2020, 307, 106554. [Google Scholar] [CrossRef]
  10. Forestier, H.; Guiot-Guillain, G. New ferromagnetic variety of ferric oxide. C. R. Acad. Sci. Paris 1934, 199, 720–724. [Google Scholar]
  11. Darken, L.S.; Gurry, R.W. The System Iron—Oxygen. II. Equilibrium and Thermodynamics of Liquid Oxide and Other Phases. J. Am. Chem. Soc. 1946, 68, 798–816. [Google Scholar] [CrossRef]
  12. Schrader, R.; Büttner, G. Eine neue Eisen (III)-oxide phase: ε-Fe2O3. Z. Anorg. Allg. Chem. 1963, 320, 220–234. [Google Scholar] [CrossRef]
  13. Tronc, E.; Chanéac, C.; Jolivet, J.P. Structural and Magnetic Characterization of ε-Fe2O3. J. Solid State Chem. 1998, 139, 93–104. [Google Scholar] [CrossRef]
  14. Gich, M.; Frontera, C.; Roig, A.; Taboada, E.; Molins, E.; Rechenberg, H.R.; Ardisson, J.D.; Macedo, W.A.A.; Ritter, C.; Hardy, V.; et al. High- and low-temperature crystal and magnetic structures of ε-Fe2O3 and their correlation to its magnetic properties. Chem. Mater. 2006, 18, 3889–3897. [Google Scholar] [CrossRef]
  15. Gich, M.; Roig, A.; Frontera, C.; Molins, E.; Sort, J.; Popovici, M.; Chouteau, G.; Martin y Marero, D.; Nogués, J. Large coercivity and low-temperature magnetic reorientation in ε-Fe2O3 nanoparticles. J. Appl. Phys. 2005, 98, 044307. [Google Scholar] [CrossRef]
  16. Jones, R.; Nickel, R.; Manna, P.K.; Hilman, J.; van Lierop, J. Temperature and field evolution of site-dependent magnetism in ε-Fe2O3 nanoparticles. Phys. Rev. B 2019, 100, 094425. [Google Scholar] [CrossRef] [Green Version]
  17. Ohkoshi, S.-I.; Kuroki, S.; Sakurai, S.; Matsumoto, K.; Sato, K.; Sasaki, S. A Millimeter-Wave Absorber Based on Gallium-Substituted ε-Iron Oxide Nanomagnets. Angew. Chem. Int. Ed. 2007, 46, 8392–8395. [Google Scholar] [CrossRef]
  18. Namai, A.; Sakurai, S.; Nakajima, M.; Suemeto, T.; Matsumoto, K.; Goto, M.; Sasaki, S.; Ohkoshi, S.J. Synthesis of an electromagnetic wave absorber for high-speed wireless communication. J. Am. Chem. Soc. 2009, 131, 1170–1173. [Google Scholar] [CrossRef]
  19. Seemann, K.; Leiste, H.; Bekker, V.A. A new generation of CMOS-compatible high frequency micro-inductors with ferromagnetic cores: Theory, fabrication and characterization. J. Magn. Magn. Mater. 2006, 302, 321–326. [Google Scholar] [CrossRef]
  20. Ghasemi, A.; Hossienpour, A.; Morisako, A.; Saatchi, A.; Salehi, M.J. Electromagnetic properties and microwave absorbing characteristics of doped barium hexaferrite. J. Magn. Magn. Mater. 2006, 302, 429–435. [Google Scholar] [CrossRef]
  21. Gich, M.; Frontera, C.; Roig, A.; Fontcuberta, J.; Molins, E.; Bellido, N.; Simon, C.; Fleta, C. Magnetoelectric coupling in ε-Fe2O3 nanoparticles. Nanotechnology 2006, 17, 687–691. [Google Scholar] [CrossRef] [Green Version]
  22. Gareev, K.G.; Khmelnitskiy, I.K.; Mandrik, I.V.; Orekhov, Y.D.; Testov, D.O. Microfluidic System for Drug Delivery Based on Microneedle Array and IPMC Valveless Pump. In Proceedings of the 2021 IEEE Conference of Russian Young Researchers in Electrical and Electronic Engineering (2021 ElConRus), St. Petersburg, Russia, 26–29 January 2021; pp. 1744–1747. [Google Scholar] [CrossRef]
  23. Testov, D.O.; Gareev, K.G.; Khmelnitskiy, I.K.; Kosterov, A.; Maraeva, E.V.; Klimtsova, I.V. Synthesis of high-coercive epsilon-iron oxide nanoparticles for biomedical applications. In Proceedings of the 2022 IEEE Conference of Russian Young Researchers in Electrical and Electronic Engineering (2022 ElConRus), St. Petersburg, Russia, 25–28 January 2022; pp. 1620–1623. [Google Scholar] [CrossRef]
  24. Popovici, M.; Gich, M.; Niznansky, D.; Roig, A.; Savii, C. Optimized Synthesis of the Elusive ε-Fe2O3 Phase via Sol-Gel Chemistry. Chem. Mater. 2004, 16, 5542–5548. [Google Scholar] [CrossRef]
  25. Khan, I.; Morishita, S.; Higashinaka, R.; Matsuda, T.D.; Aoki, Y.; Kuzmann, E.; Kubuki, S. Synthesis, characterization and magnetic properties of ε-Fe2O3 nanoparticles prepared by sol-gel method. J. Magn. Magn. Mater. 2021, 538, 168264. [Google Scholar] [CrossRef]
  26. Bukhtiyarova, G.A.; Mart’yanov, O.N.; Yakushkin, S.S.; Shuvaeva, M.A.; Bayukov, O.A. State of iron in nanoparticles prepared by impregnation of silica gel and aluminum oxide with FeSO4 solutions. Phys. Solid State 2010, 52, 826–837. [Google Scholar] [CrossRef]
  27. Bukhtiyarova, G.A.; Shuvaeva, S.S.; Bayukov, O.A.; Yakushkin, M.A.; Mart’yanov, O.N. Facile synthesis of nanosized ε-Fe2O3 particles on the silica support. J. Nanopart. Res. 2011, 13, 5527–5534. [Google Scholar] [CrossRef]
  28. Balaev, D.A.; Dubrovskiy, A.A.; Shaykhutdinov, K.A.; Bayukov, O.A.; Yakushkin, S.S.; Bukhtiyarova, G.A.; Martyanov, O.N. Surface effects and magnetic ordering in few-nanometer-sized ε-Fe2O3 particles. J. Appl. Phys. 2013, 114, 163911. [Google Scholar] [CrossRef]
  29. Balaev, D.A.; Yakushkin, S.S.; Dubrovskii, A.A.; Bukhtiyarova, G.A.; Shaikhutdinov, K.A.; Martyanov, O.N. Study of the high-coercivity material based on ε-Fe2O3 nanoparticles in the silica gel matrix. Tech. Phys. Lett. 2016, 42, 347–350. [Google Scholar] [CrossRef]
  30. Yakushkin, S.S.; Dubrovskiy, A.A.; Balaev, D.A.; Shaykhutdinov, K.A.; Bukhtiyarova, G.A.; Martyanov, O.N. Magnetic properties of few nanometers e-Fe2O3 nanoparticles supported on the silica. J. Appl. Phys. 2012, 111, 044312. [Google Scholar] [CrossRef]
  31. Jin, J.; Ohkoshi, S.I.; Hashimoto, K. Giant coercive field of nanometer-sized iron oxide. Adv. Mater. 2004, 16, 48–51. [Google Scholar] [CrossRef]
  32. Sakurai, S.; Shimoyama, J.; Hashimoto, K.; Ohkoshi, S. Large coercive field in magnetic-field oriented ε-Fe2O3 nanorods. Chem. Phys. Lett. 2008, 458, 333–336. [Google Scholar] [CrossRef]
  33. David, B.; Pizúrová, N.; Synek, P.; Kudrle, V.; Jašek, O.; Schneeweiss, O. ε-Fe2O3 nanoparticles synthesized in atmospheric-pressure microwave torch. Mater. Lett. 2014, 116, 370–373. [Google Scholar] [CrossRef]
  34. Tanskanen, A.; Mustonen, O.; Karppinen, M. Simple ALD process for ε-Fe2O3. APL Mater. 2017, 5, 056104. [Google Scholar] [CrossRef] [Green Version]
  35. Ukleev, V.; Suturin, S.; Nakajima, T.; Arima, T.-h.; Saerbeck, T.; Hanashima, T.; Sitnikova, A.; Kirilenko, D.; Yakovlev, N.; Sokolov, N. Unveiling structural, chemical and magnetic interfacial peculiarities in ε-Fe2O3/GaN (0001) epitaxial films. Sci. Rep. 2018, 8, 8741. [Google Scholar] [CrossRef] [PubMed] [Green Version]
  36. Suturin, S.M.; Korovin, A.M.; Sitnikova, A.A.; Kirilenko, D.A.; Volkov, M.P.; Dvortsova, P.A.; Ukleev, V.A.; Tabuchi, M.; Sokolov, N.S. Correlation between crystal structure and magnetism in PLD grown epitaxial films of ε-Fe2O3 on GaN. Sci. Technol. Adv. Mater. 2021, 22, 85–99. [Google Scholar] [CrossRef] [PubMed]
  37. Kelm, K.; Mader, W. Synthesis and Structural Analysis of ε-Fe2O3. Z. Anorg. Allg. Chem. 2005, 631, 2383–2389. [Google Scholar] [CrossRef]
  38. Ohkoshi, S.I.; Tokoro, H. Hard Magnetic Ferrite: ε-Fe2O3. Bull. Chem. Soc. Jpn. 2013, 86, 897–907. [Google Scholar] [CrossRef] [Green Version]
  39. Di Cerbo, R.K.; Seybolt, A.U. Lattice Parameters of the α-Fe2O3-Cr2O3 Solid Solution. J. Am. Ceram. Soc. 1959, 42, 430–431. [Google Scholar] [CrossRef]
  40. Trautmann, J.-M.; Forestier, H. Nouvelle préparation et étude de l’oxyde ε-Fe2O3. C. R. Acad. Sci. Paris 1965, 261, 4423–4425. [Google Scholar]
  41. Dézsi, I.; Coey, J.M.D. Magnetic and thermal properties of ε-Fe2O3. Phys. Stat. Sol. (a) 1973, 15, 681–685. [Google Scholar] [CrossRef]
  42. Kurmoo, M.; Rehspringer, J.L.; Hutlova, A.; D’Orleans, C.; Vilminot, S.; Estournes, C.; Niznansky, D. Formation of nanoparticles of e-Fe2O3 from yttrium iron garnet in a silica matrix: An unusually hard magnet with a Morin-like transition below 150 K. Chem. Mater. 2005, 17, 1106–1114. [Google Scholar] [CrossRef]
  43. Sakurai, S.; Jin, J.; Hashimoto, K.; Ohkoshi, S.-I. Reorientation phenomenon in a magnetic phase of ε-Fe2O3 nanocrystal. J. Phys. Soc. Jpn. 2005, 74, 1946–1949. [Google Scholar] [CrossRef]
  44. Sakurai, S.; Namai, A.; Hashimoto, K.; Ohkoshi, S.-i. First observation of phase transformation of all four Fe2O3 phases (γ → ε → β → α-phase). J. Am. Chem. Soc. 2009, 131, 18299–18303. [Google Scholar] [CrossRef] [PubMed]
  45. López-Sánchez, J.; Munoz-Noval, A.; Serrano, A.; Abuin, M.; de la Figuera, J.; Marco, J.F.; Perez, L.; Carmona, N.; Rodriguez de la Fuente, O. Growth, structure and magnetism of ε-Fe2O3 in nanoparticle form. RSC Adv. 2016, 6, 46380–46387. [Google Scholar] [CrossRef]
  46. García-Muñoz, J.L.; Romaguera, A.; Fauth, F.; Nogués, J.; Gich, M. Unveiling a new high-temperature ordered magnetic phase in ε-Fe2O3. Chem. Mater. 2017, 29, 9705–9713. [Google Scholar] [CrossRef] [Green Version]
  47. Jin, J.; Hashimoto, K.; Ohkoshi, S.-I. Formation of spherical and rod-shaped ε-Fe2O3 nanocrystals with a large coercive field. J. Mater. Chem. 2005, 15, 1067–1071. [Google Scholar] [CrossRef]
  48. Nikolić, V.N.; Tadić, M.; Panjan, M.; Kopanja, L.; Cvjetićanin, N.; Spasojević, V. Influence of annealing treatment on magnetic properties of Fe2O3/SiO2 and formation of ε-Fe2O3 phase. Ceram. Int. 2017, 43, 3147–3155. [Google Scholar] [CrossRef]
  49. Kubíčková, L.; Brázda, P.; Veverka, M.; Kaman, O.; Herynek, V.; Vosmanská, M.; Dvořák, P.; Bernášek, K.; Kohout, J. Nanomagnets for ultra-high field MRI: Magnetic properties and transverse relaxivity of silica-coated ε-Fe2O3. J. Magn. Magn. Mater. 2019, 480, 154–163. [Google Scholar] [CrossRef]
  50. Tokoro, H.; Fukui, J.; Watanabe, K.; Yoshikiyo, M.; Namai, A.; Ohkoshi, S.-I. Crystal growth control of rod-shaped ε-Fe2O3 nanocrystals. RSC Adv. 2020, 10, 39611–39616. [Google Scholar] [CrossRef]
  51. Morin, F.J. Magnetic susceptibility of αFe2O3 and αFe2O3 with added titanium. Phys. Rev. 1950, 78, 819–820. [Google Scholar] [CrossRef]
  52. Morrish, A.H. Canted Antiferromagnetism: Hematite; World Scientific Publishing Company: Singapore, 1995. [Google Scholar]
  53. Bando, Y.; Kiyama, M.; Yamamoto, N.; Takada, T.; Shinjo, T.; Takaki, H. The magnetic properties of α-Fe2O3 fine particles. J. Phys. Soc. Jpn. 1965, 20, 2086. [Google Scholar] [CrossRef] [Green Version]
  54. Schroeer, D.; Nininger, R.C., Jr. Morin transition in α-Fe2O3 microcyrstals. Phys. Rev. Lett. 1967, 19, 632–634. [Google Scholar] [CrossRef]
  55. Nininger, R.C., Jr.; Schroeer, D. Mössbauer studies of the Morin transition in bulk and microcrystalline α-Fe2O3. J. Phys. Chem. Solids 1978, 39, 137–144. [Google Scholar] [CrossRef]
  56. Amin, N.; Arajs, S. Morin temperature of annealed submicronic α-Fe2O3 particles. Phys. Rev. B 1987, 35, 4810–4811. [Google Scholar] [CrossRef] [PubMed]
Figure 1. X-ray diffractograms: (a) Sample S300S-2; (b) Sample S300N; (c) Sample ME-B. PDF-2 (International Center for Diffraction Data, 2020) cards: Hematite 01-080-2377; ε-Fe2O3 01-076-3272; Cristobalite 01-077-1317; Quartz 01-083-0539; Tridymite 01-086-0681.
Magnetochemistry 09 00010 g001
Figure 2. AC susceptibility temperature dependences: (a) Sample SUP; (b) Sample S300S-2; (c) Sample S300N.
Magnetochemistry 09 00010 g002aMagnetochemistry 09 00010 g002b
Figure 3. (a) Low-temperature remanence decay curve, Sample ME-B; (b) Hysteresis loop and backfield demagnetization curve measured at 295 K, Sample ME-B; (c) Low-temperature remanence decay curve, Sample SUP-2; (d) Hysteresis loop and backfield demagnetization curve measured at 295 K, Sample SUP-2.
Magnetochemistry 09 00010 g003aMagnetochemistry 09 00010 g003b
Figure 4. Illustration of the collapse of magnetic signal in ε-Fe2O3, sample S300N: (a) Low-temperature remanence behavior between 1.8 K and 300 K; (b) Hysteresis loop and backfield demagnetization curve measured at 295 K; (c) Low-temperature remanence behavior between 1.8 K and 200 K; (d) Hysteresis loop and backfield demagnetization curve measured at 200 K.
Magnetochemistry 09 00010 g004aMagnetochemistry 09 00010 g004b
Table 1. Main characteristics of the methods for the synthesis of ε-Fe2O3.
MethodShape of ε-Fe2O3Matrix/
Substrate
Associated PolymorphsMax. Annealing T, °CDuration of One Synthesis Cycle, hParticle Size, nmNeel T, °CCoercive Force, kOeRef.
Sol-gelNPsSiO2/-α-Fe2O31100528255104–6[24,25]
Silica gel impregnationNPsSiO2/-α-Fe2O39003020–804709[26,27,28,29,30]
MicroemulsionNPsSiO2/--11004020–10048010–20[31,32]
CVDNPs-γ-Fe2O3
α-Fe2O3
n/a1 *n/an/an/a[33]
Thin film depositionThin film-/GaNγ-Fe2O3
α-Fe2O3
80036+10–30n/a1,6–15[34,35,36]
Thermal decompositionCrystalPd/-α-Fe2O3
unidentified phase
97016850–200n/an/a[37]
* For the synthesis of 1 g of NPs.
Table 2. Synthesis parameters of all samples.
SampleSynthesis MethodPrecursorsMatrixAnnealing
Temperature, °C
1SUPSilica gel
Impregnation
FeSO4Chromatographic Superico silicagel900
2SUP-2
3S75Silica gel
Impregnation
FeSO4Silipor 075900
4S300SSilica gel
Impregnation
FeSO4Silipor-300900
5S300S-2Silipor-300
6S300S-2 at 200 KSilipor-300
7S300NSilica gel
Impregnation
Fe(NO3)3Silipor-300900
8S300N at 200 KSilipor-300
9ME-AMicroemulsionTEOS
Fe(NO3)3
Ba(NO3)2
SiO2 formed during the synthesis process1000
10ME-B
11ME-M
Table 3. Results of X-ray analysis.
Sampleε-Fe2O3Hematite (α-Fe2O3)
Content, %a (Å)b (Å)c (Å)Content, %a (Å)c (Å)
SUP615.094(2)8.797(4)9.482(2)395.0377(5)13.7539(16)
SUP-258.85.0992(13)8.784(2)9.485(2)41.25.0367(4)13.7512(12)
S7538.65.0945(15)8.784(3)9.486(2)61.45.0382(3)13.7534(11)
S300S73.15.098(2)8.795(4)9.490(3)26.95.0392(14)13.768(4)
S300S-269.05.086(3)8.799(5)9.493(3)31.05.0368(3)13.7504(11)
S300-N25.35.084(12)8.82(2)9.507(12)74.75.043(2)13.771(7)
ME-A60.95.057(4)8.796(3)9.465(3)39.15.03077(19)13.7360(7)
ME-B39.25.048(4)8.797(3)9.467(3)60.85.0310(2)13.7363(8)
ME-M37.24.951(4)8.863(6)9.473(5)62.85.0294(5)13.727(2)
Table 4. Coercivity, magnetization, and remanence of synthesized samples.
SampleM (7 T, 300 K), Am2/kgMr (300 K, 7 T loop), Am2/kgMr (300 K, 5 T), Am2/kgZFC (1.8 K, 5 T), Am2/kgFC (1.8 K, 5 T), Am2/kgµ0·Hc, mTµ0·Hcr, mT
SUP3.8421.2271.2091.0260.969111211734
SUP-23.5951.131.1131.4051.54510891742
S752.2220.75280.73370.76680.917112432047
S300S2.7350.75130.70141.0731.2124.9623.3
S300S-22.9250.52940.52920.64990.78301.711617
S300S-2 at 200 K3.1580.84100.84111.0401.2115761834
S300N1.8740.30420.28560.71790.842250.31190
S300N at 200 K2.0970.42920.43270.73360.87992561666
ME-A1.6470.48440.47740.42040.43408962160
ME-B1.7510.58380.57930.47990.464310702143
ME-M0.74390.15770.15600.19350.20473422130
Disclaimer/Publisher’s Note: The statements, opinions and data contained in all publications are solely those of the individual author(s) and contributor(s) and not of MDPI and/or the editor(s). MDPI and/or the editor(s) disclaim responsibility for any injury to people or property resulting from any ideas, methods, instructions or products referred to in the content.

