Article

Performance Evaluation of New Table Grape Varieties under High Light Intensity Conditions Based on the Photosynthetic and Chlorophyll Fluorescence Characteristics

1
The State Key Laboratory of Genetic Improvement and Germplasm Innovation of Crop Resistance in Arid Desert Regions (Preparation), Key Laboratory of Genome Research and Genetic Improvement of Xinjiang Characteristic Fruits and Vegetables, Institute of Horticulture Crops, Xinjiang Academy of Agricultural Sciences, Urumqi 830091, China
2
College of Horticulture, Xinjiang Agricultural University, Urumqi 830091, China
3
Research Institute of Grape and Melon Fruits in Xinjiang Uygur Autonomous Region, Turpan 838200, China
4
Turpan Research Institute of Agricultural Sciences, Xinjiang Academy of Agricultural Science, Turpan 830000, China
*
Authors to whom correspondence should be addressed.
These authors contributed equally to this work.
Horticulturae 2023, 9(9), 1035; https://doi.org/10.3390/horticulturae9091035
Submission received: 14 August 2023 / Revised: 8 September 2023 / Accepted: 8 September 2023 / Published: 14 September 2023
(This article belongs to the Special Issue Horticulture Plants Stress Physiology)

Abstract

:
The evaluation of photosynthetic characteristics of plants is important for the success rate of germplasm introduction. To select grape varieties with higher adaptability and trait performance, this experiment is aimed at evaluating and comparing the photosynthetic indices, chlorophyll fluorescence parameters, photosynthetic pigment content, and leaf characteristics of five Chinese hybrid varieties. The results showed that under high light intensity stress, the leaf growth of ‘Ruidu Cuixia’ was most affected and its specific leaf weight was the lowest, while ‘Jing Hongbao’ had the highest chlorophyll content. The maximum net photosynthetic rate (Pnmax), maximum light quantum yield (Fv/Fm), and apparent quantum efficiency (AQE) were different among varieties. It was reported that the ‘Ruidu Zaohong’ variety had the highest Pnmax. ‘Ruidu Wuheyi’ was found to have the highest Fv/Fm, while the highest AQE was recorded for ‘Ruidu Cuixia’, with intercellular CO2 concentration (Ci) and stomatal conductance (gs) at 292.56 μmol·mol−1, 766.56 mmol·m−2·s−1, and 66.8 μmol·m−2·s−1, respectively. The indices of ABS/CSm, TRo/CSm, and DIo/CSm were significantly different among varieties, and these indices of ‘Ruidu Zaohong’ were the highest. Pn was positively correlated with Ci and Tr, gs were positively correlated with Fv and TRo/CSm. The specific leaf area was negatively correlated with Fv/Fm and ΦDIo. The results of the principal component analysis and TOPSIS comprehensive evaluation showed that ‘Jing Hongbao’ and ‘Ruidu Cuixia’ performed best. Overall, the measurement of the photosynthetic characteristics of the plants during the growing period provided valuable data for the varietal introduction strategies. The better photosynthetic performance of ‘Jing Hongbao’ and ‘Ruidu Cuixia’ indicates more adaptability to the long day, high light intensity, and the high-temperature climate of Xinjiang.

1. Introduction

A natural climate of large temperature differences between day and night, long sunshine hours, and a dry climate [1] have always been advantageous for quality grape production. Traditional local varieties, owing to their geographical advantages, dominate most of the grape market and are the best-selling fruit products of the season in grape-growing areas. China is the largest producer of table and fresh grapes in the world (OIV 2022; https://www.oiv.int/what-we-do/country-report?oiv, accessed on 6 September 2023), and the Xinjiang region holds the top position in China. Grapes grown in Xinjiang are of good quality due to the unique climatic conditions in the region. However, the Xinjiang grape industry relies excessively on local varieties, resulting in a monotonous product structure that no longer meets the development needs of the grape industries.
To enrich the table grape variety resources in the region and enhance the efficiency and competitiveness of the Xinjiang grape industry, the Institute of Horticultural Crops at the Xinjiang Academy of Agricultural Sciences introduced several superior new grape varieties in 2019 for regional trial observation. The aim was to offer wider varieties for production. The current study hypothesized that the performance of newly introduced table grape varieties, when exposed to high light intensity conditions, will demonstrate significant differences in their photosynthetic and chlorophyll fluorescence characteristics, suggesting that certain varieties will exhibit superior adaptability and resilience to elevated light levels compared to others. The assessment of the success of introduced species depends significantly on the adaptive capacity of the introduced plants, including their ability to adapt to the local environment through seasonal rhythmic growth and development patterns, high production yield, and other relevant ecological and economic factors [2,3].
Photosynthesis is an important indicator of plant growth and production [4] and consists of components such as photosynthetic pigments, electron transport systems, and photosystems, each of which can potentially be affected by abiotic stresses [5]. Therefore, the study of photosynthesis performance in plants can reveal their growth potential [6], and it can be used as a basis for judging the success of plant variety introduction. Du et al. [7] showed that carbon metabolism was severely impaired under low nitrogen stress, leading to a decrease in the CO2 assimilation rate, which accumulates in the cells and affects the overall photosynthetic rate. This phenomenon is mainly caused by stomatal and non-stomatal factors. In recent years, chlorophyll fluorescence detection techniques have been widely used to monitor the photosynthetic capacity of plants under different growth conditions, such as drought stress [8], salt stress [9], nitrogen stress [10], and high-temperature stress [11], etc. The results of Kromdijk et al. [12] showed that the qP and NPQ of plants were always fluctuating under different stress conditions and became the standard to measure the inhibition of the electron transport chain. According to the results of Zhao et al. [13], the study of fluorescence kinetics is helpful in understanding the light-capturing ability of photosynthetic pigments and their tolerance to high-photon flux density in real-time, and to judge the photosynthetic capacity of plants under the current growth environment.
Fluorescence characteristics are extensively used in many studies related to plant physiology and photochemistry [14]. Chlorophyll fluorescence studies can also detect gross photosynthesis in large areas. In photosystem II (PSII), three pathways—chlorophyll fluorescence, photochemical reactions, and non-photochemical quenching (NPQ)—dissipate all of the light energy absorbed by the leaf. Some recent studies have demonstrated that stress conditions in plants can significantly influence photosynthetic physiology. Hazrati et al. [15] identified that both light intensity and water stress have a drastic impact on phytochemistry and fluorescence in Aloe vera plants. In a separate study, it was discovered that heat stress has a pronounced impact on the chlorophyll fluorescence properties of Rhododendron leaves [16]. Some studies including peony plants revealed that high-temperature stress directly influences chlorophyll fluorescence induction kinetics [17]. The direct impact of heat stress on plant fluorescence activity suggests its potential use as an indicator of heat stress [18]. Therefore, leaf photosynthesis measurements can be used as an indicator of plant adaptability to environmental changes and as a criterion for predicting plant domestication potential, and provide a scientific basis for enriching table grape variety resources in Xinjiang [19,20].
In this study, five Chinese own hybrid varieties, namely ‘Ruidu Xiangyu’, ‘Ruidu Cuixia’, ‘Ruidu Zaohong’, ‘Ruidu Wuheyi’, and ‘Jing Hongbao’, were used as indicators of plant adaptation. This study aimed to evaluate the physiological parameters of photosynthetic characteristics, chlorophyll fluorescence, chlorophyll content, and leaf appearance of these five new Chinese own hybrid varieties. The objective was to assess their adaptability to the climate in Xinjiang and provide a reference for the introduction of suitable newer grape varieties.

2. Materials and Methods

2.1. Experimental Site Overview

The study was carried out at the grape research base (87°28′ E, 45°56′ N) of the Urumqi Anningqu Experimental Field, Xinjiang Academy of Agricultural Sciences, Urumqi, China. The base is located on the northern slope of the Tianshan Mountains on the southern margin of the Junggar Basin. The average altitude is 600~800 m, and the terrain is gentle. The area is under the typical temperate range of arid and semi-arid continental climates. For this experimental field, the mean annual temperature was recorded at 7.13 °C, the accumulated temperature of ≥10 °C was 3000~3500 °C, and the annual sunshine hours were 2500~3000 h.

2.2. Experimental Plant Materials

Five Chinese hybrid grape varieties, ‘Ruidu Xiangyu’, ‘Ruidu Cuixia’, ‘Ruidu Zaohong’, ‘Ruidu Wuheyi’, and ‘Jing Hongbao’, were used as experimental materials (Table 1). The introduced varieties were planted in 2019. The plant rows were oriented north to south, with vine spacing of 1 by 3.5 m. The Y-shaped tree planting was adopted. The soil of the vineyard is sandy loam. Recommended vineyard practices, including canopy and disease management, were followed during the growing season. Normal soil fertilizer and drip system was installed for water management.

2.3. Test Equipment and Test Reagents

CIRAS-3 PP Systems photosynthetic analyzer (Amesbury, MA, USA; JUNIOR-PAM fluorometer (Heinz Walz GmbH, Effeltrich, Germany). Anhydrous ethanol procured from Tianjin Kaitong Chemical Reagent Co., LTD, Tianjin, China.

2.4. Test Methods

2.4.1. Photo-Response Curve Determination

Pn-PAR response curve related measurements were recorded at 10:30 and 12:30 (UTC +08.00, Beijing Time) on sunny days. Three disease-free plants with moderate vigor were selected from each variety. From the fourth to fifth nodes of the new shoots, three leaves were chosen. These leaves had good leaf color, similar size dimensions, and were free from diseases and insect pests [21]. The CIRAS-3 PP Systems photosynthetic analyzer (Amesbury, MA, USA) was used to measure the light response indices of the leaves [22,23]. A PLC3 universal leaf cuvette light source leaf chamber was utilized, and 10 gradients ranging from 0 to 2500 µmol·m−2·s−1 (2500, 2000, 1500, 1000, 750, 500, 300, 150, 75, 0 µmol·m−2·s−1) were set by the light source. The data were automatically recorded, with each gradient being stable for 90 s. The net photosynthetic rate (Pn), stomatal conductance (gs), transpiration rate (Tr), intercellular CO2 volume fraction (Ci), and water use efficiency (WUE) were measured using CIRAS-3 portable photosynthesis system (PP Systems, Amsbury, MA, USA). The readings were automatically recorded by CIRAS-3 after a certain interval. Few parameters like relative humidity (60%), CO2 concentration (380 μmol mol−1), and leaf temperature (28 °C) were maintained using an automatic control device on the instrument. Red-blue light (90%: 10%) was provided inbuilt LED light unit in the CIRAS-3. Photosynthesis-light response simulations were conducted using the leaf drift model [24], and the model fitting equation was employed.
P n = α 1 β I 1 + γ I I R d
Note: α is initial quantum efficiency; I symbolize photosynthetically active radiation (μmol·m−2·s−1); Rd is dark respiration rate (μmol·m−2·s−1); β is photoinhibition coefficient (m2·s·μmol−1); γ is light saturation coefficient (m2·s·μmol−1).

2.4.2. Measurement of Chlorophyll Fluorescence Parameters

The chlorophyll fluorescence parameters of varieties were measured with the same leaves that were used for photosynthetic index measurements. The JUNIOR-PAM fluorometer was used, with a 30-min dark acclimatization period before the measurements. Based on studies by Strasser et al. [25] and Tsimilli Michael [26], the following parameters were defined and calculated: actual light energy conversion efficiency (ΦPSII), non-fluorescence quenching (YNPQ), photosynthetic electron transport rate (ETR), maximum light quantum yield (Fv/Fm), as well as other indicators. These parameters include the maximum yield of primary photochemical reactions (ΦPo), heat dissipation per unit area (ΦDo), light energy captured per unit reaction center (RC) (TRo/CSm), and heat dissipation per unit area (DIo/CSm).

2.4.3. Measurement of Leaf Appearance Traits

Twenty mature leaves were randomly selected from both, the sunny and shaded sides of the grape trellis for all three plants. These leaves were measured for photosynthetic indicators. The leaf area was measured using a leaf area meter, and the leaf weight was determined using digital electronic balance. The specific leaf weight (calculated as the single leaf weight divided by the leaf area) and specific leaf area (calculated as the leaf area divided by the single leaf weight) were calculated.

2.4.4. Measurement of Chlorophyll Content

The chlorophyll content of each of the three plants was measured using the photosynthetic index determination method. Five leaves with similar leaf color, size, and exposure to sunlight were selected. The leaves were ground into a powder, with a weight of 0.2 g selected for analysis. They were then mixed with 80% acetone and kept in darkness for 12 h until the sample turned white. Afterward, the mixture was filtered, and absorbance values were measured at wavelengths of 645 nm, 663 nm, and 470 nm. These values were recorded, and the contents of Chl a (chlorophyll a), Chl b (chlorophyll b), and carotenoids were determined, following Arnon’s method [27].

2.4.5. TOPSIS Evaluation Method

The TOPSIS integrated evaluation method was used to synthesize the chlorophyll content, chlorophyll fluorescence parameters, and photosynthetic characteristic parameters of the leaves of the five varieties to comprehensively evaluate the photosynthetic strength of the five varieties.
In step 1, the indicators were homogenized to avoid affecting the description of the results.
Step 2, normalization of the data.
Y i j = X j = 1 m X j 2 ,   ( j   =   1 ,   2 ,     m )
In the formula, j represents a certain evaluation indicator, and m represents the number of evaluation indicators.
Step 3: Calculate the distance between positive and negative ideal solutions (D±) and the relative closeness degree (C):
D + = j = 1 m W j ( A j + Y i j ) 2 ,   ( j   =   1 ,   2 ,     m )
D = j = 1 m W j ( A j Y i j ) 2 ,   ( j   =   1 ,   2 ,     m )
In the formula, j represents an evaluation index, m represents the number of evaluation indexes, Wj represents the weight value of the jth index, A j + represents the optimal scheme data of the jth index, A j represents the worst scheme data of the jth index and Yij represents the corresponding data of a certain evaluation object i for the jth indicator.
C j = D D + D +
In the formula, the value of Cj ranges from 0 to 1. The larger Cj is, the stronger the photosynthetic capacity of the jth new variety is, and the closer the variety’s adaptability to the climate in Xinjiang is to the optimal level.

2.5. Data Processing and Statistical Analysis

All the data were collated in at least three replications and tabulated using Microsoft Excel 2010, and the results were statistically analyzed by analysis of variances tests (one-way ANOVA). We used SPSS 25.0 (SPSS Inc., Chicago, IL, USA) to perform Pearson correlation analysis and principal component analysis, and photo-response curves were fitted and plotted using Origin 2019.

3. Results

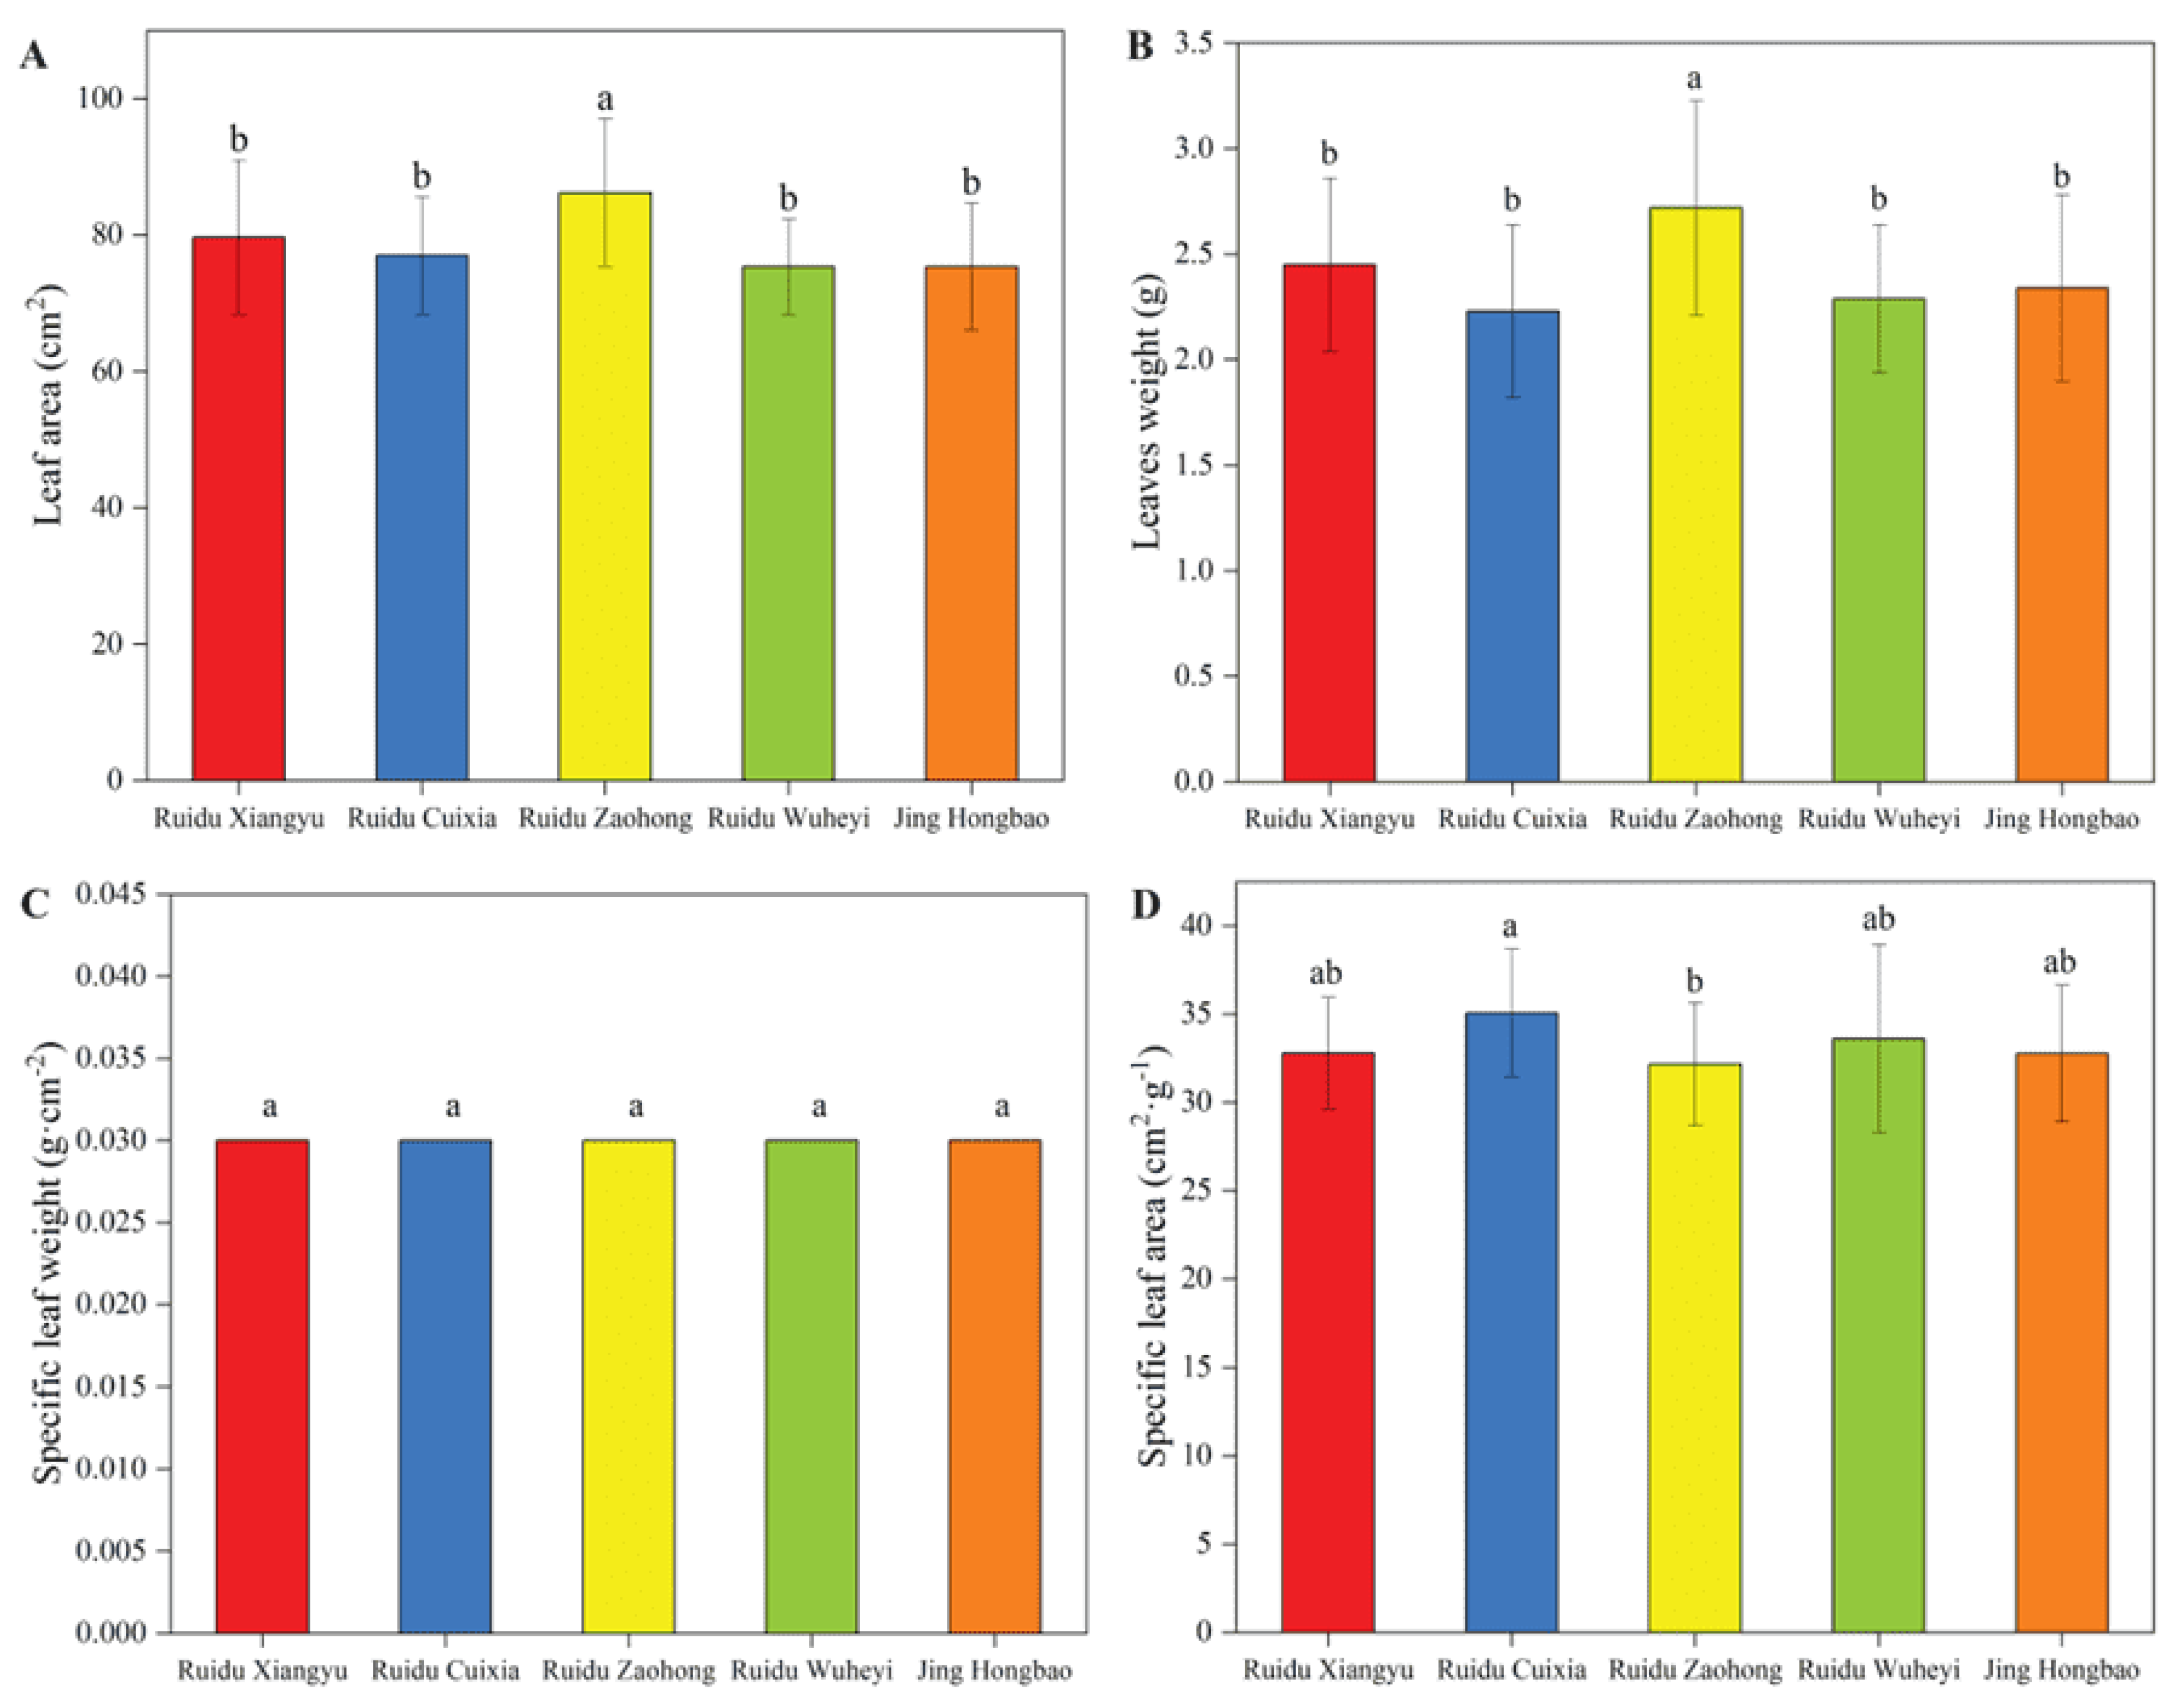
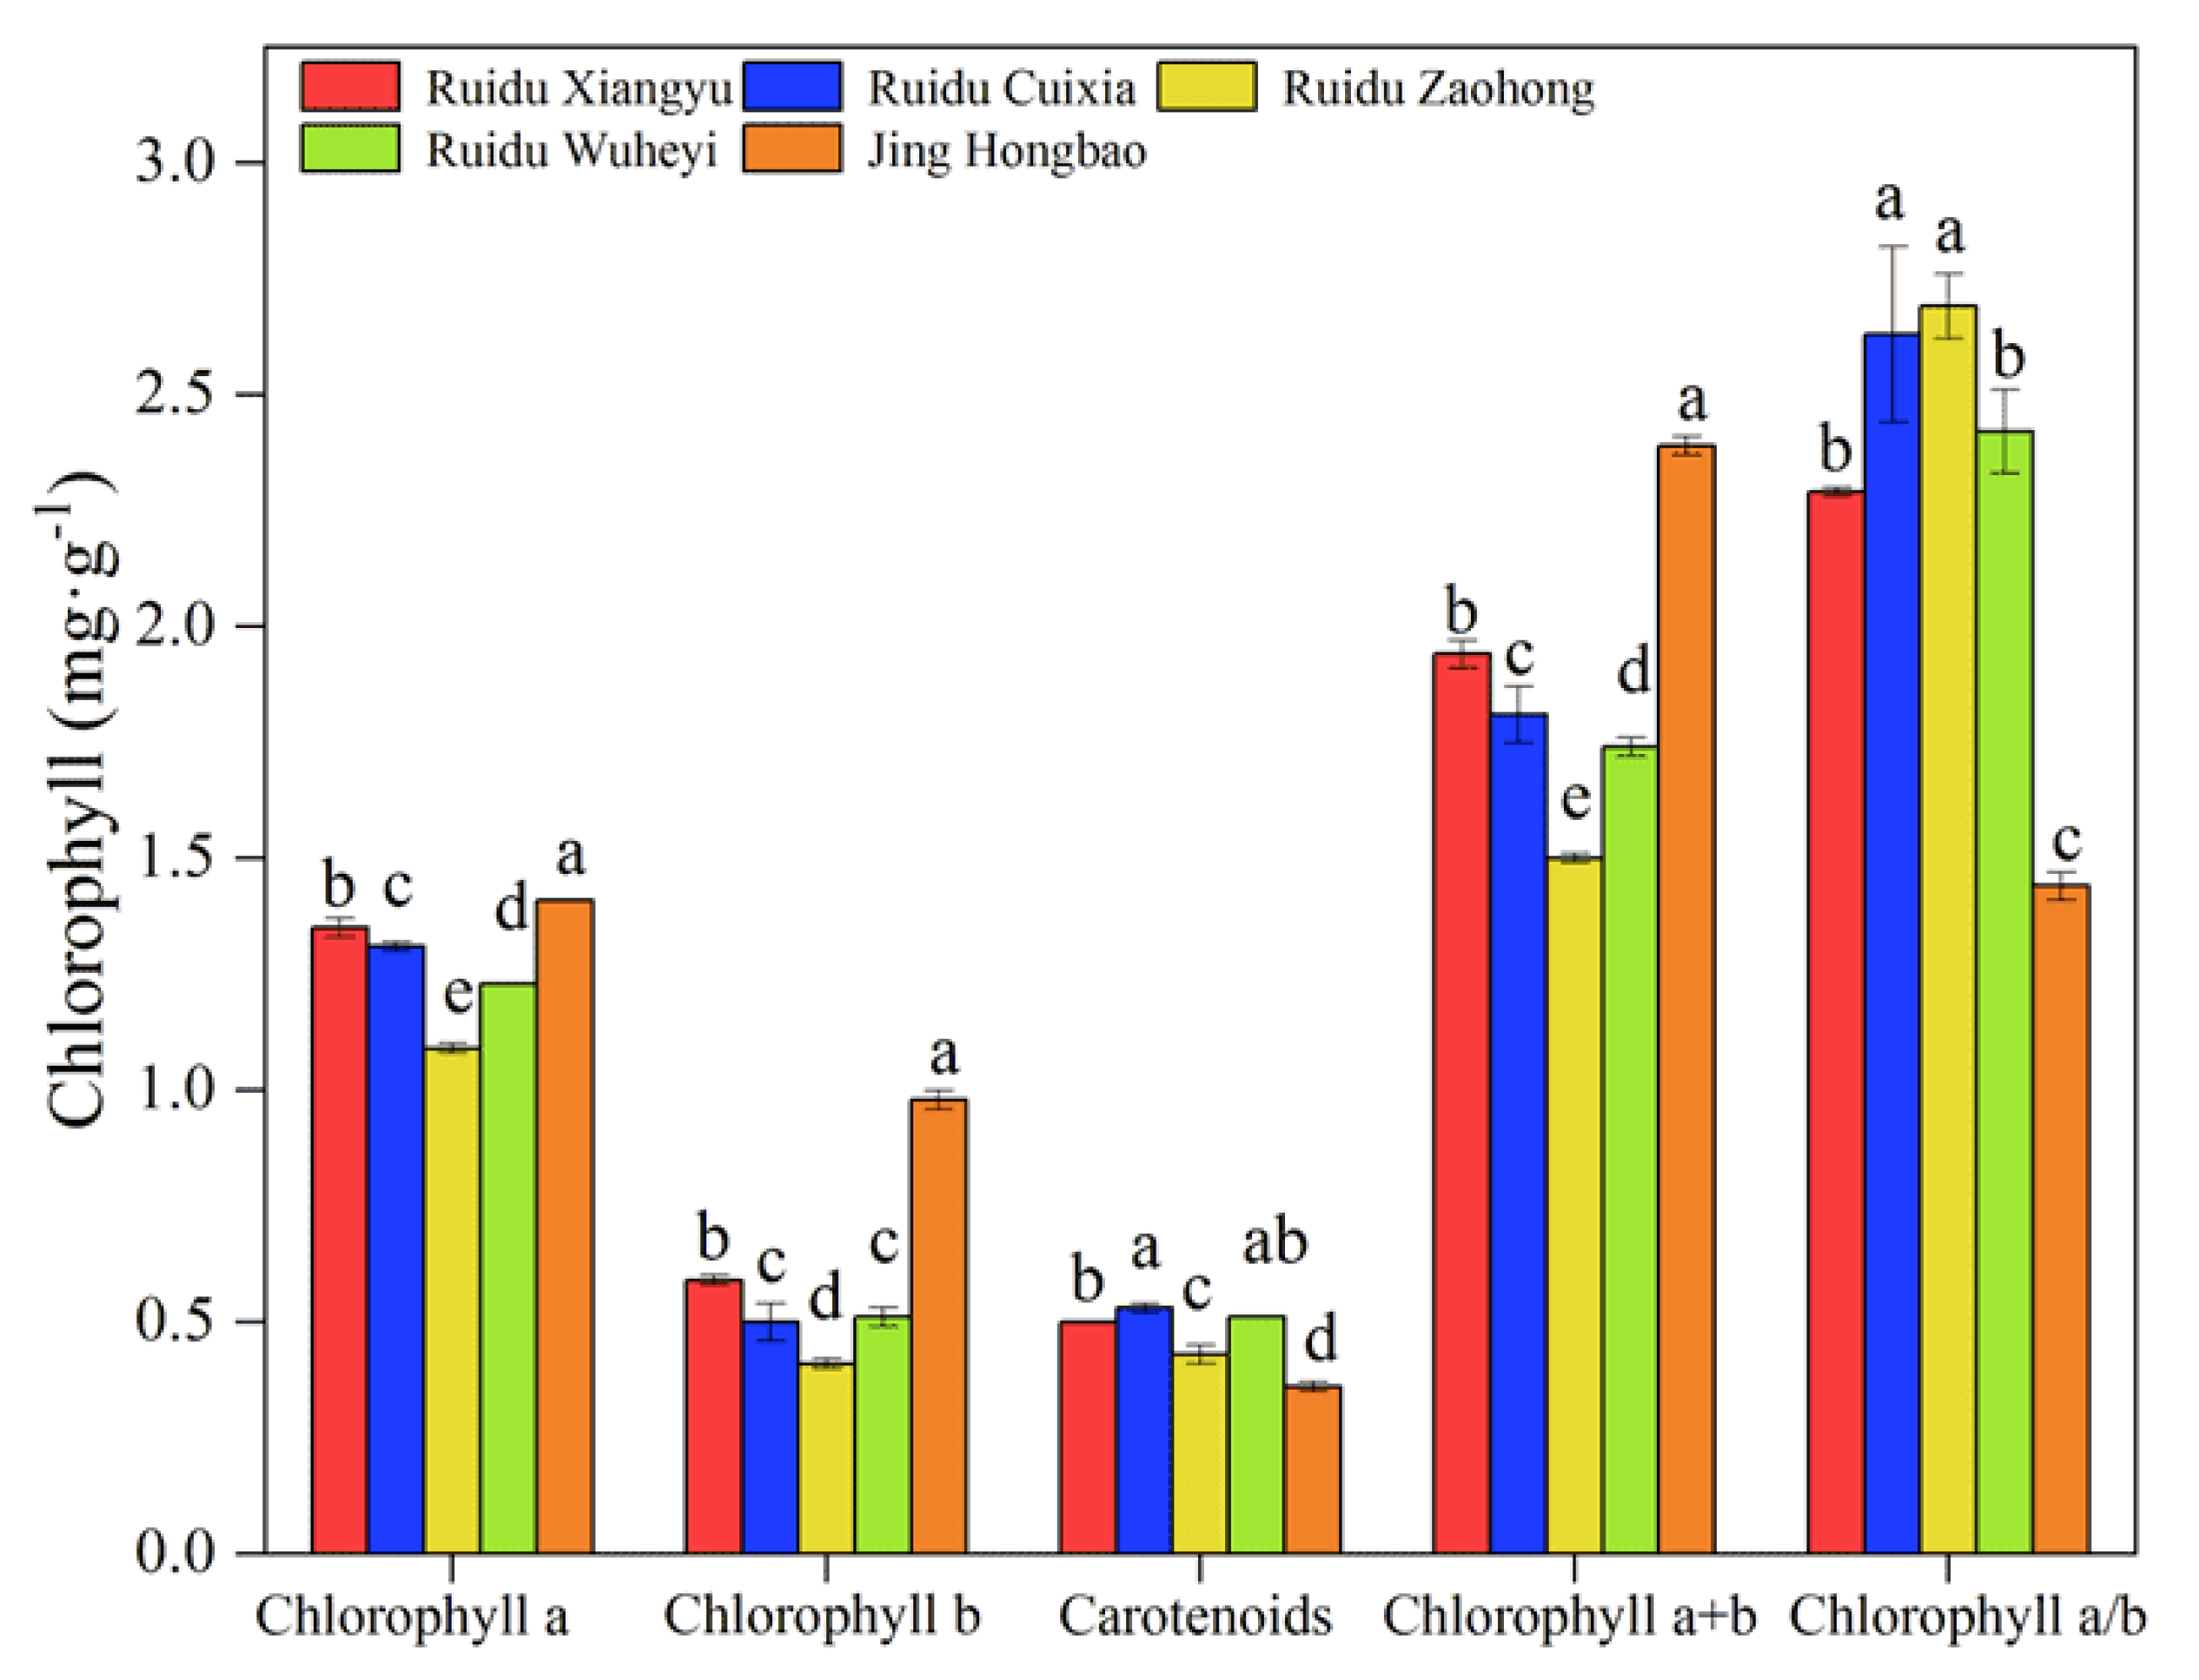
3.1. Chlorophyll Content and Leaf Appearance Traits

There were significant differences in leaf characteristics among the five new table grape varieties (p < 0.05) (Figure 1). The results showed that the leaf area and single-leaf weight of ‘Ruidu Zaohong’ were the highest among the five varieties (Figure 1A,B). The specific leaf area of ‘Ruidu Cuixia’ was 8.99% higher than that of ‘Ruidu Zaohong’ (Figure 1D). As shown in Figure 1C, there was no significant difference in specific leaf weight among the five new table grape varieties.
The chlorophyll content of higher plants affects the metabolic rate of the plant and is an index for judging plant health and local adaptation. The results showed that the chlorophyll content of the five new varieties differed significantly (p < 0.05) (Figure 2). ‘Jing Hongbao’ had the highest chlorophyll a, chlorophyll b, and total chlorophyll content, which were 29.36%, 139.02%, and 59.33% higher than those of ‘Ruidu Zaohong’, respectively. Interestingly, ‘Jing Hongbao’ had the lowest values of carotenoid content and chlorophyll a/b, 32.08% lower than ‘Ruidu Cuixia’ and 46.47% lower than ‘Ruidu Zaohong’.

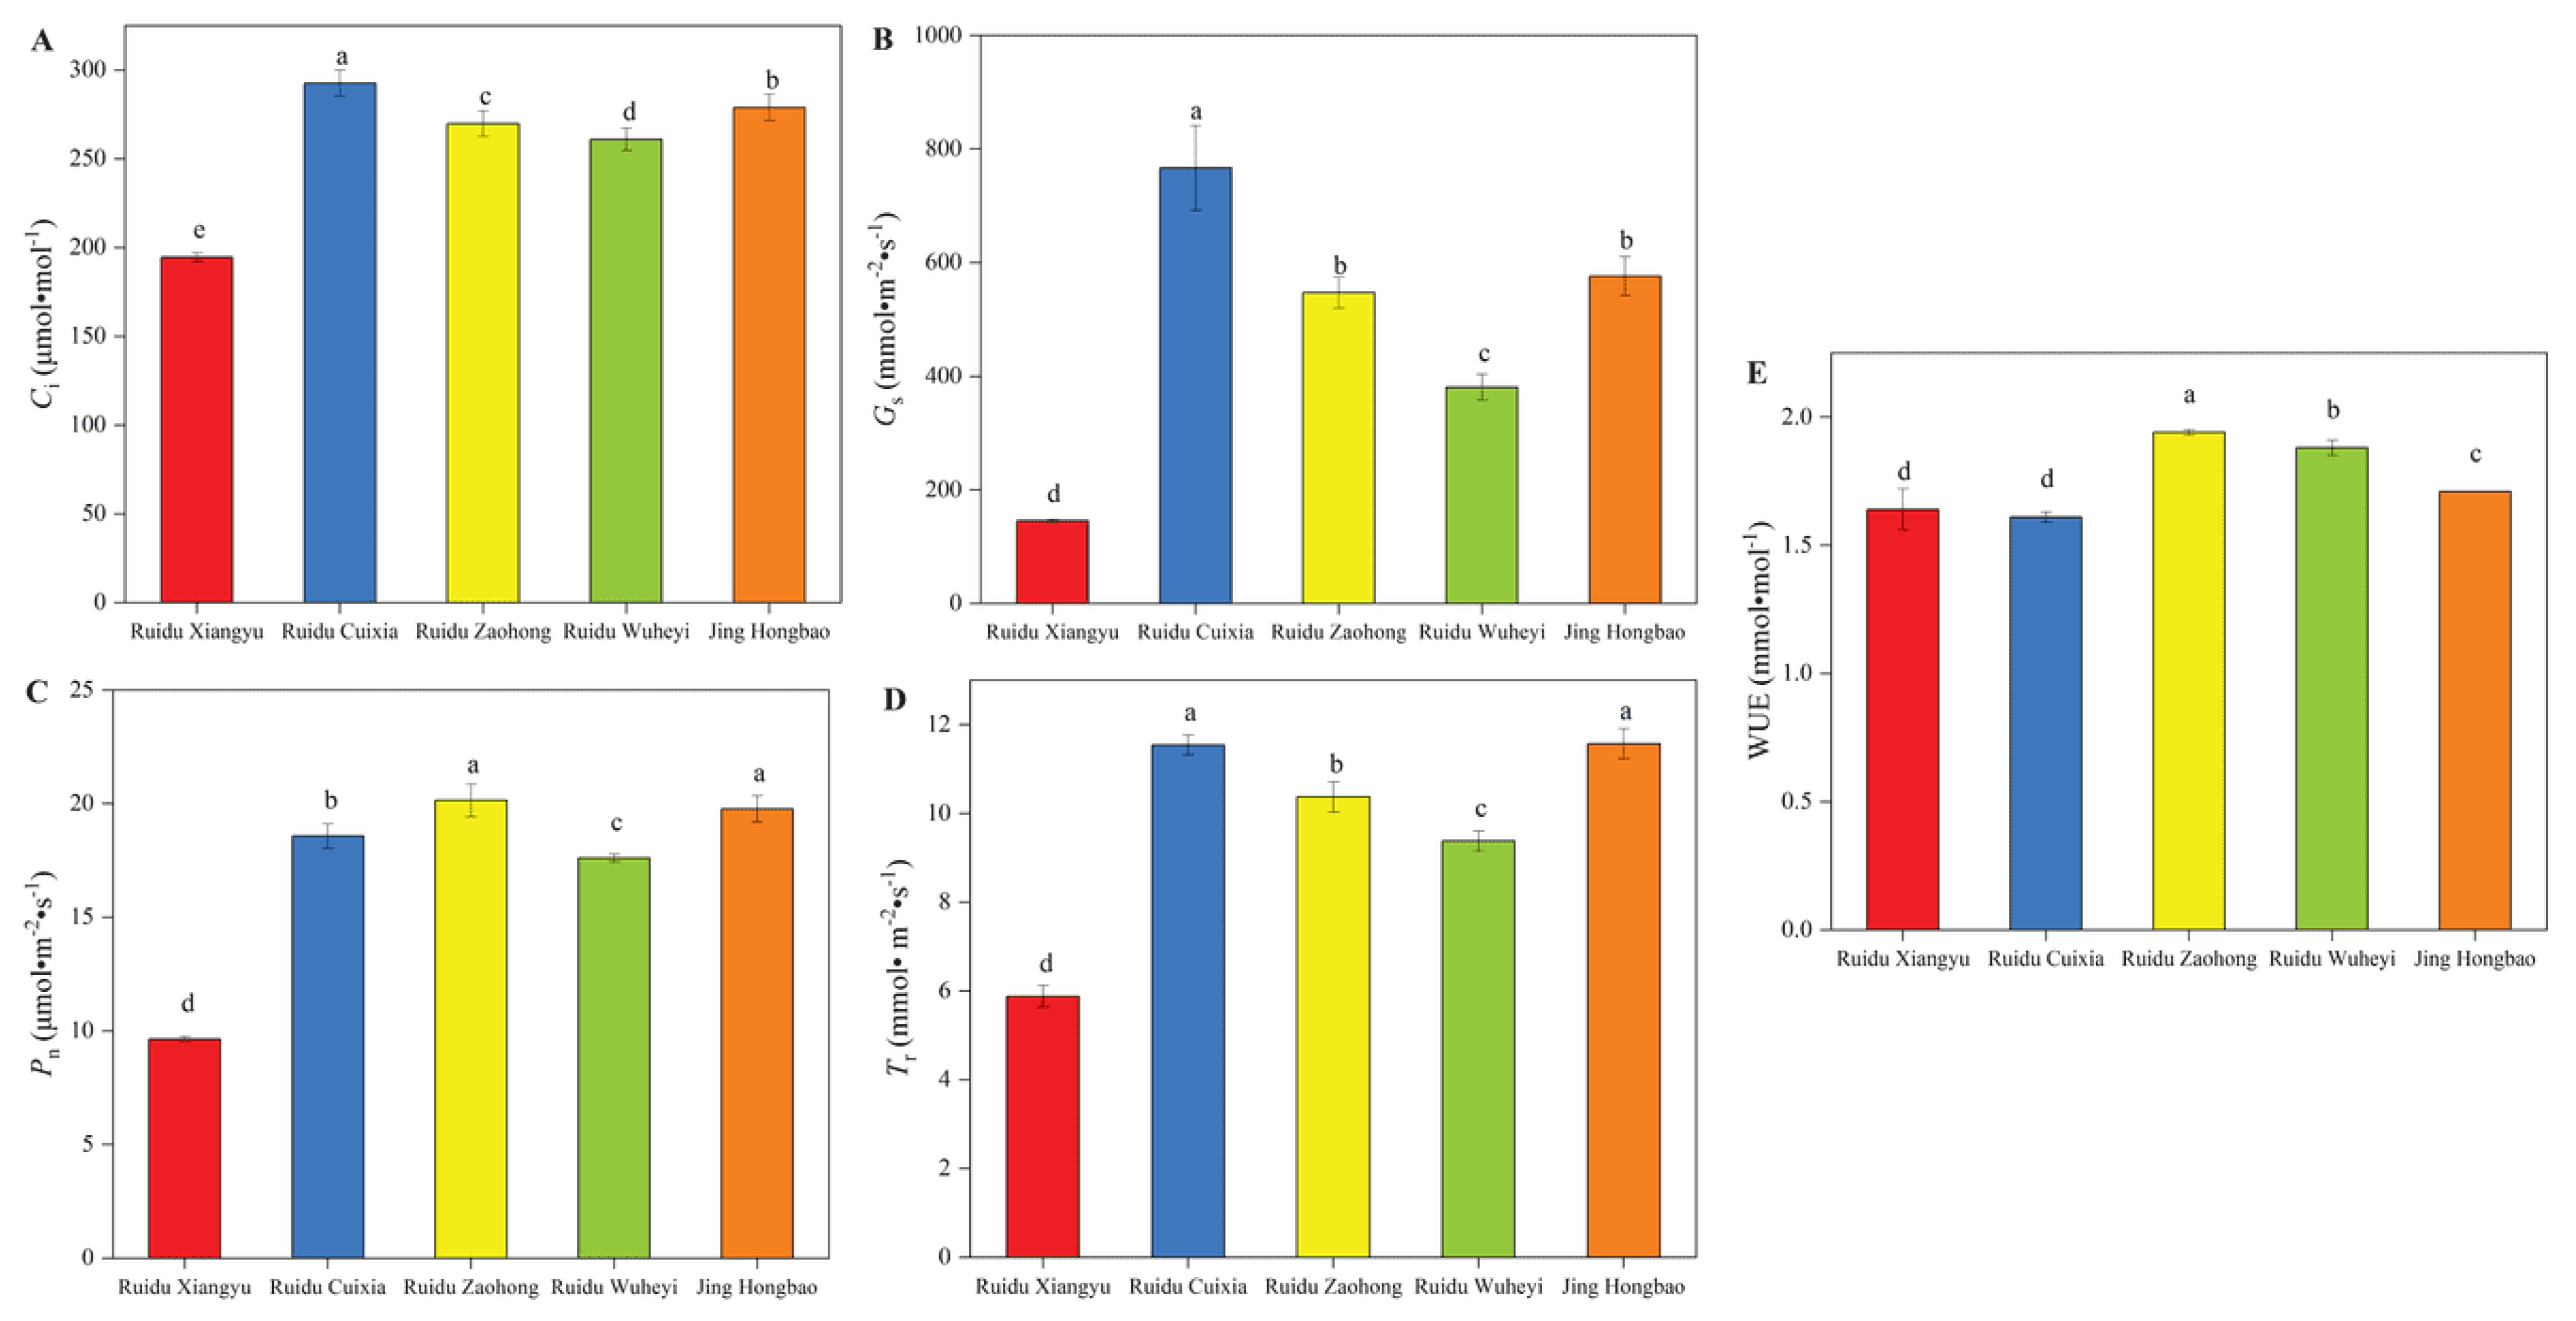
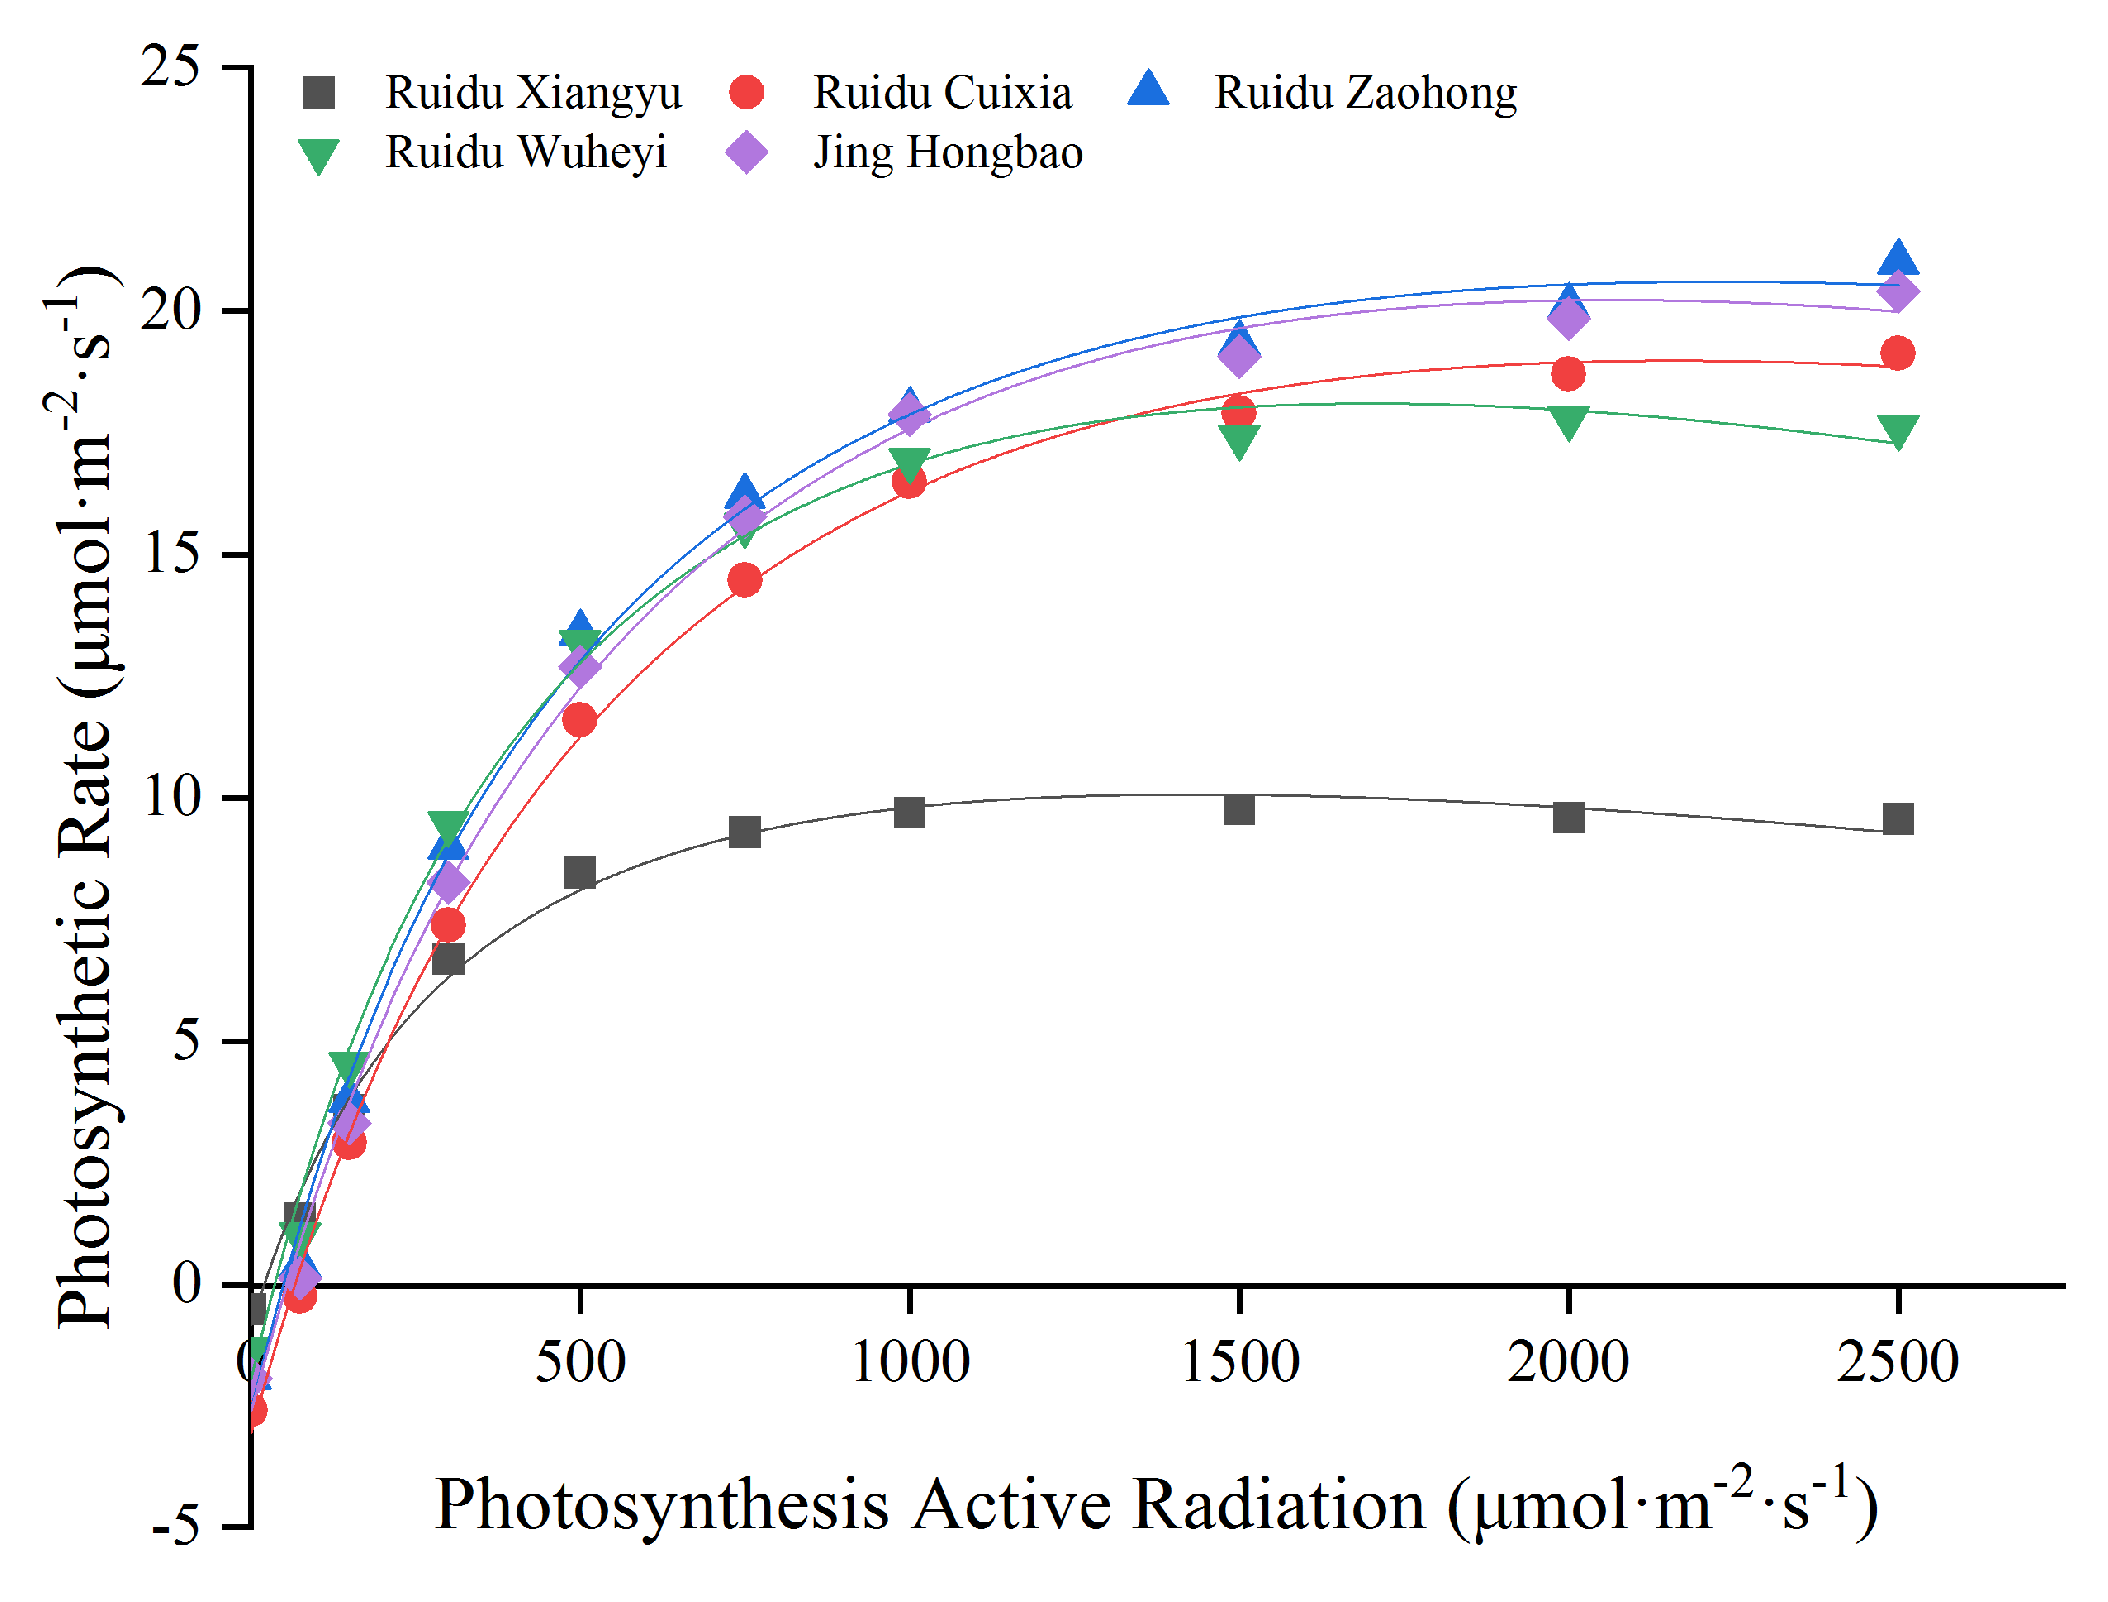
3.2. Photosynthetic Parameters and Photo-Response Curve

Photosynthetic parameters for all the varieties were measured. From Figure 3, it can be determined that all five photosynthetic parameters of ‘Ruidu Xiangyu’ were lower than those of the other four varieties, with an average Ci of 194.67 μmol·mol−1, which is 33.46% lower than that of ‘Ruidu Cuixia’ (Figure 3A). The gs is 145.56 mmol·m−2·s−1, which is 81.07% lower than that of ‘Ruidu Cuixia’ (Figure 3B). The Pn is 9.64 μmol·m−2·s−1, which is 52.14% lower than that of ‘Ruidu Zaohong’ (Figure 3C). The Tr is 5.88 mmol·mol−1, which is 49.18% lower than that of ‘Jing Hongbao’ (Figure 3D).
Finally, the average WUE is 1.64 mmol·m−2·s−1, which is 15.46% lower than that of ‘Ruidu Zaohong’ (Figure 3E).
Fitting curves of the light response of five new table grape varieties were also observed. The fitting curve presented in Figure 4 showed that the light response curve of all five varieties shows a similar trend. With the increase in photosynthesis active radiation, the net photosynthesis rate gradually increases. After reaching the saturation light intensity, it stabilizes or slightly decreases. There are significant differences in the net photosynthesis rate of the five varieties under high light intensity.
Based on the measured parameters of the Pn-PAR light response curve (Table 2), it can be observed that the photosynthetic characteristics of ‘Ruidu Xiangyu’ are the lowest among the five varieties. The mean value of its apparent quantum efficiency is 0.0298, which is 14.83% lower than that of ‘Ruidu Wuheyi’. Its dark respiration rate is 0.85 μmol·m−2·s−1, which is 72.84% lower than that of ‘Ruidu Cuixia’. Its light saturation intensity is 1437.1 μmol·m−2·s−1, which is 39.55% lower than that of ‘Ruidu Zaohong’. Its light compensation point is 20 μmol·m−2·s−1, which is 70.06% lower than that of ‘Ruidu Cuixia’. Finally, its maximum net photosynthesis rate is 9.8 μmol·m−2·s−1, which is 51.96% lower than that of ‘Jing Hongbao’.

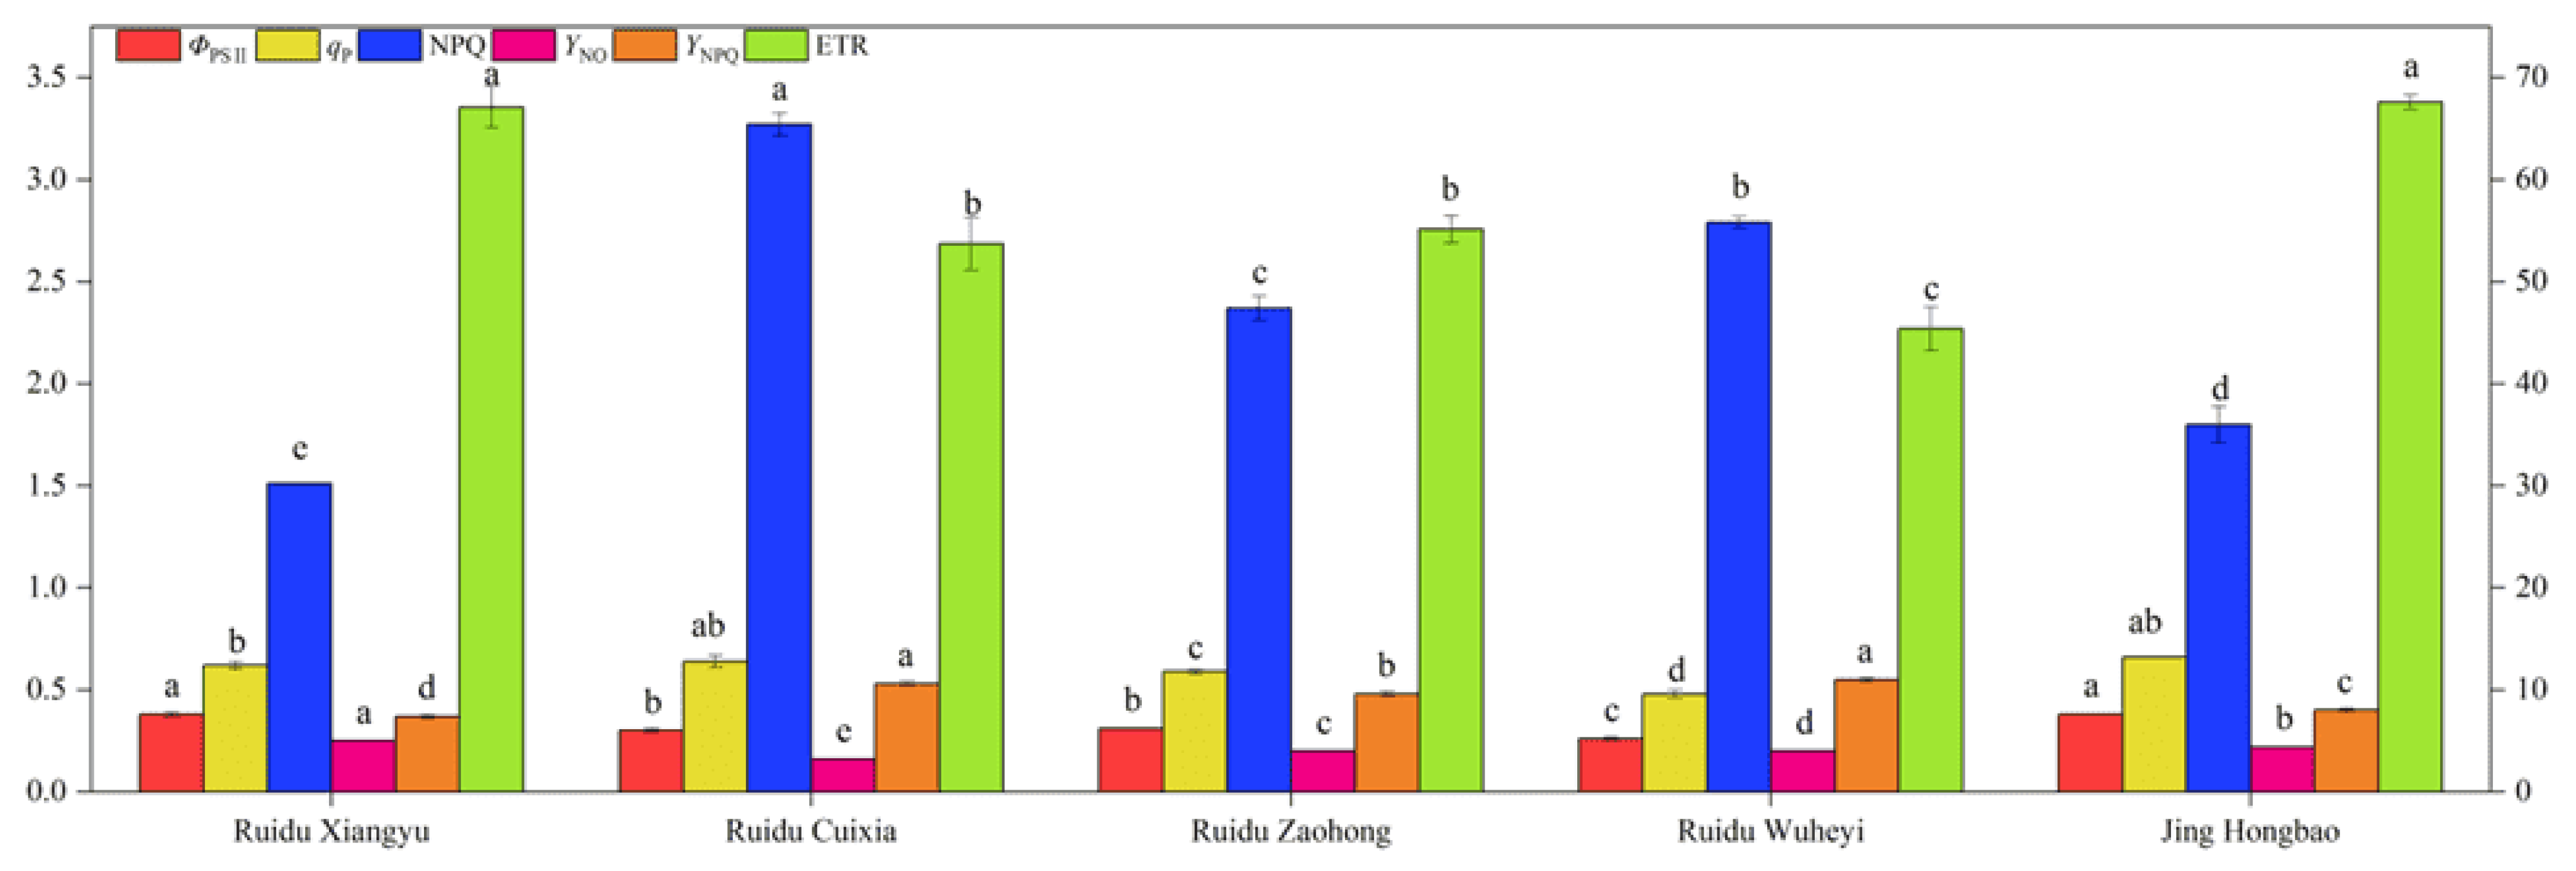
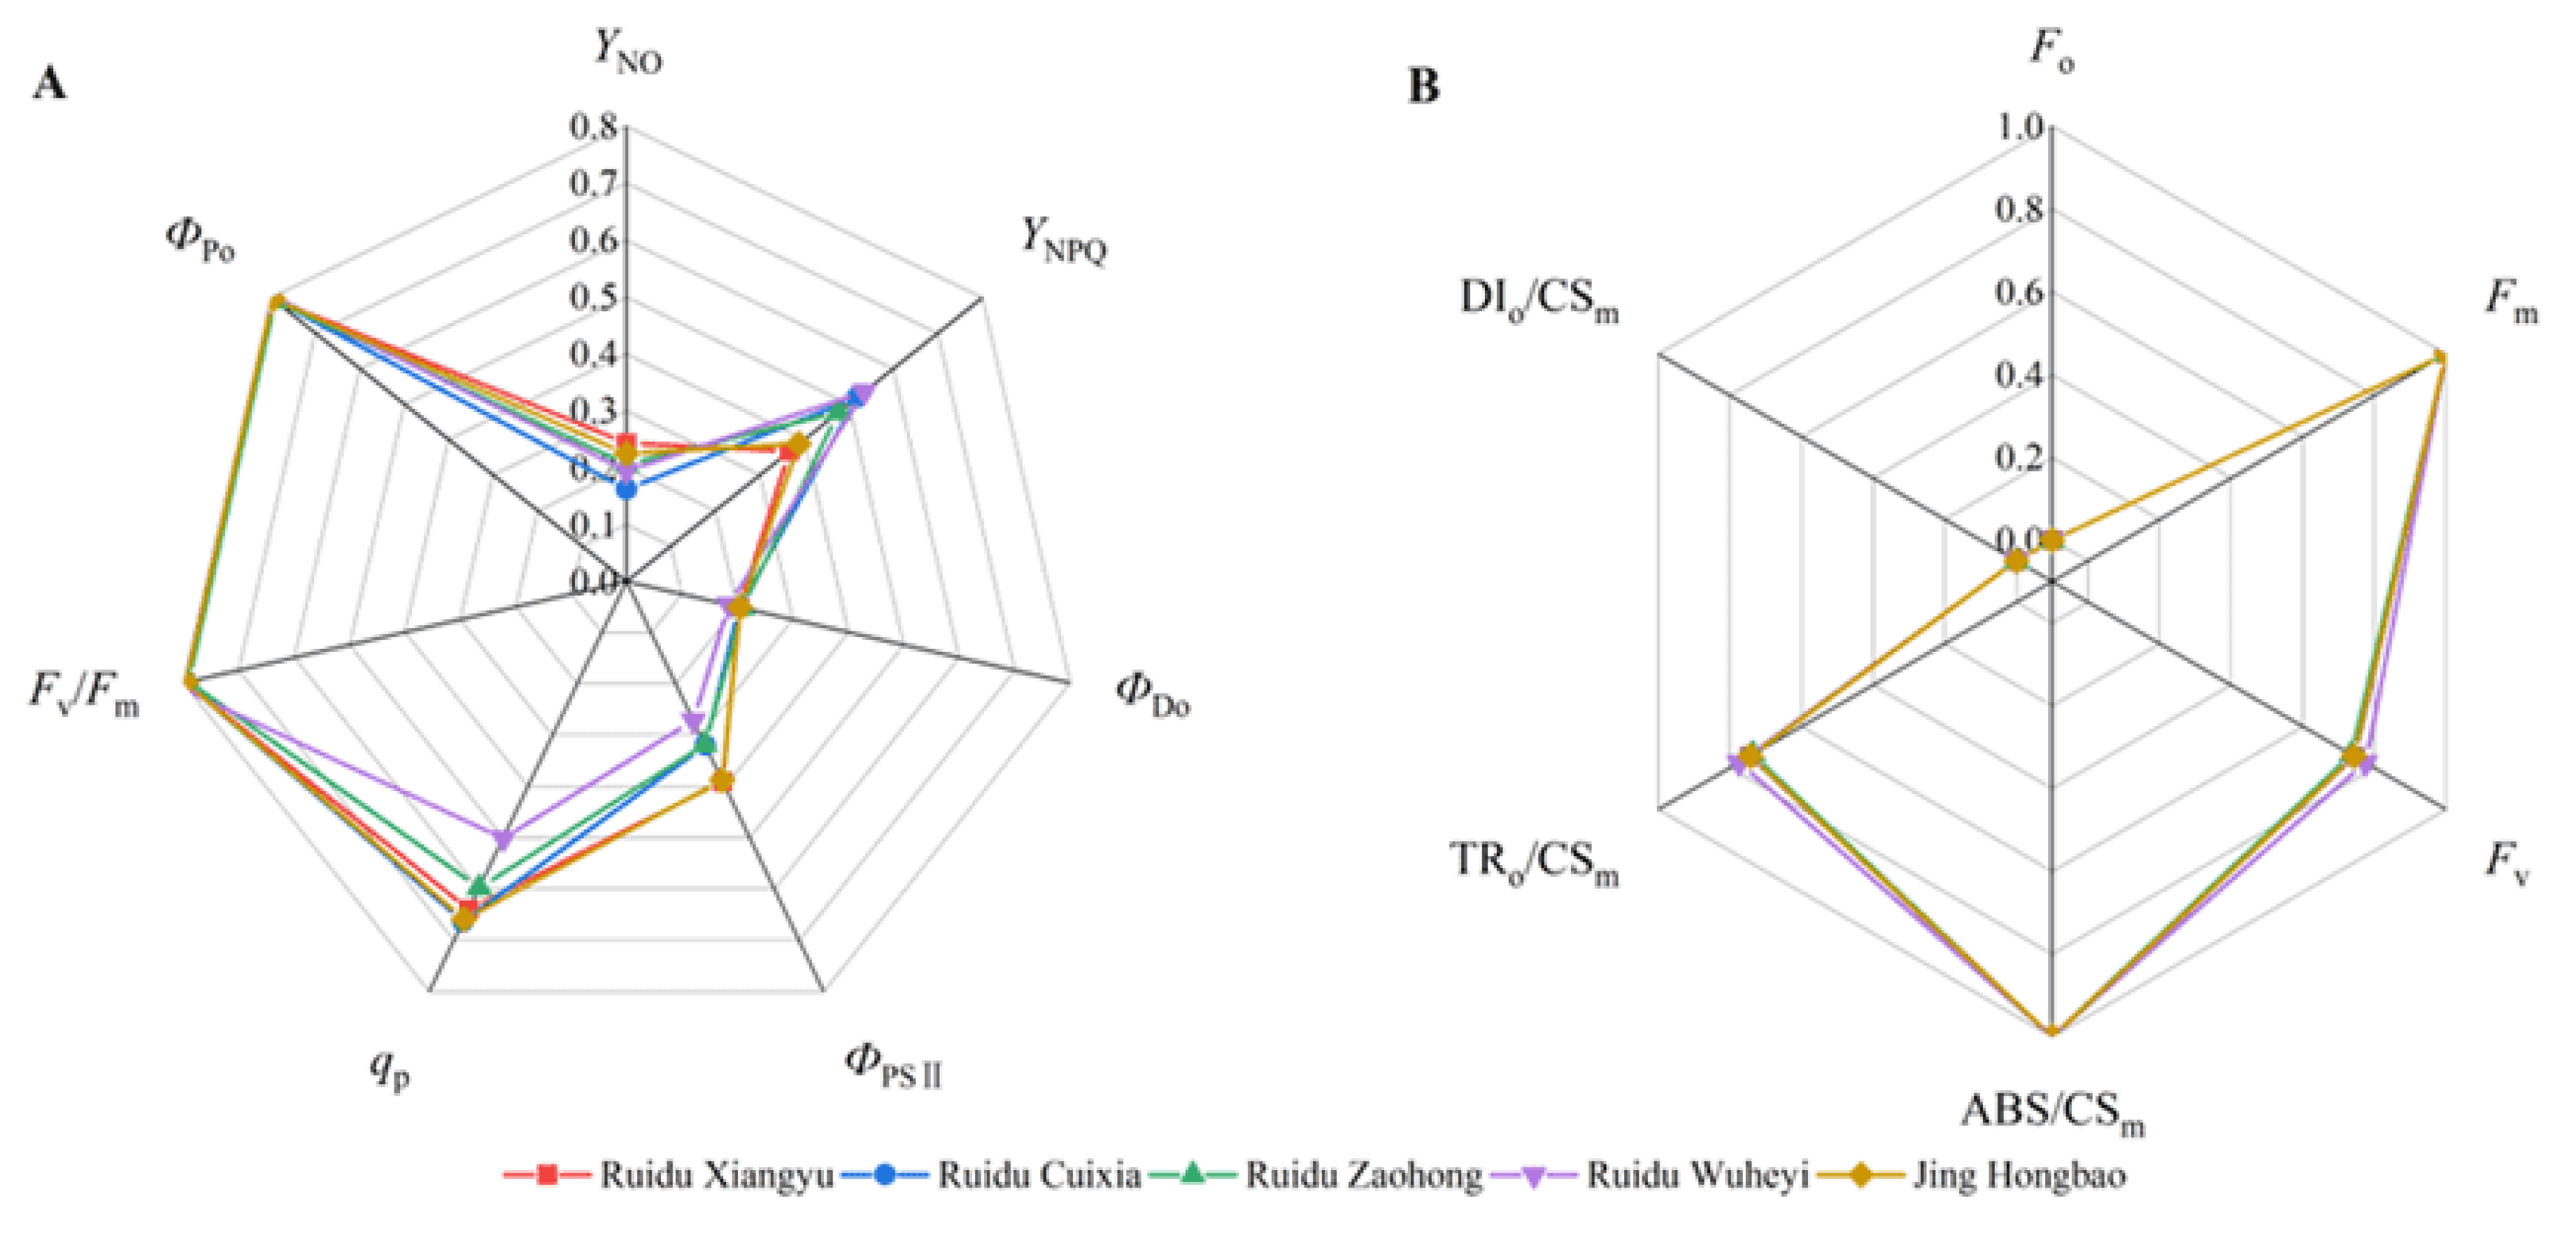
3.3. Chlorophyll Fluorescence Parameters

The dynamic parameters of chlorophyll fluorescence were mathematically analyzed for these five different grape varieties, aiming to characterize the structural and electron transfer performance of their photosynthetic apparatus. The analysis results reflect the photosynthetic performance of these grape varieties. Representative chlorophyll fluorescence parameters were summarized, revealing significant differences in the regulation ability of chlorophyll fluorescence in response to light intensity among the different varieties (Figure 5).
Analysis of chlorophyll fluorescence parameters revealed that the highest and lowest values of ΦPSII, ETR, and qP were observed in ‘Jing Hongbao’ and ‘Ruidu Wuheyi’, respectively (Figure 5). The mean values of ΦPSII, ETR, and qP for ‘Jing Hongbao’ were 0.38, 67.6, and 0.66, respectively, representing higher of 46.15%, 49.00%, and 37.50% compared to ‘Ruidu Wuheyi’. Conversely, ‘Ruidu Wuheyi’ exhibited the highest mean value of YNPQ (0.55), while ‘Ruidu Xiangyu’ had the lowest mean value (0.37). In Figure 6, ‘Ruidu Wuheyi’ displayed the highest values of Fv/Fm and ΦPo, while ‘Ruidu Zaohong’ had the lowest values. Additionally, ‘Ruidu Zaohong’ demonstrated superior performance in parameters such as ΦDo and ABS/CSm. The lowest values of ABS/CSm and DIo/CSm were observed in ‘Ruidu Wuheyi’, whereas ‘Ruidu Xiangyu’ had the lowest value of TRo/CSm.

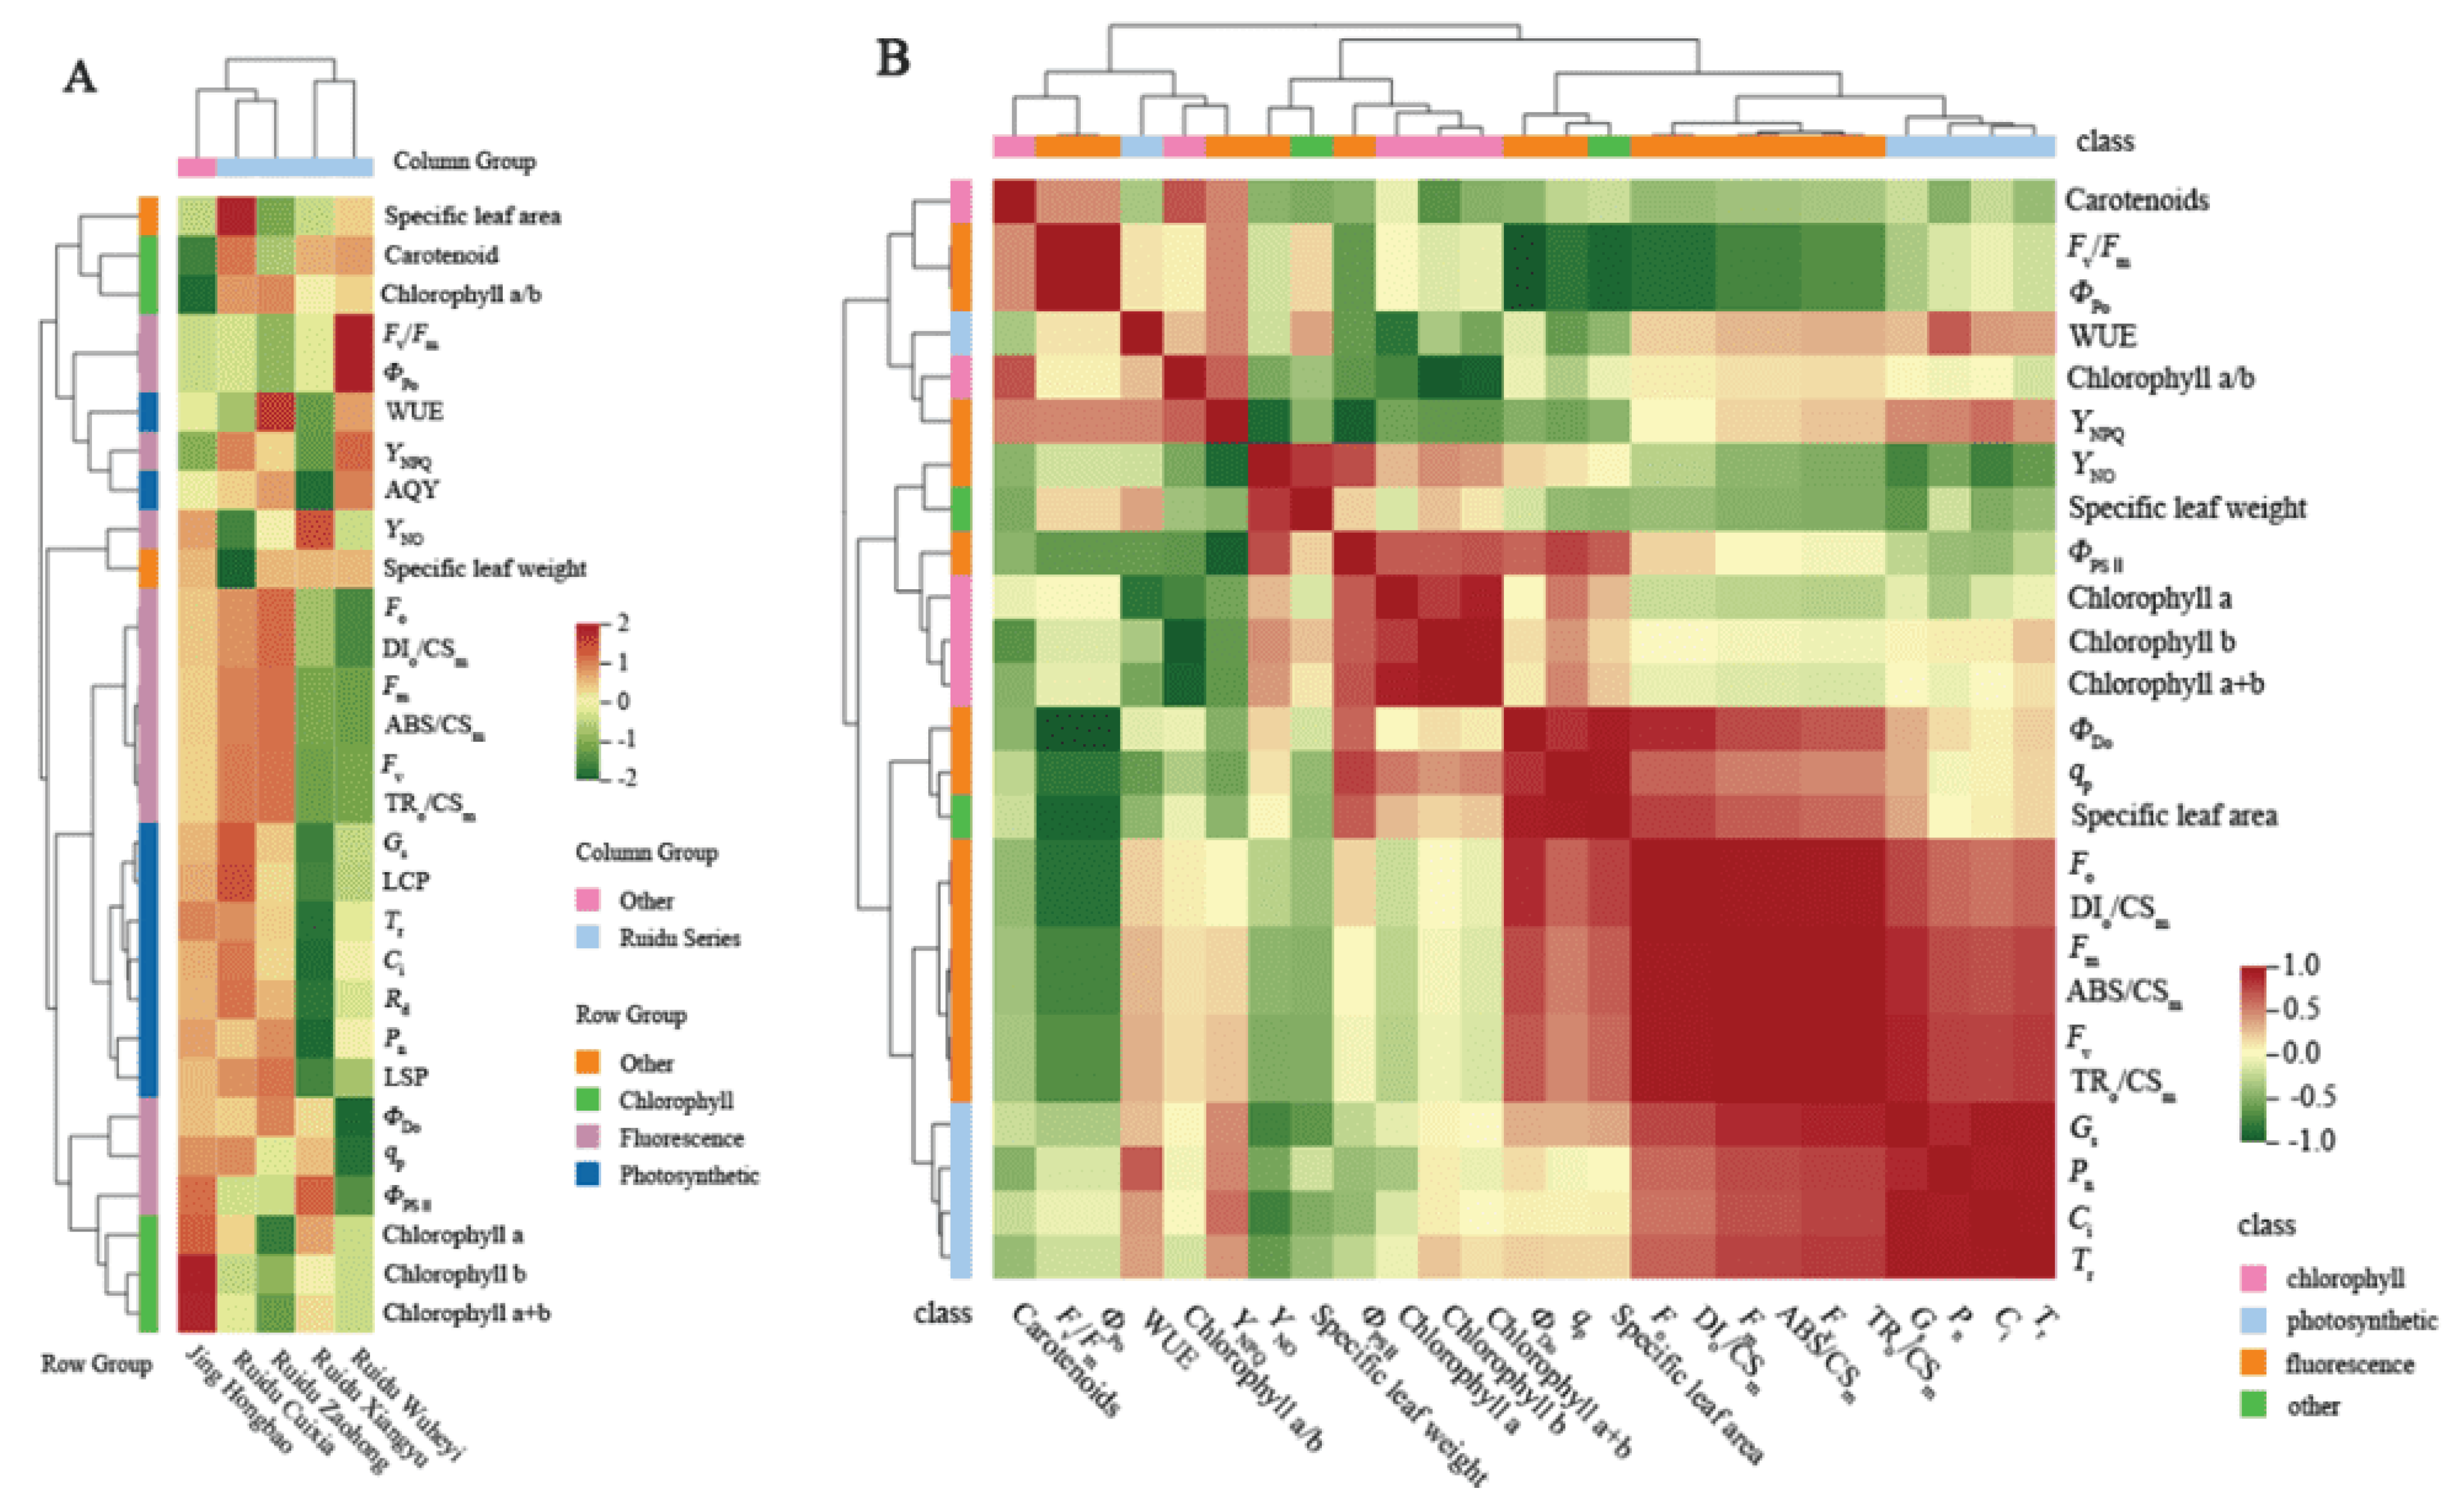
3.4. Correlation Analysis and Hierarchical Cluster Analysis

The light adaptation ability of the five varieties was analyzed by hierarchical cluster analysis, and the results are presented in Figure 7A. From Figure 7A, it can be observed that the five varieties were divided into two categories based on clades, and their prominent characteristics. The first category includes ‘Jing Hongbao’, ‘Ruidu Cuixia’, and ‘Ruidu Zaohong’, which have the highest chlorophyll content and chlorophyll fluorescence parameters and lower light saturation intensity.
The second category includes ‘Ruidu Xiangyu’ and ‘Ruidu Wuheyi’, which have lower chlorophyll content and chlorophyll fluorescence parameter values but higher apparent quantum efficiency values.
Pearson correlation analysis was performed on the 25 photosynthetic phenotypic indices of the five varieties (Figure 7B). From Figure 7B, it can be observed that Pn is significantly positively correlated with Ci and Tr (p < 0.05), and their correlation coefficients are all greater than 0.92. gs is significantly positively correlated with Fv and TRo/CSm, and its correlation coefficient is 0.885. Specific leaf area is significantly positively correlated with ΦDo and qP, and negatively correlated with ΦPo and Fv/Fm (p < 0.05). Their correlation coefficients are all greater than 0.92.
Further correlation analysis results clearly showed that there is a good correlation between photosynthetic characteristics and chlorophyll fluorescence parameters, indicating that the evaluation of plant photosynthetic capacity needs to comprehensively consider both photosynthetic and chlorophyll fluorescence indicators.

3.5. Principal Component Analysis

Principal component analysis was performed on the 25 photosynthetic and chlorophyll fluorescence indicators in the experiment. Four principal components with eigenvalues greater than 1 were extracted (Table 3), accounting for a cumulative contribution rate of 100% and effectively retaining most of the information from the original variables. These four principal components were used for a comprehensive analysis of the photochemical efficacy of the five varieties. The eigenvectors of the principal components were calculated based on the principal component loading matrix and eigenvalues.
By multiplying the obtained eigenvectors with the standardized data and considering the proportion of eigenvalues corresponding to the four principal components relative to the total sum of eigenvalues, weights were determined. These weights were then utilized to calculate the composite scores of the principal components.
The results (Table 4) revealed the relative photosynthetic abilities of the five varieties as follows: ‘Jing Hongbao’ > ‘Ruidu Cuixia’ > ‘Ruidu Zaohong’ > ‘Ruidu Xiangyu’ > ‘Ruidu Wuheyi’. To allow for comparison of the indicator scores, the scores of the four principal components were multiplied and summed with the squared variances’ percentages of the extracted loadings. These values were subsequently divided by the cumulative percentages. The results (Table 5) showcased the varying weightings of the 25 indicators in leaf photosynthesis, with chlorophyll b, Tr, chlorophyll a + b, qP, and gs ranking among the top 5.

3.6. Comprehensive Evaluation of Photosynthetic Capacity

The results (Table 6 and Table 7) show that the photosynthetic capacity of the five new varieties of table grapes from strongest to weakest are: ‘Jing Hongbao’ > ‘Ruidu Cuixia’ > ‘Ruidu Zhaohong’ > ‘Ruidu Wuheyi’ > ‘Ruidu Xiangyu’.

4. Discussion

Photosynthetic pigments are an important part of the photosynthesis mechanism. Under the long-term strong light irradiation in Xinjiang during the daytime, the leaf pigment contents of the five varieties were quite different. The chlorophyll a and chlorophyll b contents of ‘Ruidu Zaohong’ were significantly lower than those of the other four varieties. The chlorophyll a + b content of ‘Jing Hongbao’ reached 2.39 mg·g−1, with chlorophyll a at 1.41 mg·g−1 and chlorophyll b at 0.98 mg·g−1, respectively. Its growth potential was better than that of the ‘Ruidu’ series.
The results of this experiment were consistent with Yan’s findings in 2021. High temperature and strong light stress reduced the pigment content of the leaves, damaged the chloroplast structure in them, and inhibited photosynthesis. However, the chlorophyll a and b contents of ‘Jing Hongbao’ were higher, indicating that the plants can initiate self-protection mechanisms to meet their own growth needs under stress conditions [28].
Photosynthesis serves as an important indicator for testing the sensitivity of plants to environmental stress [29]. In the high temperature and high light intensity conditions of Xinjiang, the average Pn of ‘Ruidu Zaohong’ was as high as 20.14 μmol·m−2·s−1, whereas ‘Ruidu Xiangyu’ only reached 9.64 μmol·m−2·s−1. Moreover, ‘Ruidu Cuixia’ exhibited mean gs and Ci values that were 50.29% and 426.63% higher than those of ‘Ruidu Xiangyu’, respectively.
These findings suggest that higher temperatures and stronger light may lead to stomatal closure in ‘Ruidu Xiangyu’ leaves, thereby impacting the gas exchange rate. Consequently, this closure causes a decrease in gs and Ci, inhibiting photosynthetic efficiency by reducing photosynthetic assimilation substances and water loss, which aligns with the observations made by Tang et al. [30].
Plants possess a light radiation signal regulation system [31] that modulates both stomatal and non-stomatal factors based on the effective light radiation intensity. This regulation system influences various photosynthetic parameters in leaves. Research findings indicate that leaf damage due to excessive light results in reduced chlorophyll content, Tr value, and Pn value, ultimately diminishing photosynthetic capacity. This outcome is similar to the findings reported by Negi et al. [32]. Additionally, correlation analysis demonstrates a significant positive relationship between Pn, Ci, and Tr. Consequently, it is speculated that stomatal factors play a pivotal role in a plant’s growth potential. Different grape varieties employ diverse mechanisms to coordinate their photosynthesis, utilizing CO2 absorption, water uptake, and inorganic ion transport to adapt to their specific growth environments.
Chlorophyll fluorescence is a commonly used, non-destructive method for detecting plant physiological characteristics and stress traits, which further helps in increasing our understanding of the behavior of plants in their natural environments [33]. Previous research results have shown that the instantaneous fluorescence signal of PSII is primarily caused by the oxidation-reduction reaction of plastoquinone A (QA) [34]. QA represents the reduction state of the photosynthetic electron transport chain and is manifested as photochemical energy conversion and thermal dissipation [35,36]. Fv/Fm can estimate the maximum quantum yield of QA reduction, representing the potential efficiency of plant PSII [37].
Under non-stress conditions, the normal range of Fv/Fm for plant leaves is between 0.80 and 0.85. When under environmental stress, the Fv/Fm value will significantly decrease. The results of this study show that only ‘Ruidu Wuheyi’ Fv/Fm is greater than 0.81, indicating that the light duration and intensity in Xinjiang are suitable for the growth needs of this variety. The Fv/Fm of the other 4 varieties was slightly lower than 0.80, indicating that the plants were under environmental stress, which is speculated to be related to the reversible inactivation or downregulation of PSII caused by high light and heat [38]. Fv is related to the photo-acclimation state of the dark-adapted reaction center [39]. QP represents the proportion of the PSII reaction center capturing the excitation energy, TRo/CSm represents the light energy captured per unit area, ΦPo represents the maximum quantum yield of the primary photochemical reaction, and ΦDo represents the quantum yield of energy dissipation.
In this study, ‘Ruidu Zhaohong’ had the highest TRo/CSm and ΦDo values, indicating that QA was affected by high light and heat stress and could not effectively transmit electrons to the next level Quinone receptor [40], resulting in severe energy loss.
In addition, the correlation analysis shows that gs is significantly positively correlated with Fv and TRo/CSm; specific leaf area is significantly positively correlated with ΦDo and qP, and significantly negatively correlated with ΦPo and Fv/Fm, which is inconsistent with the results of previous studies [9,41]. The reasons may be due to differences in the experimental plant varieties, changes in the growth environment, and uncertainties in the correlations between various photosynthetic parameters, and further research is needed to determine the specific reasons.
Photosynthesis in plants is controlled by several factors, such as environmental factors, growth and developmental stages, and nutritional status, which can lead to differences in response to plant traits. In this study, five Chinese own hybrid varieties grapes were selected and cultivated under normal water and fertilizer management. Their photosynthetic capacity was evaluated in relation to their phenotypic, physiological, and biochemical indicators. The varieties were ranked according to the combined scores of principal component analysis and TOPSIS.
The results showed that ‘Jing Hongbao’, ‘Ruidu Cuixia’, and ‘Ruidu Zaohong’ ranked in the top three positions in both evaluation methods. However, further research is needed to determine the photosynthetic capacity between ‘Ruidu Xiangyu’ and ‘Ruidu Wuheyi’, as they ranked in the bottom two positions.
Moreover, since grapes are a berry plant, the adaptability of grapes to the regional environment of Xinjiang still needs to be evaluated in terms of fruit quality and internal tissue structure, among other factors.
This study only analyzed the photosynthetic characteristics of the leaves, and further research will be conducted on the physiological characteristics of the fruits.

5. Conclusions

There were some differences in leaf photosynthetic performance, photosynthetic pigment content, and chlorophyll fluorescence parameters between the five hybrid varieties under cultivation conditions in Xinjiang. Overall, ‘Jing Hongbao’ and ‘Ruidu Cuixia’ exhibited a stronger ability to accumulate organic matter content through photosynthesis, and their utilization efficiency in a strong light environment was significantly higher than that of ‘Ruidu Zaohong’, ‘Ruidu Xiangyu’, and ‘Ruidu Wuheyi’, which demonstrated a strong resistance to strong light intensity stress. Based on the comprehensive evaluation results of photosynthetic traits for each variety using principal component analysis and TOPSIS analysis, it can be preliminarily concluded that ‘Jing Hongbao’ and ‘Ruidu Cuixia’ displayed stronger adaptability to the climate in Xinjiang and are suitable for cultivation in the region.

Author Contributions

F.Z., X.W. and H.Z. conceived and designed the experiments. S.B., J.W., X.Z. and W.Z. provide technical guidance. Y.H. and F.Z. performed the experiments. Y.H. and V.Y. wrote the manuscript. Y.H. analyzed the data. S.H., M.W., B.Z. and X.W. revised the manuscript and provided technical support. All authors have read and agreed to the published version of the manuscript.

Funding

Supported by the Agricultural Science and Technology Innovation long-term support project, Xinjiang Academy of Agricultural Sciences (xjnkywdzc-2022001-9), Key research and development project of autonomous region (2022B02045-1-1), China Agriculture Research System of MOF and MARA (CARS-29-30), Xinjiang Uygur Autonomous Region Tianshan Talents Training Program-Young top-notch scientific and technological talents (2022TSYCJC0036) and Xinjiang Uygur Autonomous Region Innovation Environment Construction Special Project (PT2314).

Data Availability Statement

Data are contained within the article.

Acknowledgments

Horticultural Crops Institute of Xinjiang Academy of Agricultural Sciences and various regional botanical gardens for sampling support during the progress of this project.

Conflicts of Interest

The authors declare no conflict of interest.

References

  1. He, B.B.; Sheng, Y.; Cao, W.; Wu, J.C. Characteristics of Climate Change in Northern Xinjiang in 1961–2017, China. Chin. Geogr. Sci. 2019, 30, 249–265. [Google Scholar] [CrossRef]
  2. Ivashchenko, I.B.A.; Rakhmetov, D.; Fishchenko, V. Biochemical peculiarities of Glebionis coronaria (Asteraceae) introduced in Central Polissya of Ukraine. Plant Fungal Res. 2019, 2, 32–39. [Google Scholar] [CrossRef]
  3. Ivashchenko, I.; Kotyuk, L.; Bakalova, A. Morphology and productivity of tarragon (Artemisia dracunculus L.) in Central Polissya (Ukraine). Ukr. J. Ecol. 2020, 10, 48–55. [Google Scholar]
  4. Tsai, Y.C.; Chen, K.C.; Cheng, T.S.; Lee, C.; Lin, S.H.; Tung, C.W. Chlorophyll fluorescence analysis in diverse rice varieties reveals the positive correlation between the seedlings salt tolerance and photosynthetic efficiency. BMC Plant Biol. 2019, 19, 403. [Google Scholar] [CrossRef] [PubMed]
  5. Ashraf, M.; Harris, P.J.C. Photosynthesis under stressful environments: An overview. Photosynthetica 2013, 51, 163–190. [Google Scholar] [CrossRef]
  6. Wei, S.S.; Wang, X.Y.; Shi, D.; Li, Y.H.; Zhang, J.W.; Liu, P.; Zhao, B.; Dong, S. The mechanisms of low nitrogen induced weakened photosynthesis in summer maize (Zea mays L.) under field conditions. Plant Physiol. Biochem. 2016, 105, 118–128. [Google Scholar] [CrossRef] [PubMed]
  7. Du, X.H.; Peng, F.R.; Jiang, J.; Tan, P.P.; Wu, Z.Z.; Liang, Y.W.; Zhong, Z.K. Inorganic nitrogen fertilizers induce changes in ammonium assimilation and gas exchange in Camellia sinensis L. Turk. J. Agric. For. 2015, 39, 28–38. [Google Scholar] [CrossRef]
  8. Mathur, S.; Tomar, R.S.; Jajoo, A. Arbuscular Mycorrhizal fungi (AMF) protects photosynthetic apparatus of wheat under drought stress. Photosynth. Res. 2019, 139, 227–238. [Google Scholar] [CrossRef]
  9. Wang, Y.; Jie, W.; Peng, X.; Hua, X.; Yan, X.; Zhou, Z.; Lin, J. Physiological adaptive strategies of oil seed crop Ricinus communis early seedlings (cotyledon vs. true leaf) under salt and alkali stresses: From the growth, photosynthesis and chlorophyll fluorescence. Front. Plant Sci. 2019, 9, 1939. [Google Scholar] [CrossRef]
  10. Tantray, A.Y.; Bashir, S.S.; Ahmad, A. Low nitrogen stress regulates chlorophyll fluorescence in coordination with photosynthesis and Rubisco efficiency of rice. Physiol. Mol. Biol. Plants 2020, 26, 83–94. [Google Scholar] [CrossRef]
  11. Yan, Z.; Ma, T.; Guo, S.; Liu, R.; Li, M. Leaf anatomy, photosynthesis and chlorophyll fluorescence of lettuce as influenced by arbuscular mycorrhizal fungi under high temperature stress. Sci. Hortic. 2021, 280, 109933. [Google Scholar] [CrossRef]
  12. Kromdijk, J.; Głowacka, K.; Leonelli, L.; Gabilly, S.T.; Iwai, M.; Niyogi, K.K.; Long, S.P. Improving photosynthesis and crop productivity by accelerating recovery from photoprotection. Science 2016, 354, 857–861. [Google Scholar] [CrossRef]
  13. Zhao, L.S.; Li, K.; Wang, Q.M.; Song, X.Y.; Su, H.N.; Xie, B.B.; Zhang, X.Y.; Huang, F.; Chen, X.L.; Zhou, B.C. Nitrogen Starvation Impacts the Photosynthetic Performance of Porphyridium cruentum as Revealed by Chlorophyll a Fluorescence. Sci. Rep. 2017, 7, 8542. [Google Scholar] [CrossRef] [PubMed]
  14. Bark, K.M.; Forcé, R.K. Fluorescence properties of fluoranthene as a function of temperature and environment. Spectrochim. Acta Part A Mol. Spectrosc. 1993, 49, 1605–1611. [Google Scholar] [CrossRef]
  15. Hazrati, S.; Tahmasebi-Sarvestani, Z.; Modarres-Sanavy, S.A.M.; Mokhtassi-Bidgoli, A.; Nicola, S. Effects of water stress and light intensity on chlorophyll fluorescence parameters and pigments of Aloe vera L. Plant Physiol. Biochem. 2016, 106, 141–148. [Google Scholar] [CrossRef] [PubMed]
  16. Liu, W.; Yuan, Y.; Wang, W.; Xie, Q.; Chen, Q. Effects of heat stress on chlorophyll fluorescence characteristics of Rhododendron leaves. Jiangsu Agric. Sci. 2019, 47, 144–148. [Google Scholar]
  17. Li, Z.; Ji, W.; Hong, E.; Fan, Z.; Lin, B.; Xia, X.; Chen, X.; Zhu, X. Study on Heat Resistance of Peony Using Photosynthetic Indexes and Rapid Fluorescence Kinetics. Horticulturae 2023, 9, 100. [Google Scholar] [CrossRef]
  18. Van der Westhuizen, M.M.; Oosterhuis, D.M.; Berner, J.M.; Boogaers, N. Chlorophyll a fluorescence as an indicator of heat stress in cotton (Gossypium hirsutum L.). S. Afr. J. Plant Soil 2020, 37, 116–119. [Google Scholar] [CrossRef]
  19. Carlson, J.E.; Adams, C.A.; Holsinger, K.E. Intraspecific variation in stomatal traits, leaf traits and physiology reflects adaptation along aridity gradients in a South African shrub. Ann. Bot. 2016, 117, 195–207. [Google Scholar] [CrossRef]
  20. Liu, Q.Q.; Huang, Z.J.; Wang, Z.N.; Chen, Y.F.; Wen, Z.M.; Liu, B.; Tigabu, M. Responses of leaf morphology, NSCs contents and C:N:P stoichiometry of Cunninghamia lanceolata and Schima superba to shading. BMC Plant Biol. 2020, 20, 354. [Google Scholar] [CrossRef]
  21. Wu, J.A.R.; Zhong, H.; Yadav, V.; Zhang, C.; Ma, Y.; Liu, X.; Zhang, F.; Zha, Q.; Wang, X. The Impact of High Temperatures in the Field on Leaf Tissue Structure in Different Grape Cultivars. Horticulturae 2023, 9, 731. [Google Scholar] [CrossRef]
  22. Altaf, M.A.; Hao, Y.; Shu, H.; Jin, W.; Chen, C.; Li, L.; Zhang, Y.; Mumtaz, M.A.; Fu, H.; Cheng, S.; et al. Melatonin mitigates cold-induced damage to pepper seedlings by promoting redox homeostasis and regulating antiox-idant profiling. Hortic. Plant J. 2023, 9, 1–13. [Google Scholar]
  23. Altaf, A.; Nawaz, F.; Majeed, S.; Ahsan, M.; Ahmad, K.S.; Akhtar, G.; Shehzad, M.A.; Rashad Javeed, H.M.; Farman, M. Foliar Humic Acid and Salicylic Acid Application Stimulates Physiological Responses and Antioxidant Systems to Im-prove Maize Yield under Water Limitations. JSFA Rep. 2023, 3, 119–128. [Google Scholar] [CrossRef]
  24. Ye, Z.P.; Li, J.S. Comparative investigation light response of photosynthesis on non-rectangular hyperbola model and modified model of rectangular hyperbola. J. Jinggangshan Univ. 2010, 31, 38–44. [Google Scholar]
  25. Strasser, R.J.; Srivastava, A.; Tsimilli-Michael, M. The fluorescence transient as a tool to characterize and screen photosynthetic samples. Probing Photosynth. Mech. Regul. Adapt. 2000, 25, 445–483. [Google Scholar]
  26. Tsimilli-Michael, M. Revisiting JIP-test: An educative review on concepts, assumptions, approximations, definitions and terminology. Photosynthetica 2019, 57, 90–107. [Google Scholar]
  27. Arnon, D.I. Copper enzymes in isolated chloroplasts. polyphenoloxidase in beta Vulgaris. Plant Physiol. 1949, 24, 1–15. [Google Scholar] [CrossRef]
  28. Ma, X.H.; Song, L.L.; Yu, W.W.; Hu, Y.Y.; Liu, Y.; Wu, J.S.; Ying, Y.Q. Growth, physiological, and biochemical responses of Camptothecaacuminata seedlings to different light environments. Front. Plant Sci. 2015, 6, 321. [Google Scholar] [CrossRef]
  29. Chaves, M.M.; Flexas, J.; Pinheiro, C. Photosynthesis under drought and salt stress: Regulation mechanisms from whole plant to cell. Ann. Bot. 2009, 103, 551–560. [Google Scholar] [CrossRef]
  30. Tang, H.; Hu, Y.Y.; Yu, W.W.; Song, L.L.; Wu, J.S. Growth, photosynthetic and physiological responses of Torreya grandis seedlings to varied light environments. Trees 2015, 29, 1011–1022. [Google Scholar] [CrossRef]
  31. Huang, Z.; Liu, Q.; An, B.; Wu, X.; Sun, L.; Wu, P.; Liu, B.; Ma, X. Effects of Planting Density on Morphological and Photosynthetic Characteristics of Leaves in Different Positions on Cunninghamia lanceolata Saplings. Forests 2021, 12, 853. [Google Scholar] [CrossRef]
  32. Negi, S.; Barry, A.N.; Friedland, N.; Sudasinghe, N.; Subramanian, S.; Pieris, S.; Holguin, F.O.; Dungan, B.; Schaub, T.; Sayre, R. Impact of nitrogen limitation on biomass, photosynthesis, and lipid accumulation in Chlorella sorokiniana. J. Appl. Phycol. 2016, 28, 803–812. [Google Scholar] [CrossRef]
  33. Jiang, Y.; Ding, X.; Zhang, D.; Deng, Q.; Yu, C.L.; Zhou, S.; Hui, D. Soil salinity increases the tolerance of excessive sulfur fumigation stress in tomato plants. Environ. Exp. Bot. 2017, 133, 70–77. [Google Scholar] [CrossRef]
  34. Hichem, H.; Naceur, A.E.; Mounir, D. Effects of salt stress on photosynthesis, PSII photochemistry and thermal energy dissipation in leaves of two corn (Zea mays L.) varieties. Photosynthetica 2009, 47, 517–526. [Google Scholar] [CrossRef]
  35. Lin, Z.H.; Zhong, Q.S.; Chen, C.S.; Ruan, Q.C.; Chen, Z.H.; You, X.M. Carbon dioxide assimilation and photosynthetic electron transport of tea leaves under nitrogen deficiency. Bot. Stud. 2016, 57, 37. [Google Scholar] [CrossRef]
  36. Lin, Z.H.; Chen, L.S.; Chen, R.B.; Zhang, F.Z.; Jiang, H.X.; Tang, N. CO2 assimilation, ribulose-1,5-bisphosphate carboxylase/oxygenase, carbohydrates and photosynthetic electron transport probed by the JIP-test, of tea leaves in response to phosphorus supply. BMC Plant Biol. 2009, 9, 43. [Google Scholar] [CrossRef]
  37. Murchie, E.H.; Lawson, T. Chlorophyll fluorescence analysis: A guide to good practice and understanding some new applications. J. Exp. Bot. 2013, 64, 3983–3998. [Google Scholar] [CrossRef] [PubMed]
  38. Hanachi, S.; Van Labeke, M.C.; Mehouachi, T. Application of chlorophyll fluorescence to screen eggplant (Solanum melongena L.) cultivars for salt tolerance. Photosynthetica 2014, 52, 57–62. [Google Scholar] [CrossRef]
  39. Hanelt, D. Photosynthesis Assessed by Chlorophyll Fluorescence; Elsevier: Amsterdam, The Netherlands, 2018. [Google Scholar]
  40. Mathur, S.; Allakhverdiev, S.I.; Jajoo, A. Analysis of high temperature stress on the dynamics of antenna size and reducing side heterogeneity of Photosystem II in wheat leaves (Triticum aestivum). Biochim. Biophys. Acta (BBA) Bioenerg. 2011, 1807, 22–29. [Google Scholar] [CrossRef]
  41. Martins, S.C.; Galmés, J.; Molins, A.; DaMatta, F.M. Improving the estimation of mesophyll conductance to CO2: On the role of electron transport rate correction and respiration. J. Exp. Bot. 2013, 64, 3285–3298. [Google Scholar] [CrossRef]
Figure 1. Comparison of leaf characteristic parameters of five new table grape varieties. Same letter in the same figure indicates that there is no significant difference. The data in the figure are mean ± standard deviation, and different lowercase letters indicate significant differences (p < 0.05). (A) Leaf area; (B) Leaf weight; (C) specific leaf weight; (D) specific leaf area.
Horticulturae 09 01035 g001
Figure 2. Comparison of chlorophyll content in varieties. The error bar indicates the standard deviation obtained from three biological replicates. Same letter in the same figure indicates that there is no significant difference. The data in the figure are mean ± standard deviation, and different lowercase letters indicate significant differences (p < 0.05).
Horticulturae 09 01035 g002
Figure 3. Comparison of photosynthetic parameters of five new table grape varieties. Ci (A), gs (B), Pn (C), Tr (D), and WUE (E) in the figure showed the difference in photosynthetic parameters of the five new varieties. Same letter in the same figure indicates that there is no significant difference. The data in the figure are mean ± standard deviation, and different lowercase letters indicate significant difference (p < 0.05).
Horticulturae 09 01035 g003
Figure 4. Fitting curves of light response of five new table grape varieties.
Horticulturae 09 01035 g004
Figure 5. Significant differences in chlorophyll fluorescence parameters among five new table grape varieties. ETR in the figure is the right coordinate axis degree, and other indicators are the left coordinate axis degree. Same letter in the same figure indicates that there is no significant difference. The data in the figure are mean ± standard deviation, and different lowercase letters indicate significant difference (p < 0.05).
Horticulturae 09 01035 g005
Figure 6. Comparison of fluorescence characteristic parameters of five new table grape varieties. (A) ΦDo, YNO, YNPQ, ΦPO, qp, Fv/Fm, and ΦPSII; (B) ABS/CSm, DIo/CSm, TRo/CSm, Fv, and Fm.
Horticulturae 09 01035 g006
Figure 7. Correlation and hierarchical clustering analysis of chlorophyll content, chlorophyll fluorescence, and photosynthetic characteristic parameters of five new table grape varieties. (A) represents hierarchical cluster analysis, and (B) represents correlation analysis. Different colors of red and green in Panel B indicate a significant correlation at the 0.05 level (two-tailed). Red indicates a high positive correlation, green indicates a high negative correlation, the redder the color, the higher the positive correlation between different indicators, the greener the color, and the negative phase between different indicators.
Horticulturae 09 01035 g007
Table 1. Introduction of five new table grape varieties.
VarietiesSpeciesParentBreeding UnitsBreeding Year
Ruidu XiangyuEurasianJingxiu × XiangfeiInstitute of Forestry and Fruit Science, Beijing Academy of Agriculture and Forestry ScienceIn December 2007, it was approved by Beijing Forest Variety Examination and Approval Committee
Ruidu CuixiaEurasianJingxiu × XiangfeiInstitute of Forestry and Fruit Science, Beijing Academy of Agriculture and Forestry ScienceIn December 2007, it was approved by Beijing Forest Variety Examination and Approval Committee
Ruidu ZaohongEurasianJingxiu × XiangfeiInstitute of Forestry and Fruit Science, Beijing Academy of Agriculture and Forestry ScienceIn December 2014, it was approved by Beijing Forest Variety Examination and Approval Committee
Ruidu WuheyiEurasianXiangfei × Hongbaoshi seedlessInstitute of Forestry and Fruit Science, Beijing Academy of Agriculture and Forestry ScienceIn 2009, it was approved by the Beijing Forest Variety Examination and Approval Committee
JinghongbaoEurasianGuibao × Wuhebai JixinFruit research institute of Shanxi Academy of Agricultural SciencesIn 2012, it was approved by Shanxi Provincial Crop Variety Examination and Approval Committee
Table 2. Comparison of characteristic parameters of response curves of five new table grape varieties Pn-PAR.
VarietiesRight Angle Hyperbolic Modified ModelApparent Quantum EfficiencyAdjust
R-Square
Dark Respiration Rate/
(μmol·m−2·s−1)
Light Saturation Point/
(μmol·m−2·s−1)
Light Compensation Point/(μmol·m−2·s−1)Maximum Net Photosynthetic Rate/
(μmol·m−2·s−1)
Ruidu Xiangyuy = 0.04488x 1     0 . 00012 x 1 + 0 . 00273 x   − 0.850470.02980.9910.851437.1209.8
Ruidu Cuixiay = 0.05172x 1     0 . 00008 x 1 + 0 . 00147 x   − 3.126940.03710.9983.132290.566.819.2
Ruidu Zaohongy = 0.05921x 1     0 . 00007 x 1 + 0 . 00170 x   − 2.697520.03840.9952.702377.449.621.0
Ruidu Wuheyiy = 0.05966x 1     0 . 00011 x 1 + 0 . 00182 x   − 2.025940.03910.9952.031734.336.417.8
Jing Hongbaoy = 0.05297x 1     0 . 00009 x 1 + 0 . 00139 x − 2.709400.03560.9962.712171.355.420.4
Table 3. Principal component characteristic values, contribution rate, and cumulative contribution rate of five new table grape varieties.
Principal Component NumberEigenvalueRate of Contribution/%Accumulating Contribution Rate/%
110.938543.75%43.75%
27.332029.33%73.08%
33.536914.15%87.23%
43.192612.77%100.00%
Table 4. Comprehensive principal component scores of five new table grape varieties.
VarietiesF1F2F3F4FRank
Ruidu Xiangyu−3.60702.3626−0.6990−1.8853−1.22484
Ruidu Cuixia2.9872−1.52091.9314−1.80100.90412
Ruidu Zaohong2.8615−0.7777−2.86970.30040.65613
Ruidu Wuheyi−3.4800−3.25920.43891.3790−2.24035
Jinghongbao1.23833.19531.19842.00691.90481
Table 5. Scores of photosynthetic indexes of five new table grape varieties.
IndexesF1F2F3F4FRank
Chlorophyll a−0.06830.23360.3939−0.02710.067316
Chlorophyll b−0.00220.27300.24280.27710.11051
Carotenoids−0.1108−0.22000.1283−0.3760−0.106325
Chlorophyll a + b−0.02720.27290.31280.17760.10033
Chlorophyll a/b0.0285−0.2691−0.1971−0.3176−0.100224
Ci0.2296−0.13610.20000.21380.086312
gs0.2706−0.08660.18340.08910.09685
Pn0.2299−0.11050.02990.32050.084313
Tr0.2424−0.06920.18150.25340.10692
WUE0.0835−0.1826−0.30690.3293−0.013419
Fv/Fm−0.2076−0.21650.15460.1772−0.081622
ΦPo−0.2076−0.21650.15460.1772−0.081623
ΦDo0.20760.2165−0.1546−0.17720.081614
ΦPSII−0.00330.36350.0179−0.09620.070815
qp0.15540.25870.1377−0.23580.09884
YNO−0.14780.2805−0.21650.0768−0.002318
YNPQ0.0621−0.35690.07590.0332−0.046521
Fo0.29100.0678−0.0871−0.06370.09426
Fm0.30110.0068−0.0422−0.02050.09308
Fv0.3017−0.0156−0.0254−0.00460.091610
ABS/CSm0.30110.0068−0.0422−0.02050.09309
Tro/CSm0.3017−0.0156−0.0254−0.00460.091611
DIo/CSm0.29100.0678−0.0871−0.06370.09427
Specific leaf area0.0419−0.17430.4141−0.2195−0.001917
Specific leaf weight−0.15280.1154−0.30970.3106−0.027320
Table 6. Positive and negative ideal solutions of photosynthetic indexes of five new table grape varieties.
IndexesPositive Ideal Solution A+Negative Ideal Solution AIndexesPositive Ideal Solution A+Negative Ideal Solution A
Chlorophyll a0.4920.38ΦPo0.4570.443
Chlorophyll b0.6950.291ΦDo0.4650.409
Carotenoids0.5060.344ΦPSII0.5130.356
Chlorophyll a + b0.5630.353qp0.4820.364
Chlorophyll a/b0.5130.276YNO0.5230.349
Ci0.4990.341YNPQ0.5180.355
gs0.630.135Fo0.5080.357
Pn0.5210.237Fm0.4920.391
Tr0.5210.269Fv0.4870.397
WUE0.5030.397ABS/CSm0.4920.391
Specific leaf area0.4620.424Tro/CSm0.4870.397
Specific leaf weight0.4530.424DIo/CSm0.5080.357
Fv/Fm0.4570.443
Table 7. TOPSIS evaluation and calculation results of five newly introduced table grape varieties.
VarietiesPositive Ideal Solution Distance D+Negative Ideal Solution Distance DDegree of Relative Proximity CSorting Result
Ruidu Xiangyu0.7790.3890.3335
Ruidu Cuixia0.4340.7690.6392
Ruidu Zaohong0.530.6630.5563
Ruidu Wuheyi0.6240.4640.4264
Jing Hongbao0.3670.780.681
Disclaimer/Publisher’s Note: The statements, opinions and data contained in all publications are solely those of the individual author(s) and contributor(s) and not of MDPI and/or the editor(s). MDPI and/or the editor(s) disclaim responsibility for any injury to people or property resulting from any ideas, methods, instructions or products referred to in the content.

