Article

Morpho-Physiological Responses of Three Italian Olive Tree (Olea europaea L.) Cultivars to Drought Stress

1
Department of Life Sciences, University of Siena, Via Mattioli 4, 53100 Siena, Italy
2
Research Institute on Terrestrial Ecosystem (IRET), National Research Council (CNR), Via Madonna del Piano 10, 50019 Sesto Fiorentino, Italy
3
Centre for Functional Ecology, Department of Life Sciences, University of Coimbra, Calçada Martim de Freitas, 3000-456 Coimbra, Portugal
4
Institute for BioEconomy (IBE), National Research Council (CNR), Strada Provinciale Aurelia Vecchia 49, 58022 Follonica, Italy
*
Author to whom correspondence should be addressed.
Current Address: Department of Neurosciences, Biomedicine, and Movement Sciences, University of Verona, Piazzale Ludovico Antonio Scuro 10, 37124 Verona, Italy.
Horticulturae 2023, 9(7), 830; https://doi.org/10.3390/horticulturae9070830
Submission received: 9 June 2023 / Revised: 18 July 2023 / Accepted: 18 July 2023 / Published: 20 July 2023
(This article belongs to the Special Issue Horticulture Plants Stress Physiology)

Abstract

:
Water scarcity in agriculture can limit crop production and trigger the need for more effective water resource management. As a result, it is critical to identify new crop genotypes that are more drought tolerant and perform better under low irrigation or even rain-fed conditions. The olive tree is a high-value crop that is well adapted to dry Mediterranean conditions. However, different genotypes may have developed different mechanisms of tolerance to water stress. To investigate such mechanisms, we examined three Italian olive cultivars (‘Giarraffa’, ‘Leccino’, and ‘Maurino’) grown in a greenhouse under drought stress. We found that single genotypes responded differently to the drought, though not all parameters revealed significant differences. The first major difference among the cultivars was in transpiration: the lower stomatal density and stomatal conductance of ‘Giarraffa’ allow this cultivar to use water more conservatively. In parallel with the reduction in stomatal and mesophyll conductance, the drought-stressed group of ‘Giarraffa’ maintained the electron transport rate and effective efficiency levels of photosystem II similar to those of the control until the fourth week of stress. The fluorescence parameters revealed the earlier closure of reaction photosynthetic centres in ‘Leccino’. Finally, the higher rate of electrolyte leakage in ‘Maurino’ indicated a significant ions loss in this cultivar when it was subjected to the drought. Both water management under stress conditions and the effect of drought on photosynthesis make ‘Giarraffa’ interesting to researchers studying its use in breeding or water-saving programmes.

1. Introduction

Droughts have a negative impact on plant growth and productivity, as evapotranspiration exceeds the amount of water absorbed by the roots, leading to drought stress. A low soil moisture level and a high air vapor pressure deficit determine the intensity of the water deficit in leaf tissues [1]. Plants are constantly threatened by water stress due to natural climate change, but anthropogenic climate change will exacerbate water deficits for plants and crops [2]; the IPCC 2021 report indicates that climate warming is leading to an increased atmospheric evaporation demand and decreased soil moisture availability, which could lead to more frequent and severe droughts in semi-arid regions [3]. In light of this, the cultivation of crop plants will require more irrigation water to maintain the yield and productivity [4].
Droughts have a significant impact on plant traits, including biomass production, fruit yield, growth, and development. Photosynthesis is particularly sensitive to drought stress, as it reduces the rates of carbohydrate synthesis and accumulation [5]. Plants use a variety of defence mechanisms to cope with droughts, including the production of osmoprotectants, the synthesis of proteins, and changes in metabolic processes, hormone levels, and gene expression. To maintain cell turgor and reduce water loss, plants close their stomata [4], which results in a decrease in stomatal conductance (gs), in association with decreases in the leaf water potential (Ψ) and relative water content (RWC) [6,7]. Stomata closure immediately causes a reduction in the amount of CO2 in the substomatal cavity, which then slows the rate of photosynthesis: in most cases, photosynthesis is completely stopped due to stomatal closure before the metabolism is affected [8]. However, as RWC and gs severely decline during a drought, additional metabolic restrictions can take place [9]. For instance, Flexas and Medrano [10] found that the Ribulose-1,5-bisphosphate (RuBP) regeneration capacity decreases as the ATP production decreases. Furthermore, droughts can cause an impairment of the carboxylation capacity due to Ribulose-1,5-bisphosphate carboxylase/oxygenase (Rubisco) content reduction only at very low gs values (<0.01 mol H2O m−2 s−1) [8].
The increase in mesophyll diffusion resistance to CO2 has also gained recognition as a limitation to the photosynthetic process under stress conditions [8,11,12]; for example, under salt stress conditions, the changes in mesophyll conductance (gm) have been shown to be as rapid as those in gs [11]. When the rate of light absorption exceeds the capacity to photosynthesise, this results in irreversible photoinhibition [13]. In addition, a low transpiration rate caused by stomata closure under drought conditions leads to an increase in the leaf temperature, which may exacerbate photoinhibition [14]. As a result, the photosynthetic pigments may degrade, and the PSII efficiency may decline [6].
Olive trees (Olea europaea L.) are one of the oldest domesticated plants in the Mediterranean basin and are still extremely important in agriculture, economy, and culture [4]. According to the International Olive Council (IOC), the global olive oil production total for the 2021/22 crop year was 3.1 million tons. IOC member countries produced 2.9 million tons (93.9% of the global total). EU countries have suffered a significant reduction in production as a result of droughts and adverse weather [15]. Italy is one of Europe’s top producers of olive oil, with over a million hectares dedicated to olive cultivation [16]. Italy has over 500 cultivars of olive trees registered in the National Olive Oil register, making it a country rich in olive biodiversity. However, the number is likely to rise as analyses (mostly genetic) continue. These cultivars differ morphologically, as well as in terms of the yield and quality of the oil they produce. ‘Frantoio’, ‘Leccino’, ‘Taggiasca’, and ‘Coratina’ are among the most common and well-known cultivars, but many others characterise various Italian regions. This biodiversity contributes to Italian oil being a unique product that is valued around the world [17,18,19]. Olive trees require specific environmental conditions in order to grow and produce. These include hot, dry summers, and mild, but cool winters, with ideal annual temperatures of 15–25 °C. High temperatures can harm flowering and fruiting. Olive trees require sunlight to grow a healthy canopy and produce oil. Although olive trees are drought-tolerant, they require adequate irrigation during critical periods, such as flower differentiation, fruit setting, and fruit swelling. Olive plants can grow in a variety of soil types so long as the soil is well drained and there is no standing water. The coastal and hilly areas of central and southern Italy (Puglia, Calabria, Sicily, Tuscany, Umbria, and Lazio) are the best for olive cultivation. The olive tree is the model woody plant used for the study of drought responses and tolerance [20], and it has been studied under a range of environmental stress conditions, such as UV-B [21] and salt stress [22].
Specifically, several traits have been described as critical for drought tolerance, such as a small stomata, waxy leaf surface, narrow xylem vessels, non-photochemical quenching activation, and rapid osmotic adjustment [4,20,23]. Nevertheless, irrigation practices have spread throughout Europe due to the correlation between crop productivity and increased water availability [24]. Although olive trees are generally considered to be drought-tolerant, only a few studies have investigated the differences in the physiological responses of olive cultivars to limited water availability. However, the large number of olive cultivars currently listed in world repositories strongly supports the presence of significant differences in physiological responses to droughts [7,25,26]. These are related to the specific environment in which cultivars are grown and adapted, emphasizing the importance of studying the diversity of olive plants and promoting the more thorough characterization of various stress tolerance mechanisms [27,28,29]. The comparison of various cultivars will allow the identification of both the basic, ubiquitous plant tolerance mechanisms and the potential interactions between diverse mechanisms for drought tolerance, as well as identify potential strategies for improving olive tree growth and productivity in water-stressed environments.
We investigated three different olive cultivars grown in Italy, among the many catalogued in the Italian National Registry, to perform thorough analysis. The cultivar Giarraffa, native to the arid region of Sicily, is tolerant to drought as well as to UV light [21]. The cultivar, Leccino, is more diffused worldwide and shows good tolerance to drought, cold, and bacteria (Xylella fastidiosa) [30]. The cultivar, Maurino, which is autochthonous in Tuscany and cold-tolerant, showed a peculiar morphological trait (wilting of leaves) when it was exposed to dry conditions (Claudio Cantini, personal communication). Based on a GBS-derived SNP catalogue of 94 Italian cultivars, it was proposed that ‘Maurino’ and ‘Leccino’ are members of a cluster population descended from local oleasters. ‘Giarraffa’, on the other hand, is clearly distinct from other Italian cultivars and was most likely introduced from Spain and Morocco [31]. Our hypothesis was that the three cultivars would respond differently to drought due to their long-term adaptation to different environments. To test this hypothesis, fully drought-stressed plants were evaluated for physiological, morphological, and biochemical parameters, as well as their soil water content. This study aimed to assess and distinguish the drought tolerance of three Italian olive cultivars by understanding how changes in water distribution and management could affect their physiological responses. The comparison of various cultivars will allow the identification of both the basic, ubiquitous plant tolerance mechanisms and the potential interactions between diverse mechanisms of drought tolerance. Furthermore, comparing different olive cultivars can provide useful data on the most effective drought response. As a result, we sought to investigate the mechanisms by which different olive cultivars tolerate or adapt to drought stress, as well as identify major parameters to be used to classify the olive tree drought response within germplasm collections. The findings will be useful in understanding the resilience of olive trees to droughts and developing smart management strategies for olive production in the face of climate change and water scarcity.

2. Materials and Methods

2.1. Plant Growth Conditions and Drought Stress Treatment

Certified, 18-month-old olive trees (Olea europaea L., cultivars Leccino, Maurino, and Giarraffa) were provided by “Spoolivi” (Società Pesciatina di Orticoltura, Pescia, PT, Italy). The plants were grown in 4 L pots with a substrate of 50% peat and 50% pumice [32]. Upon arrival at the university laboratories, the plants were transferred to a growth chamber in which illumination was provided by LEDs for flowering and growth (TLED secret Jardin—SRL AGOMOON, Manage, Belgium). The photoperiod was 12 h of light and 12 h of dark. After one week of adaptation to the general environmental conditions with steady watering, 20 plants of each cultivar were split in two 10-plant groups to be used as a control (CTRL) or to be subjected to drought stress (DS). The CTRL groups were fully irrigated (500 mL of water per week), while the DS groups were totally deprived of water for 4 weeks. The experimental period consisted of an increasing water deficit divided into 5 time points: t0, t1, t2, t3, and t4, corresponding to the onset of the withholding irrigation and the first, second, third, and fourth weeks of irrigation deprivation, respectively. The pots inside the chamber were rotated every week to avoid any positional effects [29]. Temperature and humidity were recorded hourly with the EBI 20-th1 datalogger (Ebro): the temperature was 27.5 °C, and the humidity was 51.1% (in both cases, the data are averaged throughout the day and night). The minimum and the maximum values reached by temperature were 22.3 °C and 31.8 °C, respectively; 29.8% and 70.1% were the minimum and the maximum values of recorded humidity, respectively.

2.2. Soil Water Content

The soil water content (SWC) was evaluated according to Bilskie [33]. Four soil samples were collected for each group and immediately weighed to obtain the wet mass (mwet). Then, samples were put in the oven for 24 h at 105 °C, and then weighed again (mdry). Finally, soil water content was calculated as:
SWC = (mwet − mdry)/mdry

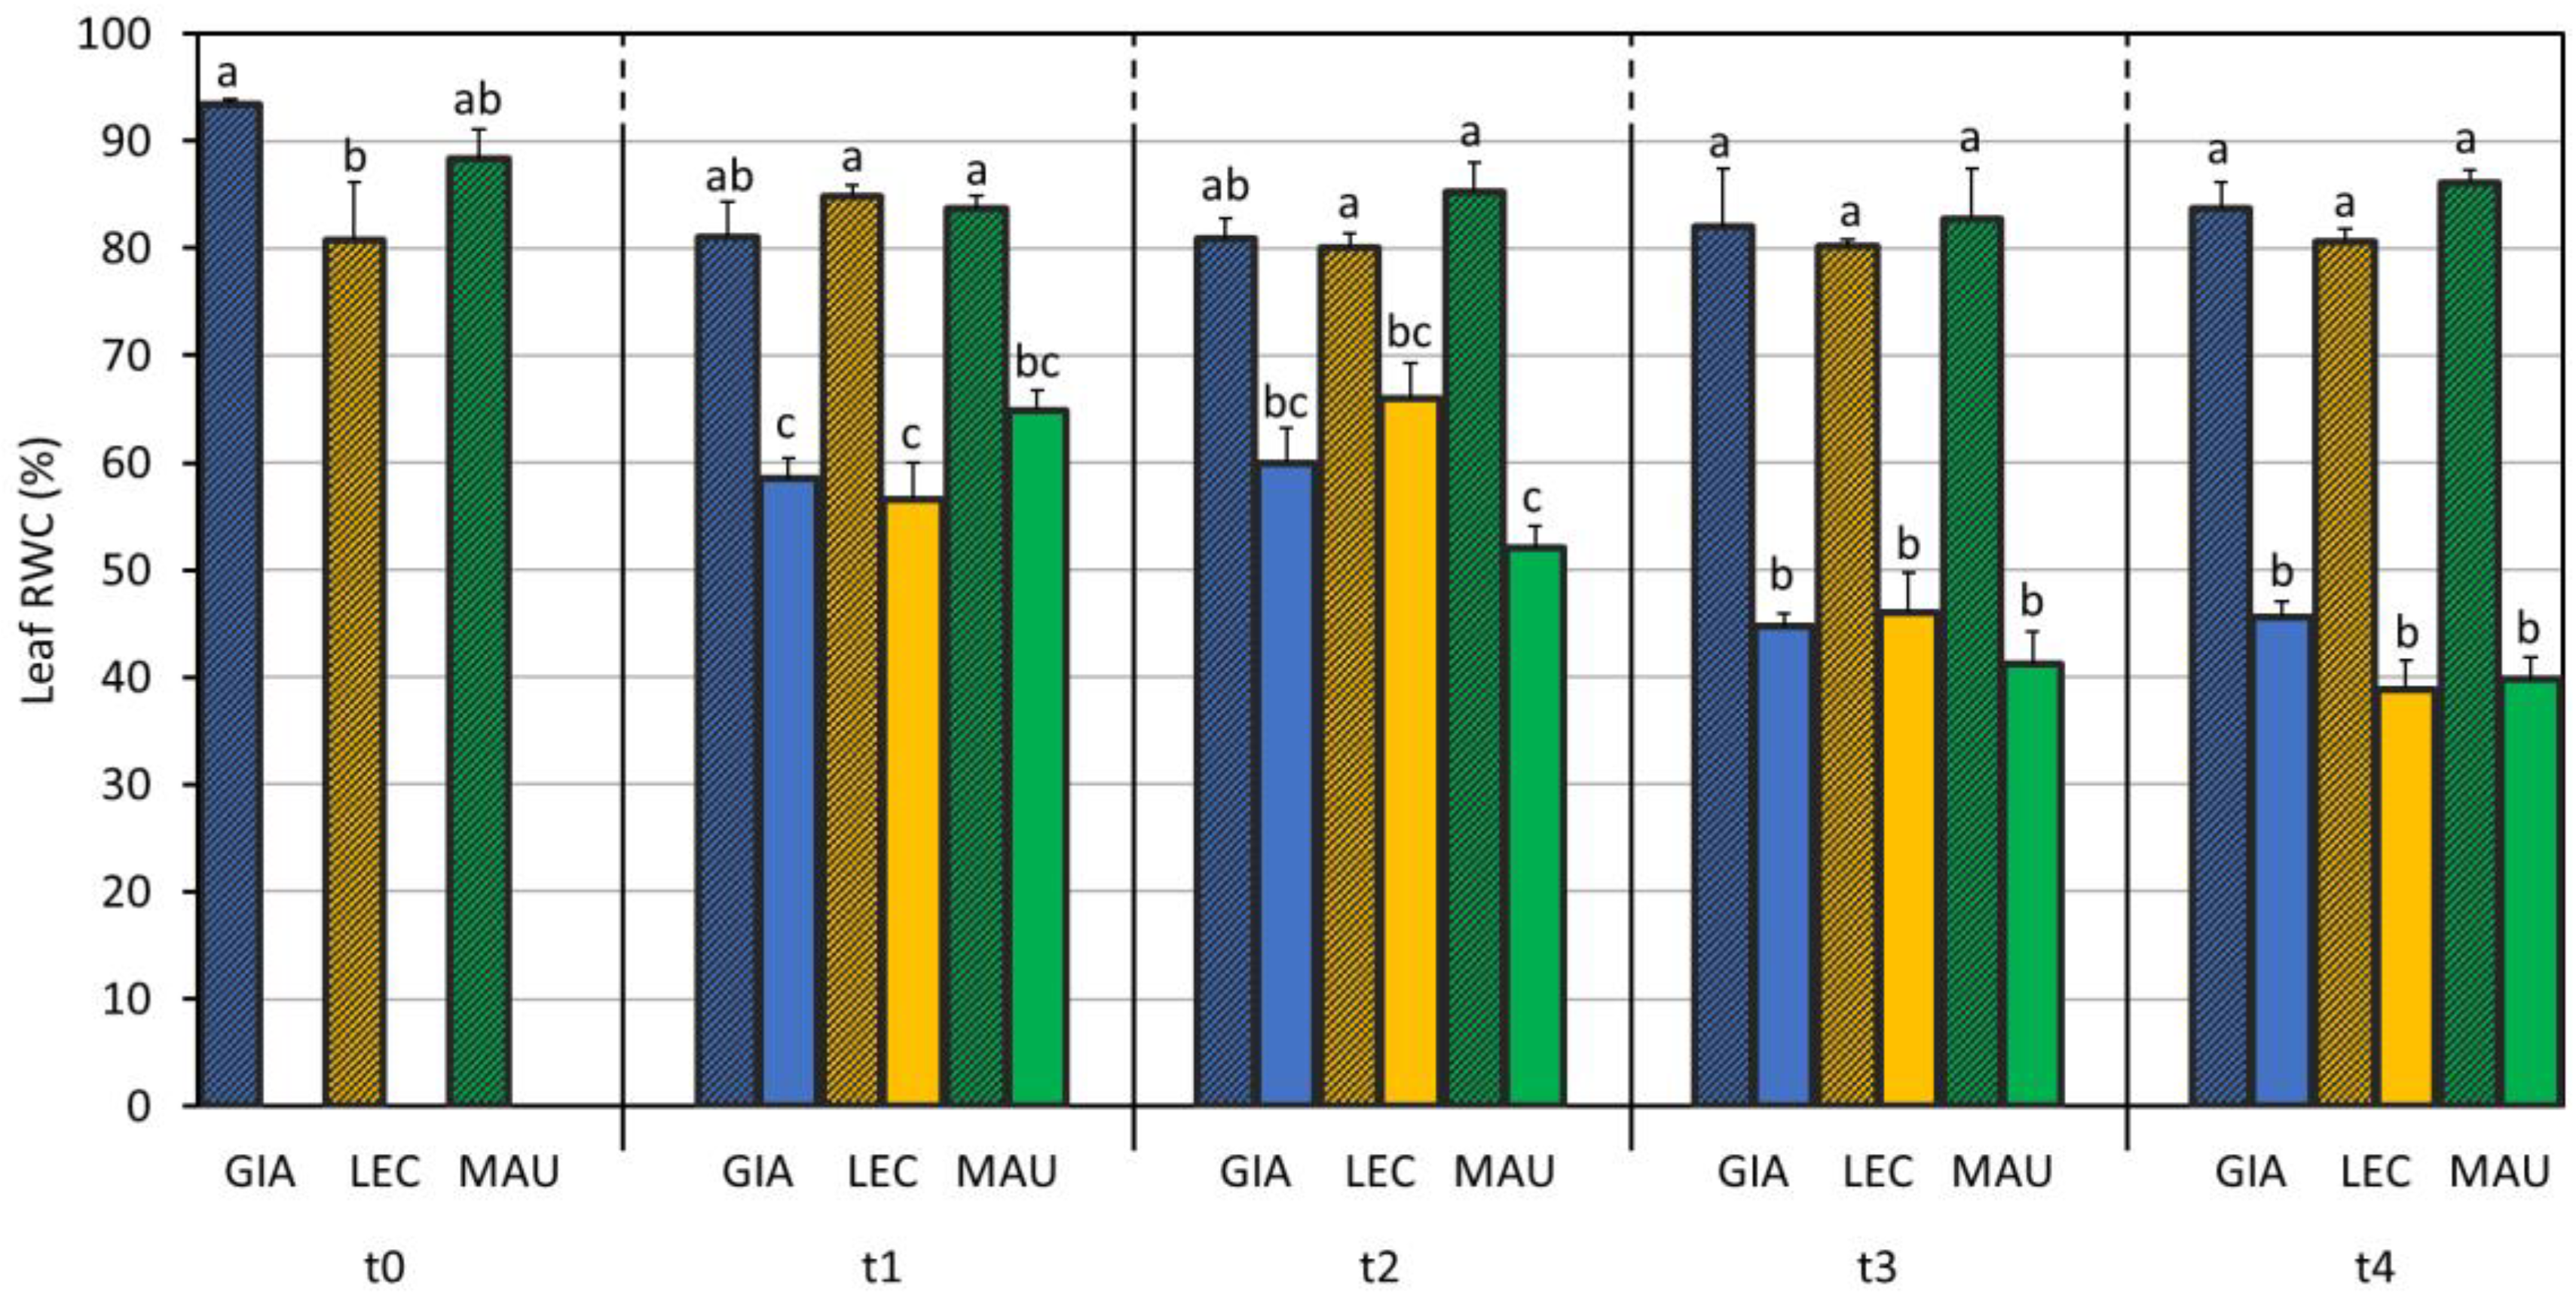
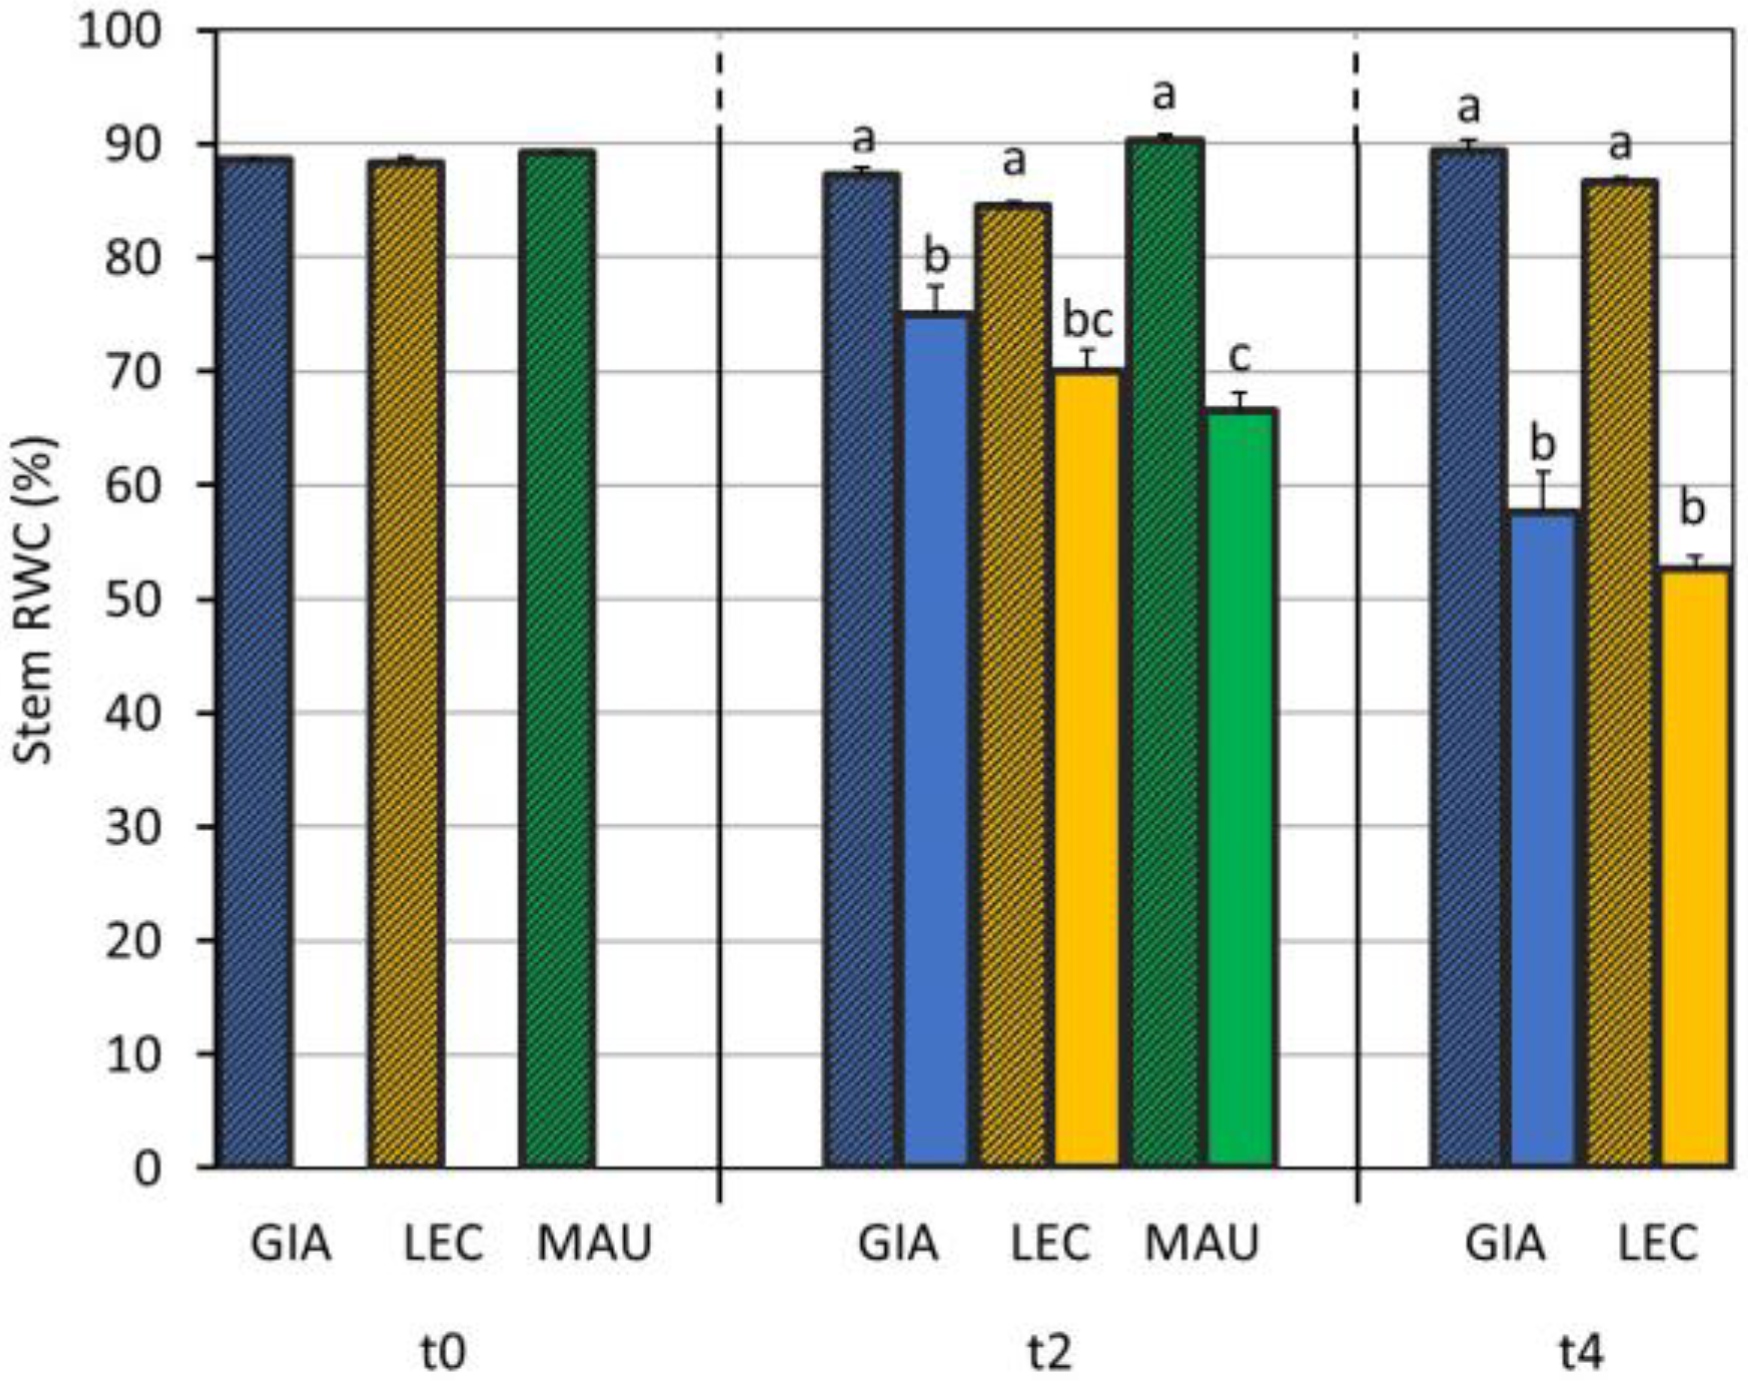
2.3. Relative Water Content of Leaves and Stems

The relative water contents of leaves (leaf RWC) and stems (stem RWC) were calculated as described by El Yamani et al. [6]. Fully expanded and mature leaves at each time point were cut below the petiole and immediately placed in pre-weighed plastic tubes. The leaves were weighed along with the tubes to obtain the fresh weight (FW). Stems were harvested only at t0, t2, and t4. For both the leaves and stems, tubes were filled with distilled water, and samples were incubated for 24 h at 4 °C in the dark. Afterwards, the leaves and stems were removed from the tubes and dried with paper towels to absorb excess water. The samples were weighed to determine the turgid weight (TW). Finally, the samples were placed in paper bags and heated in an oven at 80 °C for 48 h. The samples were weighed to determine the dry weight (DW). The RWC of leaves and stems was calculated as:
RWC (%) = (FW − DW)/(TW − DW) × 100

2.4. Stomatal Density

Stomatal density was measured according to Xu et al. [34]. Briefly, 5 mature leaves per group were selected at t0, t2, and t4. The abaxial epidermis of the leaf was coated with clear nail polish. Once dried, the film was peeled off the leaf and placed on a slide over a drop of water. The samples were examined with the Zeiss Axiophot light microscope (Oberkochen, Germany). Six images were taken for each leaf sample (thus, there was a total of 30 images per group). The images were analysed with ImageJ. The stomatal density was then calculated as the number of stomata per leaf area.

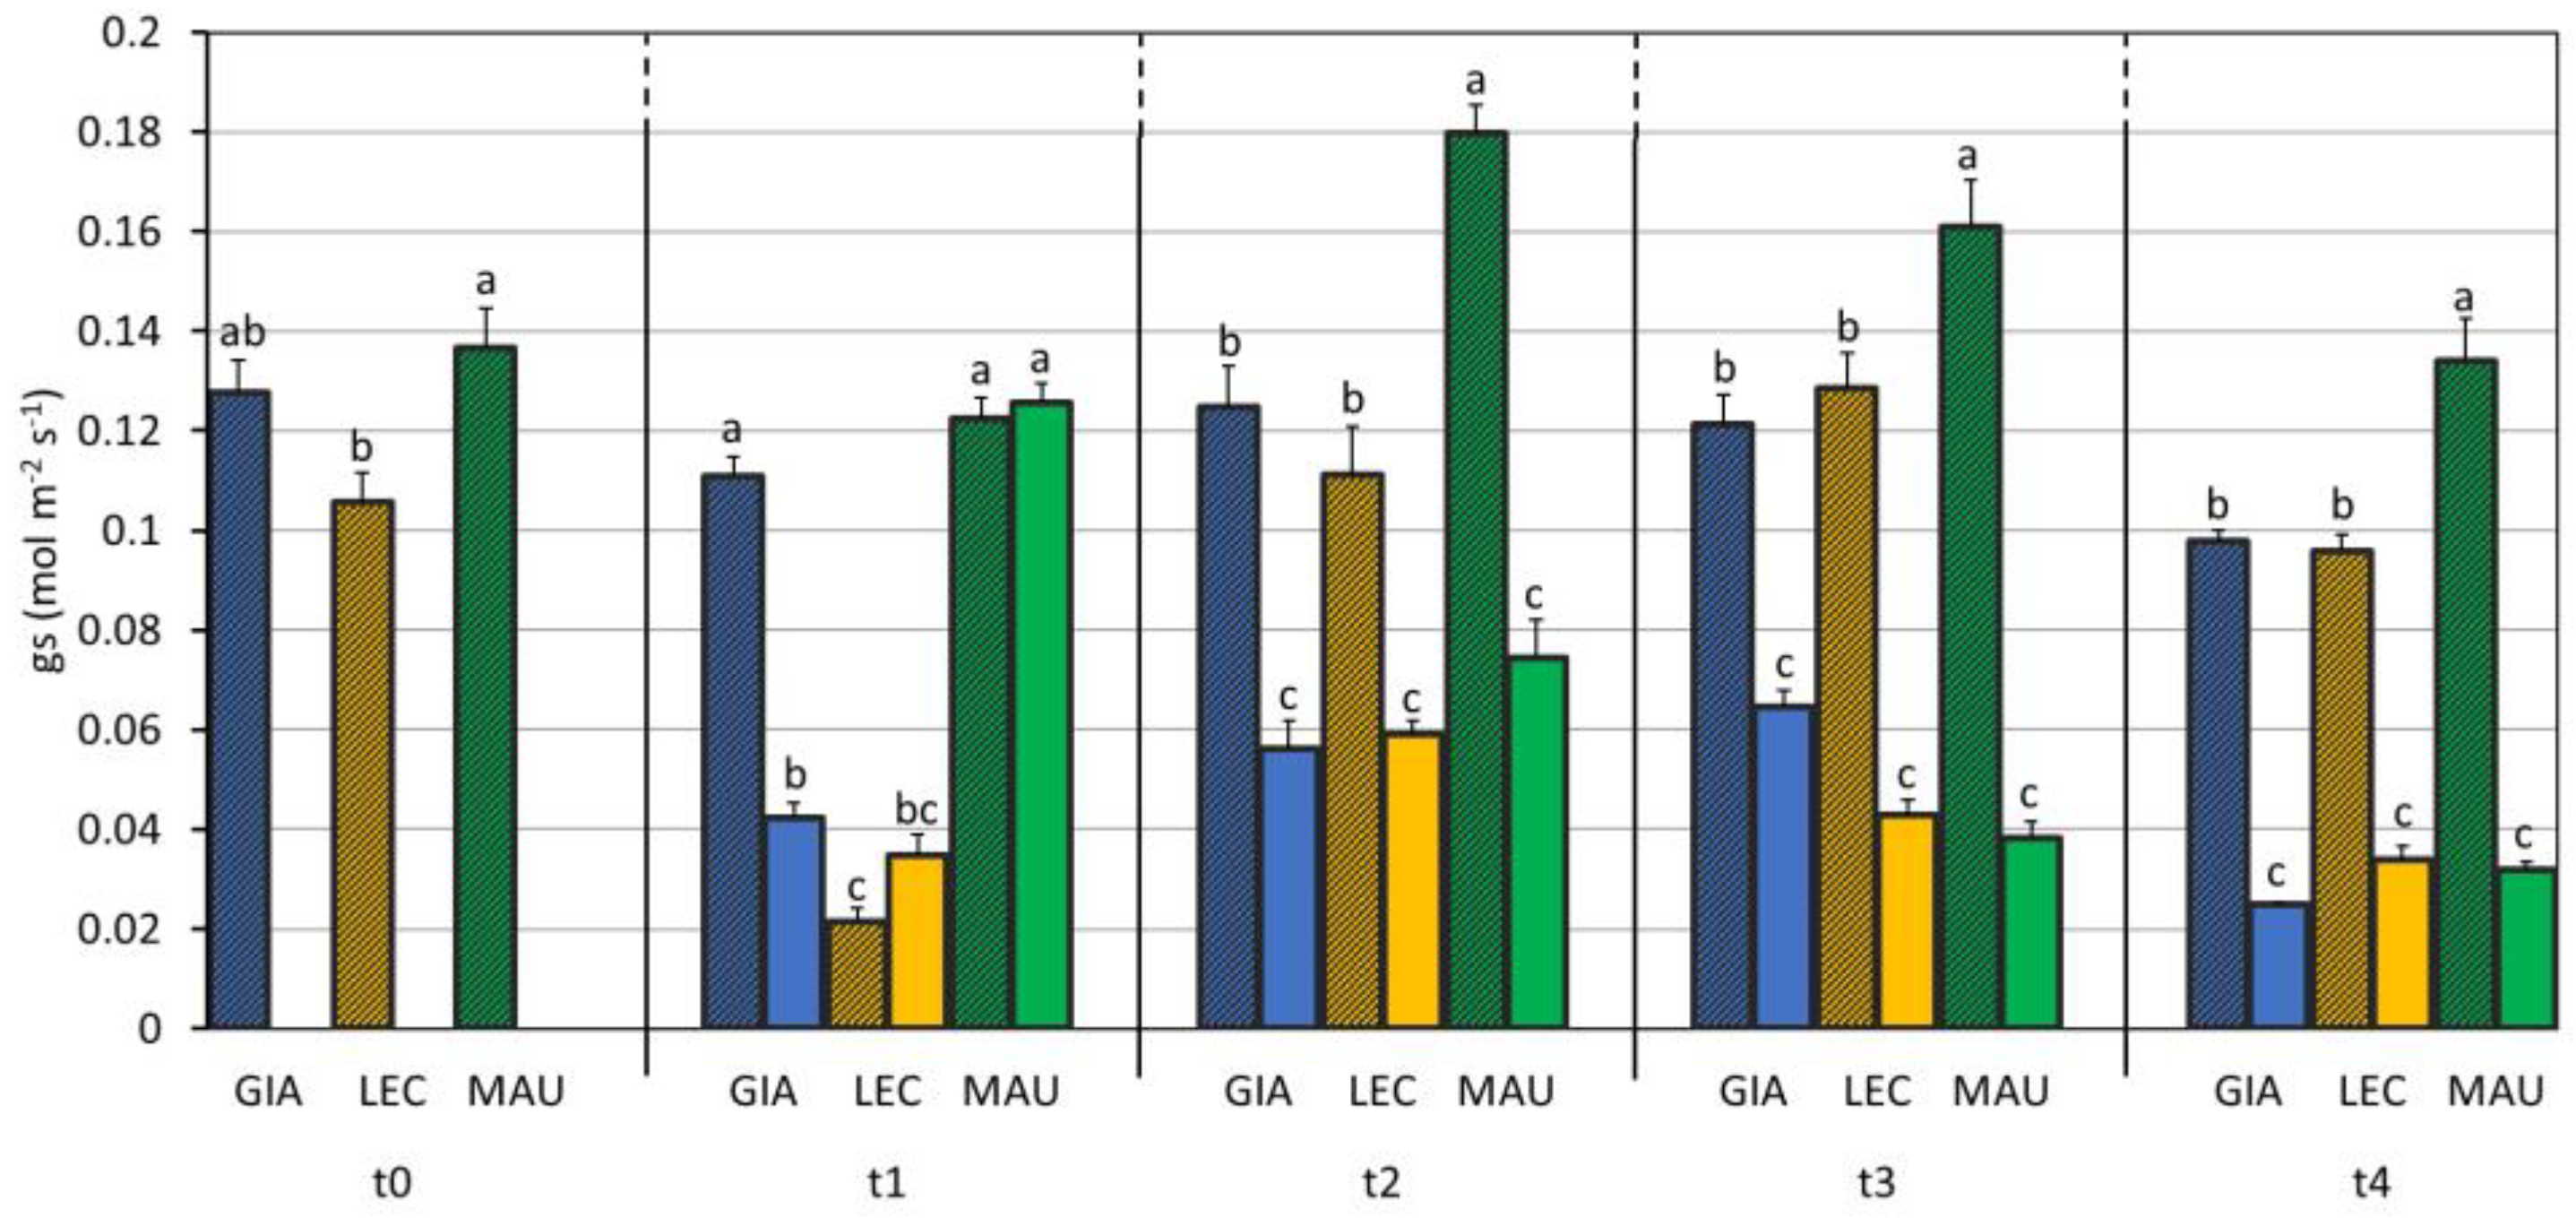
2.5. Leaf Gas Exchange and Chlorophyll Fluorescence

The LiCor-6800 instrument (LICOR, Lincoln, NB, USA) equipped with a leaf chamber fluorometer was used to assess gas exchange and chlorophyll fluorescence. The light-saturated net photosynthetic rate (A) and gs were recorded throughout the experiment (t0 to t4). During the gas exchange measurements, the following conditions were set: photosynthetic active radiation (PAR) at 1600 µmol m−2 s−1 [35,36], CO2 at 400 ppm, block temperature at 28 °C, and relative humidity at 60% inside a leaf cuvette. In addition, CO2 assimilation rate curves against the intercellular CO2 concentration (i.e., A/Ci curves) were obtained at t2 by using the following 12 CO2 concentration steps: 400, 200, 50, 100, 300, 400, 600, 800, 1000, 1200, 1400, an d1600 ppm. A-Ci curves data were studied using the approach described by Ethier and Livingston [37] to obtain the maximum carboxylation efficiency (Vcmax) and maximum rate of electron transport (Jmax). A/Ci and A/Cc curves are provided in the Supplementary Material (Figure S1). This assumes that gm was constant throughout the CO2 range. Vcmax and Jmax values were standardised at 25 °C using a temperature dependency of those parameters [38]. Michaelis–Menten constants for CO2 (Kc) and O2 (Ko) were derived according to the approach by Bernacchi et al. [38]. To calculate the gm values, the variable J method was applied for calculating the A/Cc curves, as the use of an independent methodology should be preferable for preventing the propagation of errors or assumptions [39]. The variable J method was applied to calculate gm [40] based on the point measurement of A at 400 ppm of Ca with fluorescence measurements:
gm = A/(Ci − Γ* [ETR + 8 (A + Rd)]/[ETR − 4 (A + Rd)])
where: Rd is daytime respiration, which was obtained from the previous study on olive leaves (1.39 µmol m−2 s−1 [41]), Γ* is the CO2 compensation point to photorespiration, which was calculated using the Rubisco specificity factor estimated for evergreen woody species [42]. The fluorescence of chlorophyll was evaluated throughout the experiment (t0 to t4) using the same apparatus with the activated fluorometer (rectangular flash with a red target of 8000 μmol m−2 s−1, a duration of 1000 ms, and an output rate of 100 Hz [43]). Light-adapted leaves were used to obtain the effective efficiency of PSII (ΦPSII) and the electron transport rate (ETR) according to Gilbert et al. [44]. The concentration of CO2 at the chloroplast envelope (Cc) was estimated using the gm value.
Cc = Ci − A/gm
Relative photosynthetic limitations were calculated according to Grassi and Magnani [45] as follows:
Ls = (gtot/[gs/1.6] δA/δCc)/(gtot + δA/δCc)
Lm = (gtot/gm δA/δCc)/(gtot + δA/δCc)
Lb = gtot/(gtot + δA/δCc)
where Ls, Lm, and Lb are the relative limitations of stomatal diffusion, mesophyll diffusion, and biochemical limitation, respectively. gtot is the total CO2 conductance (gtot = [(gs/1.6) gm]/[(gs/1.6) + gm]), 1.6 is the ratio of the diffusion coefficients for water vapor to CO2, and δA/δCc indicates an initial slope of A/Cc curves that was estimated using a range of 0–150 µmol m−2 s−1 of Cc. In addition, the maximum quantum yield of PSII (Fv/Fm) was evaluated for dark-adapted leaves covered with aluminium foil for at least 20 min. One fully expanded leaf per five to six plants per treatment were used for each gas exchange and fluorescence parameter.

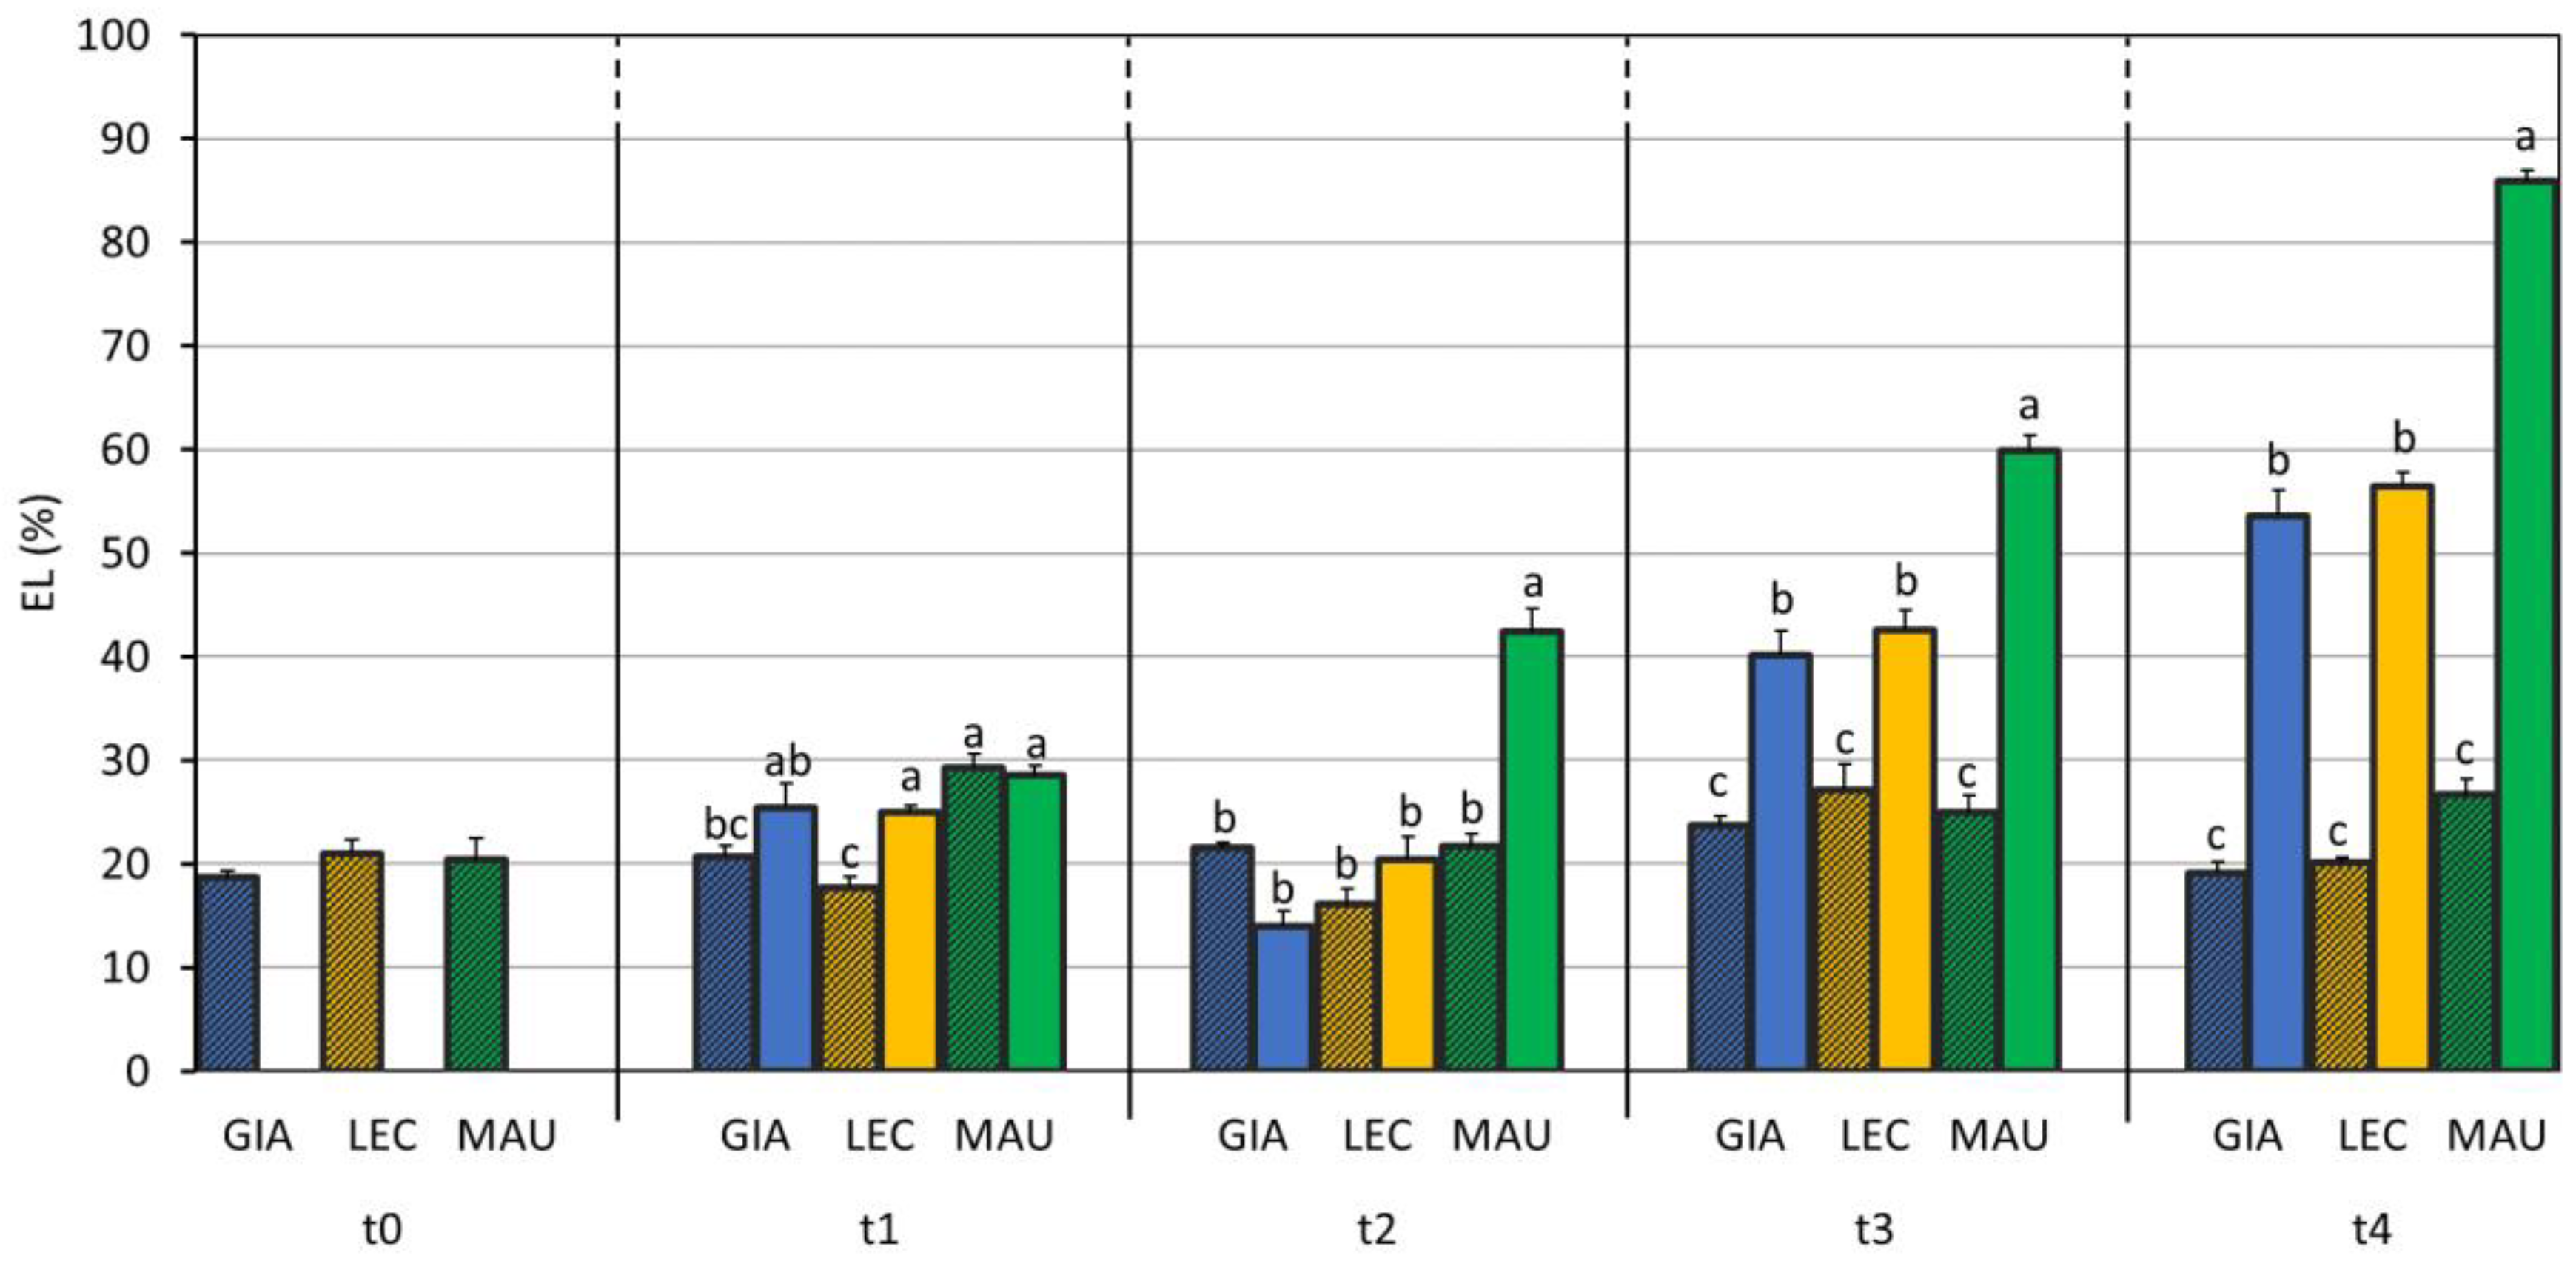
2.6. Electrolyte Leakage

The cell membrane permeability to solutes was assessed by measuring the electrolyte leakage (EL) according to ben Abdallah et al. [46]. Two leaf discs with a 0.5 cm diameter were cut from a fresh leaf and placed inside capped tubes filled with 10 mL deionised water. The samples were incubated for 3 h at 37 °C. Immediately after incubation, the conductivity of the solution was measured to obtain the electrical conductivity E1 value. Then, the samples were heated at 95 °C for 30 min before measuring the conductivity again (E2). The EL was calculated as:
EL = E1/E2 × 100

2.7. Malondialdehyde Content

Malondialdehyde (MDA) content was used to quantify lipid peroxidation in the leaves. Frozen leaves (0.1 g) were ground with 1.5 mL of 0.1% (w/v) trichloroacetic acid (TCA). The samples were centrifuged at 10,000× g for 10 min at 4 °C. Then, 0.25 mL of supernatant was mixed with 1 mL of 20% (w/v) TCA containing 0.5% (w/v) thiobarbituric acid for the positive control; the same supernatant was mixed with 1 mL of 20% (w/v) TCA alone for the negative control. The samples were incubated for 30 min at 95 °C; then, the extracts were immediately cooled on ice and centrifuged (10,000× g for 10 min at 4 °C). Supernatants from positive and negative controls were read at 600, 532, and 400 nm using a microplate reader, EnSpire (PerkinElmer, Waltham, MA, USA). MDA equivalents were calculated according to Hodges et al. [47], and then normalised to dry weight.

2.8. Pigments Quantification

Chlorophyll a, chlorophyll b, and carotenoids were extracted from pure acetone and quantified spectrophotometrically according to Lichtenthaler [48]. Briefly, 1.5 mL of cold 100% acetone was added to ground frozen leaves (500 mg). After 2 to 3 min of agitation, the samples were centrifuged (15,000× g for 15 min at 4 °C) and the supernatants were collected in a new tube. The pellets were extracted again twice. The pool of extracts was then read at 662, 645, and 470 nm with a Shimadzu UV-1280 spectrophotometer. The pigment content was then normalised to dry weight.

2.9. Statistical Analysis

Each analysis included at least five biological replicates (n = 5). For all the parameters recorded at different time points, the effects of the drought treatment (S), cultivar (C), and their interaction (C × S) were evaluated using 2-way Repeated ANOVA. For the MDA content, gm, Ls, Lm, Lb, Vcmax, and Jmax, which were measured only at t2, the effects of the treatment (S), cultivar (S), and their interaction (C × S) were analysed by using 2-way ANOVA. At each time point, post hoc analysis was performed using Tukey HSD test. ANOVA and post hoc tests were performed using the Systat 11 statistical package (Systat Software Inc., Richmond, CA, USA). At each time point, the bar graphs show the mean and the standard error of the recorded parameters and significant differences according to the post hoc test (p < 0.01). In the pie chart, the percentages shown are the averages of five values calculated independently for each limitation (Ls, Lm, and Lb). Eight parameters were taken into account to create the correlogram. First, each parameter was expressed as the ratio of the DS group value to the CTRL group value at each time point. Then, Rstudio (ver. 4.2.2, R core team, Vienna, Austria, 2022) was used for correlation according to the time course.

3. Results

3.1. Drought Effects on Plant Water Status and Biochemical Responses

The results are organised as follows in this first section. Table 1 shows the variability of nine physiological parameters as well as the significance of two factors (cultivar and treatment) and their mutual interaction as determined in the ANOVA tests. In addition, only the data where the interaction between cultivar and treatment (C × S) was significant are fully described.
The first parameter we monitored was the soil water content (SWC), which was found to be strongly affected by the DS treatments. ‘Giarraffa’ exhibited a higher value of SWC (89% compared to 76% of the other cultivars). However, the significance of the interaction (C × S) was not relevant, meaning that the SWC was not affected by the cultivar growing in the soil, but only by treatment. A graph containing SWC data is available in the Supplementary Material (Figure S2).
Drought stress also had a significant effect (p-value < 0.001) on the leaf RWC data, but in this case, the cultivar and the interaction C × S were also significant (Table 1). As shown in Figure 1, the drought-stressed groups of ‘Giarraffa’ and ‘Leccino’ retained less water than ‘Maurino’ DS did after the first week of stress. While the difference between the control and stressed groups was significant for all cultivars at t1, ‘Giarraffa’ DS did not differ from its respective control one week later.
Table 1 shows that, considering both the CTRL and DS groups, the ‘Giarraffa’ stem contains more water than the cultivar Leccino does (69.2% and 66.7%, respectively). The higher value recorded in the cultivar Maurino is probably due to the lack of samples at t4. Drought stress reduced stem RWC, resulting in a reduction to 64.4% in the stressed samples compared to 88.0% in the controls. Figure 2 shows that all cultivars lost stem water as the study progressed, with ‘Maurino’ DS having a lower and significantly different stem RWC value than that of ‘Giarraffa’ DS at t2. The stems stored more water than the leaves did as the stress worsened, with from 10% more water at t0 up to 20% at t4.
Stomatal density (SD) affects the rate of exchange between plants and the external environment; since the sampled, mature, fully expanded leaves had developed before the experiment, the drought treatment had no effects on this parameter (Table 1). However, the cultivar (C) had a significant impact on it, with the average numbers of stomata per mm2 being 34.4 for ‘Giarraffa’, 38.4 for ‘Leccino’, and 48.4 for ‘Maurino’.
The stomatal conductance, i.e., the water vapour flux through a leaf sample, showed a significant difference for each factor considered (C, S, and C × S) (Table 1). The cultivar Maurino showed the highest values of gs (0.112 mol m−2 s−1), and it had a higher gs even when comparing only the control groups of the cultivars, as shown in Figure 3. The drought stress had a strong effect (p-value < 0.001), and all the stressed groups had lower and significantly different gs value compared to that of the controls from t2, but ‘Giarraffa’ DS already differed from the respective control at t1. The lowest value of gs was reached by all stressed groups of the cultivars at t4.
Electrolyte leakage (EL) is the loss of electrolytes from cells or tissues and can be caused by a variety of factors, including physical injuries and diseases. This parameter was found to be strongly affected by the factors, C and S, and their interaction (Table 1). As shown in Figure 4, the rate of EL increased progressively and significantly from t1 to t4, and the stress condition resulted in a two-fold increase in the value in the stressed samples (41.2%) compared to that of the control samples (21.9%). ‘Maurino’ was the cultivar that was most strongly affected, already showing a consistent increase in the EL value at t2. After an additional week of stress (t3), the ‘Giarraffa’ DS (40.2%) and ‘Leccino’ DS (42.6%) groups differed significantly compared to their respective controls. At t4, the stressed group of each cultivar scored the highest EL value.
The malondialdehyde (MDA) content is proportional to the intensity of lipid peroxidation and was analysed only at t2 for the sole purpose of saving the leaf samples. The cultivar, Leccino, showed the lowest MDA content, followed by ‘Giarraffa’ (5.28 mmol kg−1 dw) and ‘Maurino’ (7.26 mmol kg−1 dw). The drought-stressed samples exhibited a slightly higher value than the control samples did, but no statistical difference was observed regarding the C × S interaction. MDA data are not shown, but are available in the Supplementary Material (Figure S3). Table 1 also shows the content of major photosynthetic pigments. Carotenoids (Car) and chlorophylls a + b (Chl a + b) were unaffected by the variables considered and remained constant throughout the experiment (Supplementary Material, Figures S4 and S5).

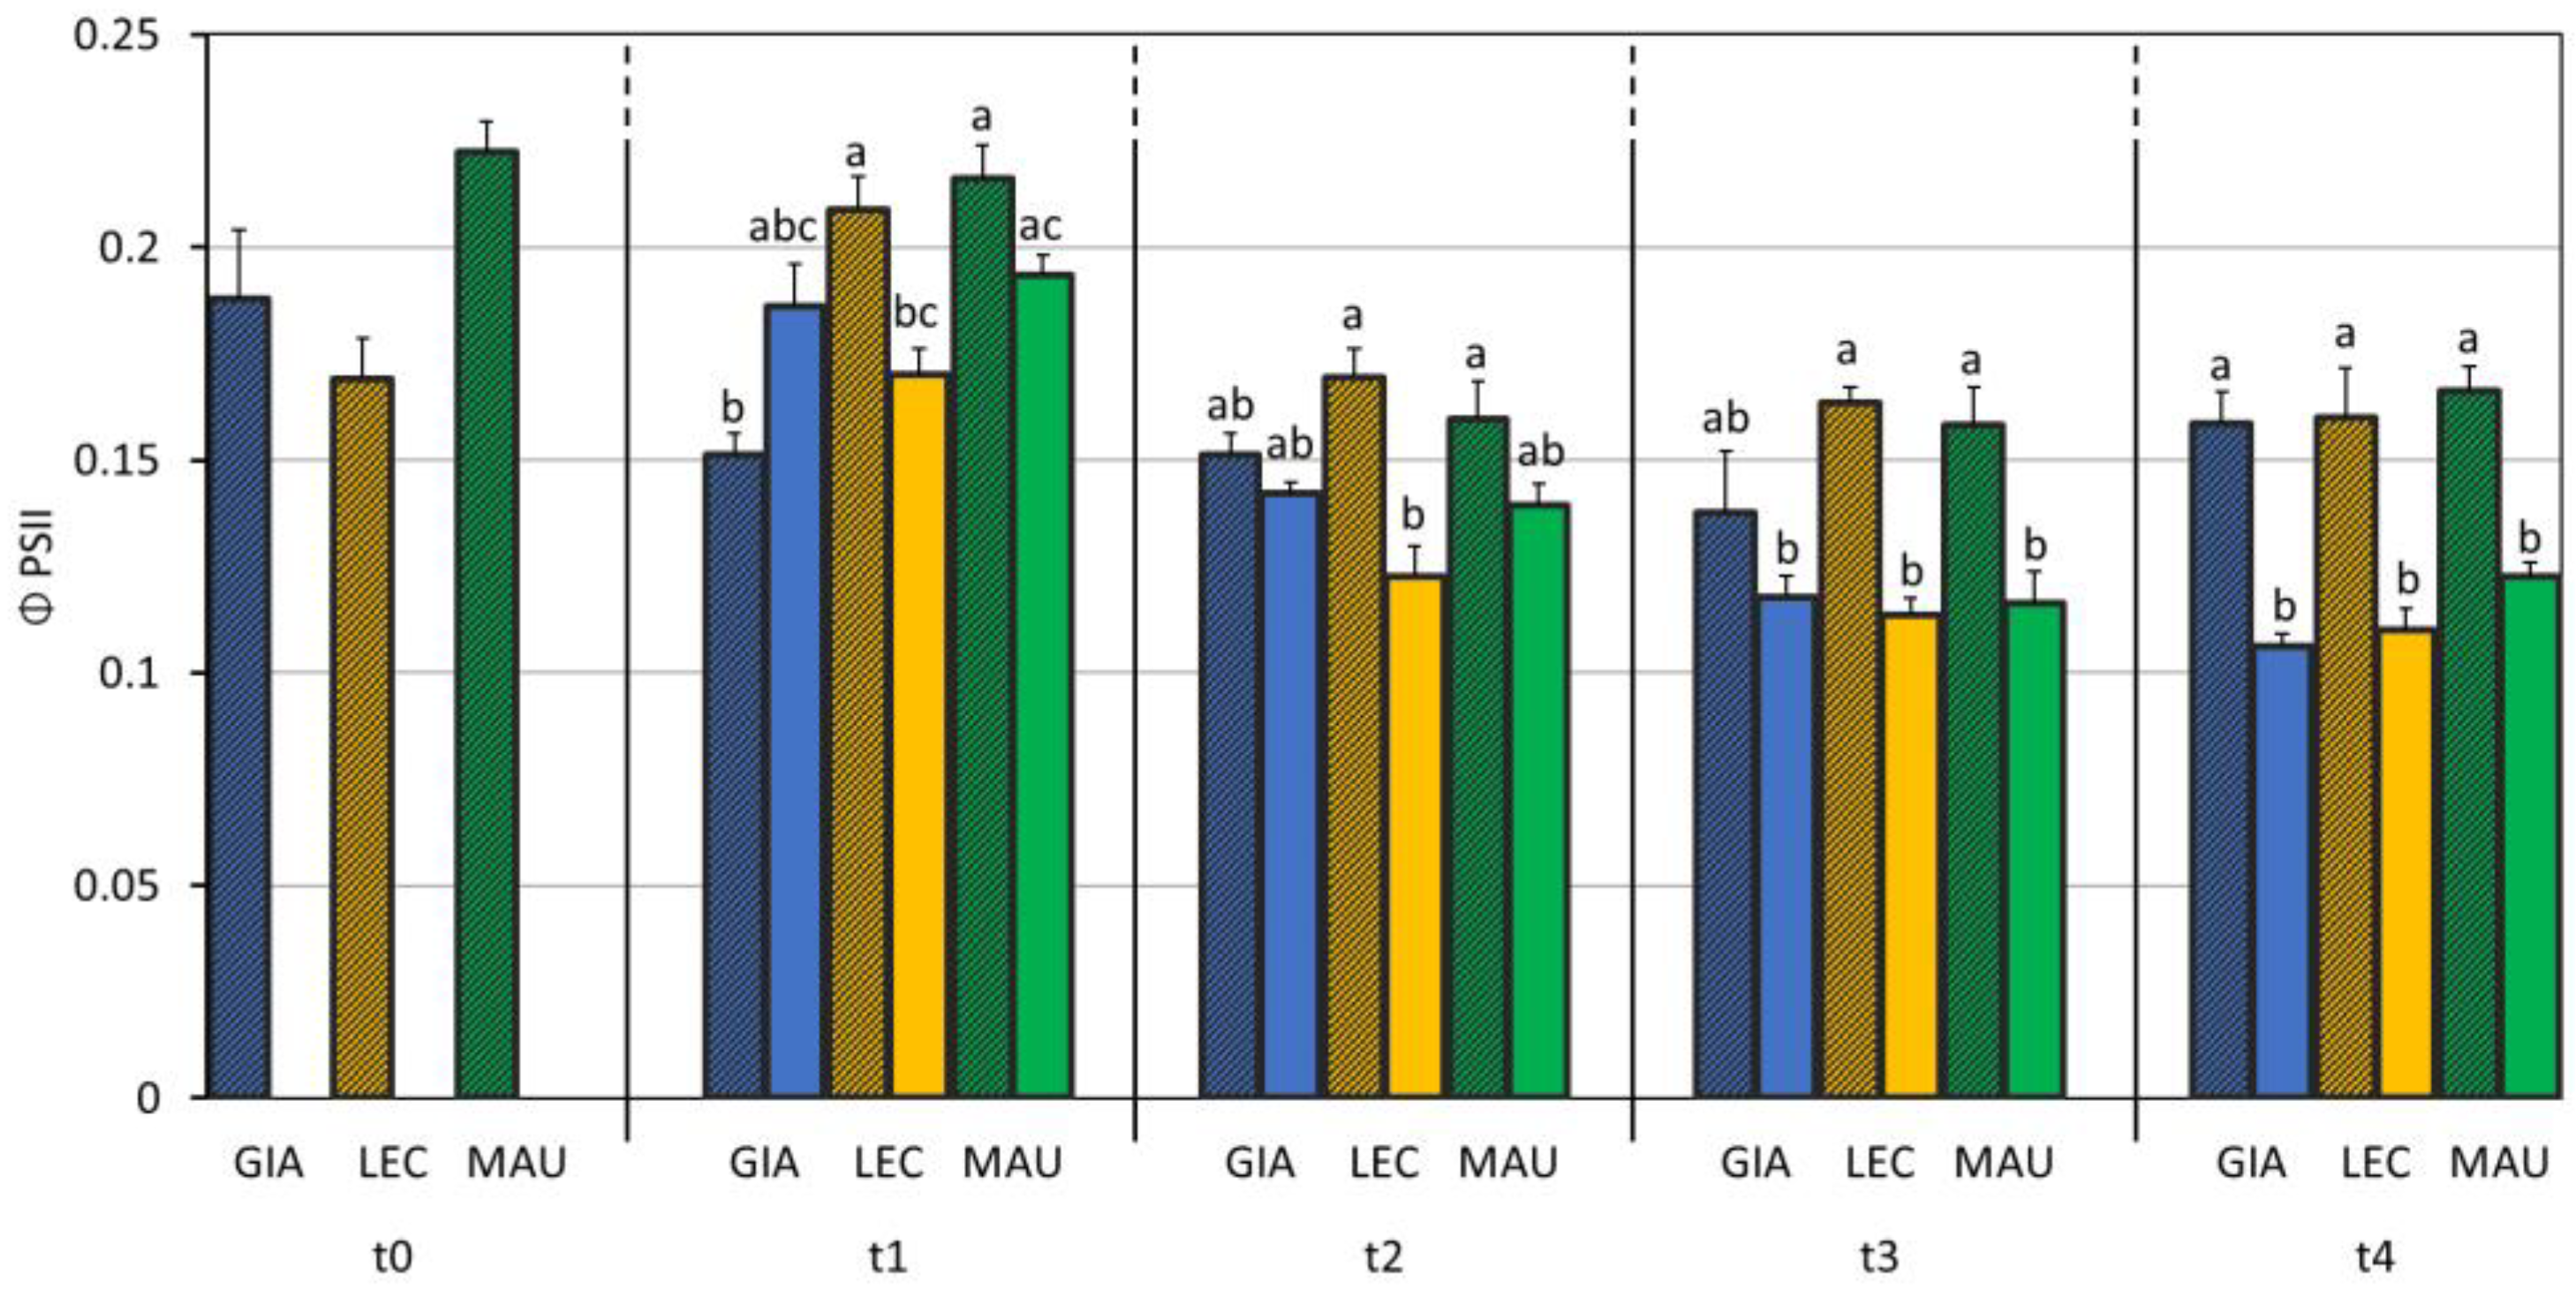
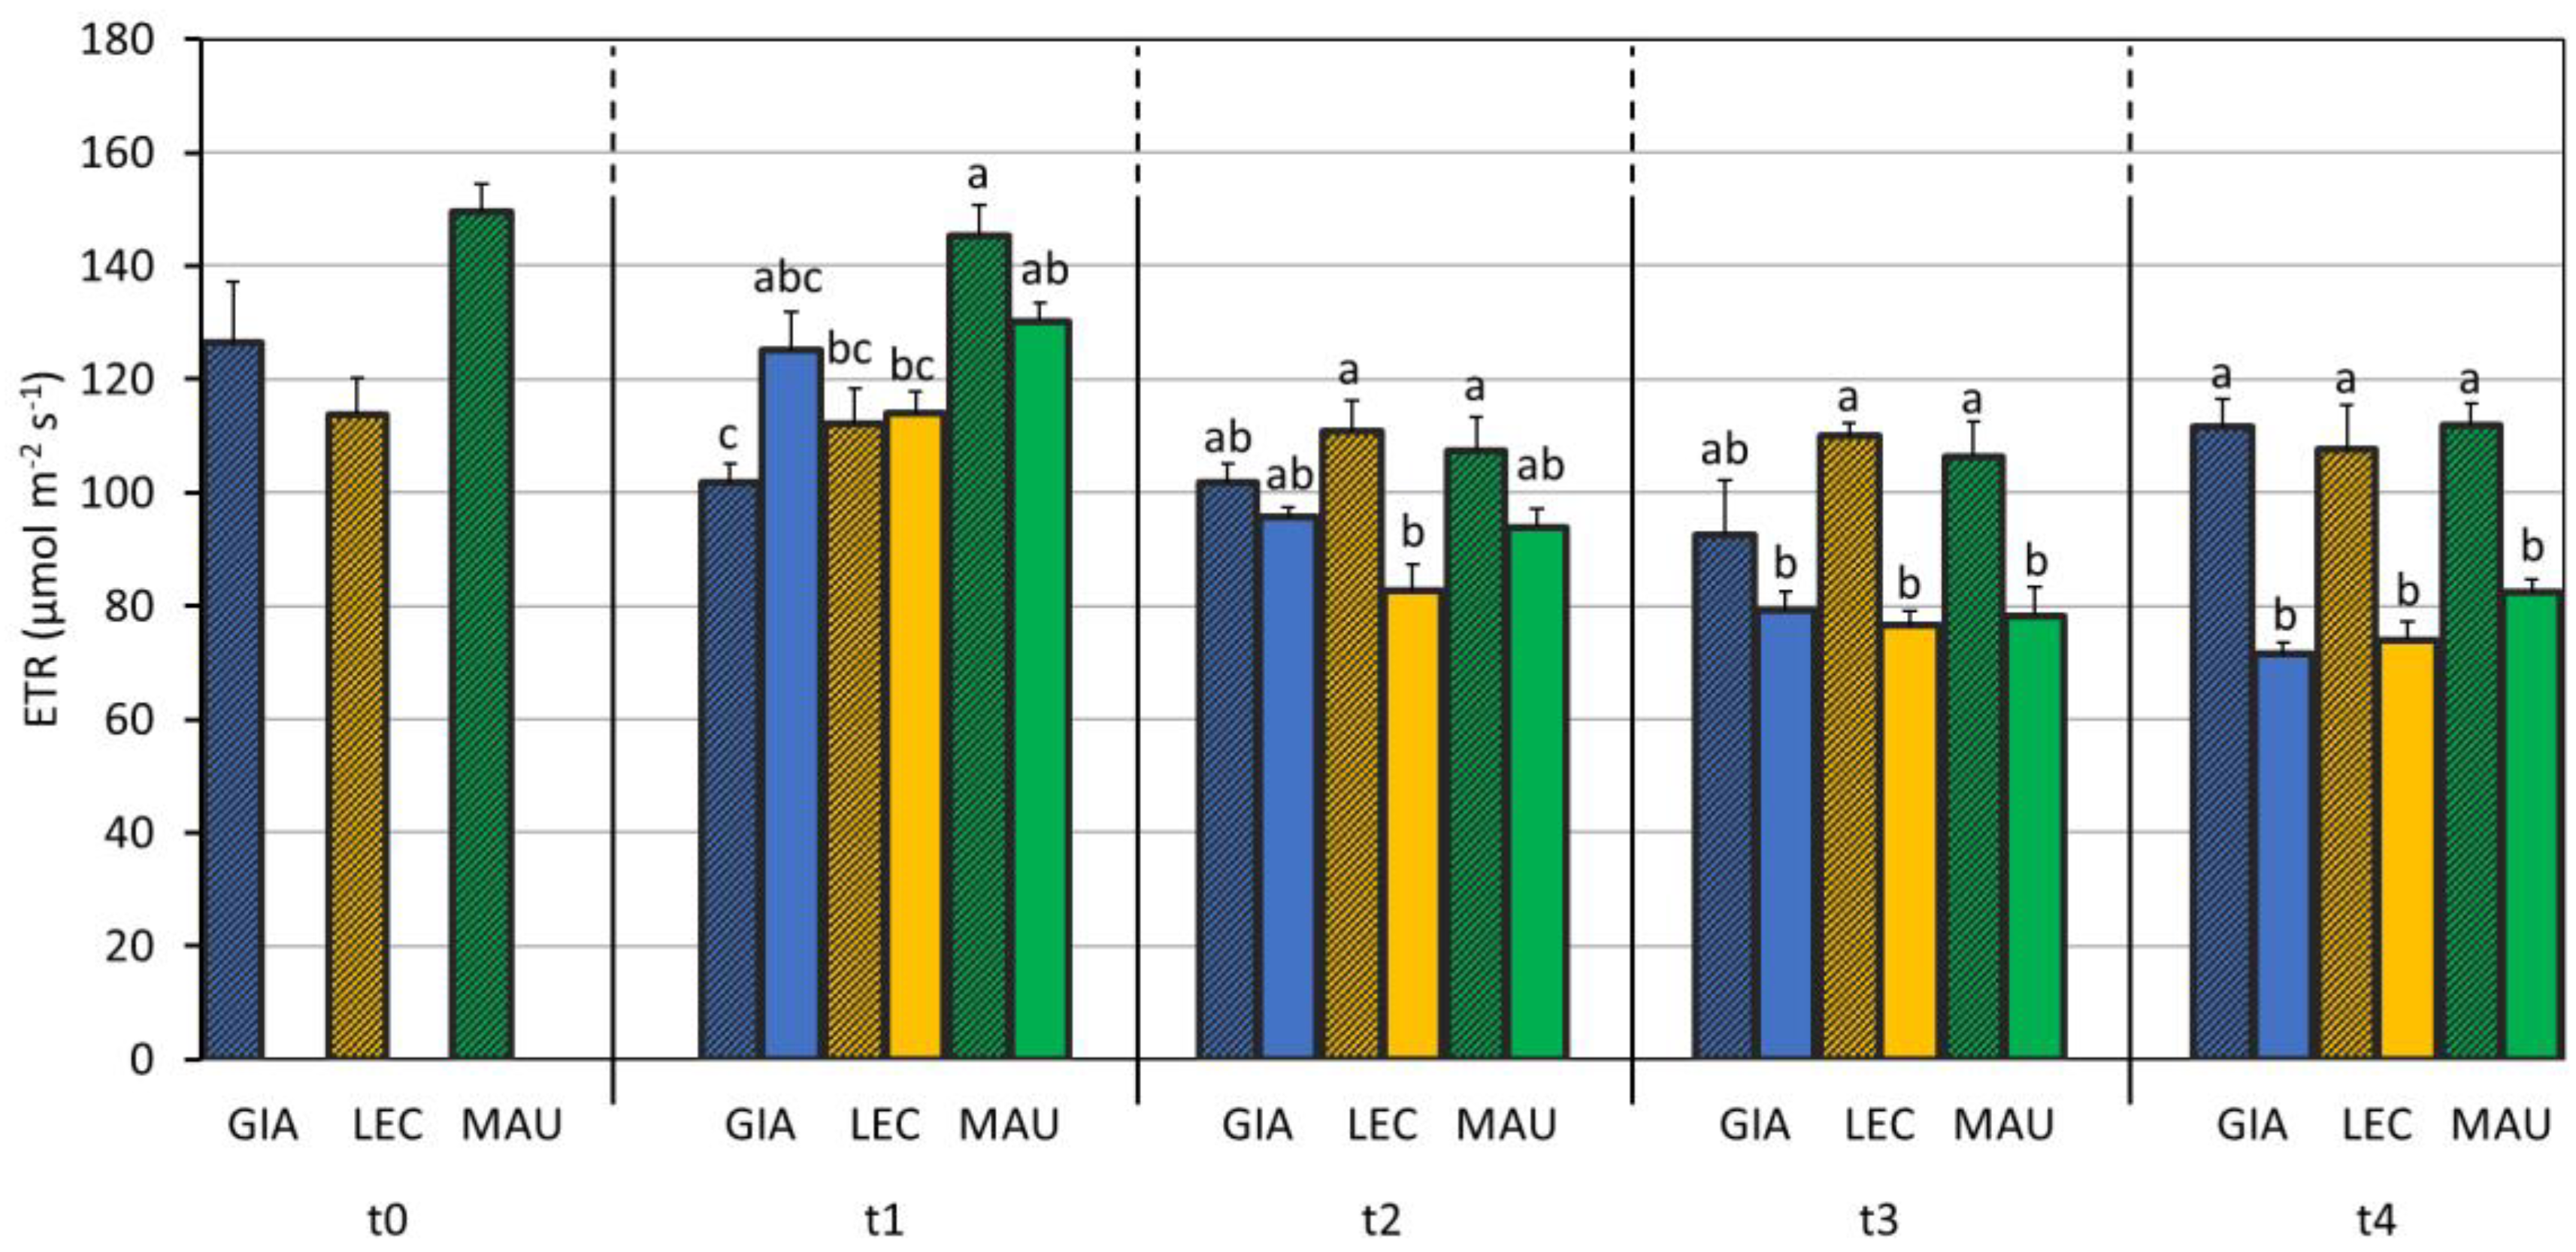
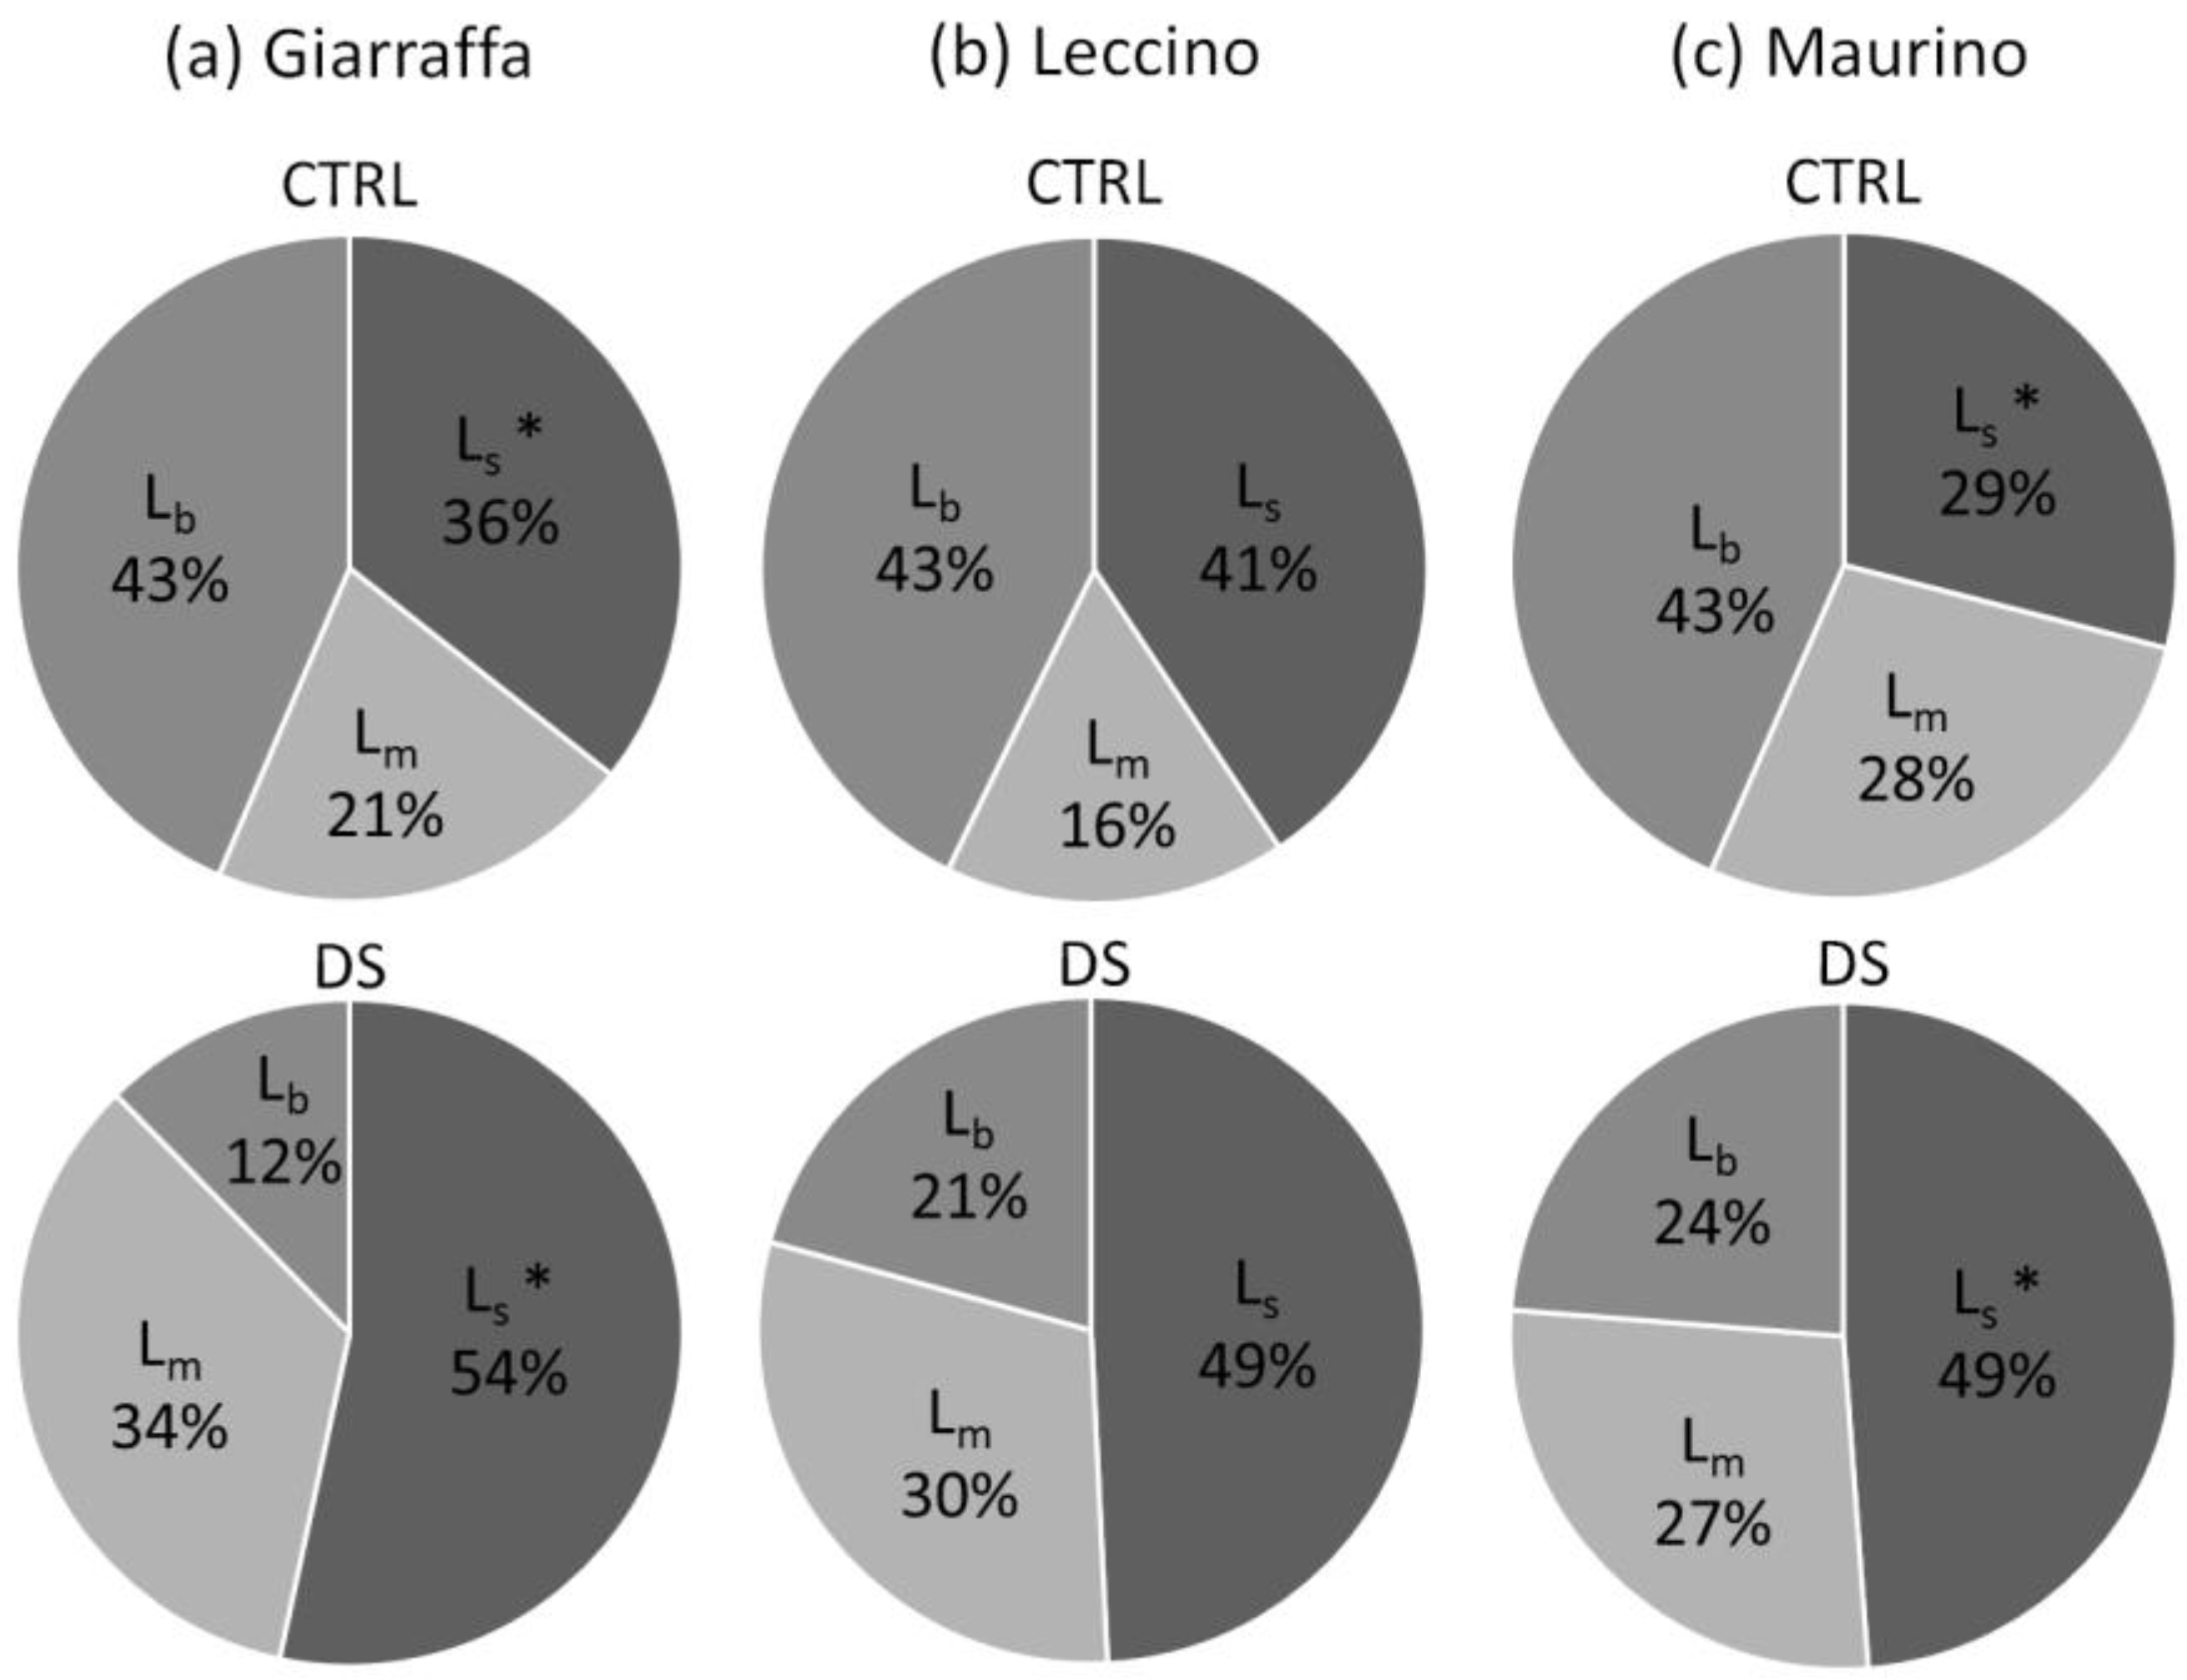
3.2. Impact of Water Deficit on the Photosynthetic Process
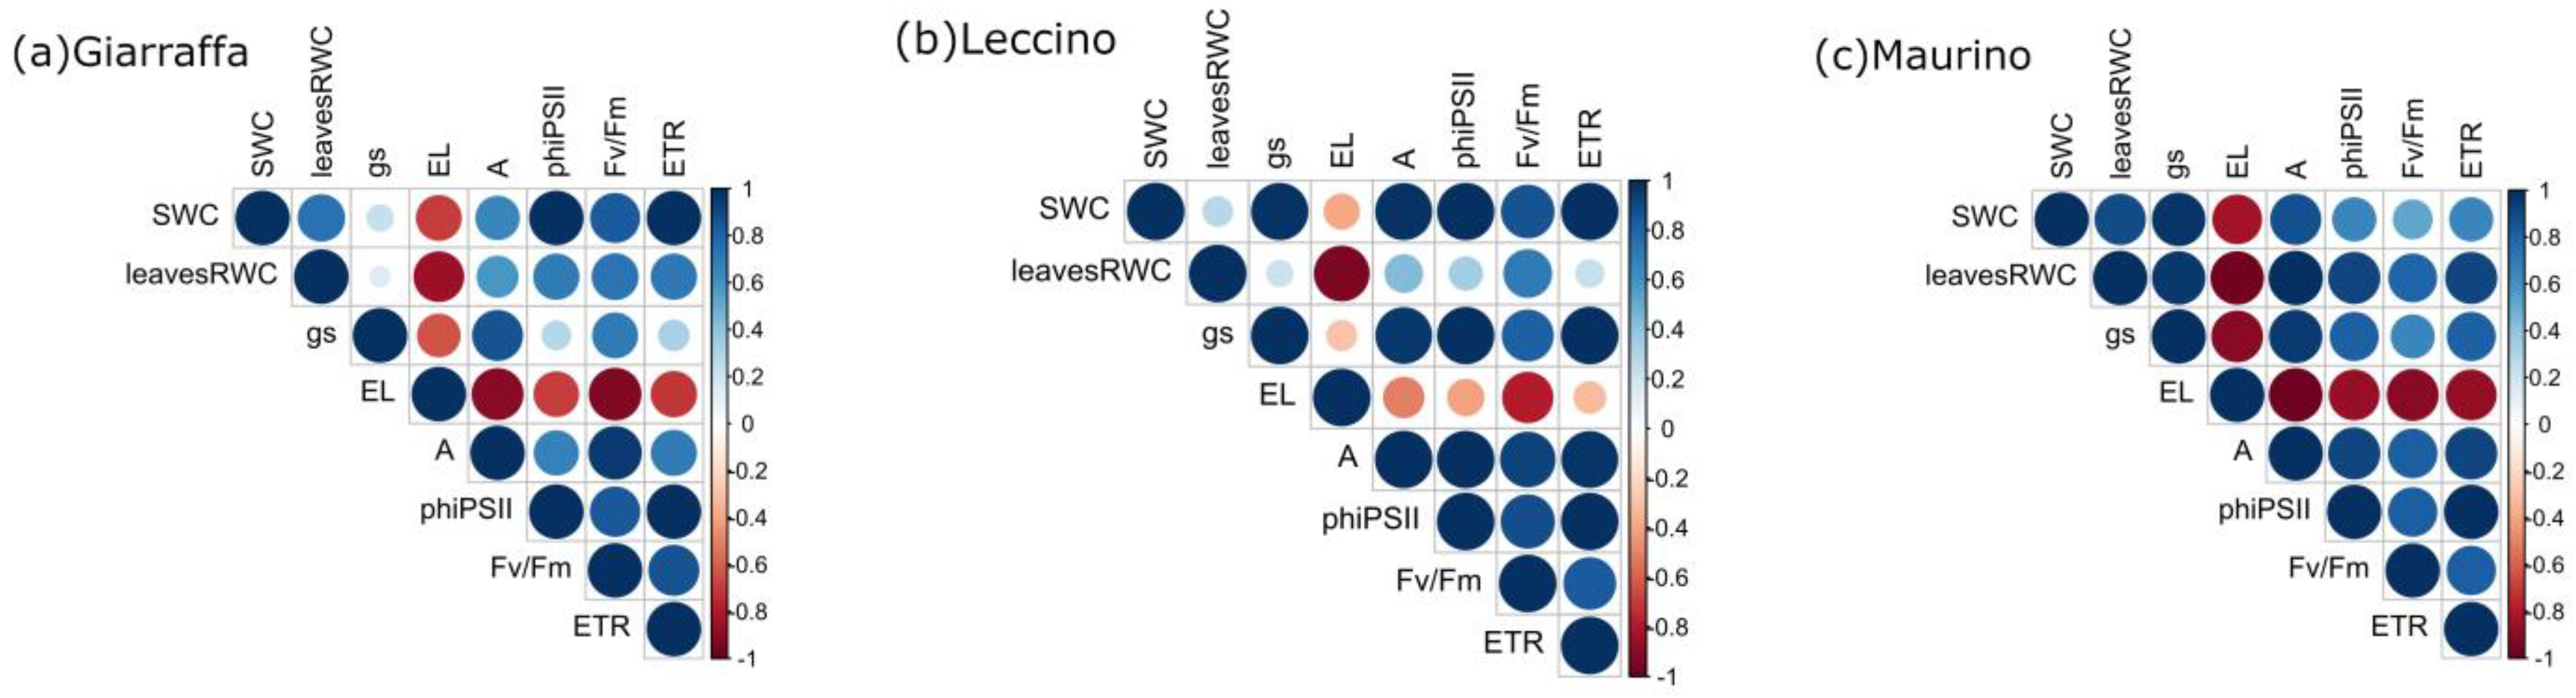
Table 2 shows the variability of ten photosynthetic parameters, as well as the significance of two factors (cultivar and treatment) and their mutual interaction, as determined via 2-way Repeated ANOVA. Like the previous section, only the data where the interaction between the cultivar and treatment (C × S) was significant are fully described.
As shown in Table 2, net CO2 assimilation (A) is significantly influenced by the cultivar, the drought, and their interaction. The cultivar Maurino showed a higher value of A than ‘Giarraffa’ and ‘Leccino’ did, even when comparing the control groups (Figure 5). Drought stress generally reduced A, but the earliest reduction occurred in ‘Giarraffa’ DS at t1. From t2, the stressed groups of all cultivars significantly differed from their respective controls.
Figure 6 shows the actual PSII efficiency. It was found that ΦPSII was affected by the cultivar, the drought stress, and their interaction (Table 2). The cultivar, Leccino, showed the first difference between the control and stressed groups at t1. From t2, the significant difference between the control and stressed groups appeared in the cultivar, Maurino. The ‘Giarraffa’ DS group value was significantly lower compared to its respective control one only at t4.
On the contrary, no differences among the cultivars were found for Fv/Fm. However, drought stress affected the maximum efficiency of PSII, but the cultivars behaved similarly in relation to the stress (C × S, p-value = 0.091). All the cultivars showed a decrease in Fv/Fm starting from t3, with the lowest values in the DS groups (0.68 for ‘Giarraffa’ DS, 0.69 for ‘Leccino’ DS, and 0.70 for ‘Maurino’ DS) at t4. A graph is available in the Supplementary Material (Figure S6).
Conversely, the cultivar (C), the drought stress (S) and their interaction (C × S) significantly affected the ETR (Table 2). As shown in Figure 7, drought stress slowed down the ETR of all the stressed groups, but ‘Leccino’ showed the first difference at t2 (‘Leccino’ CTRL 110.7 µmol m−2 s−1; ‘Leccino’ DS 82.6 µmol m−2 s−1, p < 0.01), when the stressed groups of the other two cultivars were still comparable to their respective controls. Significant differences between the CTRL and DS groups appeared in ‘Maurino’ at t3 and in ‘Giarraffa’ only at t4.
Unlike stomatal conductance, Table 2 shows that the mesophyll conductance exhibited no differences among the cultivars, even if a significant decrease in gm is determined by stress, resulting in 0.156 ± 0.058 mol m−2 s−1 in the controls and 0.087 ± 0.037 mol m−2 s−1 in the stressed groups. A graph containing gm values calculated at t0, t2, and t4 is available in the Supplementary Material (Figure S7).
As a result, drought stress significantly affected the stomatal (Ls), mesophyll conductance (Lm), and biochemical (Lb) limitations of photosynthesis at t2 (Table 2). Specifically, after two weeks of stress, the contribution of Ls and Lm was 16% and 9% higher, respectively, in the stressed groups compared to that in the control group, which occurred at the expense of biochemical limitation, which decreased. ‘Giarraffa’ and ‘Maurino’ showed a significant higher stomatal limitation in the stressed group compared to that of their respective controls, while the Ls values in the ‘Leccino’ DS and CTRL groups are similar, as shown in Figure 8. As suggested by the low biochemical limitation of the stressed groups, Vcmax and Jmax, the maximum carboxylation rate and the maximum electron transport rate, respectively, did not seem to be significantly affected by the stress treatment (Table 2). The data are plotted in the Supplementary Material (Figures S8 and S9).

3.3. Correlation

Figure 9 shows correlograms generated for each cultivar. When the cultivars were examined together, they gave very similar results. Firstly, there is a positive correlation between all the parameters, except EL. Therefore, the main difference is the magnitude of the correlation. Looking at the correlations between the water-related parameters (the SWC, the RWC, and gs), the cultivars behaved differently: the cultivar Maurino had the strongest positive correlation between all these parameters. ‘Leccino’ showed the same strong positive correlation between the SWC and gs, but the value was lower when the leaf RWC was correlated with the SWC and gs. In the cultivar, Giarraffa, the correlations of both leaf RWC and SWC with gs were weak, while that between the SWC and leaf RWC was stronger than it was in ‘Leccino’. Concerning the correlation between the water-related parameters and photosynthesis, ‘Maurino’ showed the strongest correlation between the SWC, leaf RWC, gs, and A. The same strong positive correlation was found between A and the SWC in ‘Leccino’. The correlations between the leaf RWC and A (in ‘Leccino’) and the leaf RWC, SWC, and A (in ‘Giarraffa’) are weaker. Moreover, ETR and ΦPSII were strongly positively correlated with gs in ‘Maurino’ and ‘Leccino’, while they were more positively correlated with the leaf RWC in ‘Giarraffa’.

4. Discussion

Olive trees are one of the most cultivated crops in the Mediterranean region and will face frequent droughts due to climate change. Understanding how water deficit affects olive cultivars differently will help us to select those that are best suited to future climate change [49]. This study examined the inter-varietal differences in drought stress responses among three olive cultivars in Italy (cultivars Maurino, Leccino, and Giarraffa). The main variables investigated were the plant–water relationship and photosynthetic traits. The analysis of relative water content revealed the distribution of water within plants, and physiological analysis aimed to show how drought affects photosynthesis light reactions.
The first basic variable we investigated was the amount of water in the soil, which could also indicate how well different plants absorb water through their roots. Indeed, after only one week of stress, the soil water content of all the stressed plants was half of that of the controls, indicating that the cultivars remove comparable amounts of water from the soil. This parameter could not distinguish between the cultivars, which is consistent with the findings of other studies. In the study by Oddo et al. [50], for example, the three Italian cultivars tested (cultivars Giarraffa, Biancolilla, and Nocellara del Belice) showed no significant differences, and the report indicates a 55% reduction from the value of the controls during the first week of stress. There were no discernible differences in the decrease in the SWC in plants stressed for two and three weeks compared to that of the plants stressed for one week. Melaouhi et al. [51] studied the response of two-year-old ‘Arbequina’ and ‘Empeltre’ cultivars to mild (30% field capacity) and severe (50% field capacity) stress and found that both treatments resulted in a significant reduction in the SWC, but no differences or interactions between cultivars or treatments and cultivars were observed. Using the SWC as a benchmark, the current study confirmed that drought stress had an equal impact on all the cultivar groups, with the severity directly related to the duration of the water shortage. Some differences emerge if the available water rather than the soil water content is considered. In other-than-soil media (such as peat and pumice used in this case), the available water in the pots is the difference between the volumetric soil water content determined at psi = −1 kPa and −10 kPa [52]. Data reported by Pardossi et al. [53] defined the range (57/39%) of the volumetric soil water content as the available water for peat: pumice 1:1. Considering the gravimetric soil water content of this study, we assume that the control groups of the three cultivars have the maximum amount of available water during the whole period. The stressed groups of ‘Leccino’ and ‘Maurino’ nearly wilted at t1, while ‘Giarraffa’ reached this state one week later. From t2 onwards, the water available to the stressed groups of all cultivars was very limited.
Although the cultivars retained a similar amount of water in the soil, they were consistently different in terms of transpiration. Firstly, each cultivar had a unique default stomatal density. This morphological difference is perfectly reflected in a different rates of stomatal conductance. The cultivar, Maurino, for example, has the highest stomatal density and the highest stomatal conductance, even when it is grown in well-watered conditions, which is followed by ‘Leccino’, and then ‘Giarraffa’, which has the lowest stomatal density and the earliest decrease in stomatal conductance. Oddo et al. [50], on the other hand, found that ‘Giarraffa’ retained high gs values after seven days of drought stress (0.4 mol m−2 s−1). In this case, ‘Maurino’ appeared to have stomatal characteristics that were less effective in preventing water loss than those of the controls of the other two cultivars, but this did not result in an overall lower leaf relative water content, except for at t2. As suggested by Bosabalidis and Kofidis [25], the higher stomatal density of ‘Maurino’ may allow the more precise regulation of transpiration. The drought tolerance of plants is generally associated with their ability to maintain a high leaf RWC under drought stress conditions [54]. Given that stomatal conductance regulates the plant water status [55], the simultaneous decrease in the RWC and gs in ‘Giarraffa’ at t1 results in a smaller difference between the stressed and control groups at t2 compared to that of the other two cultivars. On the contrary, in ‘Leccino’ and ‘Maurino’, stomatal conductance decreased one week later than the leaf RWC did, which is unlike what has been described by Boussadia et al. [56], Guerfel et al. [7], and Lawlor [9]. During periods of water scarcity, the stem could serve as a water reservoir [57]. At t2, however, the slightly higher water content in the stems of ‘Maurino’ under the control condition did not provide any support to counteract the RWC loss in the leaves at the same time point. The differences between cultivars in water-related parameters became apparent after one or two weeks of stress, but were completely lost as the stress level increased (at t3 and t4). Together with the tendency to maintain higher water contents, the rapid reduction in the stomatal conductance and the low stomatal density could allow ‘Giarraffa’ to use water resources more conservatively and make this cultivar interesting to researchers conducting future water management studies.
Water stress generally reduces stomatal conductance, which decreases the quantity of CO2 taken up by the leaves, limiting net carbon assimilation (A) [58], and thus, affecting plant growth. All the olive cultivars studied showed a decrease in parameter A, supporting the conclusion reached by Sofo et al. [59]. The authors of that case study looked at the cultivars, Biancolilla and Coratina, and found that ten days of total water depletion (roughly between t1 and t2 in the current study) resulted in a decrease in A of 11.8 to 3 mol m−2 s−1 and 14.1 to 1.1 mol m−2 s−1, respectively. In the current study, drought-stressed ‘Giarraffa’ showed an early decrease in A at t1, coinciding with stomatal closure (as indicated by the decrease in gs) and with a decrease in the leaf RWC. Instead, both ‘Leccino’ and ‘Maurino’ cultivars showed a delayed decrease in A compared to the timing of the decrease in the leaf RWC. Guerfel et al. [7] used the leaf water potential to assess the plant water status in two olive cultivars (‘Chemlai’ and ‘Chetoui’) subjected to 21 days of drought. They found a relationship between the leaf water potential and A (R2 0.96 for ‘Chemlai’ and 0.79 for ‘Chetoui’), which can be compared to the behaviour of the stressed group of ‘Giarraffa’. Mesophyll conductance is another important diffusive parameter that regulates the transfer of CO2 from sub-stomatal cavities to the chloroplasts within a leaf [58]. The reduction in gm was found to be associated with a decrease in A in drought-stressed plants, which played a crucial role in reducing CO2 availability in the mesophyll, as confirmed by a relative increase in mesophyll conductance limitation under water stress conditions. The underlying mechanisms involved in the regulation of gm under water stress conditions are not fully understood and deserve further investigation. However, previous studies have reported that gm may be affected by increasing abscisic acid (ABA) concentrations as the soil dries [12,60] or by changes in the leaf structure (such as cell wall thickness) as an acclimation response to the drought [61].
According to Grassi and Magnani [45], the contribution of stomatal, mesophyll conductance, and biochemical limitations can explain the decrease in net CO2 assimilation under drought stress. In this study, the limitations were calculated after two weeks of the drought study. The main factors limiting photosynthesis are stomatal and mesophyll conductance, confirming that diffusive limitations rather than biochemical impairments play a significant role under intermediate stress conditions [8,45]. In particular, water stress increased the overall contribution of the stomatal limitation to photosynthesis in stressed ‘Giarraffa’ and ‘Maurino’ plants at t2. The lack of a biochemical impairment was further demonstrated by the absence of any effects on the maximum electron transport rate (Jmax) and the maximum carboxylation capacity (Vcmax) at least up to t2, as found in drought-stressed Q. ilex by Hoshika et al. [12,62] and in salt-stressed olive trees by Centritto et al. [11]. Chlorophyll fluorescence parameters provide more information about the functionality of photosynthetic machinery during stress. The decrease in the ETR and ΦPSII observed in ‘Leccino’ at t2 anticipates the PSII impairment shown by the strong reduction in Fv/Fm at t3. The cultivar, Giarraffa, which shows decreases in the ETR and ΦPSII only at t4, seems to avoid a photosystem impairments thanks to the earlier decreases in gs and A [63]. The cultivar Maurino showed an intermediate pattern, revealing the first PSII impairments at t3.
Measuring the pigment levels can help assess the health of a plant and determine whether it is under abiotic stress [64]. Indeed, Dias et al. [27] found that the cultivars, Cobrancosa, Cordovil de Serpa, and Cordovil de Castelo Branco, showed a decrease in the chlorophyll and carotenoid contents, which are most likely due to oxidative stress damage under drought stress. However, no stress-related differences in the pigment content were observed in this study, indicating that pigment impairments were not present throughout the experiment. Marino et al. [65] found similar results: after a dry summer without irrigation, 10-year-old olive trees (‘Leccino’) showed no significant changes in the chlorophyll and carotenoid contents. In our case study, the lack of differences in lipid peroxidation between the control and stressed plants suggest that damage to the lipid bilayer of cell membranes does not occur in the early stages of drought stress. Since no lipid peroxidation was observed (at least until t2), the increase in EL may be due to a preliminary response of the plants to drought stress rather than cell damage. According to Demidchik et al. [66], EL is primarily caused by the efflux of K+ through specific channels activated by ROS. K+ release can cause programmed cell death (PCD) or decrease anabolism in favour of catabolic processes, resulting in energy release. All the cultivars studied increased their EL in response to stress, but ‘Maurino’ showed a stronger and faster response. The cultivar, Maurino, could theoretically achieve a faster EL response due to the increased water loss and transpiration rate, at least until t2. The rapid reduction of gas exchange as the SWC and RWC decreased has been shown to give an advantage to the defence of photosynthetic process under drought stress in ‘Giarraffa’, that even with a lower A compared to that of the control, maintained a higher electron transport rate and effective photosystem II efficiency until the last week of the stress study.

5. Conclusions

The conservation of biodiversity is becoming increasingly important in both natural and agricultural environments as climate change has a stronger impact on plants. The widely cultivated olive trees are represented by a broad range of cultivars, each with their own genetic background that may play a role in olive cultivar adaptation to various abiotic stresses such as drought. The three Italian olive cultivars tested in this study differed significantly in their responses to drought stress in growth chamber experiments; though, not all the parameters revealed significant differences. Some defence mechanisms are not used by any of the olive cultivars, whereas others are implemented first by a specific cultivar, resulting in an anticipatory and protective response. The data collected thus far suggest that Giarraffa is likely the most tolerant cultivar, but the molecular processes underlying this evidence are not fully understood. ‘Giarraffa’ showed the earliest stomatal response, but this is not the determining factor for a significantly better water saving capacity than that of the other cultivars. To summarise, the physiological results described here suggest that the genetic basis of water deficit responses may differ between olive cultivars and that specific genotypes (such as ‘Giarraffa’) may be used in breeding programmes to develop preferred cultivars for drought-prone regions. Taking into account both water-related parameters and photosynthesis, we suggest using fluorescent chlorophyll parameters (such as ΦPSII and ETR) as markers to discriminate the drought resistance of cultivars within large germplasm collections, and also, considering the ease with which these data can be collected for a high number of plants. However, the more precise cataloguing of drought-tolerant olive cultivars necessitates additional testing. We have already planned biochemical research to track proteins (such as dehydrins and osmotin) and molecules (such as proline) related to the water balance in the leaves and stems. These may provide a valid alternative to stomatal closure to conserve water during drought and will give a more accurate picture of the specific response of each cultivar.

Supplementary Materials

The following supporting information can be downloaded at: https://www.mdpi.com/article/10.3390/horticulturae9070830/s1. Figure S1: A/Ci and A/Cc curve; Figure S2: SWC; Figure S3: MDA; Figure S4: Chl a + b; Figure S5: Car; Figure S6: Fv/Fm; Figure S7: gm; Figure S8: Vcmax; Figure S9: Jmax.

Author Contributions

Conceptualization, S.P., M.R., G.C. and C.C.; methodology, S.P., M.R., M.C.D. and F.C.P.; data elaboration, S.P. and Y.H.; writing—original draft preparation, S.P.; writing—review and editing, A.G., Y.H., M.C.D., G.C. and C.C.; supervision, G.C. and C.C. All authors have read and agreed to the published version of the manuscript.

Funding

This research was funded by the European Union Next-GenerationEU (PIANO NAZIONALE DI RIPRESA E RESILIENZA (PNRR)—MISSIONE 4 COMPONENTE 2, INVESTIMENTO 1.4—MUR Notice No. 3138 of 16/12/2021, Directorial Decree of Granting of Funding No. 1032 of 17/06/2022, CN000022). This manuscript reflects only the authors’ views and opinions, neither the European Union nor the European Commission can be considered responsible for them.

Data Availability Statement

Data available on request due to restriction.

Acknowledgments

We thank the Tuscany Region for supporting the Ph.D. grant of S.P. in the framework of ‘Pegaso’—POR FSE TOSCANA 2014–2020 Program GiovaniSì. We also thank Caterina Margheriti, Laura Palma, Fabio Tullio, and Sonia Piattelli (University of Siena) for the highly appreciated technical assistance.

Conflicts of Interest

The authors declare no conflict of interest.

References

  1. Chaves, M.M.; Flexas, J.; Pinheiro, C. Photosynthesis under Drought and Salt Stress: Regulation Mechanisms from Whole Plant to Cell. Ann. Bot. 2009, 103, 551–560. [Google Scholar] [CrossRef] [PubMed] [Green Version]
  2. Vergni, L.; Todisco, F. Spatio-Temporal Variability of Precipitation, Temperature and Agricultural Drought Indices in Central Italy. Agric. For. Meteorol. 2011, 151, 301–313. [Google Scholar] [CrossRef]
  3. Douville, H.; Raghavan, K.; Renwick, J. Water Cycle Changes. In Climate Change 2021: The Physical Science Basis; Contribution of Working Group I to the Sixth Assessment Report of the IPCC; IPCC: Geneva, Switzerland, 2021; ISBN 978-1-00-915789-6. [Google Scholar]
  4. Brito, C.; Dinis, L.T.; Moutinho-Pereira, J.; Correia, C.M. Drought Stress Effects and Olive Tree Acclimation under a Changing Climate. Plants 2019, 8, 232. [Google Scholar] [CrossRef] [PubMed] [Green Version]
  5. Galmés, J.; Conesa, M.A.; Ochogavía, J.M.; Perdomo, J.A.; Francis, D.M.; Ribas-Carbó, M.; Savé, R.; Flexas, J.; Medrano, H.; Cifre, J. Physiological and Morphological Adaptations in Relation to Water Use Efficiency in Mediterranean Accessions of Solanum Lycopersicum. Plant Cell Environ. 2011, 34, 245–260. [Google Scholar] [CrossRef] [PubMed]
  6. El Yamani, M.; Sakar, E.H.; Boussakouran, A.; Rharrabti, Y. Physiological and Biochemical Responses of Young Olive Trees (Olea europaea L.) to Water Stress during Flowering. Arch. Biol. Sci. 2019, 71, 123–132. [Google Scholar] [CrossRef] [Green Version]
  7. Guerfel, M.; Baccouri, O.; Boujnah, D.; Chaïbi, W.; Zarrouk, M. Impacts of Water Stress on Gas Exchange, Water Relations, Chlorophyll Content and Leaf Structure in the Two Main Tunisian Olive (Olea europaea L.) Cultivars. Sci. Hortic. 2009, 119, 257–263. [Google Scholar] [CrossRef]
  8. Flexas, J.; Bota, J.; Loreto, F.; Cornic, G.; Sharkey, T.D. Diffusive and Metabolic Limitations to Photosynthesis under Drought and Salinity in C3 Plants. Plant Biol. 2004, 6, 269–279. [Google Scholar] [CrossRef]
  9. Lawlor, D.W. Limitation to Photosynthesis in Water-Stressed Leaves: Stomata vs. Metabolism and the Role of ATP. Ann. Bot. 2002, 89, 871–885. [Google Scholar] [CrossRef]
  10. Flexas, J.; Medrano, H. Drought-Inhibition of Photosynthesis in C3 Plants: Stomatal and Non-Stomatal Limitations Revisited. Ann. Bot. 2002, 89, 183–189. [Google Scholar] [CrossRef] [Green Version]
  11. Centritto, M.; Loreto, F.; Chartzoulakis, K. The Use of Low [CO2] to Estimate Diffusional and Non-Diffusional Limitations of Photosynthetic Capacity of Salt-Stressed Olive Saplings. Plant Cell Environ. 2003, 26, 585–594. [Google Scholar] [CrossRef]
  12. Hoshika, Y.; Paoletti, E.; Centritto, M.; Gomes, M.T.G.; Puértolas, J.; Haworth, M. Species-Specific Variation of Photosynthesis and Mesophyll Conductance to Ozone and Drought in Three Mediterranean Oaks. Physiol. Plant. 2022, 174, e13639. [Google Scholar] [CrossRef] [PubMed]
  13. Petridis, A.; Therios, I.; Samouris, G.; Koundouras, S.; Giannakoula, A. Effect of Water Deficit on Leaf Phenolic Composition, Gas Exchange, Oxidative Damage and Antioxidant Activity of Four Greek Olive (Olea europaea L.) Cultivars. Plant Physiol. Biochem. 2012, 60, 1–11. [Google Scholar] [CrossRef] [PubMed]
  14. Kitao, M.; Lei, T.T.; Koike, T.; Tobita, H.; Maruyama, Y. Susceptibility to Photoinhibition of Three Deciduous Broadleaf Tree Species with Different Successional Traits Raised under Various Light Regimes. Plant Cell Environ. 2000, 23, 81–89. [Google Scholar] [CrossRef]
  15. The World of Olive Oil. Available online: https://www.internationaloliveoil.org/the-world-of-olive-oil/ (accessed on 3 March 2023).
  16. FAOSTAT. Available online: https://www.fao.org/faostat/en/#data/QCL (accessed on 3 March 2023).
  17. Alba, V.; Montemurro, C.; Sabetta, W.; Pasqualone, A.; Blanco, A. SSR-Based Identification Key of Cultivars of Olea europaea L. Diffused in Southern-Italy. Sci. Hortic. 2009, 123, 11–16. [Google Scholar] [CrossRef]
  18. Albertini, E.; Torricelli, R.; Bitocchi, E.; Raggi, L.; Marconi, G.; Pollastri, L.; Di Minco, G.; Battistini, A.; Papa, R.; Veronesi, F. Structure of Genetic Diversity in Olea europaea L. Cultivars from Central Italy. Mol. Breed. 2011, 27, 533–547. [Google Scholar] [CrossRef]
  19. Muzzalupo, I.; Vendramin, G.G.; Chiappetta, A. Genetic Biodiversity of Italian Olives (Olea europaea) Germplasm Analyzed by SSR Markers. Sci. World J. 2014, 2014, e296590. [Google Scholar] [CrossRef] [PubMed] [Green Version]
  20. Diaz-Espejo, A.; Fernández, J.E.; Torres-Ruiz, J.M.; Rodriguez-Dominguez, C.M.; Perez-Martin, A.; Hernandez-Santana, V. The Olive Tree under Water Stress. In Water Scarcity and Sustainable Agriculture in Semiarid Environment: Tools, Strategies, and Challenges for Woody Crops; Academic Press: Cambridge, MA, USA, 2018; ISBN 978-0-12-813164-0. [Google Scholar]
  21. Piccini, C.; Cai, G.; Dias, M.C.; Araújo, M.; Parri, S.; Romi, M.; Faleri, C.; Cantini, C. Olive Varieties under Uv-b Stress Show Distinct Responses in Terms of Antioxidant Machinery and Isoform/Activity of Rubisco. Int. J. Mol. Sci. 2021, 22, 11214. [Google Scholar] [CrossRef]
  22. Rossi, L.; Francini, A.; Minnocci, A.; Sebastiani, L. Salt Stress Modifies Apoplastic Barriers in Olive (Olea europaea L.): A Comparison between a Salt-Tolerant and a Salt-Sensitive Cultivar. Sci. Hortic. 2015, 192, 38–46. [Google Scholar] [CrossRef]
  23. Fernández, J.E. Understanding Olive Adaptation to Abiotic Stresses as a Tool to Increase Crop Performance. Environ. Exp. Bot. 2014, 103, 158–179. [Google Scholar] [CrossRef] [Green Version]
  24. Carr, M.K.V. The Water Relations and Irrigation Requirements of Olive (Olea europaea L.): A Review. Exp. Agric. 2013, 49, 597–639. [Google Scholar] [CrossRef]
  25. Bosabalidis, A.M.; Kofidis, G. Comparative Effects of Drought Stress on Leaf Anatomy of Two Olive Cultivars. Plant Sci. 2002, 163, 375–379. [Google Scholar] [CrossRef]
  26. Sofo, A.; Dichio, B.; Xiloyannis, C.; Masia, A. Lipoxygenase Activity and Proline Accumulation in Leaves and Roots of Olive Trees in Response to Drought Stress. Physiol. Plant. 2004, 121, 58–65. [Google Scholar] [CrossRef] [PubMed]
  27. Dias, M.C.; Correia, S.; Serôdio, J.; Silva, A.M.S.; Freitas, H.; Santos, C. Chlorophyll Fluorescence and Oxidative Stress Endpoints to Discriminate Olive Cultivars Tolerance to Drought and Heat Episodes. Sci. Hortic. 2018, 231, 31–35. [Google Scholar] [CrossRef]
  28. Faraloni, C.; Cutino, I.; Petruccelli, R.; Leva, A.R.; Lazzeri, S.; Torzillo, G. Chlorophyll Fluorescence Technique as a Rapid Tool for in Vitro Screening of Olive Cultivars (Olea europaea L.) Tolerant to Drought Stress. Environ. Exp. Bot. 2011, 73, 49–56. [Google Scholar] [CrossRef]
  29. Pierantozzi, P.; Torres, M.; Bodoira, R.; Maestri, D. Water Relations, Biochemical—Physiological and Yield Responses of Olive Trees (Olea europaea L. Cvs. Arbequina and Manzanilla) under Drought Stress during the Pre-Flowering and Flowering Period. Agric. Water Manag. 2013, 125, 13–25. [Google Scholar] [CrossRef]
  30. de Pascali, M.; Vergine, M.; Sabella, E.; Aprile, A.; Nutricati, E.; Nicolì, F.; Buja, I.; Negro, C.; Miceli, A.; Rampino, P.; et al. Molecular Effects of Xylella Fastidiosa and Drought Combined Stress in Olive Trees. Plants 2019, 8, 437. [Google Scholar] [CrossRef] [Green Version]
  31. D’Agostino, N.; Taranto, F.; Camposeo, S.; Mangini, G.; Fanelli, V.; Gadaleta, S.; Miazzi, M.M.; Pavan, S.; di Rienzo, V.; Sabetta, W.; et al. GBS-Derived SNP Catalogue Unveiled Wide Genetic Variability and Geographical Relationships of Italian Olive Cultivars. Sci. Rep. 2018, 8, 15877. [Google Scholar] [CrossRef] [Green Version]
  32. Tosca, A.; Valagussa, M.; Martinetti, L.; Frangi, P. Biochar and Green Compost as Peat Alternatives in the Cultivation of Photinia and Olive Tree. Acta Hortic. 2021, 1305, 257–262. [Google Scholar] [CrossRef]
  33. Bilskie, J. Soil Water Status: Content and Potential; Campbell Scientific, Inc.: Logan, UT, USA, 2001; Available online: https://www.google.com/url?sa=t&rct=j&q=&esrc=s&source=web&cd=&ved=2ahUKEwjj_97LrZiAAxV5yAIHHVo3CJIQFnoECA4QAQ&url=https%3A%2F%2Fs.campbellsci.com%2Fdocuments%2Ffr%2Ftechnical-papers%2Fsoilh20c.pdf&usg=AOvVaw3jbEEwVoaHKEhJVP65Jm9a&opi=89978449 (accessed on 19 July 2023).
  34. Xu, Z.; Zhou, G. Responses of Leaf Stomatal Density to Water Status and Its Relationship with Photosynthesis in a Grass. J. Exp. Bot. 2008, 59, 3317–3325. [Google Scholar] [CrossRef] [Green Version]
  35. Diaz-Espejo, A.; Nicolás, E.; Fernández, J.E. Seasonal Evolution of Diffusional Limitations and Photosynthetic Capacity in Olive under Drought. Plant Cell Environ. 2007, 30, 922–933. [Google Scholar] [CrossRef]
  36. Rodriguez-Dominguez, C.M.; Buckley, T.N.; Egea, G.; de Cires, A.; Hernandez-Santana, V.; Martorell, S.; Diaz-Espejo, A. Most Stomatal Closure in Woody Species under Moderate Drought Can Be Explained by Stomatal Responses to Leaf Turgor. Plant Cell Environ. 2016, 39, 2014–2026. [Google Scholar] [CrossRef] [PubMed]
  37. Ethier, G.J.; Livingston, N.J. On the Need to Incorporate Sensitivity to CO2 Transfer Conductance into the Farquhar-von Caemmerer-Berry Leaf Photosynthesis Model. Plant Cell Environ. 2004, 27, 137–153. [Google Scholar] [CrossRef]
  38. Bernacchi, C.J.; Singsaas, E.L.; Pimentel, C.; Portis, A.R.; Long, S.P. Improved Temperature Response Functions for Models of Rubisco-Limited Photosynthesis. Glob. Change Biol. 2001, 21, 253–259. [Google Scholar] [CrossRef]
  39. Pons, T.L.; Flexas, J.; Von Caemmerer, S.; Evans, J.R.; Genty, B.; Ribas-Carbo, M.; Brugnoli, E. Estimating Mesophyll Conductance to CO2: Methodology, Potential Errors, and Recommendations. J. Exp. Bot. 2009, 60, 2217–2234. [Google Scholar] [CrossRef] [Green Version]
  40. Loreto, F.; Harley, P.C.; Marco, G.D.; Sharkey, T.D. Estimation of Mesophyll Conductance to CO2 Flux by Three Different Methods. Plant Physiol. 1992, 98, 1437–1443. [Google Scholar] [CrossRef] [PubMed] [Green Version]
  41. Marchi, S.; Guidotti, D.; Sebastiani, L.; Tognetti, R. Changes in Assimilation Capacity during Leaf Development in Broad- Leaved Prunus Persica and Sclerophyllous Olea europaea. J. Hortic. Sci. Biotechnol. 2007, 82, 69–78. [Google Scholar] [CrossRef] [Green Version]
  42. Galmés, J.; Flexas, J.; Keys, A.J.; Cifre, J.; Mitchell, R.A.C.; Madgwick, P.J.; Haslam, R.P.; Medrano, H.; Parry, M.A.J. Rubisco Specificity Factor Tends to Be Larger in Plant Species from Drier Habitats and in Species with Persistent Leaves. Plant Cell Environ. 2005, 28, 571–579. [Google Scholar] [CrossRef]
  43. Loriaux, S.D.; Avenson, T.J.; Welles, J.M.; Mcdermitt, D.K.; Eckles, R.D.; Riensche, B.; Genty, B. Closing in on Maximum Yield of Chlorophyll Fluorescence Using a Single Multiphase Flash of Sub-Saturating Intensity. Plant Cell Environ. 2013, 36, 1755–1770. [Google Scholar] [CrossRef]
  44. Gilbert, M.E.; Pou, A.; Zwieniecki, M.A.; Holbrook, N.M. On Measuring the Response of Mesophyll Conductance to Carbon Dioxide with the Variable J Method. J. Exp. Bot. 2012, 63, 413–425. [Google Scholar] [CrossRef] [Green Version]
  45. Grassi, G.; Magnani, F. Stomatal, Mesophyll Conductance and Biochemical Limitations to Photosynthesis as Affected by Drought and Leaf Ontogeny in Ash and Oak Trees. Plant Cell Environ. 2005, 28, 834–849. [Google Scholar] [CrossRef]
  46. Ben Abdallah, M.; Trupiano, D.; Polzella, A.; De Zio, E.; Sassi, M.; Scaloni, A.; Zarrouk, M.; Ben Youssef, N.; Scippa, G.S. Unraveling Physiological, Biochemical and Molecular Mechanisms Involved in Olive (Olea europaea L. Cv. Chétoui) Tolerance to Drought and Salt Stresses. J. Plant Physiol. 2018, 220, 83–95. [Google Scholar] [CrossRef] [PubMed]
  47. Hodges, D.M.; DeLong, J.M.; Forney, C.F.; Prange, R.K. Improving the Thiobarbituric Acid-Reactive-Substances Assay for Estimating Lipid Peroxidation in Plant Tissues Containing Anthocyanin and Other Interfering Compounds. Planta 1999, 207, 604–611. [Google Scholar] [CrossRef]
  48. Lichtenthaler, H.K. Chlorophylls and Carotenoids: Pigments of Photosynthetic Biomembranes. Methods Enzymol. 1987, 148, 350–382. [Google Scholar]
  49. Ennajeh, M.; Vadel, A.M.; Cochard, H.; Khemira, H. Comparative Impacts of Water Stress on the Leaf Anatomy of a Drought-Resistant and a Drought-Sensitive Olive Cultivar. J. Hortic. Sci. Biotechnol. 2010, 85, 289–294. [Google Scholar] [CrossRef]
  50. Oddo, E.; Virgilio, F.; Grisafi, F. Effects of Water Deficit on the Leaf Water Relations of Pot-Grown Olive Cultivars. Plant Stress 2008, 2, 56–63. [Google Scholar]
  51. Melaouhi, A.; Baraza, E.; Escalona, J.M.; El-AouOuad, H.; Mahjoub, I.; Bchir, A.; Braham, M.; Bota, J. Physiological and Biochemical Responses to Water Deficit and Recovery of Two Olive Cultivars (Olea europaea L., Arbequina and Empeltre Cvs.) under Mediterranean Conditions. Theor. Exp. Plant Physiol. 2021, 33, 369–383. [Google Scholar] [CrossRef]
  52. Pardossi, A.; Incrocci, L.; Incrocci, G.; Malorgio, F.; Battista, P.; Bacci, L.; Rapi, B.; Marzialetti, P.; Hemming, J.; Balendonck, J. Root Zone Sensors for Irrigation Management in Intensive Agriculture. Sensors 2009, 9, 2809–2835. [Google Scholar] [CrossRef] [Green Version]
  53. Pardossi, A.; Marzialetti, P.; Spe, C.V.; Bibbiani, C. I substrati e la coltivazione delle piante in contenitore. Fertilitas Agrorum 2009, 3, 22–31. [Google Scholar]
  54. Flower, D.J.; Ludlow, M.M. Contribution of Osmotic Adjustment to the Dehydration Tolerance of Water-Stressed Pigeon Pea (Cajanus cajan (L.) Millsp.) Leaves. Plant Cell Environ. 1986, 9, 33–40. [Google Scholar] [CrossRef]
  55. Jones, H.G.; Tardieu, F. Modelling Water Relations of Horticultural Crops: A Review. Sci. Hortic. 1998, 74, 21–46. [Google Scholar] [CrossRef]
  56. Boussadia, O.; Mariem, F.B.; Mechri, B.; Boussetta, W.; Braham, M.; Hadj, S.B.E. Response to Drought of Two Olive Tree Cultivars (Cv Koroneki and Meski). Sci. Hortic. 2008, 116, 388–393. [Google Scholar] [CrossRef]
  57. Traversari, S.; Francini, A.; Traversi, M.L.; Emiliani, G.; Sorce, C.; Sebastiani, L.; Giovannelli, A. Can Sugar Metabolism in the Cambial Region Explain the Water Deficit Tolerance in Poplar? J. Exp. Bot. 2018, 69, 4083–4097. [Google Scholar] [CrossRef] [PubMed]
  58. Larcher, W. Physiological Plant Ecology: Ecophysiology and Stress Physiology of Functional Groups; Springer Science & Business Media: Berlin/Heidelberg, Germany, 2003. [Google Scholar]
  59. Sofo, A.; Dichio, B.; Montanaro, G.; Xiloyannis, C. Photosynthetic Performance and Light Response of Two Olive Cultivars under Different Water and Light Regimes. Photosynthetica 2009, 47, 602–608. [Google Scholar] [CrossRef]
  60. Brunetti, C.; Gori, A.; Marino, G.; Latini, P.; Sobolev, A.P.; Nardini, A.; Haworth, M.; Giovannelli, A.; Capitani, D.; Loreto, F.; et al. Dynamic Changes in ABA Content in Water-Stressed Populus Nigra: Effects on Carbon Fixation and Soluble Carbohydrates. Ann. Bot. 2019, 124, 627–644. [Google Scholar] [CrossRef] [Green Version]
  61. Clemente-Moreno, M.J.; Gago, J.; Díaz-Vivancos, P.; Bernal, A.; Miedes, E.; Bresta, P.; Liakopoulos, G.; Fernie, A.R.; Hernández, J.A.; Flexas, J. The Apoplastic Antioxidant System and Altered Cell Wall Dynamics Influence Mesophyll Conductance and the Rate of Photosynthesis. Plant J. Cell Mol. Biol. 2019, 99, 1031–1046. [Google Scholar] [CrossRef] [PubMed] [Green Version]
  62. Hoshika, Y.; Fares, S.; Pellegrini, E.; Conte, A.; Paoletti, E. Water Use Strategy Affects Avoidance of Ozone Stress by Stomatal Closure in Mediterranean Trees—A Modelling Analysis. Plant Cell Environ. 2020, 43, 611–623. [Google Scholar] [CrossRef]
  63. Maxwell, K.; Johnson, G.N. Chlorophyll Fluorescence-a Practical Guide. J. Exp. Bot. 2000, 51, 659–668. [Google Scholar] [CrossRef]
  64. Jaleel, C.A.; Llorente, B.E. Drought Stress in Plants: A Review on Water Relations. Biosci. Res. 2009, 6, 20–27. [Google Scholar]
  65. Marino, G.; Pallozzi, E.; Cocozza, C.; Tognetti, R.; Giovannelli, A.; Cantini, C.; Centritto, M. Assessing Gas Exchange, Sap Flow and Water Relations Using Tree Canopy Spectral Reflectance Indices in Irrigated and Rainfed Olea europaea L. Environ. Exp. Bot. 2014, 99, 43–52. [Google Scholar] [CrossRef]
  66. Demidchik, V.; Straltsova, D.; Medvedev, S.S.; Pozhvanov, G.A.; Sokolik, A.; Yurin, V. Stress-Induced Electrolyte Leakage: The Role of K+-Permeable Channels and Involvement in Programmed Cell Death and Metabolic Adjustment. J. Exp. Bot. 2014, 65, 1259–1270. [Google Scholar] [CrossRef]
Figure 1. Leaf relative water content (leaf RWC) measured in control and drought olive cultivars from t0 to t4. At t0, the stressed and control samples were still one group. The bars represent mean ± standard error. Values for ‘Giarraffa’ (GIA) are blue, ‘Leccino’ (LEC) values are orange, and ‘Maurino’ (MAU) values are green. Striped bars indicate control samples. For each time point, different letters denote statistical significance (p-value < 0.01) according to Tukey’s multiple post hoc tests considering both cultivar and treatment.
Horticulturae 09 00830 g001
Figure 2. Stem relative water content (stem RWC) measured in control and drought olive cultivars analysed at t0, t2, and t4. At t0, the stressed and control samples were still one group. The bars represent mean ± standard error. Values for ‘Giarraffa’ (GIA) are blue, ‘Leccino’ (LEC) values are orange, and ‘Maurino’ (MAU) values are green. Striped bars indicate control samples. For each time point, different letters denote statistical significance (p-value < 0.01) according to Tukey’s multiple post hoc tests considering both cultivar and treatment. MAU values at t4 are not shown due to technical problems.
Horticulturae 09 00830 g002
Figure 3. Stomatal conductance (gs) in control and drought-stressed olive cultivars from t0 to t4. At t0, the stressed and control samples were still one group. The bars represent mean ± standard error. The values for ‘Giarraffa’ (GIA) are blue, those for ‘Leccino’ (LEC) are orange, and ‘Maurino’ (MAU) values are green. Strip bars refer to control samples. Within each time point, different letters denote statistical significance (p-value < 0.01) according to Tukey’s multiple post hoc tests considering both cultivar and treatment.
Horticulturae 09 00830 g003
Figure 4. Electrolyte leakage (EL) in control and drought-stressed olive cultivars from t0 to t4. At t0, the stressed and control samples were still one group. The bars represent mean ± standard error. The values for ‘Giarraffa’ (GIA) are in blue, those for ‘Leccino’ (LEC) are orange, and ‘Maurino’ (MAU) values are green. Strip bars refer to control samples. Within each time point, different letters denote statistical significance (p-value < 0.01) according to Tukey’s multiple post hoc tests considering both cultivar and treatment.
Horticulturae 09 00830 g004
Figure 5. Net CO2 assimilation (A) in control and drought-stressed olive cultivars from t0 to t4. At t0, the stressed and control samples were still one group. The bars represent mean ± standard error. The values for ‘Giarraffa’ (GIA) are in blue, those for ‘Leccino’ (LEC) are orange, and ‘Maurino’ (MAU) values are green. Strip bars refer to control samples. Within each time point, different letters denote statistical significance (p-value < 0.01) according to Tukey’s multiple post hoc tests considering both cultivar and treatment.
Horticulturae 09 00830 g005
Figure 6. Effective efficiency of PSII (ΦPSII) in control and drought-stressed olive cultivars from t0 to t4. At t0, the stressed and control samples were still one group. The bars represent mean ± standard error. The values for ‘Giarraffa’ (GIA) are blue, those for ‘Leccino’ (LEC) are orange, and ‘Maurino’ (MAU) values are green. Strip bars refer to control samples. Within each time point, different letters denote statistical significance (p-value < 0.01) according to Tukey’s multiple post hoc tests considering both cultivar and treatment.
Horticulturae 09 00830 g006
Figure 7. Electron transport rate (ETR) in control and drought-stressed olive cultivars from t0 to t4. At t0, the stressed and control samples were still one group. The bars represent mean ± standard error. The values for ‘Giarraffa’ (GIA) are blue, those for ‘Leccino’ (LEC) are orange, and ‘Maurino’ (MAU) values are green. Strip bars refer to control samples. Within each time point, different letters denote statistical significance (p-value < 0.01) according to Tukey’s multiple post hoc tests considering both cultivar and treatment.
Horticulturae 09 00830 g007
Figure 8. Percentages of stomatal limitation (Ls), mesophyll diffusion resistance (Lm), and biochemical limitation (Lb) on photosynthetic process in control and drought-stressed olive cultivars, calculated for ‘Giarraffa’ (a), ‘Leccino’ (b), and ‘Maurino’ (c) at t2. The percentages shown for each group are the means of five values calculated independently for each limitation (Ls, Lm, and Lb). The asterisks (*) denote statistical significance (p-value < 0.01) according to Tukey’s multiple post hoc test. Only the significant difference between control and stressed samples of the same cultivar is highlighted.
Horticulturae 09 00830 g008
Figure 9. Correlogram of the 8 parameters evaluated at each time point in ‘Giarraffa’ (a), ‘Leccino’ (b), and ‘Maurino’ (c). Each parameter is expressed as the ratio of the DS group to the CTRL group value at each time point and correlates to the time course (t1, t2, t3, and t4). The size of the dots corresponds to the value of the correlation coefficient according to the right-positioned scale, while the colour indicates the direction of change (blue for positive correlation; red for negative correlation).
Horticulturae 09 00830 g009
Table 1. The effects of factors “cultivar” (C), “treatment” (S), and their interaction (C × S), as well as their statistical significance, on the following parameters: soil water content (SWC), relative water content of leaves (leaf RWC) and stems (stem RWC), stomatal density (SD), stomatal conductance (gs), electrolyte leakage (EL), lipid peroxidation (as measured by malondialdehyde content, MDA), photosynthetic pigments content of chlorophyll a and b (Chl a + b), and carotenoids (Car). Each value represents the mean ± standard deviation. Different superscripts indicate statistical differences (p < 0.05).
SWC
(%)
Leaf RWC
(%)
Stem RWC
(%)
SD
(n./mm2)
gs
(mol m−2 s−1)
EL
(%)
MDA
(mmol/kg DW)
Chl a + b
(µg/mg DW)
Car
(µg/mg DW)
Cultivar (C)
Giarraffa89 ± 52 a64.0 ± 16.169.2 ± 17.934.4 ± 7.6 c0.086 ± 0.039 b26.3 ± 12.5 b5.28 ± 0.98 b3.93 ± 0.820.70 ± 0.15
Leccino76 ± 50 b60.5 ± 15.166.7 ± 17.038.4 ± 5.0 b0.070 ± 0.040 c27.4 ± 13.3 b3.78 ± 0.50 c3.66 ± 0.710.65 ± 0.13
Maurino76 ± 49 b61.3 ± 17.669.4 ± 20.048.4 ± 5.4 a0.112 ± 0.051 a37.7 ± 21.1 a7.26 ± 1.33 a3.49 ± 1.930.63 ± 0.32
p-value0.0140.0800.051<0.001<0.001<0.001<0.0010.8370.649
Treatment (S)
CTRL117 ± 26 a82.0 ± 8.6 a88.0 ± 2.1 a40.1 ± 9.30.119 ± 0.037 a21.9 ± 4.8 b4.93 ± 1.67 b3.43 ± 1.170.61 ± 0.19
DS26 ± 21 b50.9 ± 10.8 b64.4 ± 9.8 b40.7 ± 7.60.052 ± 0.029 b41.2 ± 20.1 a5.94 ± 1.72 a4.10 ± 1.310.73 ± 0.23
p-value<0.001<0.001<0.0010.203<0.001<0.0010.0040.1160.143
C × S
p-value0.7150.0410.001<0.001<0.001<0.0010.4220.6360.824
Table 2. Effects of the factors “cultivar” (C), “treatment” (S), and their interaction (C × S), and their statistical significance on the following parameters: net photosynthetic rate (A), effective efficiency of photosystem II (Φ PSII), maximum efficiency of photosystem II (Fv/Fm), electron transport rate (ETR), mesophyll conductance (gm), stomatal limitation (Ls), mesophyll conductance limitation (Lm), biochemical limitation (Lb), maximum rate of carboxylation (Vcmax), and maximum electron transport rate (Jmax). Each value is the mean ± standard deviation. Different superscripts indicate statistical differences (p < 0.05).
A
(µmol m−2 s−1)
Φ PSIIFv/FmETR
(µmol m−2 s−1)
gm
(mol m−2 s−1)
Ls
(%)
Lm
(%)
Lb
(%)
Vcmax
(µmol m−2 s−1)
Jmax
(µmol m−2 s−1)
Cultivar (C)
Giarraffa7.79 ± 3.87 b0.149 ± 0.032 b0.797 ± 0.048100.6 ± 21.5 b0.110 ± 0.04344.5 ± 10.7 a27.5 ± 10.428.0 ± 17.957.1 ± 13.474.9 ± 16.2 ab
Leccino7.14 ± 3.78 b0.154 ± 0.034 ab0.797 ± 0.055100.1 ± 19.3 b0.139 ± 0.07743.9 ± 5.2 ab21.6 ± 8.034.5 ± 12.755.8 ± 12.187.4 ± 13.4 a
Maurino10.66 ± 5.48 a0.166 ± 0.039 a0.800 ± 0.047111.7 ± 26.1 a0.112 ± 0.05338.9 ± 11.6 b27.5 ± 11.133.6 ± 14.749.1 ± 23.068.8 ± 19.4 b
p-value<0.001<0.0010.860<0.0010.0610.0260.2950.1960.5200.054
Treatment (S)
CTRL11.38 ± 3.40 a0.172 ± 0.031 a0.823 ± 0.010 a113.9 ± 19.6 a0.156 ± 0.058 a34.8 ± 6.1 b21.9 ± 6.9 b43.3 ± 6.1 a52.8 ± 12.476.2 ± 17.9
DS4.96 ± 3.46 b0.137 ± 0.031 b0.768 ± 0.061 b91.9 ± 21.1 b0.087 ± 0.037 b50.7 ± 6.2 a30.7 ± 11.4 a18.6 ± 11.5 b54.9 ± 21.975.2 ± 18.6
p-value<0.001<0.001<0.001<0.001<0.001<0.0010.015<0.0010.7060.945
C × S
p-value<0.0010.0010.0910.0340.7320.0670.1400.2710.4190.058
Disclaimer/Publisher’s Note: The statements, opinions and data contained in all publications are solely those of the individual author(s) and contributor(s) and not of MDPI and/or the editor(s). MDPI and/or the editor(s) disclaim responsibility for any injury to people or property resulting from any ideas, methods, instructions or products referred to in the content.

